Simulations of bone remodeling at the cellular scale the lazy zone, the ambivalent zone, and lining...
114
Simulations of bone remodeling at the cellular scale
Transcript of Simulations of bone remodeling at the cellular scale the lazy zone, the ambivalent zone, and lining...
Simulations of bone remodeling at the cellular scale

A catalogue record is available from the Eindhoven University of Technology Library. ISBN: 978-90-386-2256-9 Copyright © 2010 by R.F.M. van Oers Printed by: Universiteitsdrukkerij Technische Universiteit Eindhoven This work was supported by the Netherlands Organization for Scientific Research, section Computational Life Sciences (NWO/CLS, grant number 635.100.014).

Simulations of bone remodeling at the cellular scale
PROEFSCHRIFT ter verkrijging van de graad van doctor aan de Technische Universiteit Eindhoven, op gezag van de rector magnificus, prof.dr.ir. C.J. van Duijn, voor een commissie aangewezen door het College voor Promoties in het openbaar te verdedigen op woensdag 9 juni 2010 om 16.00 uur door René Franciscus Maria van Oers geboren te Meijel

Dit proefschrift is goedgekeurd door de promotoren: prof.dr. P.A.J. Hilbers en prof.dr.ir. R. Huiskes Copromotor: dr.ir. B. van Rietbergen
Contents
Chapter 1: Introduction 1
Bone structure 2 Bone cells 3 The Basic Multicellular Unit 4 Computer simulation models by Huiskes and coworkers 6 Outline of this thesis 7
Chapter 2: A unified theory for osteonal and hemi-osteonal remodeling 9
Introduction 10 Methods: the model 11 Methods: the simulations 13 Results 14 Discussion 17 Appendix A: osteoclast cell model 19 Appendix B: parameter settings 22 Supplement A: controlling osteoclast shape 26
Chapter 3: Relating osteon diameter to strain 29
Introduction 30 Methods: the model 32 Methods: the simulations 35 Results 35 Discussion 38
Chapter 4: 3D Simulation of remodeling at the level of the cell and its deregulation in disuse 43
Introduction 44 Methods: the model 45 Methods: the simulations 46 Results 47 Discussion 48 Appendix A: osteoclast cell model 50
Chapter 5: Simulations of trabecular remodeling and fatigue: is remodeling helpful or harmful? 53
Introduction 54 Methods: the model 55 Methods: the simulations 57 Results 58 Discussion 60 Appendix A. Damage per loading cycle. 62
Chapter 6: A sclerostin-based theory for strain-induced bone formation 65
Introduction 66 Methods: the model 67
Methods: the simulations 70 Results 71 Discussion 73 Appendix A: discretization effect in the inhibitory model 75 Supplement A: Influence of parameters in the sclerostin model 76
Chapter 7: General discussion 81
Main findings 82 Limitations 83 Thoughts on osteoclast-attracting signals 84 Thoughts on RANKL and OPG 84 On the use of strain-energy-density 85 On the exponential signal-decrease function 85 On the lazy zone, the ambivalent zone, and lining cells 86 Alternative hypotheses on osteon diameter 87 More on drifting osteons 88 Future directions 89
References 91
Summary 99
Samenvatting 101
Dankwoord 103
Curriculum vitae 105
List of publications 107

1
Chapter 1
Introduction

Chapter 1
2
Bone is meant to carry load. It is therefore no surprise that the influence of mecha-nical loads is easily recognized in its design, just as it is easily recognized in the design of a bridge. But whereas the construction workers on a bridge receive instructions from a supervising engineer, the cells that remodel bone have to figure it out all by themselves. They cannot oversee the whole structure, nor do they know beforehand how the adding or removing of bone at a particular spot affects the load transfer through the structure. However, if they could get information about the mechanical strain at that spot, they might be able to decide if it is wise to add or remove bone there. It is believed that they get such information from the osteo-cytes, which are basically very dedicated construction workers that let themselves be walled up in the bone. Being fed through small tubes, they remain alive within the bone, and keep informing the construction workers at the surface how the structure is holding up. That is the hypothesis, but it is hard to validate. It is nearly impossible to measure the strains at the cell level within the living bone, and simultaneously measure the biochemical signals that these cells send each other, and continue to do so over the course of months, as new bone structures are being formed. Our approach is to use computer simulation models. These models calculate the load transfer through a bone structure (engineers use similar models to calculate strains in bridges), and translate local strains into the hypothesized signals. Cells at the bone surface act on these signals by adding or removing small portions of bone. This changes the load transfer, so the strains are calculated again, and translated into new remodeling actions. By repeating this process often enough we can simulate bone remodeling events that take months in real bone, and investigate if the hypothesized mechanisms produce realistic bone structures. Such analyses may provide valuable insights for the cell biologists that investigate the signalling pathways between bone cells. Let us first introduce the details of bone architecture, the cells that are its construction workers, and how these cells cooperate to remodel bone. Then we provide a short outline, as we discuss how our questions about this remodeling process lead to the various studies that make up this thesis.
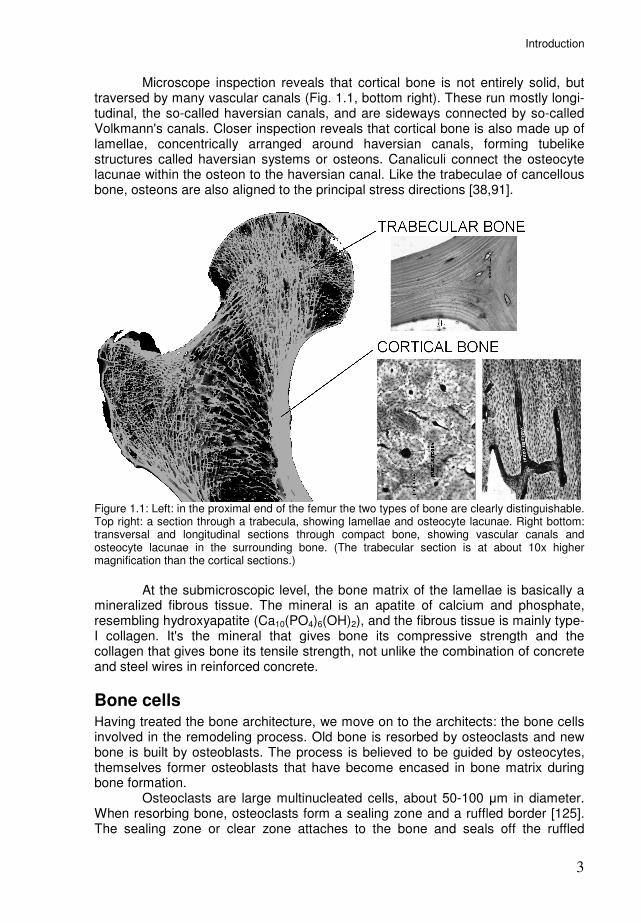
Bone structure Two forms of bone can be distinguished with the naked eye (Fig. 1.1, left). The thick outer shell (cortex) of bones appears to be made of a solid type of bone, known as cortical or compact bone. On the inside we find a porous type of bone, known as trabecular, cancellous, or spongy bone. It is made up of many branching struts called trabeculae. The spaces among the trabeculae are filled by bone marrow. Already in 1892 Julius Wolff [136] noticed that trabeculae were aligned to stress trajectories, and suggested that bone has a way of adapting to mechanical loading. If a section of a trabecula is examined with the microscope (Fig. 1.1, top right), we can see that the bone ist deposited in layers or lamellae 3 to 7 µm thick. We also see cavities or lacunae of about 10 µm, each filled by a bone cell or osteocyte. At a higher magnification minute channels (order 0.5 µm in diameter [61]) called canaliculi become visible, that extend from each lacuna to other lacunae and the surface of the trabecula. The canaliculi are believed to be essential to the nutrition of the bone cells.
Introduction
3
Microscope inspection reveals that cortical bone is not entirely solid, but traversed by many vascular canals (Fig. 1.1, bottom right). These run mostly longi-tudinal, the so-called haversian canals, and are sideways connected by so-called Volkmann's canals. Closer inspection reveals that cortical bone is also made up of lamellae, concentrically arranged around haversian canals, forming tubelike structures called haversian systems or osteons. Canaliculi connect the osteocyte lacunae within the osteon to the haversian canal. Like the trabeculae of cancellous bone, osteons are also aligned to the principal stress directions [38,91].
Figure 1.1: Left: in the proximal end of the femur the two types of bone are clearly distinguishable. Top right: a section through a trabecula, showing lamellae and osteocyte lacunae. Right bottom: transversal and longitudinal sections through compact bone, showing vascular canals and osteocyte lacunae in the surrounding bone. (The trabecular section is at about 10x higher magnification than the cortical sections.)
At the submicroscopic level, the bone matrix of the lamellae is basically a mineralized fibrous tissue. The mineral is an apatite of calcium and phosphate, resembling hydroxyapatite (Ca10(PO4)6(OH)2), and the fibrous tissue is mainly type-I collagen. It's the mineral that gives bone its compressive strength and the collagen that gives bone its tensile strength, not unlike the combination of concrete and steel wires in reinforced concrete.
Bone cells Having treated the bone architecture, we move on to the architects: the bone cells involved in the remodeling process. Old bone is resorbed by osteoclasts and new bone is built by osteoblasts. The process is believed to be guided by osteocytes, themselves former osteoblasts that have become encased in bone matrix during bone formation. Osteoclasts are large multinucleated cells, about 50-100 µm in diameter. When resorbing bone, osteoclasts form a sealing zone and a ruffled border [125]. The sealing zone or clear zone attaches to the bone and seals off the ruffled
Chapter 1
4
border, from which acid and lysosomal proteases are secreted. The acid dissolves the bone mineral and the proteases degrade the organic matrix. In this way osteoclasts are capable of tunneling deep into the bone. Osteoclasts are derived from hematopoietic stem cells. These differentiate into mononuclear osteoclasts, which adhere tightly to bone, and fuse with each other to form multinucleated osteoclasts [77]. After fusion, the nuclei have a mean lifespan of only 12.5 days [46], but they are replaced by the random fusion of new pre-osteoclasts. The osteoclast comes to an end when the local supply of preosteoclasts is turned off, but also when it detaches from the bone surface, since pre-osteoclasts only fuse with attached osteoclasts [33]. Osteoblasts are bone-forming cells derived from mesenchymal stem cells. They are found as a cluster of cubic cells along the bone surface, where they produce large quantities of type I collagen and some other matrix proteins. This freshly formed material called osteoid is still unmineralized, but will mineralize within about 10 days as calcium phosphate crystals appear, taking space previously occupied by water. Some of the osteoblasts are embedded in the osteoid to become osteocytes. As the formation site develops, the osteoblasts on the surface become flatter and they change into bone lining cells or die by apoptosis [89]. Osteocytes remain in contact with the cells on the bone surface via cyto-plasmic processes that are connected via gap junctions. The matrix immediately around the osteocyte cell body and processes does not mineralize, thus forming the network of lacunae and canaliculi. Osteocytes are believed to serve as mechanosensors because of their strategic location in the lacuno-canalicular network [9,22], and because they show a metabolic response to bone strains [107,53]. They are also believed to serve as damage sensors, as it appears that microdamage induces osteocyte apoptosis and that subsequent resorption coincides with these apoptotic regions [4,130]. Bone lining cells are basically inactive osteoblasts that cover bone surfaces. They have a flatter, more extended shape than active osteoblasts, but are still connected to the osteocytes via cytoplasmic processes. Between the lining cells and the bone is a thin layer of osteoid, the endosteal membrane or lamina limitans [89], which presents an obstacle to resorption, as bone mineral seems essential for osteoclast adhesion [124]. Lining cells could secrete collagenase to digest this layer [14,75], thus acting as gatekeepers for the initiation of resorption. There are also indications that lining cells can differentiate back into bone forming osteoblasts in response to mechanical stimulation [17].
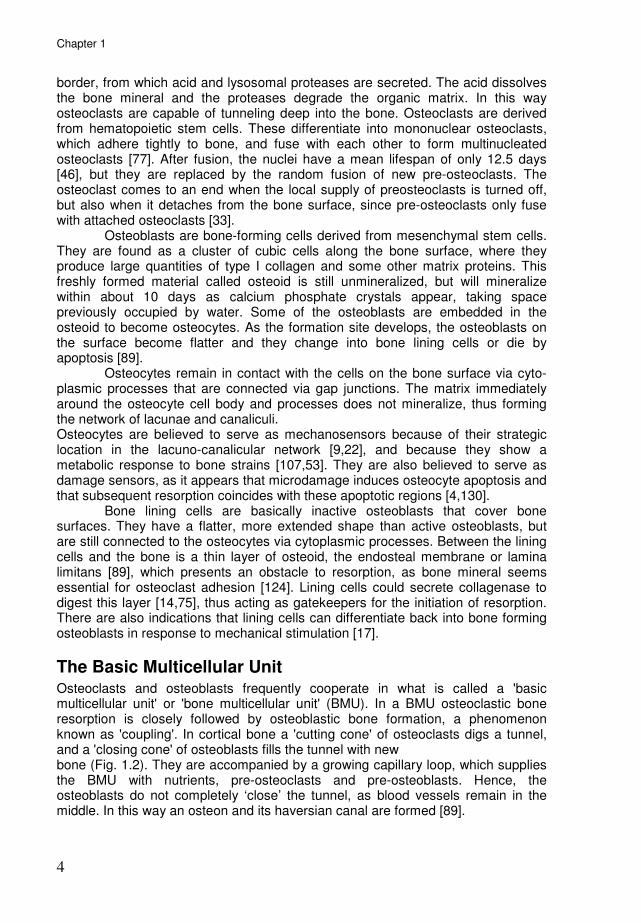
The Basic Multicellular Unit Osteoclasts and osteoblasts frequently cooperate in what is called a 'basic multicellular unit' or 'bone multicellular unit' (BMU). In a BMU osteoclastic bone resorption is closely followed by osteoblastic bone formation, a phenomenon known as 'coupling'. In cortical bone a 'cutting cone' of osteoclasts digs a tunnel, and a 'closing cone' of osteoblasts fills the tunnel with new bone (Fig. 1.2). They are accompanied by a growing capillary loop, which supplies the BMU with nutrients, pre-osteoclasts and pre-osteoblasts. Hence, the osteoblasts do not completely ‘close’ the tunnel, as blood vessels remain in the middle. In this way an osteon and its haversian canal are formed [89].
Introduction
5
Figure 1.2: A longitudinal section through a cortical BMU, showing the osteoclasts (OC) at the front, followed by osteoblasts (OB) depositing osteoid (OS) at the tunnel wall. The BMU is supported by a capillary (CA). (Photomicrograph by Dr. R.K.Schenk, Bern University.)
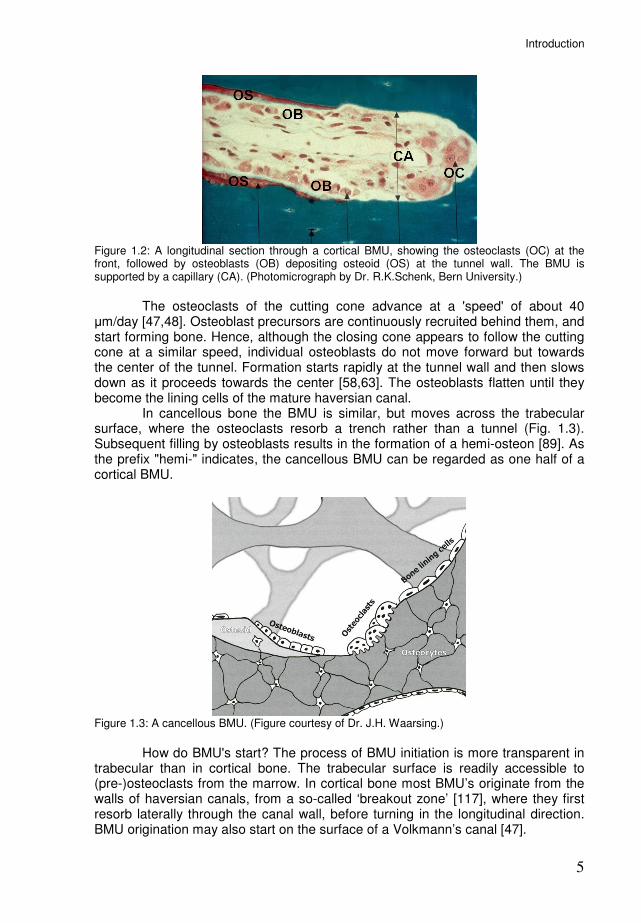
The osteoclasts of the cutting cone advance at a 'speed' of about 40 µm/day [47,48]. Osteoblast precursors are continuously recruited behind them, and start forming bone. Hence, although the closing cone appears to follow the cutting cone at a similar speed, individual osteoblasts do not move forward but towards the center of the tunnel. Formation starts rapidly at the tunnel wall and then slows down as it proceeds towards the center [58,63]. The osteoblasts flatten until they become the lining cells of the mature haversian canal. In cancellous bone the BMU is similar, but moves across the trabecular surface, where the osteoclasts resorb a trench rather than a tunnel (Fig. 1.3). Subsequent filling by osteoblasts results in the formation of a hemi-osteon [89]. As the prefix "hemi-" indicates, the cancellous BMU can be regarded as one half of a cortical BMU.
Figure 1.3: A cancellous BMU. (Figure courtesy of Dr. J.H. Waarsing.)
How do BMU's start? The process of BMU initiation is more transparent in trabecular than in cortical bone. The trabecular surface is readily accessible to (pre-)osteoclasts from the marrow. In cortical bone most BMU’s originate from the walls of haversian canals, from a so-called ‘breakout zone’ [117], where they first resorb laterally through the canal wall, before turning in the longitudinal direction. BMU origination may also start on the surface of a Volkmann’s canal [47].

Chapter 1
6
Please note that the BMU shown in figure 1.2 is a 'picture perfect' BMU. As the sketches by Johnson [49] below show, not all BMU's follow this pattern. Although most schematic representations in literature depict the BMU as developing in one direction, so-called double-ended osteons with two cutting cones are quite common [49,117]. Sometimes resorption continues along one entire side of the tunnel, giving rise to a 'drifting osteon' [95].
Figure 1.4: Sketches from Johnson [49] of longitudinal sections of human cortex showing various cavitation patterns (arrows indicate active resorption; xx are active osteoblasts, black lines are osteonal refill): 1) osteonal column with arrested refill; 2) osteonal column with continuous refill; 3) irregular resorption and refill; 4) eccentric cavitation with resorption towards the marrow cavity and refill on the opposite side; 5) explosive cavitation preceding a "stress fracture"; 6) double-ended, branched osteonal column from 5-year old child with central refill underway.
Computer simulation models by Huiskes and coworkers More than a century ago, when Wolff noted the load-aligned organization of trabecular bone, his contempary Wilhelm Roux [96] pioneered the thought that this architecture resulted from a remodeling process at the cell level based on local tissue strains. Only in the last decades, with the development of computer simulation models, did it become possible to test such hypotheses. Using computer simulations, Huiskes et al. [42,81,97] demonstrated that local remodeling regulated by mechanosensory osteocytes could indeed produce load-aligned trabeculae. In this model formation was stimulated by a strain-induced osteocyte signal, but resorption occured randomly along the bone surface (Fig. 1.5A). The architecture transforms when the external loads are changed, aligning the trabeculae with the new loading directions (Fig. 1.5B). Reduced loads resulted in reduced trabecular thickness, connectivity and mass, as is seen in disuse osteoporosis [97]. Post-menopausal osteoporosis could be simulated through increased osteoclast resorption frequencies [97]. Tanck [115] used this model to show how bone under the growth plate could develop into porous trabecular bone or solid cortical bone, depending on variations in the loading magnitude. This was a first indication that cortical and cancellous bone share the same regulation mechanisms, but have different morphologies due to different loading conditions.

Introduction
7
Figure 1.5: The regulatory mechanism proposed by Huiskes (A) could produce load-aligned trabecular structures that adapted if load directions were changed (B) (from [97]).
One aspect of remodeling at the BMU level that was already apparent from these models, was that coupling between resorption and formation may be regulated indirectly, via the osteocytes. In load-bearing trabeculae, resorption cavities would increase local strains, which in turn induced the refilling of the cavity. The resorption cavities, however, were no accurate representation of the trenches that osteoclasts dig on trabeculae. To simulate trabecular remodeling at the BMU level, and also to simulate the osteonal tunnels in cortical bone, a new representation of osteoclasts was needed.
Outline of this thesis Chapter 2 describes how we extended our model with a cell simulation method, to explicitly represent the osteoclasts. With this modification we could simulate osteoclasts digging tunnels through the bone. Because osteoclasts do not tunnel criss-cross through the bone, but along the dominant loading direction, a mechanism was needed to guide them. This came from Smit & Burger [109], who had previously evaluated strains around a BMU resorption cavity and found that strains were concentrated at the lateral sides, away from the loading axis. They proposed that strain-induced osteocyte signals from these regions would repel osteoclasts, forcing them towards the loading direction. At the same time such signals would recruit osteoblasts to start bone formation, as in our previous models. With the osteoclasts thus represented and guided, we were able to simulate cortical BMU's creating load-aligned osteons and cancellous BMU's moving across the surface of trabeculae. In these BMU's resorption-formation coupling occurs in response to strains around resorption sites. We also found that if a region of osteocyte death (therefore lacking inhibitory signals) was introduced near the path of the BMU, it would redirect its course to resorb this region. This may provide a mechanism for damage removal, an idea we revisit in chapter 5. The inspiration for chapter 3 came as we simulated osteonal tunneling and noticed that wider osteons were being formed under a lower loading magnitude. Within the model this made sense: lower loading means less strain-induced inhibition at the sides of the cutting cone, allowing it to become wider. The question was whether there are indeed wider osteons in lesser strained bone regions. From the literature we found several indications that this was indeed the case. This was most notable in the hitherto unexplained difference in osteon diameter between the endosteal (inner) and periosteal (outer) side of the cortex, with generally wider osteons in the less-strained endosteal side. A related phenomenon are the so-called 'drifting osteons'. As I learned that drifting osteons preferentially drift from the periosteal to the endosteal side, I realized that this could very well be caused by the same mechanism that causes the periosteal/endosteal differences in osteon
Chapter 1
8
diameter. Here, the difference in strain magnitude had to be notable at the scale of one BMU, so we simulated osteonal tunneling with a steep gradient in the strain magnitude, and the result was a drifting osteon. The simulations thus far were 2-dimensional, but BMU's have a typical 3D shape, resulting in full cylindrical osteons in cortical bone and hemi-osteons on cylindrical trabeculae. This also affects the load transfer through the surrounding bone. For instance, in 2D an osteoclast cannot pierce a trabecula without dis-connecting it, in 3D it can. Furthermore, in 2D an osteoclast can only move along straight lines over the trabecular surface whereas in 3D it could spiral around the trabeculae. Therefore we simulated osteonal and hemi-osteonal remodeling in 3D, as described in chapter 4. In chapter 1 we simulated how a BMU changed its course to target a region with dead osteocytes, indicating a potential mechanism for damage repair. The apoptotic region, however, was very artificial, since no damage algorithms were included in the model. In chapter 5 we incorporated damage algorithms into the model, to better understand the implications of microdamage-targeted resorption. That remodeling will repair damage is far from trivial. Especially when loading is already intense enough to cause microdamage, adding resorption spaces might just make the problem worse. There is a chance that microdamage repair turns into 'runaway resorption', resulting in a 'stress fracture'. One factor that could make the difference between microdamage repair and runaway resorption is the effect that osteocyte death has on bone formation. In our models we assumed strain-induced stimulatory signals from osteocyte to osteoblast, and osteocyte death would therefore cause a drop in bone formation. However, it was discovered in recent years that osteocytes inhibit bone formation via the protein sclerostin. This appears to be at odds with our stimulatory model, but if sclerostin secretion by the osteocyte decreases with strain, it could fulfill the same function. In chapter 6 we used computer simulations to show that a sclerostin-based model is also able to produce a load-aligned trabecular architecture. The advantage of this model is that osteocyte death does not cause a drop in bone formation. Further, we demonstrated with combined stimulatory/inhibitory models that the two pathways can work side-by-side to achieve a load-adapted bone architecture. Chapter 7 provides a summary of our findings, future prospects, and discussions of various aspects of our model.
9
Chapter 2
A unified theory for osteonal and hemi-osteonal remodeling
René F.M. van Oers, Ronald Ruimerman, Esther Tanck, Peter A.J. Hilbers, Rik Huiskes Bone 2008;42:250-9
Chapter 2
10
Abstract The process of bone remodeling is carried out by ‘basic multicellular units’ of osteoclasts and osteoblasts. Osteoclasts excavate a resorption space that is subsequently filled with new bone by osteoblasts. In cortical bone osteoclasts dig tunnels through solid bone, in cancellous bone they dig trenches across the trabecular surface. Osteoblasts fill these tunnels and trenches, creating osteons and hemi-osteons, respectively. Both the osteons of cortical bone and the trabeculae of cancellous bone are aligned to the dominant loading direction, indicating that BMU’s are mechanically regulated. How mechanical forces guide these cells is still uncertain. We hypothesize that strain-induced osteocyte signals inhibit osteoclast activity and stimulate osteoblast activity. This hypothesis was implemented in a finite element-based bone adaptation model, that was extended with a cell-simulation model. This allowed us to examine tunneling and trenching by osteoclasts. We found that our simulations capture key features of BMU-based remodeling: (1) cortical BMU’s create load-aligned osteons; (2) cancellous BMU’s move across the surface of trabeculae instead of piercing them; (3) resorption-formation coupling occurs in response to strains around resorption sites; (4) resorbing osteoclasts target nearby regions of osteocyte death, thus providing a mechanism for bone repair.
Introduction Adult bone is continuously broken down by osteoclasts and rebuilt by osteoblasts, collaborating within ‘basic multicellular units’ (BMU’s). Osteoclasts create a resorption cavity that is subsequently filled with new bone by osteoblasts. In remodeling of cortical bone a ‘cutting cone’ of osteoclasts excavates a tunnel, closely followed by a ‘closing cone’ of osteoblasts that fills the tunnel with new bone [89]. In this way the BMU creates a new osteon. In cancellous bone the BMU is similar, but moves across the trabecular surface, where the osteoclasts resorb a trench rather than a tunnel. Subsequent filling by osteoblasts results in the formation of a hemi-osteon [89]. That resorption is followed by formation is known as the ‘coupling phenomenon’. It remains unclear how coupling between osteoclasts and osteoblasts in a BMU is regulated. Another open question is what directs the osteoclasts in the first place. It was observed that osteon orientation relates to the dominant local loading direction [91], indicating that mechanical stimuli are involved in guiding the tunneling osteoclasts. The orientations and sizes of resorption cavities appear to be deregulated in the absence of mechanical loads [141]. The removal of loads not only affects osteoclasts, but also osteoblasts. In a study by Mathews et al. [72], primates were immobilized for a 2-week period and administered tetracycline (a marker of new bone formation) before, during and after this period. These tetracycline labels showed that bone formation in cortical BMU’s was suspended during immobilization and resumed afterwards. Smit & Burger [109] used finite element analysis (FEA) to evaluate the strains around a BMU resorption cavity. They found that, looking outward from the cavity, bone regions in the primary loading direction experience a low strain magnitude, while regions in transverse directions experience high strain magnitudes. Hence, for a BMU moving in the primary loading direction, osteoclast activity coincides with a low-strain region, while osteoblasts are active on the high-
A unified theory for osteonal and hemi-osteonal remodeling
11
strain sides of the cavity. This pattern is also seen at the macroscopic level: overall bone density relates to mechanical usage [18,20,52,56,134], suggesting that strains stimulate formation and/or inhibit resorption. Indeed, increased loading inhibits resorption and stimulates formation [39]; the reverse is found in disuse [72,133,141,142]. If osteoclasts and osteoblasts respond to mechanical loading, they need to be informed about tissue strains. Osteocytes, being evenly spaced throughout the bone and connected through a network of canaliculi, are believed to serve as mechanosensors [9,21,42,55,81,90,107,132,139]. They can convert mechanical stimuli into biochemical signals that inhibit resorption [10,37] and stimulate formation [9,16,36]. Earlier, we published a theory for strain-related remodeling of trabecular bone [42], assuming a mechanosensory function for osteocytes. Implemented in a computer-simulation model [41,97,115] this produced structures resembling actual bone architectures. In this model formation was stimulated by a strain-induced osteocyte signal, but resorption occured randomly along the bone surface. For the present work osteoclasts are explicitly represented and activated, using the cellular Potts model (CPM) for cell simulation [35,64], while their resorptive activities are inhibited by osteocyte signals. We can now simulate and investigate tunneling by osteoclasts in cortical BMU’s. Likewise, trenching by osteoclasts in cancellous BMU’s can be examined. These modifications to our earlier models allowed us to zoom in on bone remodeling at a cellular scale, and investigate how the proposed strain-based signals guide resorbing osteoclasts.
Methods: the model A bone structure is mapped onto a finite element mesh. We use square or cubic
elements of uniform size ∆x [m], for 2- or 3-dimensional domains, respectively. Note that all simulations in this paper use the 2D version of the model. We introduce, for each element, a relative bone density m(x,t), where vector x [m] denotes element position and t [day] denotes time. The density m(x,t) ranges from a minimal value mmin to 1. At mmin the element is considered to be a marrow element, above mmin it is considered to be a bone element. The time t is
represented by increments ∆t [day], during which the bone density of the elements can change. Hence, the m(x,t)-values of the elements constitute a changeable bone morphology. The m(x,t)-values also determine the stiffness of the elements, according to [25]
( ) ( )3
max ,, tmEtE xx ⋅= ,
where Emax [Pa] is the Young’s modulus for elements at maximal bone density. The structure is subjected to external loads. We use a static load to represent a cylic
load of given amplitude σ and frequency f. The magnitude of the static load σ’ is chosen such that the resulting strain energy density (SED) equals the peak SED rate of the dynamic load:
fσσ 02.2'= .

Chapter 2
12
For a derivation of this formula, see Huiskes [41] or Ruimerman et al. [98]. Load transfer through the structure is evaluated by finite element analysis (FEA), assuming isotropic and linear-elastic material behavior. For 2D simulations we assume plane-strain conditions. FEA is performed at the start of each increment to correct for the gradual morphological changes in the bone. Osteocytes Osteocytes, located within the bone tissue, are assumed to sense a mechanical
stimulus R [J⋅m−3
⋅s−1
], a typical SED rate experienced in a recent loading history. With the static load, an osteocyte’s sensation is given by the SED in its location. Based on this sensation, the osteocytes emit a biochemical signal. This signal decreases exponentially in strength with increasing distance d [m] from the osteocyte. Each element receives an accumulated signal S from nearby osteocytes, according to [41]
( ) ( ) ( )∑=
−⋅⋅=n
i
Dd
iietRtS
1
,,,
xx
xx µ ,
where µ [J−1
⋅m3⋅s] is the osteocyte mechanosensitivity and D [m] is a diffusion-
decay constant, xi is the position of osteocyte i and n is the number of osteocytes less than dinfl [m] removed from x, where dinfl is the truncation distance for the osteocyte signal. Note that the signal does not accumulate over the increments; each increment the signal is calculated anew from the current SED distribution. Numerical settings for all parameters are given in Appendix B. Osteoclasts When the osteocyte signal S is strong enough, it inhibits osteoclast attachment to the bone surface and their subsequent resorption activities. Osteoclasts are explicitly modeled, using a cell simulation method based on the cellular Potts model (CPM) [35,64]. This is described in appendix A. What it amounts to is that an osteoclast is assumed to adhere to bone surfaces where the osteocyte signal is weak and proceeds to resorb this bone. Two signal thresholds are used, S0 and S1. If the osteocyte signal is below S0, osteoclast-bone adhesion is strong. Between S0 and S1 adhesion weakens and above S1 there is no adhesion. The cell simulation method also ensures that osteoclast volume (the number of occupied elements) remains close to a target volume V0. This volume is based on a typical osteoclast diameter of 50 µm [29]. Osteoblasts Osteoblasts are recruited to exposed bone surfaces where the osteocyte signal exceeds a threshold Sobl for a period Tr [d]. They then form bone according to
( )( )x
tStSm oblobl
∆
∆⋅−⋅=∆ ,xτ ,
where the change in m(x,t) due to osteoblast activity is denoted with the index obl,
andτ [m⋅day−1
] determines the bone formation rate. The newly formed bone is assumed to have the same osteocyte density as pre-existing bone.
A unified theory for osteonal and hemi-osteonal remodeling
13
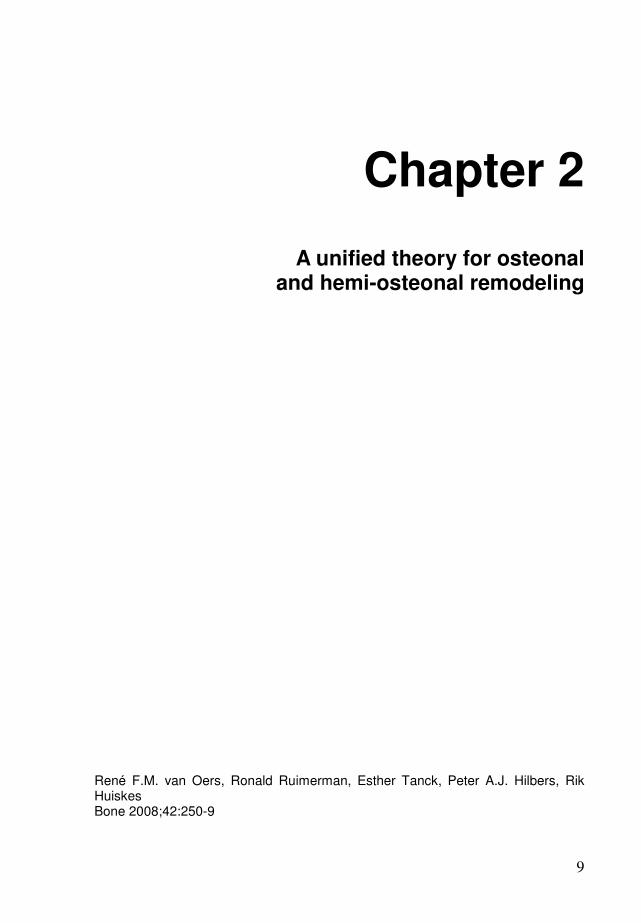
Methods: the simulations Osteonal remodeling Osteonal remodeling of cortical bone is simulated for a 2x2 mm
2 piece of compact
bone tissue, subjected to a compressive load (Fig. 2.1A). This 36.36 MPa static load corresponds to a 1 Hz, 18 MPa cyclic load. Three osteoclasts start from an initial resorption cavity (Fig. 2.1B) of 180 µm diameter. They are only 1 element in size at first, but quickly expand to the target volume V0 at the start of the simulation. Osteocytes are positioned in the bone tissue (Fig. 2.1B) at a density of 1600 mm
−2 [81]. All parameter settings for this simulation are specified in appendix
B. The simulation runs for 100 model increments, representing a 25 day
remodeling period. The simulation is repeated with a 30° rotated load and with a zero load, to test if the osteoclasts’ resorption-direction depends on the FEM-model mesh, rather than on the loading direction.
Figure 2.1: A) A bone structure with an initial resorption cavity is subjected to external loads. B) Enlarged view of the cavity, showing osteocytes in the bone (small dots) and osteoclasts in the cavity (large dots).
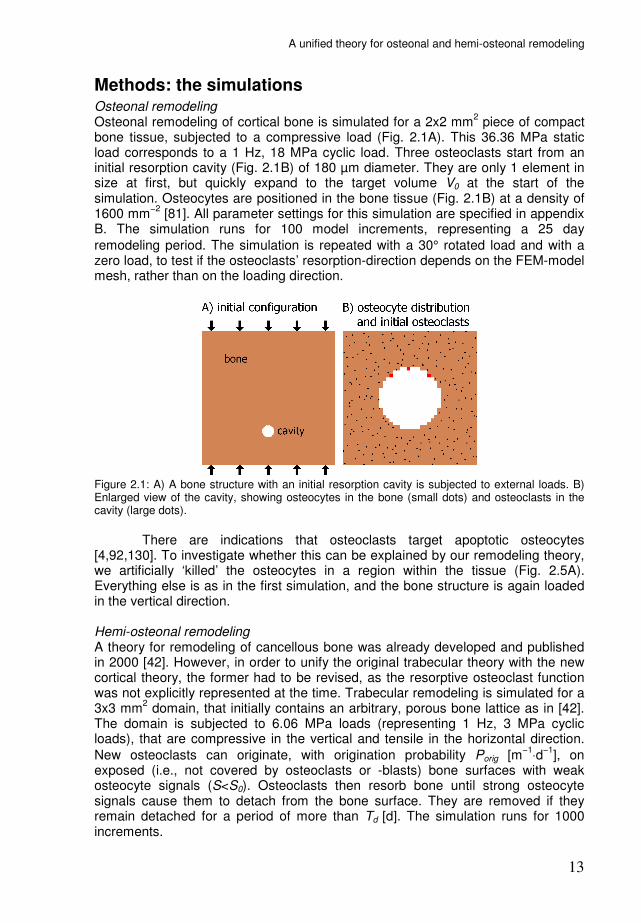
There are indications that osteoclasts target apoptotic osteocytes [4,92,130]. To investigate whether this can be explained by our remodeling theory, we artificially ‘killed’ the osteocytes in a region within the tissue (Fig. 2.5A). Everything else is as in the first simulation, and the bone structure is again loaded in the vertical direction. Hemi-osteonal remodeling A theory for remodeling of cancellous bone was already developed and published in 2000 [42]. However, in order to unify the original trabecular theory with the new cortical theory, the former had to be revised, as the resorptive osteoclast function was not explicitly represented at the time. Trabecular remodeling is simulated for a 3x3 mm
2 domain, that initially contains an arbitrary, porous bone lattice as in [42].
The domain is subjected to 6.06 MPa loads (representing 1 Hz, 3 MPa cyclic loads), that are compressive in the vertical and tensile in the horizontal direction.
New osteoclasts can originate, with origination probability Porig [m−1
⋅d−1
], on exposed (i.e., not covered by osteoclasts or -blasts) bone surfaces with weak osteocyte signals (S<S0). Osteoclasts then resorb bone until strong osteocyte signals cause them to detach from the bone surface. They are removed if they remain detached for a period of more than Td [d]. The simulation runs for 1000 increments.
Chapter 2
14
In our previous studies of cancellous bone we investigated adaptation of the trabecular architecture to alternative load directions [42,97]. To test if the structure still adapts in the revised model, the final configuration of the former
simulation was subjected to a 30° rotated load direction for 500 additional increments.
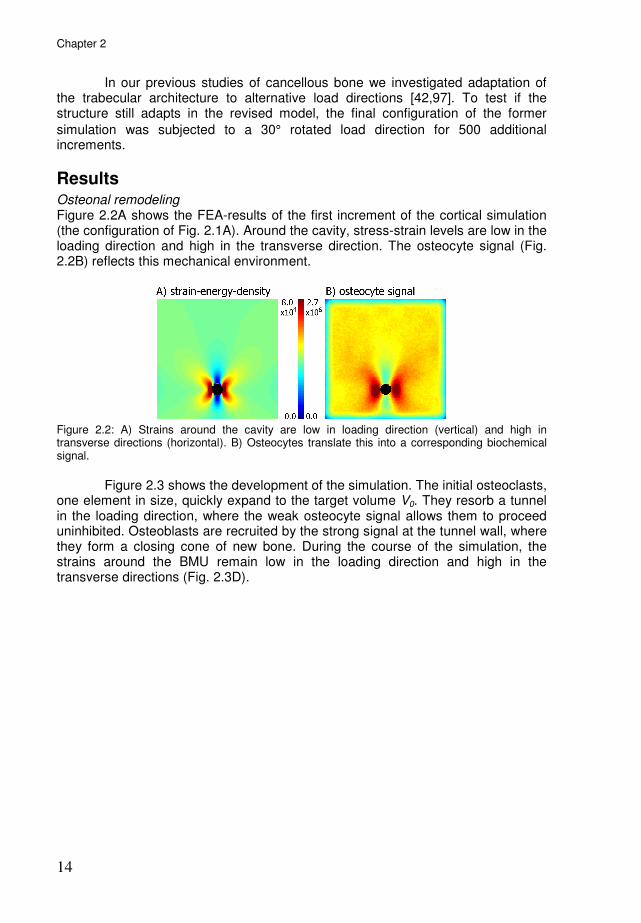
Results Osteonal remodeling Figure 2.2A shows the FEA-results of the first increment of the cortical simulation (the configuration of Fig. 2.1A). Around the cavity, stress-strain levels are low in the loading direction and high in the transverse direction. The osteocyte signal (Fig. 2.2B) reflects this mechanical environment.
Figure 2.2: A) Strains around the cavity are low in loading direction (vertical) and high in transverse directions (horizontal). B) Osteocytes translate this into a corresponding biochemical signal.
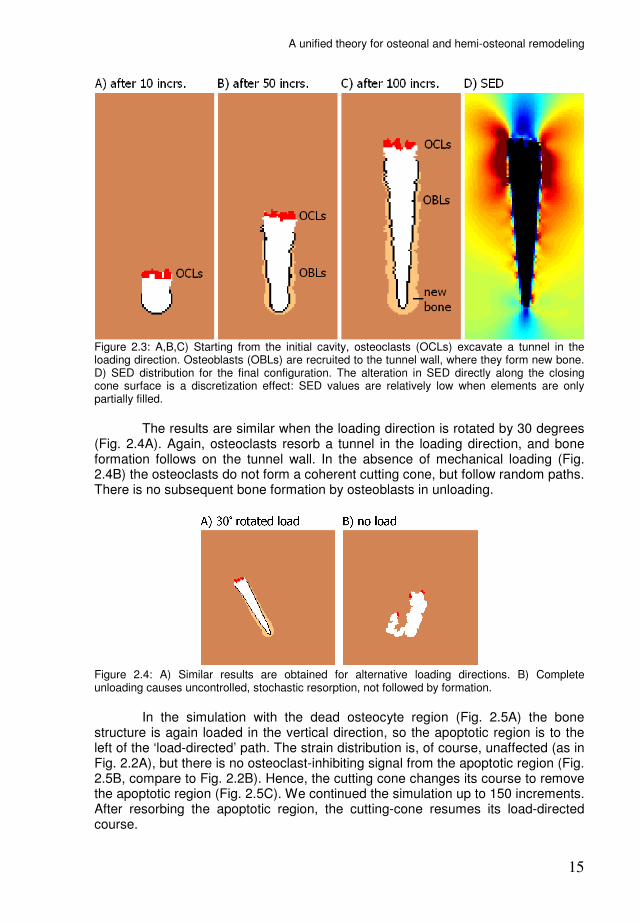
Figure 2.3 shows the development of the simulation. The initial osteoclasts, one element in size, quickly expand to the target volume V0. They resorb a tunnel in the loading direction, where the weak osteocyte signal allows them to proceed uninhibited. Osteoblasts are recruited by the strong signal at the tunnel wall, where they form a closing cone of new bone. During the course of the simulation, the strains around the BMU remain low in the loading direction and high in the transverse directions (Fig. 2.3D).
A unified theory for osteonal and hemi-osteonal remodeling
15
Figure 2.3: A,B,C) Starting from the initial cavity, osteoclasts (OCLs) excavate a tunnel in the loading direction. Osteoblasts (OBLs) are recruited to the tunnel wall, where they form new bone. D) SED distribution for the final configuration. The alteration in SED directly along the closing cone surface is a discretization effect: SED values are relatively low when elements are only partially filled.
The results are similar when the loading direction is rotated by 30 degrees (Fig. 2.4A). Again, osteoclasts resorb a tunnel in the loading direction, and bone formation follows on the tunnel wall. In the absence of mechanical loading (Fig. 2.4B) the osteoclasts do not form a coherent cutting cone, but follow random paths. There is no subsequent bone formation by osteoblasts in unloading.
Figure 2.4: A) Similar results are obtained for alternative loading directions. B) Complete unloading causes uncontrolled, stochastic resorption, not followed by formation.
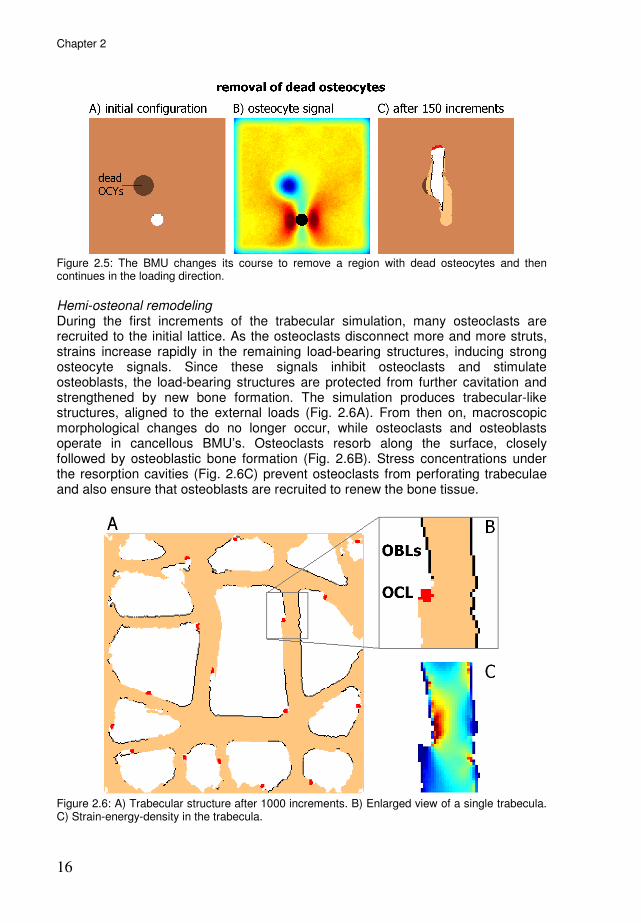
In the simulation with the dead osteocyte region (Fig. 2.5A) the bone structure is again loaded in the vertical direction, so the apoptotic region is to the left of the ‘load-directed’ path. The strain distribution is, of course, unaffected (as in Fig. 2.2A), but there is no osteoclast-inhibiting signal from the apoptotic region (Fig. 2.5B, compare to Fig. 2.2B). Hence, the cutting cone changes its course to remove the apoptotic region (Fig. 2.5C). We continued the simulation up to 150 increments. After resorbing the apoptotic region, the cutting-cone resumes its load-directed course.
Chapter 2
16
Figure 2.5: The BMU changes its course to remove a region with dead osteocytes and then continues in the loading direction.
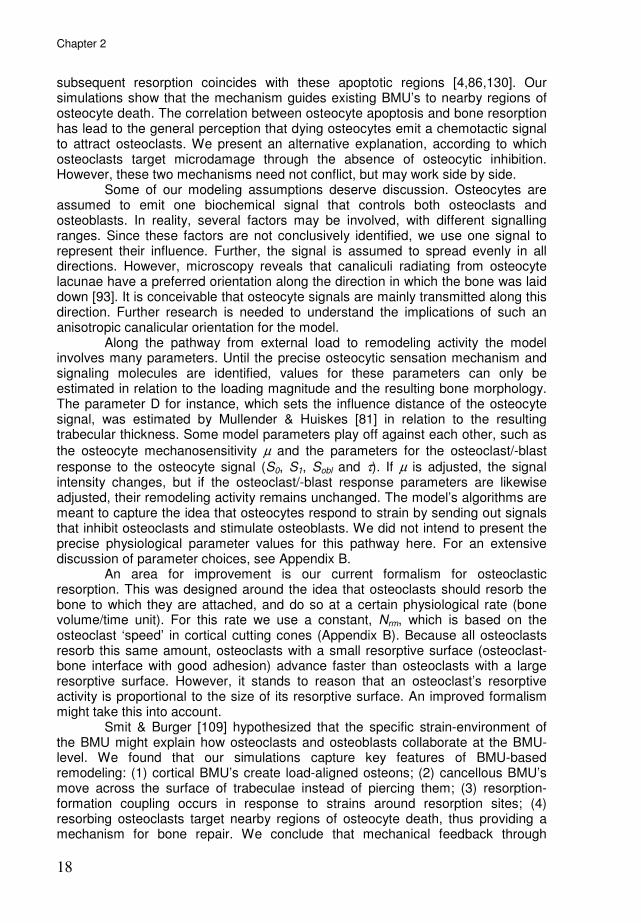
Hemi-osteonal remodeling During the first increments of the trabecular simulation, many osteoclasts are recruited to the initial lattice. As the osteoclasts disconnect more and more struts, strains increase rapidly in the remaining load-bearing structures, inducing strong osteocyte signals. Since these signals inhibit osteoclasts and stimulate osteoblasts, the load-bearing structures are protected from further cavitation and strengthened by new bone formation. The simulation produces trabecular-like structures, aligned to the external loads (Fig. 2.6A). From then on, macroscopic morphological changes do no longer occur, while osteoclasts and osteoblasts operate in cancellous BMU’s. Osteoclasts resorb along the surface, closely followed by osteoblastic bone formation (Fig. 2.6B). Stress concentrations under the resorption cavities (Fig. 2.6C) prevent osteoclasts from perforating trabeculae and also ensure that osteoblasts are recruited to renew the bone tissue.
Figure 2.6: A) Trabecular structure after 1000 increments. B) Enlarged view of a single trabecula. C) Strain-energy-density in the trabecula.

A unified theory for osteonal and hemi-osteonal remodeling
17
When the structure of figure 2.6 is subjected to an alternative load direction, strains in the trabeculae become very high. This induces rapid bone formation along those trabecular edges, where it is most needed. When the strains are reduced, osteoclasts start resorbing bone where it is no longer needed. In this process some trabeculae are lost. The result is a trabecular structure that is aligned to the new loading direction (Fig. 2.7).
Figure 2.7: Changing the load direction results in adaptation of the homeostatic structure.
Discussion Our theory is based on a mechanosensory function of osteocytes: strain-induced osteocyte signals inhibit bone resorption and stimulate bone formation. By extending our earlier model [42,97] with the osteoclast cell model, we could investigate how the theory plays out at the BMU-level. Our simulations show that a strain-induced osteocyte signal can direct resorbing osteoclasts in the dominant loading direction, maintaining a coherent cutting cone over the course of several weeks. Unloading leads to abnormal resorption directions. In cancellous bone the regulation mechanism ensures, under normal loading conditions, that the BMU moves along the trabecular surface and does not perforate the trabecula. Hence, our model produces osteons aligned to the dominant loading direction [91], deregulated resorption cavities in unloading [141], and the movement of cancellous BMU’s along the trabecular surface [89]. Under normal loading conditions the osteocyte signal induces coupling of formation to resorption. As such, it provides an ‘indirect’ coupling mechanism, in which osteoblasts do not simply follow resorbing osteoclasts, but rather respond to the strains that arise around resorption sites in load-bearing bone. It leads to uncoupling in the absence of mechanical loading, as observed by Mosekilde [80] and Mathews et al. [72]. Just as uncoupling (resorption not followed by formation) occurs in decreased loading, de novo bone formation (formation without prior resorption) occurs in increased loading [17]. This phenomenon is also covered by our remodeling theory. Apart from mechanical optimization, bone remodeling also serves to repair damaged bone: osteoclasts do not only resorb bone in disuse, but also target microcracks [11,57,69,79]. Since microcracks occur in high rather than low strain regions, this seems to contradict our remodeling theory [116], according to which the resorption-inhibiting osteocyte signals are increased by strain. However, several studies indicate that microdamage induces osteocyte apoptosis and that
Chapter 2
18
subsequent resorption coincides with these apoptotic regions [4,86,130]. Our simulations show that the mechanism guides existing BMU’s to nearby regions of osteocyte death. The correlation between osteocyte apoptosis and bone resorption has lead to the general perception that dying osteocytes emit a chemotactic signal to attract osteoclasts. We present an alternative explanation, according to which osteoclasts target microdamage through the absence of osteocytic inhibition. However, these two mechanisms need not conflict, but may work side by side. Some of our modeling assumptions deserve discussion. Osteocytes are assumed to emit one biochemical signal that controls both osteoclasts and osteoblasts. In reality, several factors may be involved, with different signalling ranges. Since these factors are not conclusively identified, we use one signal to represent their influence. Further, the signal is assumed to spread evenly in all directions. However, microscopy reveals that canaliculi radiating from osteocyte lacunae have a preferred orientation along the direction in which the bone was laid down [93]. It is conceivable that osteocyte signals are mainly transmitted along this direction. Further research is needed to understand the implications of such an anisotropic canalicular orientation for the model. Along the pathway from external load to remodeling activity the model involves many parameters. Until the precise osteocytic sensation mechanism and signaling molecules are identified, values for these parameters can only be estimated in relation to the loading magnitude and the resulting bone morphology. The parameter D for instance, which sets the influence distance of the osteocyte signal, was estimated by Mullender & Huiskes [81] in relation to the resulting trabecular thickness. Some model parameters play off against each other, such as
the osteocyte mechanosensitivity µ and the parameters for the osteoclast/-blast
response to the osteocyte signal (S0, S1, Sobl and τ). If µ is adjusted, the signal intensity changes, but if the osteoclast/-blast response parameters are likewise adjusted, their remodeling activity remains unchanged. The model’s algorithms are meant to capture the idea that osteocytes respond to strain by sending out signals that inhibit osteoclasts and stimulate osteoblasts. We did not intend to present the precise physiological parameter values for this pathway here. For an extensive discussion of parameter choices, see Appendix B. An area for improvement is our current formalism for osteoclastic resorption. This was designed around the idea that osteoclasts should resorb the bone to which they are attached, and do so at a certain physiological rate (bone volume/time unit). For this rate we use a constant, Nrm, which is based on the osteoclast ‘speed’ in cortical cutting cones (Appendix B). Because all osteoclasts resorb this same amount, osteoclasts with a small resorptive surface (osteoclast-bone interface with good adhesion) advance faster than osteoclasts with a large resorptive surface. However, it stands to reason that an osteoclast’s resorptive activity is proportional to the size of its resorptive surface. An improved formalism might take this into account. Smit & Burger [109] hypothesized that the specific strain-environment of the BMU might explain how osteoclasts and osteoblasts collaborate at the BMU-level. We found that our simulations capture key features of BMU-based remodeling: (1) cortical BMU’s create load-aligned osteons; (2) cancellous BMU’s move across the surface of trabeculae instead of piercing them; (3) resorption-formation coupling occurs in response to strains around resorption sites; (4) resorbing osteoclasts target nearby regions of osteocyte death, thus providing a mechanism for bone repair. We conclude that mechanical feedback through
A unified theory for osteonal and hemi-osteonal remodeling
19
osteocyte mechanosensation and signaling can direct the bone resorbing osteoclasts in the front of the BMU and activate bone formation in the rear of the BMU, in cortical and cancellous bone.
Acknowledgements This work was supported by the Netherlands Organization for Scientific Research, section Computational Life Sciences (NWO/CLS, grant number 635.100.014).
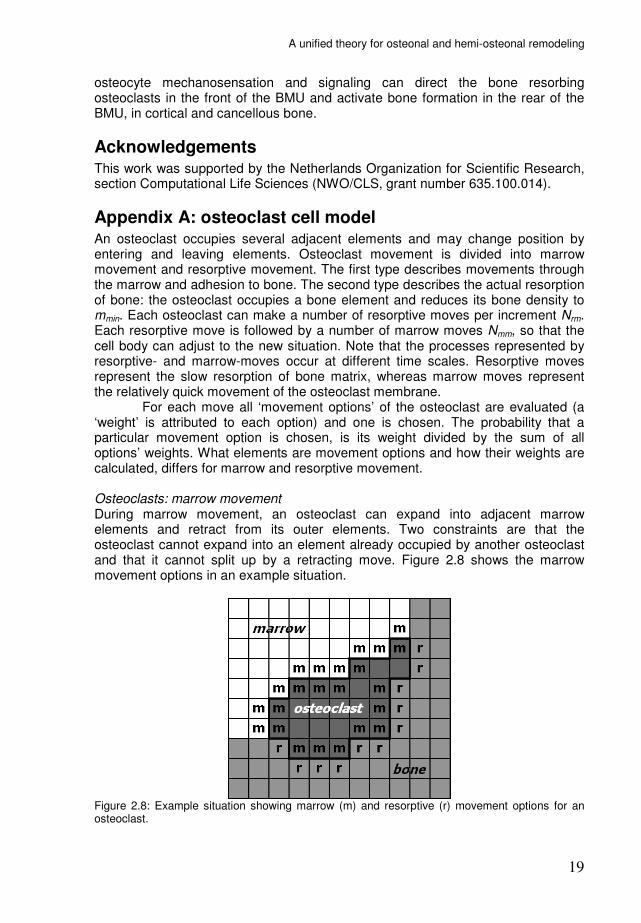
Appendix A: osteoclast cell model An osteoclast occupies several adjacent elements and may change position by entering and leaving elements. Osteoclast movement is divided into marrow movement and resorptive movement. The first type describes movements through the marrow and adhesion to bone. The second type describes the actual resorption of bone: the osteoclast occupies a bone element and reduces its bone density to mmin. Each osteoclast can make a number of resorptive moves per increment Nrm. Each resorptive move is followed by a number of marrow moves Nmm, so that the cell body can adjust to the new situation. Note that the processes represented by resorptive- and marrow-moves occur at different time scales. Resorptive moves represent the slow resorption of bone matrix, whereas marrow moves represent the relatively quick movement of the osteoclast membrane. For each move all ‘movement options’ of the osteoclast are evaluated (a ‘weight’ is attributed to each option) and one is chosen. The probability that a particular movement option is chosen, is its weight divided by the sum of all options’ weights. What elements are movement options and how their weights are calculated, differs for marrow and resorptive movement. Osteoclasts: marrow movement During marrow movement, an osteoclast can expand into adjacent marrow elements and retract from its outer elements. Two constraints are that the osteoclast cannot expand into an element already occupied by another osteoclast and that it cannot split up by a retracting move. Figure 2.8 shows the marrow movement options in an example situation.
Figure 2.8: Example situation showing marrow (m) and resorptive (r) movement options for an osteoclast.
Chapter 2
20
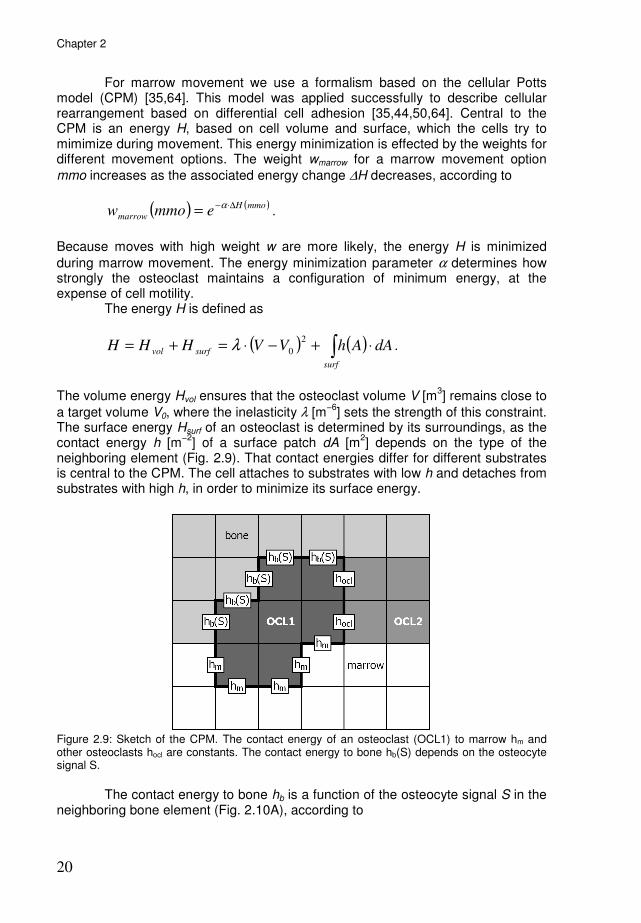
For marrow movement we use a formalism based on the cellular Potts model (CPM) [35,64]. This model was applied successfully to describe cellular rearrangement based on differential cell adhesion [35,44,50,64]. Central to the CPM is an energy H, based on cell volume and surface, which the cells try to mimimize during movement. This energy minimization is effected by the weights for different movement options. The weight wmarrow for a marrow movement option
mmo increases as the associated energy change ∆H decreases, according to
( ) ( )mmoH
marrow emmow∆⋅−= α
.
Because moves with high weight w are more likely, the energy H is minimized
during marrow movement. The energy minimization parameter α determines how strongly the osteoclast maintains a configuration of minimum energy, at the expense of cell motility. The energy H is defined as
( ) ( )∫ ⋅+−⋅=+=surf
surfvol dAAhVVHHH2
0λ .
The volume energy Hvol ensures that the osteoclast volume V [m
3] remains close to
a target volume V0, where the inelasticity λ [m−6
] sets the strength of this constraint. The surface energy Hsurf of an osteoclast is determined by its surroundings, as the contact energy h [m
−2] of a surface patch dA [m
2] depends on the type of the
neighboring element (Fig. 2.9). That contact energies differ for different substrates is central to the CPM. The cell attaches to substrates with low h and detaches from substrates with high h, in order to minimize its surface energy.
Figure 2.9: Sketch of the CPM. The contact energy of an osteoclast (OCL1) to marrow hm and other osteoclasts hocl are constants. The contact energy to bone hb(S) depends on the osteocyte signal S.
The contact energy to bone hb is a function of the osteocyte signal S in the neighboring bone element (Fig. 2.10A), according to

A unified theory for osteonal and hemi-osteonal remodeling
21
( ) ( )SramphSh mb ⋅=
where hm is the contact energy to marrow and ramp(S) is defined as
( ) ( )
−−
=
010
1
0
)(
SSSS
Sramp
otherwise
SSif
SSif
1
0
>
<
When the osteocyte signal is weak, hb is low, so that the osteoclast will achieve mimimal surface energy by adhesion to bone (Fig. 2.10B, left). As S increases, so does hb, and adhesion weakens. When hb equals the contact energy to marrow hm, there is no adhesion (Fig. 2.10B, right).
Figure 2.10: The osteocyte signal S at the bone surface determines osteoclast adhesion. A) The contact energy to bone hb is a function of S. B) Configurations of mimimal surface energy for different hb.
Osteoclasts: resorptive movement Resorptive movement options for the osteoclast are all adjacent bone elements (Fig. 2.8). The weight wresorp for a resorptive movement option rmo, is defined as
( ) ( )( ) ( )( )rmoSadhrmoNrmow csresorp ⋅=β
.
Ncs denotes the number of contact surfaces between the osteoclast and the bone
element concerned, β determines how strongly Ncs influences resorption probability, and adh denotes the adhesion strength, which is a function of the osteocyte signal S in the bone element, according to
( ) ( )SrampSadh −= 1 .
This function is derived from the adhesion behavior during marrow movement. Hence, the stronger an osteoclast attaches to a bone surface, the higher is the

Chapter 2
22
probability of resorption. The osteocyte signal at the bone surface governs attachment and therefore also resorption. If the osteoclast does not adhere to bone (no adjacent bone element with adh > 0), the resorptive move finishes without actual resorption.
Appendix B: parameter settings Table 2.1 lists the parameter settings for the simulations. These are discussed below.
parameter symbol value unit Discretization parameters element size ∆x 10 µm increment time ∆t 0.25
d
Loading parameters loading magnitude σ 3-18 MPa
loading frequency f 1.0 Hz Material parameters maximum Young’s modulus Emax 15
GPa
Poisson’s ratio ν 0.3
-
minimum bone density mmin 0.1 - Osteocyte parameters osteocyte density ρocy 1600
mm
−2 *
osteocyte mechanosensitivity µ 1.0 J−1
⋅m3⋅s
diffusion-decay constant D 100
µm signal truncation distance dinfl 150 µm Osteoclast parameters lower threshold signal S0 1.5⋅10
6 -
upper threshold signal S1 2.0⋅106 -
osteoclast target volume V0 1.96⋅103
µm2
* inelasticity λ 1.0⋅10
6 mm
−4 *
nr. resorptive moves Nrm 5 - nr. marrow moves Nmm 25 - contact energy to marrow hm 1.0 mm
−1 *
contact energy to osteoclasts hocl 1.0 mm−1
* contact energy to osteoblasts hobl 1.0 mm
−1 *
energy minimization parameter α 200 -
resorptive contact parameter β 3 -
origination probability Porig 100 m−1
⋅d−1
detached viability period Td 1 d Osteoblast parameters activation threshold signal Sobl 1.0⋅10
6 -
formation rate parameter τ 6.0⋅10−12
m⋅d−1
recruitment time Tr 2 d
Table 2.1: Parameter settings. * These dimensions apply to the 2-dimensional case.
Discretization, loading, and material parameters A fully developed cortical BMU is about 2000 µm long and 200 µm wide [89]. In order to get a proper assessment of its strain environment, element size must be sufficiently small in proportion to the dimensions of the BMU. Using an element
size ∆x of 10 µm, there are about 15-20 elements over the width of the BMU. The BMU should advance only a small distance per increment, so that the finite element analysis of its strain environment is updated adequately. Given a
A unified theory for osteonal and hemi-osteonal remodeling
23
physiological BMU ‘speed’ of 40 µm/day [47,48] and an element size of 10 µm, we
chose an increment time ∆t of 0.25 day, in which the BMU’s cutting cone resorbs just one layer of elements.
In the cortical simulations the loading magnitude σ was 18 MPa. This magnitude was chosen simply as a representative stress level and is not otherwise intended to be of any particular significance. In the trabecular simulations the loading magnitude was 3 MPa. This is much smaller than for the cortical simulations: we assume that cortical and cancellous bone share the same regulation mechanisms, but have different morphologies due to different loading conditions [115]. We used material properties appropriate for cortical bone, with a Young’s
modulus Emax of 15 GPa and a Poisson’s ratio ν of 0.3 [127]. Osteocyte parameters
The osteocyte mechanosensitivity µ relates strain sensation to signal secretion.
Because the proposed osteocytic signalling molecules remain to be identified, µ
was given an arbitrary value of 1. For the same reason no units (such as mol⋅m−3)
were specified for the strength of the signal. The diffusion-decay constant D represents the distance from an osteocyte where the signal strength has reduced to e−1
, i.e. 36,8%. Without identification of the signal molecules, this distance can only be estimated. Mullender & Huiskes [81] incorporated the parameter D in a computer-simulation model for trabecular bone (a precursor of this model) and found that trabecular thickness was related to the value of D. They estimated that D should be 50-100 µm, in line with the experimental finding that the trabecular thickness of the iliac cancellous bone in normal humans is 100-200 µm [87].
The osteocyte density ρocy of 1600 mm−2 was based on reports by Marotti
et al. [65], who found 500-3000 lacunae per square millimeter in 20-30 µm histological slices from several species. The osteocyte density and the diffusion-decay distance together determine how the signal is distributed. Mullender & Huiskes [81] found that when the distance between osteocytes is about equal to D or larger, this results in large gradients in the signal. At a density of 1600 mm−2
, the average distance between osteocytes is 25 µm. As this is small compared to the used D of 100 µm, the osteocyte distribution does not cause large signal gradients. Osteoclast parameters When the osteocyte signal S is strong enough, it inhibits osteoclasts. Two signal thresholds are used, S0 and S1. Below S0, there is no inhibition and above S1 there is complete inhibition. These thresholds relate to the width of the cutting cone and the resulting osteonal tunnel. When the cutting cone widens, the ‘lateral strains’ increase, until the ‘lateral signal’ becomes high enough to inhibit further widening. With higher thresholds, this point is reached later, resulting in wider tunnels. Lower thresholds result in narrower tunnels or a complete halt of resorption. The chosen threshold values result in an osteonal tunnel (Fig. 2.3) of about 180 µm wide, and were based on the signal intensity (Fig. 2.2B) around the
initial cavity (also 180 µm wide): about 1.5⋅106 at top and bottom and 2.0⋅10
6 at the
sides. The osteoclast target volume V0 is set according to a typical osteoclast diameter TOD of 50 µm [29]. In the 2-dimensional version of the model the target volume is actually a target area, the area of a circle with a 50 µm diameter. The

Chapter 2
24
inelasticity λ was given a high default value of 1.0·106 mm−4
, so that the osteoclast strictly maintains its target volume. The number of resorptive moves Nrm per increment is related to the osteoclast’s resorptive area (or width in 2D simulations) and its speed of advance.
If an osteoclast has a width of ψ pixels and advances at a speed of ϕ pixels per increment, then
ψϕ ⋅=rmN .
The osteoclast speed ϕ is given by the longitudinal erosion rate LER, the speed of an advancing cutting cone, which is about 40 µm/day [47,48]:
x
tLER
∆
∆⋅=ϕ .
The osteoclasts in our model do not have a fixed shape, so there is no constant
width ψ. However, due to the energy minimization algorithm for marrow movement, the osteoclast maintains a well rounded shape with typical osteoclast diameter TOD:
xTOD ∆≈ψ .
Now we can define Nrm by
( )2
x
tTODLERN rm
∆
∆⋅⋅= .
The number of marrow moves Nmm that follows each resorptive move, allows the cell body to adjust to the new situation (the cavitation of the bone surface). The speed of this adjustment depends on the size of the cell body, which (in 2D simulations) relates to the square of osteoclast width:
( )22xTODN mm ∆==ψ .
The contact energy to marrow hm was given an arbitrary value of 1 mm−1
.
The energy minimization parameter α was determined in relation to these
surface energies. If α is zero, all movement options have equal probability,
regardless of their energy costs. When α is increased, ‘high energy’ movement options have lower probability and the osteoclast tends to minimize its surface in a sequence of movements. An osteoclast moving through marrow will then take a
rounded shape. When α is increased further, the osteoclast strictly preserves a compact shape, at the expense of cell motility. During model development, we
found α at 200 to be a suitable intermediate between osteoclast shape and motility. The contact energy to osteoclasts hocl and the contact energy to osteoblasts hobl were set equal to the contact energy to marrow hm, so an osteoclast will not prefer contact with other osteoclasts or osteoblasts over contact

A unified theory for osteonal and hemi-osteonal remodeling
25
with the surrounding medium (marrow). Thus, no osteoclast-osteoclast and osteoclast-osteoblast adhesion were defined in the model. When the osteoclast touches a bone element on more than one side, the
element is more likely to be resorbed. The resorptive contact parameter β
determines how strongly this influences resorption probability. If β is set to zero, the
osteoclast’s resorptive surface becomes very irregular. If β is increased, the resorptive surface flattens, because protruding bone elements are resorbed first.
The role of β for resorptive moves resembles that of α for marrow moves, as both encourage a compact cell shape. The value of 3 was chosen by visual inspection of the model osteoclasts. In the trabecular simulations new osteoclasts could originate, with origination probability Porig, on exposed bone surfaces with weak osteocyte
signal. Porig was given an arbitrary value of 100 m−1⋅d−1
(0.00025 per element per increment at current settings). Because equilibrium is reached faster with higher Porig, it was set high enough for the simulation to complete within a reasonable amount of time. Due to the length of time represented by the trabecular simulation and the amount of osteoclasts originating over that period, we needed to also devise a death criterium for osteoclasts. As recent studies have demonstrated that detachment induces apoptosis in osteoclasts within a matter of hours [101,143], we chose to remove osteoclasts after a period of detachment Td of 1 day. Osteoblast parameters When the received osteocyte signal exceeds the osteoblast activation threshold Sobl, it activates bone formation by osteoblasts. Sobl is determined in relation to the loading and the resulting bone morphology. Consider for example the equilibrium situation of figure 2.6. If all resorption is stopped, formation continues for a while increasing trabecular thickness. Bone formation then halts, because decreasing strains cause the osteocyte signal to fall below Sobl. Figure 2.11 shows the final
result, using an Sobl. value of 1.0⋅106. It might be possible to fit Sobl by comparing
such simulation results to experimental results where bone resorption was halted. This has not been done yet in the current work.
Figure 2.11: When osteoclast activity was stopped in the trabecular structure (light brown, see Fig. 2.6), bone formation (black) continued for a while.

Chapter 2
26
Bone formation is most rapid at the start of the closing cone and then
slows down during refilling. Using a formation rate parameter τ at 6.0⋅10−12 m⋅d−1
, the initial rate of bone formation rate is about 5 µm/day, which is of the same order of magnitude as reported values [2]. The recruitment time Tr of 2 days and the cutting cone ‘speed’ of about 40 µm/day result in a ‘reversal zone’ of about 80 µm. Admittedly, 2 days may be too short, as the reversal zone is reported to be about 200 µm long [89]. The following supplement was not part of our paper "A unified theory for osteonal and hemi-osteonal remodeling", but provides specific information about the osteoclast cell model introduced in this chapter and is therefore better included here than in the general discussion.
Supplement A: controlling osteoclast shape In our model the shape of an osteoclast is determined by the minimization of its
surface energy Hsurf. Each move of the osteoclast can change this energy (∆Hsurf).
This energy change determines the move's weight, given by w=exp(−α∆H), which determines the probability that the osteoclast 'chooses' that move over other possible moves. In the model we use a positive value for the energy minimization
parameter α, so the move with the lowest ∆H gets the hightest weight. Therefore the osteoclast is more likely to make surface-reducing moves, and acquires a
compact shape. The preference for surface-reducing moves depends on α (Fig.
2.12). If α were set to zero, all moves would have equal probability, resulting in an irregular cell shape (Fig. 2.12, second insert). The only thing holding the cell
together is the restriction that a move cannot split the cell. When α increases above zero, cell surface is minimized (Fig. 2.12, right).
Figure 2.12: Parameter α controls the surface minimization of the cell. The four inserts show
examples of cell shape at the indicated values of α.

A unified theory for osteonal and hemi-osteonal remodeling
27
Another parameter is involved in the control of osteoclast shape during
bone resorption, the resorptive contact parameter β. When the osteoclast is to make a resorptive move, it chooses an adjacent bone element depending on its comparative weight wresorp, defined as:
adhNw csresorp ⋅=β
.
where adh denotes the adhesion strength (a function of the osteocyte signal S in the bone element), Ncs denotes the number of contact surfaces between the
osteoclast and the bone element, and β determines how strongly Ncs influences
resorption probability. Figure 2.13 shows the effect of β on the shape of the resorptive surface.
Figure 2.13: At four different values of β, 8 resorbing osteoclasts are shown. The resorptive
surface of the osteoclasts becomes less jagged and more rounded with increasing β.
When Ncs is not taken into account (β = 0), the resorptive surface of the osteoclast becomes very irregular. Taking Ncs into account makes the surface more rounded.
This appears to be sufficiently done at a β of 1. Compared to parameter α, which
not only controls the shape but also the adhesion of the osteoclast, parameter β is more aesthetic than functional. It may be dropped to simplify the model, using
simply wresorp=Ncs⋅adh.


29
Chapter 3
Relating osteon diameter to strain René F.M. van Oers, Ronald Ruimerman, Bert van Rietbergen, Peter A.J. Hilbers, Rik Huiskes Bone 2008;43:476-82

Chapter 3
30
Abstract Osteon diameter is generally smaller in bone regions that experience larger strains. A mechanism relating osteon diameter to strain is as yet unknown. We propose that strain-induced osteocyte signals inhibit osteoclastic bone resorption. This mechanism was previously shown to produce load-aligned osteons in computer simulations. Now we find that it also predicts smaller osteon diameter for higher loads. Additionally, we find that our model predicts osteon development with two cutting cones, one moving up and one moving down the loading axis. Such ‘double-ended osteons’ were reported in literature as a common type of osteon development. Further, we find that a steep gradient in strain magnitude can result in an osteonal tunnel with continuous resorption along the less strained side, which corresponds to ‘drifting osteons’ reported in literature.
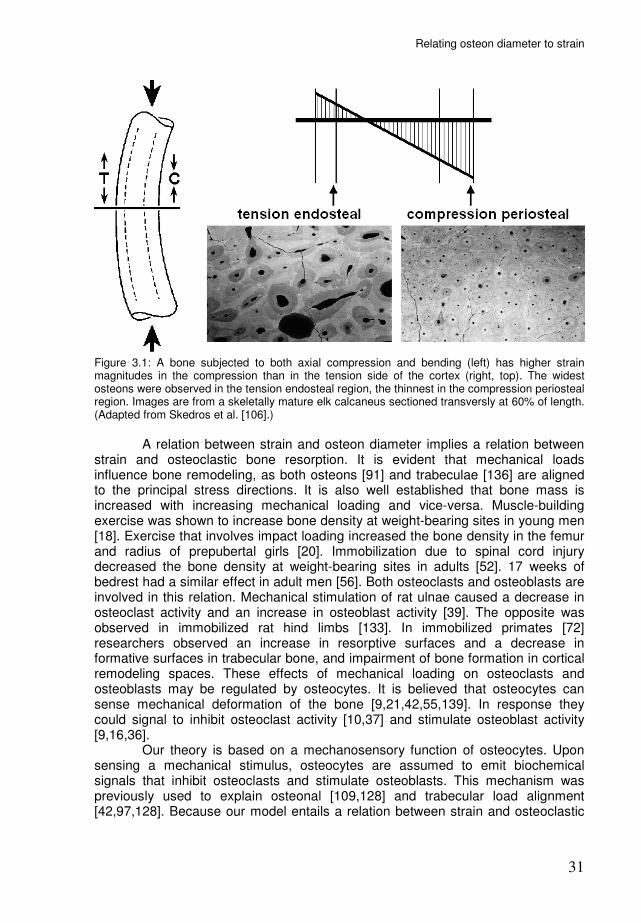
Introduction Osteons are the basic structures of cortical bone. An osteon is a tube-like structure with a central canal. It is formed when a ‘cutting cone’ of osteoclasts excavates a tunnel, and a ‘closing cone’ of osteoblasts fills the tunnel with new bone [89]. The osteoblasts do not completely ‘close’ the tunnel, as blood vessels remain in the middle. The team of osteoclasts and -blasts is known as a basic multicellular unit (BMU). In humans, osteons range in diameter from 150 to 350 µm [2,7,13]. Osteon diameter is obviously determined by the size of the osteoclast cutting cone. What determines the size of the cutting cone is less clear. Frost [31] suggested an inverse relation between osteon diameter and strain magnitude, since osteons are usually wider in the endosteal side of the cortex, while strains are larger in the periosteal side. Skedros et al. [103,104,106] analyzed the heel bone of hoofed animals, in which the tension cortex habitually experiences a lower strain magnitude than the compression cortex [111]. They found larger osteon diameters in the tension cortex (Fig. 3.1), thus supporting Frost’s hypothesis. Further evidence for this inverse relation comes from a study on immobilized primates [141]. A 7-month period of immobilization resulted in cortical resorption cavities of 500-1500 µm diameter. When the immobilization period was followed by a recovery period, new bone was formed in these cavities and the resulting structures appeared as “unusually large osteons”. Thus, there appears to be an inverse relation between strain magnitude and osteon diameter. The question then is: what mechanism relates osteon diameter to strain?
Relating osteon diameter to strain
31
Figure 3.1: A bone subjected to both axial compression and bending (left) has higher strain magnitudes in the compression than in the tension side of the cortex (right, top). The widest osteons were observed in the tension endosteal region, the thinnest in the compression periosteal region. Images are from a skeletally mature elk calcaneus sectioned transversly at 60% of length. (Adapted from Skedros et al. [106].)
A relation between strain and osteon diameter implies a relation between strain and osteoclastic bone resorption. It is evident that mechanical loads influence bone remodeling, as both osteons [91] and trabeculae [136] are aligned to the principal stress directions. It is also well established that bone mass is increased with increasing mechanical loading and vice-versa. Muscle-building exercise was shown to increase bone density at weight-bearing sites in young men [18]. Exercise that involves impact loading increased the bone density in the femur and radius of prepubertal girls [20]. Immobilization due to spinal cord injury decreased the bone density at weight-bearing sites in adults [52]. 17 weeks of bedrest had a similar effect in adult men [56]. Both osteoclasts and osteoblasts are involved in this relation. Mechanical stimulation of rat ulnae caused a decrease in osteoclast activity and an increase in osteoblast activity [39]. The opposite was observed in immobilized rat hind limbs [133]. In immobilized primates [72] researchers observed an increase in resorptive surfaces and a decrease in formative surfaces in trabecular bone, and impairment of bone formation in cortical remodeling spaces. These effects of mechanical loading on osteoclasts and osteoblasts may be regulated by osteocytes. It is believed that osteocytes can sense mechanical deformation of the bone [9,21,42,55,139]. In response they could signal to inhibit osteoclast activity [10,37] and stimulate osteoblast activity [9,16,36]. Our theory is based on a mechanosensory function of osteocytes. Upon sensing a mechanical stimulus, osteocytes are assumed to emit biochemical signals that inhibit osteoclasts and stimulate osteoblasts. This mechanism was previously used to explain osteonal [109,128] and trabecular load alignment [42,97,128]. Because our model entails a relation between strain and osteoclastic

Chapter 3
32
bone resorption, we now investigate how it relates osteon diameter to mechanical loads.
Methods: the model The model used in this study is similar to the model used in an earlier study [128]. A bone structure is mapped onto a finite element mesh consisting of square
elements of uniform size ∆x [m]. We introduce, for each element, a relative bone density m(x,t), where vector x [m] denotes element position and t [day] denotes time. The density m(x,t) ranges from a minimal value mmin to 1. At mmin the element is considered to be a marrow element, above mmin it is considered to be a bone
element. The time t is represented by increments ∆t [day], during which the bone density of the elements can change. Hence, the m(x,t)-values of the elements constitute a changeable bone morphology. The m(x,t)-values also determine the stiffness of the elements, according to [25]:
( ) ( )3
max ,, tmEtE xx ⋅= ,
where Emax [Pa] is the Young’s modulus for elements at maximal bone density. The structure is subjected to external loads. We use a static load to represent a cyclic
load of given amplitude σ and frequency f. The magnitude of the static load σ’ is chosen such that the resulting strain energy density (SED) equals the peak SED rate of the dynamic load:
fσσ 02.2'= .
For a derivation of this formula, see Huiskes [41] or Ruimerman et al. [98]. Load transfer through the structure is evaluated by finite element analysis (FEA), assuming isotropic and linear-elastic material behavior. For 2D simulations we assume plane-strain conditions. FEA is performed at the start of each increment to correct for the gradual morphological changes in the bone. Osteocytes Osteocytes, located within the bone tissue, are assumed to sense a mechanical
stimulus R [J⋅m−3
⋅s−1
], a typical SED rate experienced in a recent loading history at its location. Based on this sensation, the osteocytes emit a biochemical signal. This signal decreases exponentially in strength with increasing distance d [m] from the osteocyte. The exponential function represents the steady-state distribution of a signal molecule, where synthesis and decay are in balance [54]. Each element receives an accumulated signal S from nearby osteocytes, according to [41]:
( ) ( ) ( )∑=
−⋅⋅=n
i
Dd
iietRtS
1
,,,
xx
xx µ ,
where µ [J−1
⋅m3⋅s] is the osteocyte mechanosensitivity and D [m] is a diffusion-
decay constant, xi is the position of osteocyte i and n is the number of osteocytes less than dinfl [m] removed from x, where dinfl is the truncation distance for the osteocyte signal. Note that the signal does not accumulate over the increments;
Relating osteon diameter to strain
33
each increment the signal is calculated anew from the current SED distribution. Numerical settings for the parameters were given and discussed in our previous paper [128]. Osteoclasts When the osteocyte signal S is strong enough, it inhibits osteoclast attachment to the bone surface and their subsequent resorption activities. Osteoclasts are explicitly modeled, using a cell simulation method based on the cellular Potts model (CPM) [35,64]. This simulation method was extensively described in our previous paper [128], and will only be summarized here. An osteoclast occupies several adjacent elements and may change position by entering and leaving
elements. An osteoclast tries −by preferring certain moves over others− to minimize an energy H:
( ) ( )∫ ⋅+−⋅=+=surf
surfvol dAAhVVHHH2
0λ .
The volume energy Hvol ensures that the osteoclast volume V [m
3] remains close to
a target volume V0, where the inelasticity λ [m−6
] sets the strength of this constraint. V0 is based on a typical osteoclast diameter of 50 µm [29]. The surface energy Hsurf of an osteoclast is determined by its surroundings, as the contact energy h [m
−2] of
a surface patch dA [m2] depends on the type of the neighboring element (Fig. 3.2).
That contact energies differ for different substrates is central to the CPM. The cell attaches to substrates with low h and detaches from substrates with high h, in order to minimize its surface energy.
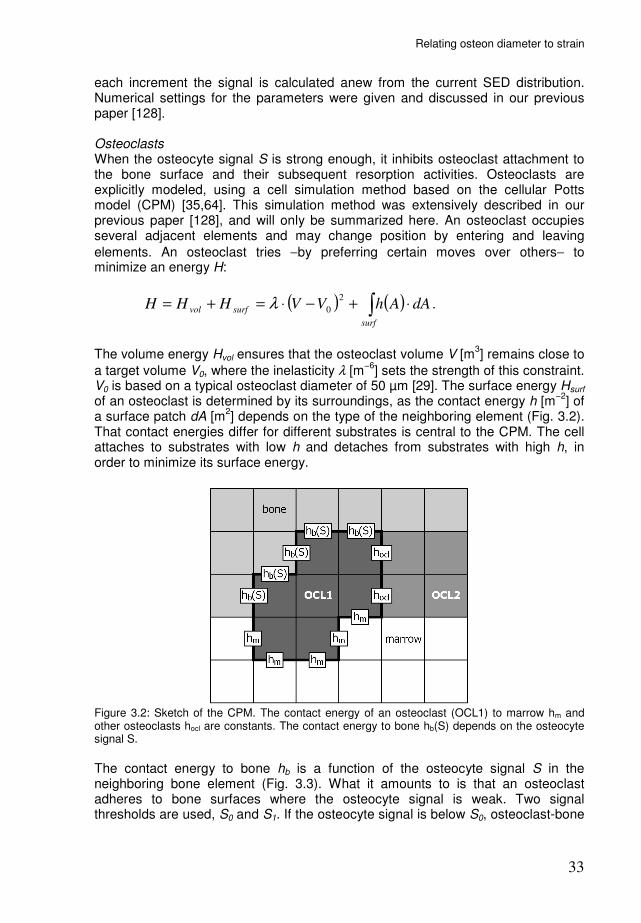
Figure 3.2: Sketch of the CPM. The contact energy of an osteoclast (OCL1) to marrow hm and other osteoclasts hocl are constants. The contact energy to bone hb(S) depends on the osteocyte signal S.
The contact energy to bone hb is a function of the osteocyte signal S in the neighboring bone element (Fig. 3.3). What it amounts to is that an osteoclast adheres to bone surfaces where the osteocyte signal is weak. Two signal thresholds are used, S0 and S1. If the osteocyte signal is below S0, osteoclast-bone

Chapter 3
34
adhesion is strong. Between S0 and S1 adhesion weakens and above S1 there is no adhesion.
Figure 3.3: The osteocyte signal S at the bone surface determines osteoclast adhesion. A) The contact energy to bone hb is a function of S. B) Configurations of minimal surface energy for different hb.
Once settled, an osteoclast can resorb adjacent bone elements. As the osteoclast enters a bone element, its bone density is reduced to mmin. The probability for resorption depends on the local adhesion between the osteoclast and the bone surface, which is determined by the osteocyte signal. In our previous study [128], we used a fixed number of osteoclasts in simulations of osteon development. This limits the width of the osteoclast cutting cone and the resulting osteon. Since these are the topics of investigation, we now allow addition and removal of osteoclasts from the cutting cone. We assume that osteoclast origination can occur on exposed bone surfaces, where adhesion conditions are favorable. The rationale for this assumption is presented in the discussion of this paper. At every increment new osteoclasts can originate, with
origination probability OP [m−2
⋅d−1
], on exposed (i.e., not covered by osteoclasts or -blasts) bone surfaces with low osteocyte signal (S<S0). The model also describes osteoclast death. It is assumed that osteoclasts detached from the bone surface remain viable for only a short period. The relevance of this assumption is also
addressed in the discussion. If an osteoclast does not resorb −because it is not
adjacent to bone or does not adhere to adjacent bone− for a period Td [d], it is removed. Osteoblasts Osteoblasts are recruited to exposed bone surfaces where the osteocyte signal exceeds a threshold Sobl for a period Tr [d]. They then form bone according to
( )( )x
tStSm oblobl
∆
∆⋅−⋅=∆ ,xτ ,
where the change in m(x,t) due to osteoblast activity is denoted with the index obl,
and τ [m⋅day−1
] determines the bone formation rate. The newly formed bone is
Relating osteon diameter to strain
35
assumed to have the same osteocyte density as pre-existing bone. It is covered with a layer of osteoblasts. Osteoclasts do not adhere to or originate on these surfaces.
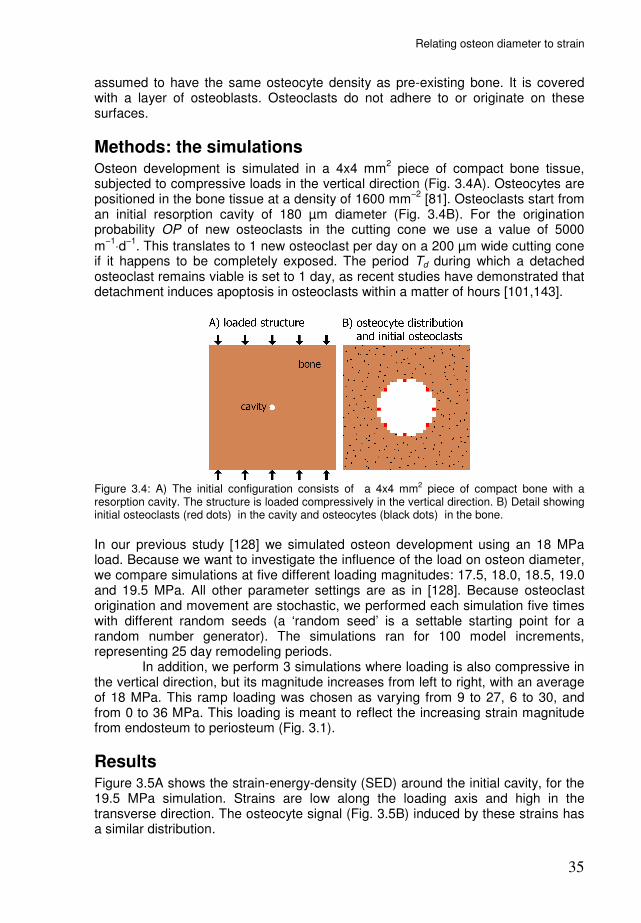
Methods: the simulations Osteon development is simulated in a 4x4 mm
2 piece of compact bone tissue,
subjected to compressive loads in the vertical direction (Fig. 3.4A). Osteocytes are positioned in the bone tissue at a density of 1600 mm
−2 [81]. Osteoclasts start from
an initial resorption cavity of 180 µm diameter (Fig. 3.4B). For the origination probability OP of new osteoclasts in the cutting cone we use a value of 5000
m−1
⋅d−1
. This translates to 1 new osteoclast per day on a 200 µm wide cutting cone if it happens to be completely exposed. The period Td during which a detached osteoclast remains viable is set to 1 day, as recent studies have demonstrated that detachment induces apoptosis in osteoclasts within a matter of hours [101,143].
Figure 3.4: A) The initial configuration consists of a 4x4 mm2 piece of compact bone with a resorption cavity. The structure is loaded compressively in the vertical direction. B) Detail showing initial osteoclasts (red dots) in the cavity and osteocytes (black dots) in the bone.
In our previous study [128] we simulated osteon development using an 18 MPa load. Because we want to investigate the influence of the load on osteon diameter, we compare simulations at five different loading magnitudes: 17.5, 18.0, 18.5, 19.0 and 19.5 MPa. All other parameter settings are as in [128]. Because osteoclast origination and movement are stochastic, we performed each simulation five times with different random seeds (a ‘random seed’ is a settable starting point for a random number generator). The simulations ran for 100 model increments, representing 25 day remodeling periods. In addition, we perform 3 simulations where loading is also compressive in the vertical direction, but its magnitude increases from left to right, with an average of 18 MPa. This ramp loading was chosen as varying from 9 to 27, 6 to 30, and from 0 to 36 MPa. This loading is meant to reflect the increasing strain magnitude from endosteum to periosteum (Fig. 3.1).
Results Figure 3.5A shows the strain-energy-density (SED) around the initial cavity, for the 19.5 MPa simulation. Strains are low along the loading axis and high in the transverse direction. The osteocyte signal (Fig. 3.5B) induced by these strains has a similar distribution.

Chapter 3
36
Figure 3.5: A) Around the cavity, strains are low in the loading direction (vertical) and high in transverse direction. B) The model osteocytes translate this into corresponding biochemical signals.
Figure 3.6 shows the development of the 19.5 MPa simulation. The eight initial osteoclasts, one element in size at first, quickly expand to the target volume. The osteoclasts located at top and bottom of the cavity start to resorb bone, while those located on the left and right side of the cavity detach from the surface and die. The top and bottom osteoclasts proceed to resorb a tunnel along the loading axis. Thus, there are two cutting cones, one moving up and one moving down the loading axis. During the course of the simulation, the osteocyte signal around the cutting cones remains low in loading direction and high in the transverse directions. Osteoblasts are recruited to the eroded surface where they form a closing cone of new bone.
Figure 3.6: Starting from the initial cavity, osteoclasts (OCLs) excavate a tunnel along the loading axis. Osteoblasts (OBLs) are recruited to the tunnel wall, where they form new bone (light brown).
In all simulations, the strains −and consequently the osteocyte signal− around the initial cavity are also high in the loading direction and high at the sides. However, the ‘lateral signal’ is not as strong as in the 19.5 MPa simulation, and lateral resorption is initially not inhibited. The cavity widens, and more osteoclasts are recruited to the cutting-cone surface. As the cutting cone expands, the lateral strains increase, until the lateral signal becomes high enough to inhibit further lateral resorption. From then on, the cutting cone proceeds in the vertical direction, while remaining constant in size. Figure 3.7 shows the final configurations for all 5

Relating osteon diameter to strain
37
simulations. The osteons in the 17.5 MPa simulations are clearly wider than the 19.5 MPa osteons.
Figure 3.7: Final configurations of the 5 simulations. The mean width of each osteon is given below.
The simulations were performed 5 times with different random seeds. Figure 3.8 shows the resulting osteon widths for all simulations. For the 19.5 MPa simulation only two data points are given, because in three simulations the osteons ceased to grow: the cutting cones ‘died out’ when detaching osteoclasts were not timely replaced by originating ones.
Figure 3.8: Osteon widths at different loading magnitudes.

Chapter 3
38
The simulations where the strain magnitude increased left to right from 9 to 27 MPa and from 6 to 30 MPa, produced osteons similar to the ones described above. The simulation at a steeper gradient, from 0 to 36 MPa, produced a different cavitation pattern (Fig. 3.9). In this simulation resorption is not only confined to the top and bottom, but it continues along the entire left side of the tunnel, although at a slower pace than the top and bottom osteoclasts. The top and bottom osteoclasts proceed more or less in the vertical direction, but slowly move towards the left. As a result, all osteoclasts in figure 3.9 are on the left half of the simulation volume, whereas the initial cavity was precisely in the middle. The strain distribution throughout the simulation shows an asymmetric strain distribution with higher strains on the right side than on the left side. The strain concentration to the left slows down the osteoclasts there, but does not stop them, because this strain concentration continuously weakens and moves to the left, as the top and bottom tips proceed in a direction skewed to the left.
Figure 3.9: With the imposed load steeply increasing from left to right, resorption continues not only in the tips but also along the entire left side of the tunnel.
Discussion We present a bone-remodeling theory according to which strain-induced osteocyte signals restrain cutting cones. Because strains around a cavity are low in loading and high in transverse directions [109], this mechanism orients BMU’s in the loading direction [128]. It can explain why osteons generally run parallel to the main loading direction [91]. The restraints on the cutting cones increase with loading magnitude. As our simulations demonstrate, this reduces cutting-cone size, which results in smaller osteon diameters. Hence, the theory provides an explanation for the inverse relationship between loading magnitude and osteon diameter. Figures 3.7 and 3.8 show that this relationship is quite strong in our simulations. Relatively small changes in the loading magnitude cause large

Relating osteon diameter to strain
39
variations in osteon diameter. We do not want to suggest that this relationship is equally strong in actual bone. In our simulations the osteocyte signal depends linearly on the strain-energy-density in a 2-dimensional architecture, whereas in actual bone osteocytic signalling might be a nonlinear response to strain-induced fluid flow in 3-dimensional architectures. We do suggest that any mechanism, in which strain-induced signals inhibit osteoclasts, will produce an inverse relationship between loading magnitude and osteon diameter. For high loaded bone, our simulations predict that the cutting cones ‘died out’ since detaching osteoclasts were not timely replaced by originating ones. This would suggest that habitually overstressed cortical bone may have no intracortical remodeling. It is questionable, however, if this would be expected in real bone as well. Habitually overstressed bone would accumulate microdamage, which would likely disrupt osteocyte signaling. Several studies indicate that microdamage induces osteocyte apoptosis [4,92,130]. The reduction of osteocyte signal due to apoptosis would enable osteoclasts to enter these regions and create a new osteon. These effects of microdamage and apoptosis, however, are not included in the model. The proposed mechanism, inhibition of resorption by strain-induced osteocyte signals, is not really controversial. It is widely believed that osteocytes serve as sensors of mechanical stimuli within bone tissue and there are also indications that osteocytic signals can inhibit bone resorption by osteoclasts [10,37]. The actual osteocytic signaling molecules, expressed upon mechanical stimulation to inhibit osteoclastic bone resorption, remain to be identified. Nitric oxide (NO) has been proposed as a likely candidate [10,53,114]. It is released by osteocytes after fluid flow stimulation [3] and causes osteoclasts to detach form the bone surface [62]. The RANKL/OPG system could also be involved. Receptor
activator of NF-κB ligand (RANKL) is an important factor for osteoclast differen-tiation and survival, and osteoprotegerin (OPG) is its antagonist [112]. Both have been shown to be expressed by osteocytes [144], suggesting that osteocytes can either stimulate or inhibit osteoclasts, depending on the expressed RANKL/OPG ratio. Recently, You et al. [140] found that this ratio decreases after mechanical stimulation of osteocytes, implying a shift toward inhibition of osteoclasts. In our model the coupling between osteoclast and osteoblast activity is purely through mechanotransduction by osteocytes. No direct coupling between osteoclast and osteoblast cells types is assumed. Although a direct coupling between these cell types could be included in the model, we demonstrate in this and earlier papers [97,128] that this is not necessary to explain typical morphological phenomena related to bone loading. Related to this point, it should be noted that the diameter of the osteon is determined solely by the osteoclasts. The osteoblasts determine only to what extent and how quickly the tunnel will be filled. The model incorporates osteoclast origination. Osteoclasts are multi-nucleated cells that originate from mononuclear precursors. These precursors tightly adhere to bone, and fuse with each other to form multinucleated osteoclasts [77]. After fusion, the nuclei have a mean lifespan of 12.5 days [46], which is much shorter than the duration of BMU progression. Hence, the multinucleated osteoclast team in the cutting cone requires a continuous supply of new pre-osteoclasts. This supply is provided by a developing blood vessel that closely follows the cutting cone [89]. It is unclear to what extent the recruited pre-osteoclasts fuse with existing osteoclasts or merge to form new osteoclasts. We

Chapter 3
40
assume that where pre-osteoclasts can adhere to exposed bone surface, the formation of new osteoclasts is possible. The model also incorporates osteoclast death, assuming that detachment from the bone surface induces apoptosis. This assumption was first based on the observation by Fukushima et al. [33] that pre-osteoclasts only fuse with osteoclasts attached to the bone surface. Thus, considering the short lifespan of osteoclast nuclei [46], osteoclasts would not survive an extended period of detachment. Furthermore, recent studies have clearly demonstrated that detachment induces apoptosis in osteoclasts [101,143]. The resorption spaces in our simulations develop in two opposite directions along the loading axis. Although most schematic representations in literature depict the BMU as developing in one direction, it was shown by Tappen [117] that simultaneous ‘proximal-distal tunneling’ is very common. While tracing developing osteons in serial bone slices, he often found resorption spaces at both their distal and proximal ends, indicating that these osteons were advancing in both directions. Note that the proximal-distal axis generally corresponds to the loading axis in human long bones. Johnson [49] used the term ‘double-ended osteons’ for proximal-distal tunneling, and decribed them as: “cavity formation may start at one point and extend simultaneously in opposite directions along the axis, with two cutting cones”. The double-ended osteon development in our simulations is a straightforward result of the strain environment around the cavity. This initial cavity, however, is a simplified representation of BMU origination: there are no other porosities nearby, which simplifies the strain environment, and its entire internal surface is exposed to osteoclastic resorption. Few studies treat BMU origination in cortical bone. Tappen [117] reported that most BMU’s originate from the walls of haversian canals, from a so-called ‘breakout zone’, where they first resorb laterally through the canal wall, before turning proximally and distally. It is unknown what causes this initial breakout, where resorption occurs perpendicular to the main loading direction. Possibly it is triggered by microdamage near a haversion canal of origin [69]. BMU origination may also start on the surface of a Volkmann’s canal [47]. The BMU is then already oriented either distally or proximally from the start, while the opposite side of the Volkmann’s canal may still be covered by lining cells. It is conceivable that the mode of BMU origination largely determines whether an osteon will be single- or double-ended. The simulation with the steep gradient in strain magnitude resulted in a tunnel with resorption not only confined to the tips, but also along the entire lesser-strained side (Fig. 3.9). This type of cavitation strongly resembles the fourth sketch in figure 3.10, which was described by Johnson [49] as: “Cavities may develop excentrically by osteoclast resorption along one side of the length of the canal (the side facing toward older bone near the marrow cavity) while refill is active on the opposite side.” The description that the resorbing side faces the marrow cavity reveals another similarity: strain magnitudes decrease towards the marrow cavity. This type of BMU is called a ‘drifting osteon’ and was extensively investigated and reviewed by Robling & Stout [95]. They implicated strain gradients as a cause for the drift towards the endosteum. Our simulations indeed suggest drifting osteons may arise as a result of steep gradients in the strain magnitude. We can also speculate that in an idealized cortex without any further porosities, a drifting osteon would drift uninterruptedly toward the marrow cavity.
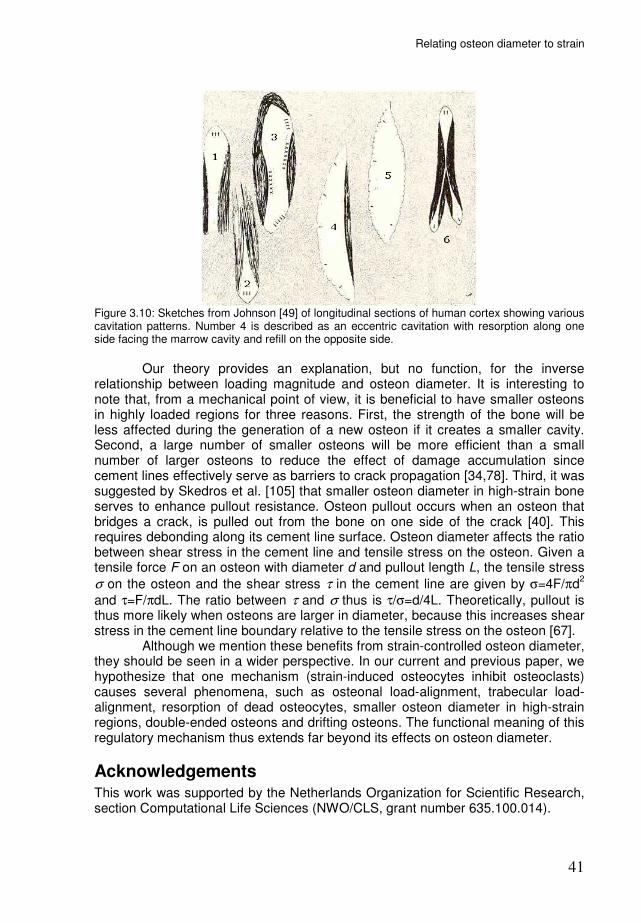
Relating osteon diameter to strain
41
Figure 3.10: Sketches from Johnson [49] of longitudinal sections of human cortex showing various cavitation patterns. Number 4 is described as an eccentric cavitation with resorption along one side facing the marrow cavity and refill on the opposite side.
Our theory provides an explanation, but no function, for the inverse relationship between loading magnitude and osteon diameter. It is interesting to note that, from a mechanical point of view, it is beneficial to have smaller osteons in highly loaded regions for three reasons. First, the strength of the bone will be less affected during the generation of a new osteon if it creates a smaller cavity. Second, a large number of smaller osteons will be more efficient than a small number of larger osteons to reduce the effect of damage accumulation since cement lines effectively serve as barriers to crack propagation [34,78]. Third, it was suggested by Skedros et al. [105] that smaller osteon diameter in high-strain bone serves to enhance pullout resistance. Osteon pullout occurs when an osteon that bridges a crack, is pulled out from the bone on one side of the crack [40]. This requires debonding along its cement line surface. Osteon diameter affects the ratio between shear stress in the cement line and tensile stress on the osteon. Given a tensile force F on an osteon with diameter d and pullout length L, the tensile stress
σ on the osteon and the shear stress τ in the cement line are given by σ=4F/πd2
and τ=F/πdL. The ratio between τ and σ thus is τ/σ=d/4L. Theoretically, pullout is thus more likely when osteons are larger in diameter, because this increases shear stress in the cement line boundary relative to the tensile stress on the osteon [67]. Although we mention these benefits from strain-controlled osteon diameter, they should be seen in a wider perspective. In our current and previous paper, we hypothesize that one mechanism (strain-induced osteocytes inhibit osteoclasts) causes several phenomena, such as osteonal load-alignment, trabecular load-alignment, resorption of dead osteocytes, smaller osteon diameter in high-strain regions, double-ended osteons and drifting osteons. The functional meaning of this regulatory mechanism thus extends far beyond its effects on osteon diameter.
Acknowledgements This work was supported by the Netherlands Organization for Scientific Research, section Computational Life Sciences (NWO/CLS, grant number 635.100.014).


43
Chapter 4
3D Simulation of remodeling at the level of the cell and its deregulation in disuse
René F.M. van Oers, Bert van Rietbergen, Keita Ito, Peter A.J. Hilbers, Rik Huiskes accepted for publication in Osteoporosis International
Chapter 4
44
Abstract Summary: A load-adaptive bone remodeling theory is used to simulate remodeling at the level of the cell in three-dimensional models. It was found that the theory can successfully explain the formation of hemi-osteons in trabecular bone and full osteons in cortical bone and their de-regulation after disuse. Introduction: Osteoporosis can occur as the result of mechanical disuse. In recent studies, we developed a remodeling theory that explains bone remodeling at the level of the cell as the result of changes in local mechanical loading that is sensed by osteocytes which then regulate osteoblast and osteoclast activity. Using two-dimensional computer simulation modeling, we demonstrated that this theory can explain the coupling between osteoclast and osteoblast cells, the formation of trabeculae and cortical osteons and their adaptation to changes in mechanical loading. The goal of the present study is to extend the modeling to three dimensions and to investigate if it can explain the three-dimensional direction of resorption and the coupling of formation as well as the effects of disuse at the level of the cell. Methods: Finite element analysis is used to calculate the local mechanical strains resulting from external loads acting on the bone structure that either represents a single trabecula or a cortical osteon. Osteocytes within the bone are modeled to sense mechanical loading and emit a signal. This signal inhibits attachment of osteoclasts, which are explicitly represented using a cell simulation model, and stimulates bone formation by osteoblasts. Osteon development was simulated starting from an initial resorption cavity, first for normal and second for 25% reduced loading conditions. Results: In the cortical volume cylindrical osteons aligned to the principal loading direction developed. In the modeled trabecula, osteoclasts moved along the surface, creating hemi-osteons. In both situations a clear coupling between osteoclast and osteoblast activity was found. Reducing the load resulted in increased osteon diameter in cortical bone and perforation of the trabecula. Discussion: The model successfully captured typical bone remodeling characteristics at the level of the cell as a result of the strain-induced osteocyte signalling theory. Changes in remodeling after simulation of disuse concur with observations reported in the literature.
Introduction Osteoporosis can occur as the result of mechanical disuse. The reduced loading leads to loss of bone mass, deterioration of the trabecular architecture and increased porosity of cortical bone. Although it is clear that this deteriorative process is the net result of increased osteoclast activity that is not balanced by sufficient osteoblastic bone formation, the mechanism by which mechanical loading induces this process is still not fully understood. It has long been recognized that bones change their architecture in response to changes in mechanical load. Over a century ago Julius Wolff [136] correlated the orientation of trabeculae to principal stress directions. His contempary Wilhelm Roux [96] pioneered the thought that this architecture resulted from a remodeling process at the level of the cells based on local tissue strains. The format for this process was given by Frost's mechanostat theory [32]: removal of bone in disuse, addition of bone where it is overloaded. It was only with the
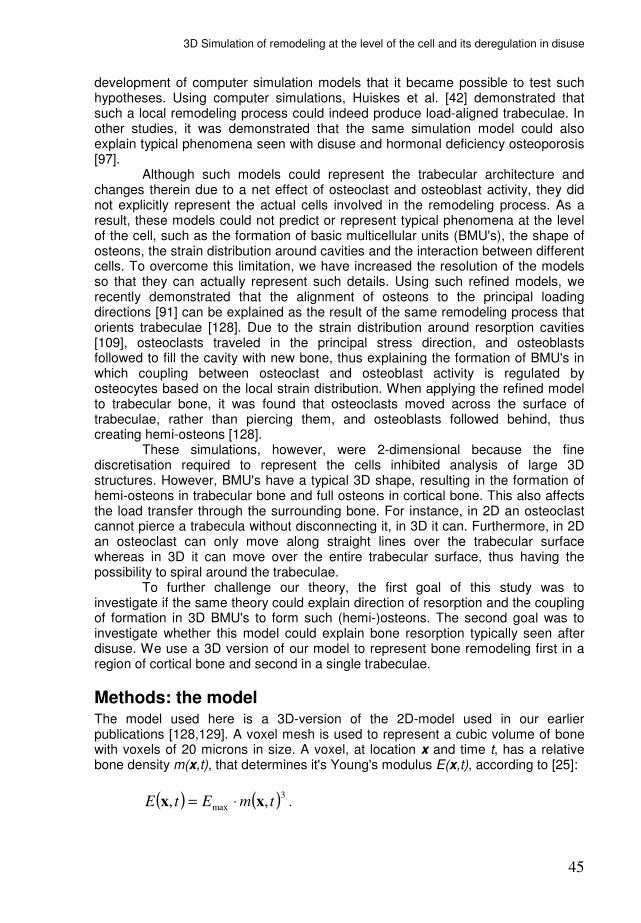
3D Simulation of remodeling at the level of the cell and its deregulation in disuse
45
development of computer simulation models that it became possible to test such hypotheses. Using computer simulations, Huiskes et al. [42] demonstrated that such a local remodeling process could indeed produce load-aligned trabeculae. In other studies, it was demonstrated that the same simulation model could also explain typical phenomena seen with disuse and hormonal deficiency osteoporosis [97]. Although such models could represent the trabecular architecture and changes therein due to a net effect of osteoclast and osteoblast activity, they did not explicitly represent the actual cells involved in the remodeling process. As a result, these models could not predict or represent typical phenomena at the level of the cell, such as the formation of basic multicellular units (BMU's), the shape of osteons, the strain distribution around cavities and the interaction between different cells. To overcome this limitation, we have increased the resolution of the models so that they can actually represent such details. Using such refined models, we recently demonstrated that the alignment of osteons to the principal loading directions [91] can be explained as the result of the same remodeling process that orients trabeculae [128]. Due to the strain distribution around resorption cavities [109], osteoclasts traveled in the principal stress direction, and osteoblasts followed to fill the cavity with new bone, thus explaining the formation of BMU's in which coupling between osteoclast and osteoblast activity is regulated by osteocytes based on the local strain distribution. When applying the refined model to trabecular bone, it was found that osteoclasts moved across the surface of trabeculae, rather than piercing them, and osteoblasts followed behind, thus creating hemi-osteons [128]. These simulations, however, were 2-dimensional because the fine discretisation required to represent the cells inhibited analysis of large 3D structures. However, BMU's have a typical 3D shape, resulting in the formation of hemi-osteons in trabecular bone and full osteons in cortical bone. This also affects the load transfer through the surrounding bone. For instance, in 2D an osteoclast cannot pierce a trabecula without disconnecting it, in 3D it can. Furthermore, in 2D an osteoclast can only move along straight lines over the trabecular surface whereas in 3D it can move over the entire trabecular surface, thus having the possibility to spiral around the trabeculae. To further challenge our theory, the first goal of this study was to investigate if the same theory could explain direction of resorption and the coupling of formation in 3D BMU's to form such (hemi-)osteons. The second goal was to investigate whether this model could explain bone resorption typically seen after disuse. We use a 3D version of our model to represent bone remodeling first in a region of cortical bone and second in a single trabeculae.
Methods: the model The model used here is a 3D-version of the 2D-model used in our earlier publications [128,129]. A voxel mesh is used to represent a cubic volume of bone with voxels of 20 microns in size. A voxel, at location x and time t, has a relative bone density m(x,t), that determines it's Young's modulus E(x,t), according to [25]:
( ) ( )3
max ,, tmEtE xx ⋅= .

Chapter 4
46
Finite element analysis (FEA) is used to calculate the local mechanical strains resulting from external loads acting on the bone structure. Osteocytes within the bone are assumed to sense a mechanical stimulus R, for which we use the local strain-energy-density (SED) rate as a correlate [8,41]. Based on this sensation, the osteocytes emit a biochemical signal. This signal decreases exponentially [54] in strength with increasing distance d from the osteocyte. Each element thus receives an accumulated signal S from nearby osteocytes, according to [41]:
( ) ( ) ( )∑=
−⋅⋅=n
i
Dd
iietRtS
1
,,,
xx
xx µ ,
where µ is the osteocyte mechanosensitivity and D is a diffusion-decay constant, xi is the position of osteocyte i and n is the number of osteocytes less than dinfl removed from x, where dinfl is a truncation distance for the osteocyte signal. When the osteocyte signal S is strong enough, it inhibits osteoclast attachment to the bone surface and their subsequent resorption activities. Osteoclasts are explicitly modeled, using a cell simulation method based on the cellular Potts model (CPM) [35,64]. This simulation method was extensively described in our previous paper [128] and is here briefly described in appendix A. What it amounts to is that an osteoclast is assumed to adhere to bone surfaces where the osteocyte signal is weak and proceeds to resorb this bone. We assume that new osteoclasts can originate, with origination probability OP, on exposed bone surfaces where the osteocyte signal is weak. We further assume that osteoclasts die when they are detached from the bone surface for a period Td [101]. Osteoblasts are recruited to exposed bone surfaces where the osteocyte signal exceeds a threshold Sobl for a period Tr. They then form bone according to:
( )( )x
tStSm oblobl
∆
∆⋅−⋅=∆ ,xτ ,
where the change in m(x,t) due to osteoblast activity is denoted with the index obl,
and τ determines the bone formation rate. It is covered with a layer of osteoblasts. Osteoclasts do not adhere to or originate on these surfaces.
Methods: the simulations Cortical remodeling is simulated in a 1.2x1.2x1.2 mm
3 piece of compact bone
tissue, subjected to a compressive load of 18 MPa. The load is directed at a 30 degree angle from the vertical. Osteoclasts start from an initial resorption cavity of 200 µm diameter. They are only 1 element in size at first, but quickly expand to the target volume V0 at the start of the simulation. Osteocytes are positioned in the bone tissue at a density of 44000 mm
−3 [82]. The simulation runs for 25
increments, representing a 12.5 day remodeling period. Trabecular remodeling is simulated on a single trabecula, which is 1 mm long and about 0.2 mm in diameter. The trabecula is subjected to a vertical load of 2 MPa. At the side is a 40 µm deep lacuna with initial osteoclasts. The simulation runs for 30 increments. To simulate disuse, both simulations were repeated with imposed loads lowered by 25%. All parameter settings are specified in appendix A.
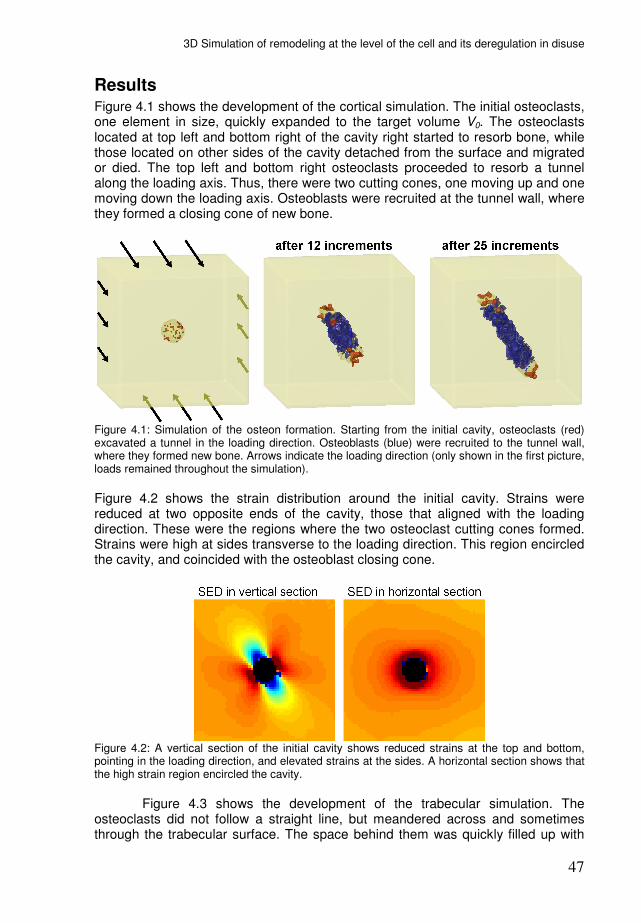
3D Simulation of remodeling at the level of the cell and its deregulation in disuse
47
Results Figure 4.1 shows the development of the cortical simulation. The initial osteoclasts, one element in size, quickly expanded to the target volume V0. The osteoclasts located at top left and bottom right of the cavity right started to resorb bone, while those located on other sides of the cavity detached from the surface and migrated or died. The top left and bottom right osteoclasts proceeded to resorb a tunnel along the loading axis. Thus, there were two cutting cones, one moving up and one moving down the loading axis. Osteoblasts were recruited at the tunnel wall, where they formed a closing cone of new bone.
Figure 4.1: Simulation of the osteon formation. Starting from the initial cavity, osteoclasts (red) excavated a tunnel in the loading direction. Osteoblasts (blue) were recruited to the tunnel wall, where they formed new bone. Arrows indicate the loading direction (only shown in the first picture, loads remained throughout the simulation).
Figure 4.2 shows the strain distribution around the initial cavity. Strains were reduced at two opposite ends of the cavity, those that aligned with the loading direction. These were the regions where the two osteoclast cutting cones formed. Strains were high at sides transverse to the loading direction. This region encircled the cavity, and coincided with the osteoblast closing cone.
Figure 4.2: A vertical section of the initial cavity shows reduced strains at the top and bottom, pointing in the loading direction, and elevated strains at the sides. A horizontal section shows that the high strain region encircled the cavity.
Figure 4.3 shows the development of the trabecular simulation. The osteoclasts did not follow a straight line, but meandered across and sometimes through the trabecular surface. The space behind them was quickly filled up with

Chapter 4
48
new bone, so that the trabecula maintained its load-bearing capacity. There was also some bone formation on the outer surface of the trabecula near the excavations.
Figure 4.3: Simulation of trabecular remodeling. At each of the shown increments, a 3D view of the trabeculae is shown as well as two horizontal sections. Osteoclasts (red) starting from the inital cavity, traveled across and sometimes through the trabecula. The space behind them was quickly filled with new bone (black).
When loads were lowered, the development of the osteons in both the cortical and trabecular simulations proceeded, but the characteristics of the osteons changed. In the cortical simulation, the two cutting cones and consequently, the cavity became much wider (Fig 4.4, left). The boundary between cutting and closing cone became less well-defined, some osteoclasts were still present where the closing cone should form. In the trabecular simulation, more osteoclasts were recruited and perforations were frequent (Fig 4.4, right). As the osteoblasts were slower to catch up, large perforations were seen in the trabecula.
Figure 4.4: The effects of disuse. In the cortical simulation, the cutting cones became much wider. In the trabecula, more osteoclasts were recruited, which frequently perforated the trabecula.
Discussion Osteons are cylindrical bone units, generally aligned to the first principal stress direction [91]. This suggests that the osteoclast cutting cone is steered by mechanical signals. We propose that strain-induced osteocyte signals at the sides of the cutting cone inhibit resorption in any other direction than the loading

3D Simulation of remodeling at the level of the cell and its deregulation in disuse
49
direction. We previously demonstrated, in 2D simulations, that this mechanism can steer tunneling osteoclasts in the loading direction [128]. Here we show, in 3D simulations, that it produces a cylindrical load-aligned osteon. The simulated osteon developed with two cutting cones, one moving up and one moving down the loading axis. This corresponds to the ‘proximal-distal tunneling’ described by Tappen [117] and the 'double-ended osteons' described by Johnson [49] as common forms of osteon development. In the simulation of trabecular remodeling osteoclasts meandered across the trabecular surface, both longitudinally and circumferentially. The osteoclasts sometimes went underneath the surface, but never perforated the trabecula under normal loading. It thus appears that osteocyte signalling did not restrict osteoclast directionality along the surface, but only in depth. Coupling of formation was evident. Bone formation, allowed by the model to occur anywhere on the trabecula, chiefly occured within the resorption cavities. When loading was lowered in the cortical simulation, the cutting cones became much wider, creating a larger cavity. There was a closing cone, but less well-defined as some osteoclasts were still present in this region. Immobilization studies on primates have shown that the size of resorption cavities is indeed deregulated in disuse, resulting in "unusually large" osteonal tunnels [141]. When loading was lowered in the trabecular simulation, the depth of resorption appeared to be no longer restricted, and the trabecula was frequently perforated. These perforations, however, appeared rather random throughout the trabecular volume and did not lead to complete cleavage of the trabeculae since the increase in loading in the remaining tissue inhibited its resorption. Using a similar remodeling simulation model, Mulvihill et al. [84] recently demonstrated that cleavage of trabeculae is likely to occur when assuming microdamage-targeted resorption. In their model, when stress concentrations under resorption lacunae were high enough to cause substantial microdamage before the lacuna got refilled, they induced ever deeper resorption by osteoclasts, thus leading to localization of the resorption. It thus is possible that implementing such rules could lead to further refinement of our model. In our model the biochemical pathways by which the cells influence each other are not detailed. We have assumed certain values for parameters that determine the temporal and spatial distribution of the osteocyte signal, which thus only represent phenomenological parameters. As soon as the precise biochemical pathways are known, however, their implementation will be straightforward. Models like this then have the important advantage that they can account for the spatial and temporal distribution of molecules. In our theory the coupling between osteoclast and osteoblast activity is purely regulated by strain-induced osteocyte signalling. To explain coupling, the existence of a direct coupling signal from osteoclasts to -blasts has often been hypothesized. A recent computer simulation study, assuming such a signal in combination with OPG signaling from osteoblasts to -clasts , was able to produce BMU's with well-defined closing cones and cutting cones [100]. Such theories, however, fail to explain typical load adaptation phenomena, such as the thinning of trabeculae and widening of osteons, that our mechano-biological theory can capture. Some other limitations of the model need to be discussed as well. First, we have only modeled a very small region of bone due to restrictions in computer resources. Nevertheless, we think the region used here is large enough to
Chapter 4
50
demonstrate the essential features of the remodeling process. Second, the growing osteon is simulated in a solid piece of bone without any other porosities, which simplifies the strain environment. It is conceivable that the numerous porosities and canals in cortical bone affect the shape and orientation of growing osteons. In conclusion: our theory earlier tested in 2D simulation studies was also able to explain the formation of 3D BMU’s in cortical and trabecular bone. It explained the formation of load-aligned circular osteons in cortical bone and of hemi-osteons at trabecular surfaces. It explained that the resorption depth on a loaded trabeculae is limited and that bone formation occurs (coupling) as a result of strain-induced osteocyte signalling. Our simulations also show how these processes are deregulated when loading is decreased, causing large cavities in cortical bone, and trabecular perforation in cancellous bone.
Appendix A: osteoclast cell model An osteoclast occupies several adjacent elements and may change position by occupying or leaving voxels. During so-called 'marrow moves' the cell tries to minimize an energy H:
( ) ( )∫ ⋅+−⋅=+=surf
surfvol dAAhVVHHH2
0λ .
The volume energy Hvol ensures that the osteoclast volume V remains close to a
target volume V0, where the inelasticity λ sets the strength of this constraint. V0 is based on a typical osteoclast diameter of 50 µm [29]. The surface energy Hsurf of an osteoclast is determined by its surroundings, as the contact energy h of a surface patch dA depends on the type of the neighboring element. Each possible
move of the cell will results in a change ∆H of the energy. The probability that the cell chooses one move over others depends on a move's weight w, which is calculated as:
H
ew∆⋅−= α
.
Moves that lower the energy get a larger weight and are therefore more likely. The
energy minimization parameter α determines how strongly the osteoclast prefers a configuration of minimum energy. The cell attaches to substrates with low h and detaches from substrates with high h, in order to minimize its surface energy. The contact energy to bone hb is a function of the osteocyte signal S in the neighboring bone element:
( ) ( )
−−=
m
mb
h
SSSShSh 010
0
)(
1
10
0
SSif
SSSif
SSif
>
≤≤
<
where hm is the contact energy to marrow, and S0 and S1 are two threshold signals. When the osteocyte signal is weak, hb is low, so that the osteoclast will achieve
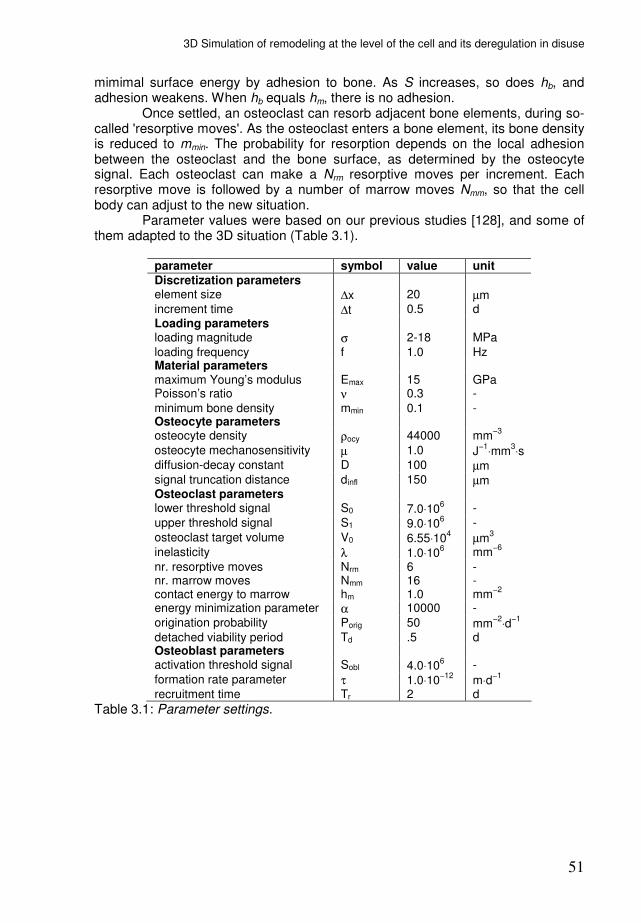
3D Simulation of remodeling at the level of the cell and its deregulation in disuse
51
mimimal surface energy by adhesion to bone. As S increases, so does hb, and adhesion weakens. When hb equals hm, there is no adhesion. Once settled, an osteoclast can resorb adjacent bone elements, during so-called 'resorptive moves'. As the osteoclast enters a bone element, its bone density is reduced to mmin. The probability for resorption depends on the local adhesion between the osteoclast and the bone surface, as determined by the osteocyte signal. Each osteoclast can make a Nrm resorptive moves per increment. Each resorptive move is followed by a number of marrow moves Nmm, so that the cell body can adjust to the new situation. Parameter values were based on our previous studies [128], and some of them adapted to the 3D situation (Table 3.1).
parameter symbol value unit
Discretization parameters element size ∆x 20 µm increment time ∆t 0.5
d
Loading parameters loading magnitude σ 2-18 MPa
loading frequency f 1.0 Hz Material parameters maximum Young’s modulus Emax 15
GPa
Poisson’s ratio ν 0.3
-
minimum bone density mmin 0.1 - Osteocyte parameters osteocyte density ρocy 44000
mm
−3
osteocyte mechanosensitivity µ 1.0 J−1
⋅mm3⋅s
diffusion-decay constant D 100
µm signal truncation distance dinfl 150 µm Osteoclast parameters lower threshold signal S0 7.0⋅10
6 -
upper threshold signal S1 9.0⋅106 -
osteoclast target volume V0 6.55⋅104
µm3
inelasticity λ 1.0⋅10
6 mm
−6
nr. resorptive moves Nrm 6 - nr. marrow moves Nmm 16 - contact energy to marrow hm 1.0 mm
−2
energy minimization parameter α 10000 -
origination probability Porig 50 mm−2
⋅d−1
detached viability period Td .5 d Osteoblast parameters activation threshold signal Sobl 4.0⋅10
6 -
formation rate parameter τ 1.0⋅10−12
m⋅d−1
recruitment time Tr 2 d
Table 3.1: Parameter settings.


53
Chapter 5
Simulations of trabecular remodeling and fatigue: is remodeling helpful or harmful?
René F.M. van Oers, Bert van Rietbergen, Keita Ito, Peter A.J. Hilbers, Rik Huiskes in preparation
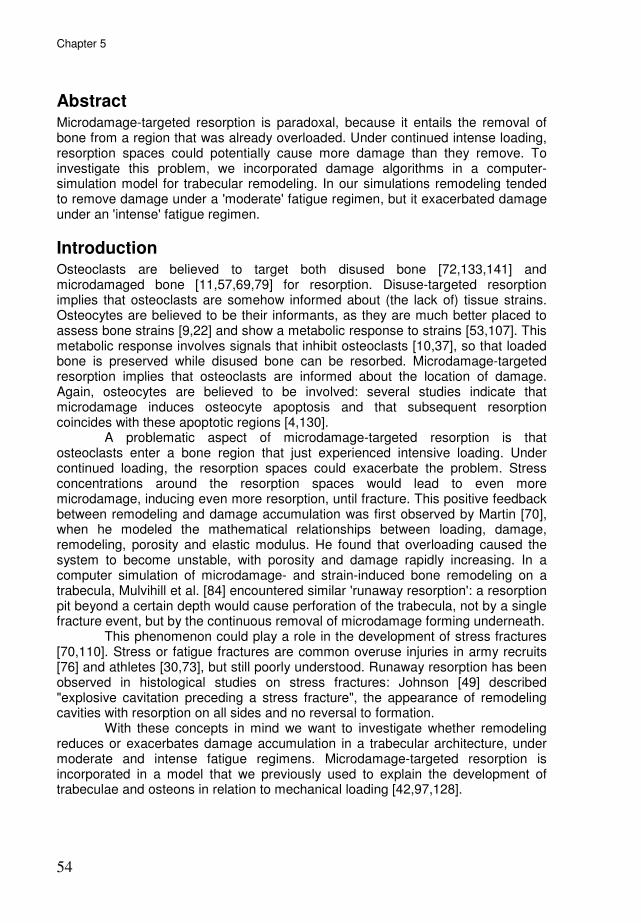
Chapter 5
54
Abstract Microdamage-targeted resorption is paradoxal, because it entails the removal of bone from a region that was already overloaded. Under continued intense loading, resorption spaces could potentially cause more damage than they remove. To investigate this problem, we incorporated damage algorithms in a computer-simulation model for trabecular remodeling. In our simulations remodeling tended to remove damage under a 'moderate' fatigue regimen, but it exacerbated damage under an 'intense' fatigue regimen.
Introduction Osteoclasts are believed to target both disused bone [72,133,141] and microdamaged bone [11,57,69,79] for resorption. Disuse-targeted resorption implies that osteoclasts are somehow informed about (the lack of) tissue strains. Osteocytes are believed to be their informants, as they are much better placed to assess bone strains [9,22] and show a metabolic response to strains [53,107]. This metabolic response involves signals that inhibit osteoclasts [10,37], so that loaded bone is preserved while disused bone can be resorbed. Microdamage-targeted resorption implies that osteoclasts are informed about the location of damage. Again, osteocytes are believed to be involved: several studies indicate that microdamage induces osteocyte apoptosis and that subsequent resorption coincides with these apoptotic regions [4,130]. A problematic aspect of microdamage-targeted resorption is that osteoclasts enter a bone region that just experienced intensive loading. Under continued loading, the resorption spaces could exacerbate the problem. Stress concentrations around the resorption spaces would lead to even more microdamage, inducing even more resorption, until fracture. This positive feedback between remodeling and damage accumulation was first observed by Martin [70], when he modeled the mathematical relationships between loading, damage, remodeling, porosity and elastic modulus. He found that overloading caused the system to become unstable, with porosity and damage rapidly increasing. In a computer simulation of microdamage- and strain-induced bone remodeling on a trabecula, Mulvihill et al. [84] encountered similar 'runaway resorption': a resorption pit beyond a certain depth would cause perforation of the trabecula, not by a single fracture event, but by the continuous removal of microdamage forming underneath. This phenomenon could play a role in the development of stress fractures [70,110]. Stress or fatigue fractures are common overuse injuries in army recruits [76] and athletes [30,73], but still poorly understood. Runaway resorption has been observed in histological studies on stress fractures: Johnson [49] described "explosive cavitation preceding a stress fracture", the appearance of remodeling cavities with resorption on all sides and no reversal to formation. With these concepts in mind we want to investigate whether remodeling reduces or exacerbates damage accumulation in a trabecular architecture, under moderate and intense fatigue regimens. Microdamage-targeted resorption is incorporated in a model that we previously used to explain the development of trabeculae and osteons in relation to mechanical loading [42,97,128].
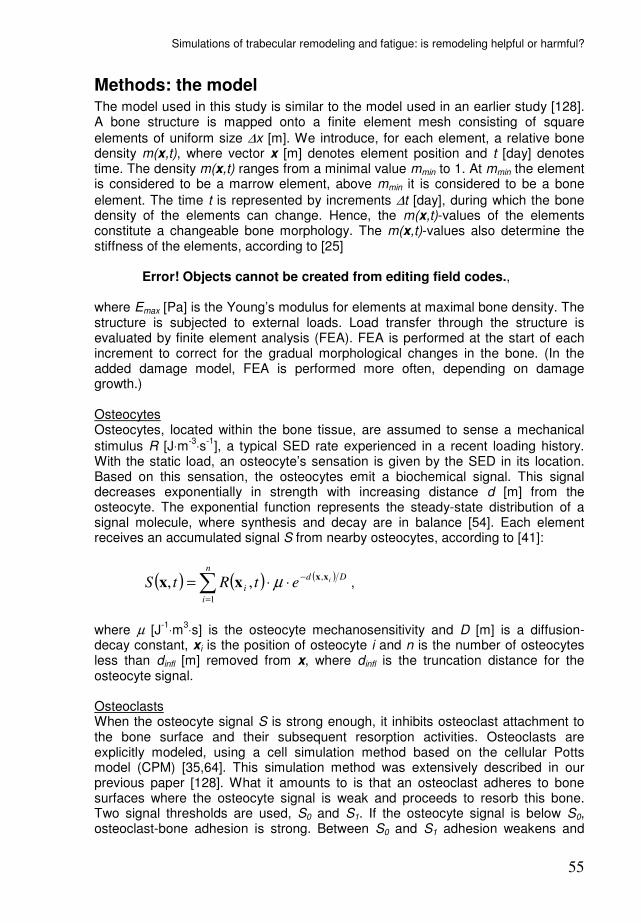
Simulations of trabecular remodeling and fatigue: is remodeling helpful or harmful?
55
Methods: the model The model used in this study is similar to the model used in an earlier study [128]. A bone structure is mapped onto a finite element mesh consisting of square
elements of uniform size ∆x [m]. We introduce, for each element, a relative bone density m(x,t), where vector x [m] denotes element position and t [day] denotes time. The density m(x,t) ranges from a minimal value mmin to 1. At mmin the element is considered to be a marrow element, above mmin it is considered to be a bone
element. The time t is represented by increments ∆t [day], during which the bone density of the elements can change. Hence, the m(x,t)-values of the elements constitute a changeable bone morphology. The m(x,t)-values also determine the stiffness of the elements, according to [25] Error! Objects cannot be created from editing field codes., where Emax [Pa] is the Young’s modulus for elements at maximal bone density. The structure is subjected to external loads. Load transfer through the structure is evaluated by finite element analysis (FEA). FEA is performed at the start of each increment to correct for the gradual morphological changes in the bone. (In the added damage model, FEA is performed more often, depending on damage growth.) Osteocytes Osteocytes, located within the bone tissue, are assumed to sense a mechanical
stimulus R [J⋅m-3
⋅s-1
], a typical SED rate experienced in a recent loading history. With the static load, an osteocyte’s sensation is given by the SED in its location. Based on this sensation, the osteocytes emit a biochemical signal. This signal decreases exponentially in strength with increasing distance d [m] from the osteocyte. The exponential function represents the steady-state distribution of a signal molecule, where synthesis and decay are in balance [54]. Each element receives an accumulated signal S from nearby osteocytes, according to [41]:
( ) ( ) ( )∑=
−⋅⋅=n
i
Dd
iietRtS
1
,,,
xx
xx µ ,
where µ [J-1
⋅m3⋅s] is the osteocyte mechanosensitivity and D [m] is a diffusion-
decay constant, xi is the position of osteocyte i and n is the number of osteocytes less than dinfl [m] removed from x, where dinfl is the truncation distance for the osteocyte signal. Osteoclasts When the osteocyte signal S is strong enough, it inhibits osteoclast attachment to the bone surface and their subsequent resorption activities. Osteoclasts are explicitly modeled, using a cell simulation method based on the cellular Potts model (CPM) [35,64]. This simulation method was extensively described in our previous paper [128]. What it amounts to is that an osteoclast adheres to bone surfaces where the osteocyte signal is weak and proceeds to resorb this bone. Two signal thresholds are used, S0 and S1. If the osteocyte signal is below S0, osteoclast-bone adhesion is strong. Between S0 and S1 adhesion weakens and

Chapter 5
56
above S1 there is no adhesion. The cell simulation method also ensures that osteoclast volume (the number of occupied elements) remains close to a target volume V0. This volume is based on a typical osteoclast diameter of 50 µm [29].
New osteoclasts can originate, with origination probability Porig [m−2
⋅d−1
], on exposed (i.e., not covered by osteoclasts or -blasts) bone surfaces with weak osteocyte signals (S<S0). Osteoclasts then resorb bone until strong osteocyte signals cause them to detach from the bone surface. They are removed if they remain detached for a period of more than Td [d]. Osteoblasts Osteoblasts are recruited to exposed bone surfaces where the osteocyte signal exceeds a threshold Sobl for a period Tr [d]. They then form bone according to
( )( )x
tStSm oblobl
∆
∆⋅−⋅=∆ ,xτ ,
where the change in m(x,t) due to osteoblast activity is denoted with the index obl,
and τ [m⋅day-1
] determines the bone formation rate. The newly formed bone is assumed to have the same osteocyte density as pre-existing bone. It is covered with a layer of osteoblasts. Osteoclasts do not adhere to or originate on these surfaces. If the signal falls below Sobl osteoblasts stop forming bone, but they remain on the bone surface as lining cells. If the signal decreases further below a threshold Slc, lining cells retract exposing the bone surface to osteoclasts. This lining cell function was not present in our previous study [128]. There, osteoclasts could originate rather indiscriminately on all exposed bone surfaces where no
osteoblasts were present (S<Sobl; Sobl=1.0⋅106), but their origination probability was
quite low (Porig=100 −1
d−1
). Here less of the surface is exposed (S<Slc; Slc=0.5⋅106),
but the osteoclast origination probability is higher (Porig=1000m−1
d−1
), to allow for a more focussed response to areas of damage. All other parameter settings are as in [128]. Damage The rules for damage accumulation in this study are similar to those used by McNamara and Prendergast [74], who in turn derived their damage rules from studies by Carter et al. [12]. We introduce, for each bone element, a relative damage ω(x,t) that ranges from 0 in undamaged bone to 1 in failed bone. Newly formed bone starts with zero damage. Damage then increases each increment according to:
tdt
dn
dn
d∆=∆
ωω ,
where dn/dt denotes the number of loading cycles per day, and dω/dn the damage per cycle. We will treat dn/dt as an input parameter representing the intensity of exercise. The damage per cycle is calculated as:
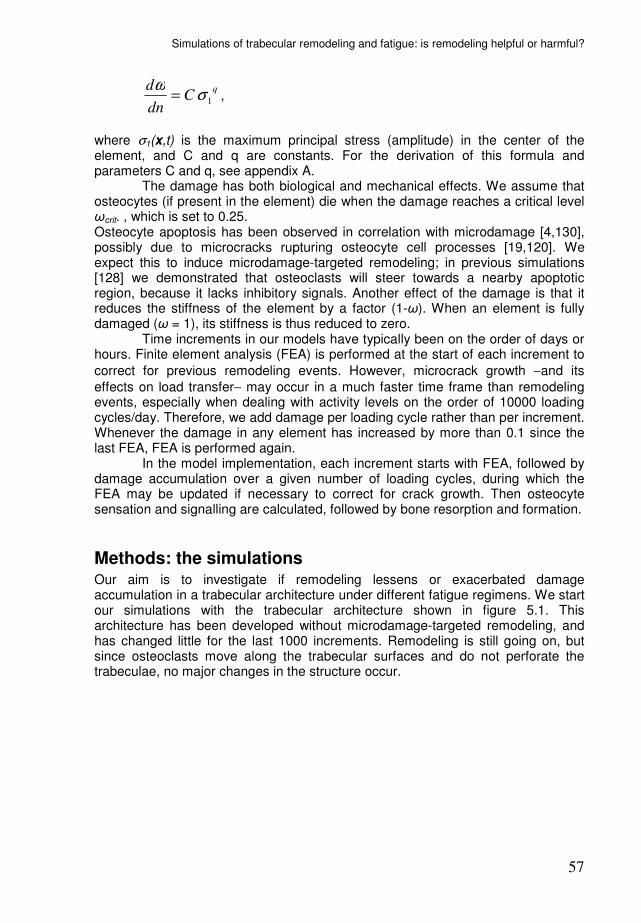
Simulations of trabecular remodeling and fatigue: is remodeling helpful or harmful?
57
q
Cdn
d1σ
ω= ,
where σ1(x,t) is the maximum principal stress (amplitude) in the center of the element, and C and q are constants. For the derivation of this formula and parameters C and q, see appendix A. The damage has both biological and mechanical effects. We assume that osteocytes (if present in the element) die when the damage reaches a critical level ωcrit. , which is set to 0.25. Osteocyte apoptosis has been observed in correlation with microdamage [4,130], possibly due to microcracks rupturing osteocyte cell processes [19,120]. We expect this to induce microdamage-targeted remodeling; in previous simulations [128] we demonstrated that osteoclasts will steer towards a nearby apoptotic region, because it lacks inhibitory signals. Another effect of the damage is that it reduces the stiffness of the element by a factor (1-ω). When an element is fully damaged (ω = 1), its stiffness is thus reduced to zero. Time increments in our models have typically been on the order of days or hours. Finite element analysis (FEA) is performed at the start of each increment to
correct for previous remodeling events. However, microcrack growth −and its
effects on load transfer− may occur in a much faster time frame than remodeling events, especially when dealing with activity levels on the order of 10000 loading cycles/day. Therefore, we add damage per loading cycle rather than per increment. Whenever the damage in any element has increased by more than 0.1 since the last FEA, FEA is performed again. In the model implementation, each increment starts with FEA, followed by damage accumulation over a given number of loading cycles, during which the FEA may be updated if necessary to correct for crack growth. Then osteocyte sensation and signalling are calculated, followed by bone resorption and formation.
Methods: the simulations Our aim is to investigate if remodeling lessens or exacerbated damage accumulation in a trabecular architecture under different fatigue regimens. We start our simulations with the trabecular architecture shown in figure 5.1. This architecture has been developed without microdamage-targeted remodeling, and has changed little for the last 1000 increments. Remodeling is still going on, but since osteoclasts move along the trabecular surfaces and do not perforate the trabeculae, no major changes in the structure occur.
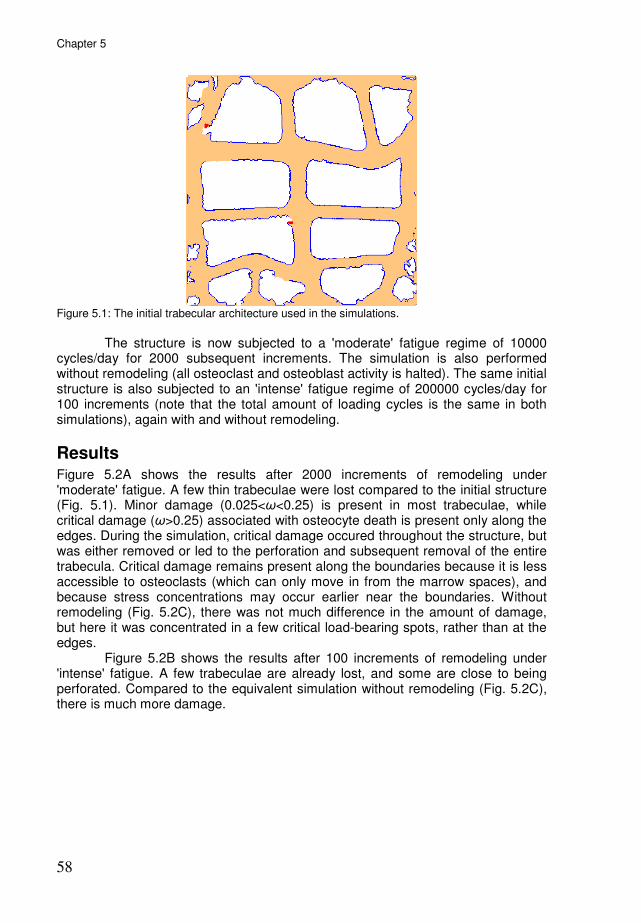
Chapter 5
58
Figure 5.1: The initial trabecular architecture used in the simulations.
The structure is now subjected to a 'moderate' fatigue regime of 10000 cycles/day for 2000 subsequent increments. The simulation is also performed without remodeling (all osteoclast and osteoblast activity is halted). The same initial structure is also subjected to an 'intense' fatigue regime of 200000 cycles/day for 100 increments (note that the total amount of loading cycles is the same in both simulations), again with and without remodeling.
Results Figure 5.2A shows the results after 2000 increments of remodeling under 'moderate' fatigue. A few thin trabeculae were lost compared to the initial structure (Fig. 5.1). Minor damage (0.025<ω<0.25) is present in most trabeculae, while critical damage (ω>0.25) associated with osteocyte death is present only along the edges. During the simulation, critical damage occured throughout the structure, but was either removed or led to the perforation and subsequent removal of the entire trabecula. Critical damage remains present along the boundaries because it is less accessible to osteoclasts (which can only move in from the marrow spaces), and because stress concentrations may occur earlier near the boundaries. Without remodeling (Fig. 5.2C), there was not much difference in the amount of damage, but here it was concentrated in a few critical load-bearing spots, rather than at the edges. Figure 5.2B shows the results after 100 increments of remodeling under 'intense' fatigue. A few trabeculae are already lost, and some are close to being perforated. Compared to the equivalent simulation without remodeling (Fig. 5.2C), there is much more damage.

Simulations of trabecular remodeling and fatigue: is remodeling helpful or harmful?
59
Figure 5.2: the results of moderate and intense fatigue, with and without remodeling, for an equivalent number of loading cycles. Black indicates critical damage (ω>0.25) and brown indicates minor damage (0.025<ω<0.25).
Figure 5.3: Zooming in on specific remodeling events. A) and B) show the removal of critical microdamage (black). C) Shows minor damage (brown) occurring underneath a resorption trench. D) Shows critical damage occuring underneath a resorption cavity, leading to perforation of the trabecula. The bar in the first picture of each sequence indicates a length of 100 µm.

Chapter 5
60
Figure 5.3 zooms in on specific remodeling events. Figures 5.3A and 5.3B, from the moderate fatigue simulation, show the removal of a patch with critical damage within a trabecula. Osteoclasts entered from one side, in both cases the left side, and dug into the damaged region. The removed region is later refilled, but note that the trabecula also accomodates by adding bone on the right side. Figure 5.3C, also from the moderate fatigue simulation, shows an osteoclast moving across an undamaged trabecula. Because there was no critical damage, the osteoclast remained on the surface. One can see however, that minor damage occurred direcly at the bottom of the trench, which after refilling of the trench appears as a line of minor damage within the trabecula. These 'minor damage lines' were seen in almost all trabeculae (see also Fig. 5.2). Figure 5.3D, from the intense fatigue simulation, shows the perforation of a trabecula. The cavity created by one osteoclast was so deep compared to the width of the trabecula that critical damage occured underneath. Refilling of the cavity was therefore hampered (the osteoblasts lacking osteocyte stimulation), and a subsequent osteoclast completely cut through the trabecula.
Discussion Our simulations show osteoclasts removing damage, but also creating and exacerbating damage until trabecular perforation. These events are in line with similar simulation results by Mulvihill et al. [84], who found that resorption pits beyond a certain depth were not refilled but invoked further resorption until perforation. Remodeling appears to be mostly beneficial under moderate fatigue, removing damage in many instances. Remodeling was mostly detrimental under intense fatigue, with resorption cavities creating more damage than they removed. It could be argued that this detrimental effect could be remedied with different regulation mechanisms for remodeling. However, fatigue fractures are frequently accompanied by large resorption cavities [110], so even if nature employs better regulation/repair mechanisms, it is not immune to this detrimental effect. As long as resorption responds faster to fatigue damage than formation, there will be a fatigue intensity at which the increase in damage accumulation due to the strain increase from resorption will exceed the damage removed by resorption. Where this point lies depends on how much damage was removed by the resorption response, to what extent that damage had already reduced tissue stiffness (effectively lowers the resorption-related strain increase), how fast formation catches up (determines the length of time for the resorption-related strain increase), and how fast damage accumulates. It should therefore be emphasized that we cannot quantitatively determine at which fatigue intensity remodeling becomes harmful, as this depends on the particular model and its parameters, but merely want to indicate the existence of such a point. One alternative regulation mechanism that could lessen this detrimental effect has to do with the effect of osteocyte death on bone formation. Trabecular perforation occurred not only due to the feedback loop between microdamage and the resorption thereof, but also because osteoblastic refill (or strengthening on the other side) is reduced. This is because the stimulatory signals between osteocytes and osteoblasts are lost after osteocyte death. These strain-induced stimuli from osteocytes to osteoblasts are perfect for explaining normal strain-based remodeling, but in fatigue remodeling they create a paradox: especially where the
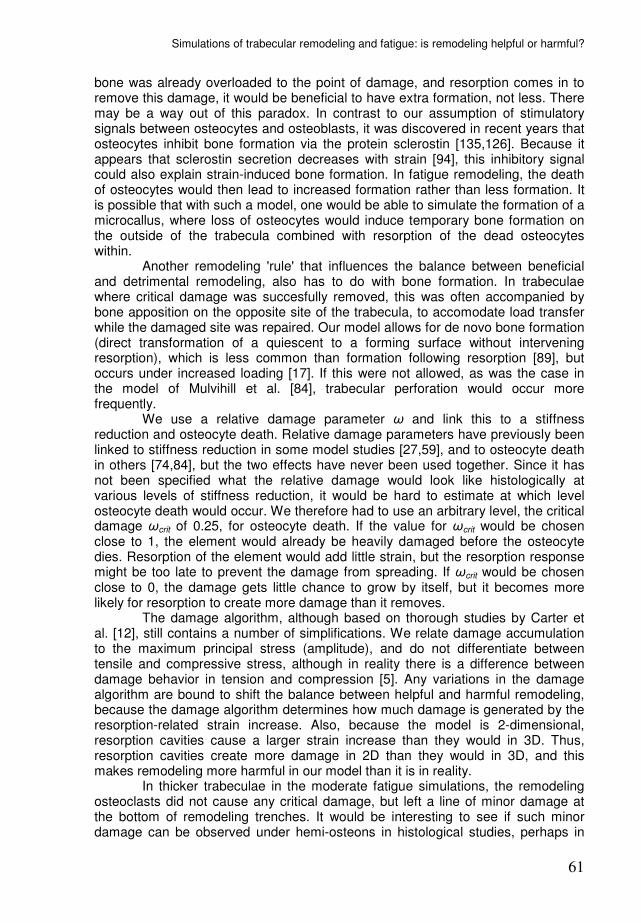
Simulations of trabecular remodeling and fatigue: is remodeling helpful or harmful?
61
bone was already overloaded to the point of damage, and resorption comes in to remove this damage, it would be beneficial to have extra formation, not less. There may be a way out of this paradox. In contrast to our assumption of stimulatory signals between osteocytes and osteoblasts, it was discovered in recent years that osteocytes inhibit bone formation via the protein sclerostin [135,126]. Because it appears that sclerostin secretion decreases with strain [94], this inhibitory signal could also explain strain-induced bone formation. In fatigue remodeling, the death of osteocytes would then lead to increased formation rather than less formation. It is possible that with such a model, one would be able to simulate the formation of a microcallus, where loss of osteocytes would induce temporary bone formation on the outside of the trabecula combined with resorption of the dead osteocytes within. Another remodeling 'rule' that influences the balance between beneficial and detrimental remodeling, also has to do with bone formation. In trabeculae where critical damage was succesfully removed, this was often accompanied by bone apposition on the opposite site of the trabecula, to accomodate load transfer while the damaged site was repaired. Our model allows for de novo bone formation (direct transformation of a quiescent to a forming surface without intervening resorption), which is less common than formation following resorption [89], but occurs under increased loading [17]. If this were not allowed, as was the case in the model of Mulvihill et al. [84], trabecular perforation would occur more frequently. We use a relative damage parameter ω and link this to a stiffness reduction and osteocyte death. Relative damage parameters have previously been linked to stiffness reduction in some model studies [27,59], and to osteocyte death in others [74,84], but the two effects have never been used together. Since it has not been specified what the relative damage would look like histologically at various levels of stiffness reduction, it would be hard to estimate at which level osteocyte death would occur. We therefore had to use an arbitrary level, the critical damage ωcrit of 0.25, for osteocyte death. If the value for ωcrit would be chosen close to 1, the element would already be heavily damaged before the osteocyte dies. Resorption of the element would add little strain, but the resorption response might be too late to prevent the damage from spreading. If ωcrit would be chosen close to 0, the damage gets little chance to grow by itself, but it becomes more likely for resorption to create more damage than it removes. The damage algorithm, although based on thorough studies by Carter et al. [12], still contains a number of simplifications. We relate damage accumulation to the maximum principal stress (amplitude), and do not differentiate between tensile and compressive stress, although in reality there is a difference between damage behavior in tension and compression [5]. Any variations in the damage algorithm are bound to shift the balance between helpful and harmful remodeling, because the damage algorithm determines how much damage is generated by the resorption-related strain increase. Also, because the model is 2-dimensional, resorption cavities cause a larger strain increase than they would in 3D. Thus, resorption cavities create more damage in 2D than they would in 3D, and this makes remodeling more harmful in our model than it is in reality. In thicker trabeculae in the moderate fatigue simulations, the remodeling osteoclasts did not cause any critical damage, but left a line of minor damage at the bottom of remodeling trenches. It would be interesting to see if such minor damage can be observed under hemi-osteons in histological studies, perhaps in

Chapter 5
62
the form of diffuse damage, which is a lighter type of damage preceding microcracks [26]. In conclusion, we included microdamage within a model that was previously used to explain strain-based remodeling. We observed resorption removing microdamage followed by refilling with healthy bone, but also resorption exacerbating the microdamage until perforation. The latter phenomenon was previously indicated by other studies [70,84], and may be part of the etiology of stress fractures [49,70,110]. The balance between these two effects, microdamage repair and exacerbation, may differ depending on the various assumptions about signaling between bone cells. Various bone remodeling theories may need to be reviewed for their effect on this balance.
Acknowledgements This work was supported by the Netherlands Organization for Scientific Research, section Computational Life Sciences (NWO/CLS, grant number 635.100.014).
Appendix A. Damage per loading cycle. The damage per cycle is often approximated from the number of cycles to failure Nf as measured in fatigue tests:
fNdn
d 1=
ω.
Fatigue tests count Nf for specimens at various stress amplitudes σ [MPa]. Log-log plots from these tests generally follow:
( ) ( ) BAN f += σloglog ,
but there is much variation in constants A and B between different fatigue tests [24]. To account for this variation, Carter et al. [12] looked at a number of experimental and specimen variables, and produced the following formula:
( ) ( ) MKTJHN f +++= ρσ1010 loglog .
Here T [°C] is temperature, ρ [g/cm3] is density, M depends on the microstructure
(primary bone or secondary haversian bone), and H, J, and K are constants. Our damage rule is based on this formula, using the values specified in Table 5.1. These derive from Carter et al. [12], with M as given for a secondary Haversian
microstructure, and a density ρ of cortical bone. The reader might wonder why we use a cortical instead of a trabecular bone density, if our simulation is clearly of trabecular bone. This is because we apply the damage rule to individual elements within the trabeculae rather than the specimen as a whole. These elements have a higher density than the whole volume, and experience higher stresses than the whole volume. Table 5.1: Constants in damage formula.
Simulations of trabecular remodeling and fatigue: is remodeling helpful or harmful?
63
Parameter Value
T 37°C
ρ 1.95 g/cm3
M 15.470 H -7.789 J -0.0206 K 2.364
From the above formula, it follows that
HMKTJ
fN σρ ++= 10 ,
and the damage per cycle can now be written as:
qHMKTJ
Cdn
dσσ
ω ρ == −−−−10 ,
with C=10-JT-Kρ-M
and q=-H. Using the values from table 1, we determine C as
4.813⋅1020
MPa-1
and q as 7.798.


65
Chapter 6
A sclerostin-based theory for strain-induced bone formation
René F.M. van Oers, Bert van Rietbergen, Keita Ito, Peter A.J. Hilbers, Rik Huiskes submitted to Biomechanics and Modeling in Mechanobiology

Chapter 6
66
Abstract Bone formation responds to mechanical loading, which is believed to be mediated by osteocytes. Previous theories assumed that loading stimulates osteocytes to secrete signals that stimulate bone formation. In computer simulations this 'stimulatory' theory successfully produced load-aligned trabecular structures. In recent years, however, it was discovered that osteocytes inhibit bone formation via the protein sclerostin. To reconcile this with strain-induced bone formation, one must assume that sclerostin secretion decreases with mechanical loading. This leads to a new ‘inhibitory' theory in which loading inhibits osteocytes from inhibiting bone formation. Here we used computer simulations to show that a sclerostin-based model is able to produce a load-aligned trabecular architecture. An important difference appeared when we compared the response of the stimulatory and inhibitory models to loss of osteocytes, and found that the inhibitory pathway prevents the loss of trabeculae that is seen with the stimulatory model. Further, we demonstrated with combined stimulatory/inhibitory models that the two pathways can work side-by-side to achieve a load-adapted bone architecture.
Introduction It is well known that increased mechanical loading will lead to an increase in bone mass whereas a state of reduced loading will lead to bone resorption, a finding often referred to as 'Wolff's law' [136]. These changes in bone mass are the net result of a change in activity of bone forming cells (osteoblasts) and/or bone resorbing cells (osteoclasts). It is generally assumed now that these changes in cell activity are regulated by osteocytes, because they are strategically located within the bone's lacuno-canalicular network [9], and because they show a metabolic response to bone loading [107]. However, how, exactly, osteocytes regulate osteoblasts and/or osteoclasts is still unknown. In earlier studies we hypothesized that osteocytes sense strains, and in response send signals to stimulate osteoblasts. Using computer simulation models, we demonstrated that this mechanism can explain the formation of trabecular-like architectures that adapt to changes in loading magnitude and direction [42,97]. Although the exact nature of this stimulus was not detailed, we assumed this to be some biochemical messenger molecule, the secretion of which is increased by mechanical loading. In contrast to this 'stimulatory' model, it was found in recent years that osteocytes inhibit bone formation via the protein sclerostin [126,135]. To reconcile this information with strain-induced bone formation, one needs to assume that sclerostin production by osteocytes decreases with mechanical loading. A recent study by Robling et al. [94] confirms this assumption: in vivo loading of rat and mice forelimbs significantly reduced sclerostin secretion by osteocytes in the loaded forelimb. A new theory for strain-induced bone formation is thus a case of 'minus times minus equals plus': mechanical loading inhibits the inhibition of bone formation. Although the pathways by which an inhibitory model and a stimulatory model work are very different, their net effect could be the same. Both models will result in an increase in bone formation when mechanical loading is high and a decrease in bone formation when loading is low. We therefore expect that the
A sclerostin-based theory for strain-induced bone formation
67
inhibitory model, like the stimulatory model, is able to produce load-aligned trabeculae that adapt to changing loading conditions. Although the response to mechanical loading might be similar under normal circumstances, differences can be expected in situations where osteocytes are lost or osteocyte signaling is disrupted, for example due to microdamage. Whereas a reduction in osteocytes would lead to decreased bone formation in the stimulatory model, it would lead to increased bone formation in the inhibitory model since in that case less sclerostin is produced to inhibit osteoblast activity. The consequences of this difference in behavior on bone structure and remodeling, however, are hard to predict. Finally, it should be noted that the stimulatory and inhibitory model are not mutually exclusive. It is possible that osteocytes stimulate osteoblasts at higher loading conditions and inhibit osteoclast activity at lower loading conditions using different biochemical pathways. The consequences of this combined behavior on bone structure and remodeling obviously are even more difficult to predict. In the present study we aim at clarifying these issues by using a computer simulation approach. The first goal of this study is to investigate if a sclerostin-based inhibitory model will also produce trabecular-like structures that align to the loading conditions. A second goal is to investigate and compare the response of the stimulatory and inhibitory model to the loss of osteocytes. A final goal is to investigate if a combined stimulatory/inhibitory model is viable and whether it would produce similar results.
Methods: the model Our sclerostin-based inhibitory model is based on and compared to the stimulatory model by Huiskes et al. [42]. This will be described first, after which we will address the changes made for the inhibitory model and the combined model. The stimulatory model A bone structure is mapped onto a finite element mesh consisting of square
elements of uniform size ∆x. An element, at location x and at time t, has a relative bone density m(x,t) (a density that varies from 0 to 1), that determines its Young's modulus E(x,t), according to [25]:
( ) ( )3
max ,, tmEtE xx ⋅= .
Finite element analysis (FEA) is used to calculate the local mechanical strains resulting from external loads acting on the bone structure. Osteocytes within the bone (elements with m(x,t) > 0.5) are assumed to sense a mechanical stimulus R, for which we use the local strain-energy-density (SED) rate as a correlate [8,41].
Note that we use a static load to represent a cylic load of given amplitude σ and
frequency f. The magnitude of the static load σ’ is chosen such that the resulting strain energy density (SED) equals the peak SED rate of the dynamic load:
fσσ 02.2'= .
For a derivation of this formula, see Huiskes [41] or Ruimerman et al. [98].
Chapter 6
68
In the stimulatory model an osteocyte i responds to this mechanosensation by emitting a signal sti (Fig. 6.1, top left):
( ) µ⋅= tRtst ii ,)( x ,
depending on the mechanical stimulus at its location xi and osteocyte mechanosensitivity µ. The signal is assumed to decrease exponentially in strength with increasing distance d from the osteocyte. The exponential function represents the steady-state distribution of a signal molecule, where synthesis and decay are in balance [54]. Each element at the bone surface receives an accumulated signal St from n nearby osteocytes, according to:
( ) ( ) ( )∑=
−⋅=n
i
Dd
iietsttSt
1
,,
xx
x ,
where D is a diffusion-decay constant, xi is the position of osteocyte i and n is the number of osteocytes less than dinfl removed from x, where dinfl is a truncation distance for the osteocyte signal. Osteoblasts are recruited to bone surfaces where the signal exceeds a threshold k. They then form bone according to (Fig. 6.1, top right):
( )( )ktStmobl −⋅=∆ ,xτ ,
where the change in m(x,t) due to osteoblast activity is denoted with the index obl,
and τ determines the bone formation rate. Osteoclast activity is represented by resorption cavities occuring randomly along the trabecular surface, with a probability pocl. If an element on the bone surface is subject to osteoclastic resorption, m(x,t) is decreased by an amount rocl:
oclocl rm −=∆ .
An alternative version of Huiskes' model [42] had osteoclast activity inhibited by strain-induced osteocyte signals, and this was also central to our extended version of the model [128], where osteoclasts were explicitly modeled and guided by osteocyte signals. In this study we have chosen for random resorption, however, to ensure that any adaptation to mechanical loading is the result of osteocyte-osteoblast crosstalk.

A sclerostin-based theory for strain-induced bone formation
69
Figure 6.1: Relations from osteocyte sensation (µ R) to bone formation (∆mobl). In the stimulatory
model, mechanical loading (~µ R) stimulates the secretion of a signal (st) that stimulates bone
formation (∆mobl). In the inhibitory model, mechanical loading (~µ R) inhibits the secretion of a
signal (sc) that inhibits bone formation (∆mobl).
The inhibitory model In the inhibitory model the osteocyte is assumed to secrete a signal (sclerostin) sci
when its mechanical sensation is below a threshold α, according to (Fig. 6.1, bottom left):
( ) αµ⋅−= tRtsc ii ,1)( x .
Like the stimulatory signal sti, the inhibitory signal sci is assumed to decrease in strength with increasing distance. Elements at the bone surface receive an accumulated signal Sc:
( ) ( ) ( )∑=
−⋅=n
i
Dd
iietsctSc
1
,,
xx
x ,
where we assume the same diffusion-decay constant D as for the stimulatory
signal. Osteoblasts form bone when Sc falls below a threshold β, according to (Fig. 6.1, bottom right):
( )( )βγ tStmobl ,1 x−⋅=∆ ,
where γ defines the bone formation amount at zero sclerostin. The combined model In the combined model we assume that both pathways exist alongside each other, and both the stimulatory signal st and the inhibitory signal sc are being produced by osteocytes. For the resulting bone formation, we sum the formations of the above two models:

Chapter 6
70
( )( ) ( )( )βγτ tStktStmobl ,1,21
21
xx −⋅+−⋅=∆ .
The two formation components were halved to maintain a formation rate similar to the single pathway models. They can also be combined such that one pathway predominates. We will use one combined model where the stimulatory pathway predominates:
( )( ) ( )( )βγτ tStktStmobl ,1,41
43
xx −⋅+−⋅=∆ ,
and another where the inhibitory pathway predominates:
( )( ) ( )( )βγτ tStktStmobl ,1,43
41
xx −⋅+−⋅=∆ .
We will refer to these three combined models as the (50/50)-, (75/25)-, and (25/75)-combined model, respectively. Model adaptation to prevent undesired discretization effects During preliminary testing of the inhibitory model, we observed an unexpected effect of the discretization. This effect is described and explained in appendix A. To prevent it we have chosen the following approach: before an element is half-filled (m(x,t) > 0.5) its formation rate is determined by the formation rates as calculated for its neigboring bone elements (only counting those with m(xnb,t) > 0.5).
( )( )
( )( )
−⋅
−⋅=∆∑
βγ
βγ
tSc
tScm nb
nb
obl
,1
,141
x
x
( )( ) 5.0,
5.0,
>
≤
tmif
tmif
x
x
Although, as appendix A explains, the effect will not occur in the stimulatory model, for the sake of honest comparison we also introduce the same approach here:
( )( )
( )( )
−⋅
−⋅=∆∑
ktSt
ktStm nb
nb
obl
,
,41
x
x
τ
τ
( )( ) 5.0,
5.0,
>
≤
tmif
tmif
x
x
and these changes are likewise incorporated in the combined models.
Methods: the simulations For all models, trabecular remodeling is simulated in a 4x4 mm
2 domain, initially an
arbitrary, porous bone lattice (Fig. 6.2, left). The domain is subjected to a 6.06 MPa compressive load in the vertical direction and a tensile load in the horizontal direction. This is continued for 300 model increments. The loading direction is then changed by 30 degrees, and the structure is allowed to adapt for another 300 increments. We also investigate the response of these models to a pathological situation with severe osteocyte death. 75% of osteocytes are removed at random

A sclerostin-based theory for strain-induced bone formation
71
from the previously generated trabecular structures, and the model is allowed to recover for 200 increments. Newly built bone has a normal osteocyte density. All parameters are given in table 6.1.
parameter symbol value unit
element size ∆x 40 µm
maximum Young’s modulus Emax 15
GPa Poisson’s ratio ν 0.3
-
osteocyte density ρocy 1600
mm−2
osteocyte mechanosensitivity µ 1.0 J−1
⋅m3
sensation limit for sclerostin secretion α 4.0⋅104
diffusion-decay constant D 100
µm stimulus threshold for bone formation k 8.0⋅10
4 -
formation to stimulus rato τ 2.5⋅10−7 -
sclerostin limit for bone formation β 5.0 -
formation amount at zero sclerostin γ 0.3 -
resorption amount rocl 0.3 - resorption probability pocl 0.2 -
Table 6.1: Parameter settings.
Results As resorption events disconnected some of the initial struts, strains in the remaining load-bearing struts increased. In the stimulatory model this induced more secretion of osteocyte signals, which in turn induced bone formation that thickened these struts. Other struts that did not contribute to the main lines of load transfer, were not strengthened by bone formation and got resorbed. Within about 50 increments, the main trabecular architecture was defined. After that a few thin trabeculae were removed, but at 300 increments the structure (Fig. 6.2, middle) was clearly in equilibrium and well-adapted to its loading conditions. Changing the load direction caused high strains at the trabecular edges closest to the new stress trajectories, which in turn induced rapid bone formation along those edges. Redundant bone at the opposing edges was gradually removed. In this process some trabeculae were lost. The result was a trabecular structure that was aligned to the new loading direction (Fig. 6.2, right).
Figure 6.2: Trabecular modeling and adaptation in the stimulatory model.
In the inhibitory model, low strains in the initial lattice corresponded to sclerostin secretion throughout the structure, which suppressed bone formation. As resorption events disconnected struts, strains increased in the remaining load-bearing struts. This strain increase reduced the local secretion of sclerostin to a level that allowed thickening of these struts. A trabecular architecture (Fig. 6.3, middle) was formed, aligned to the imposed loading directions. When load
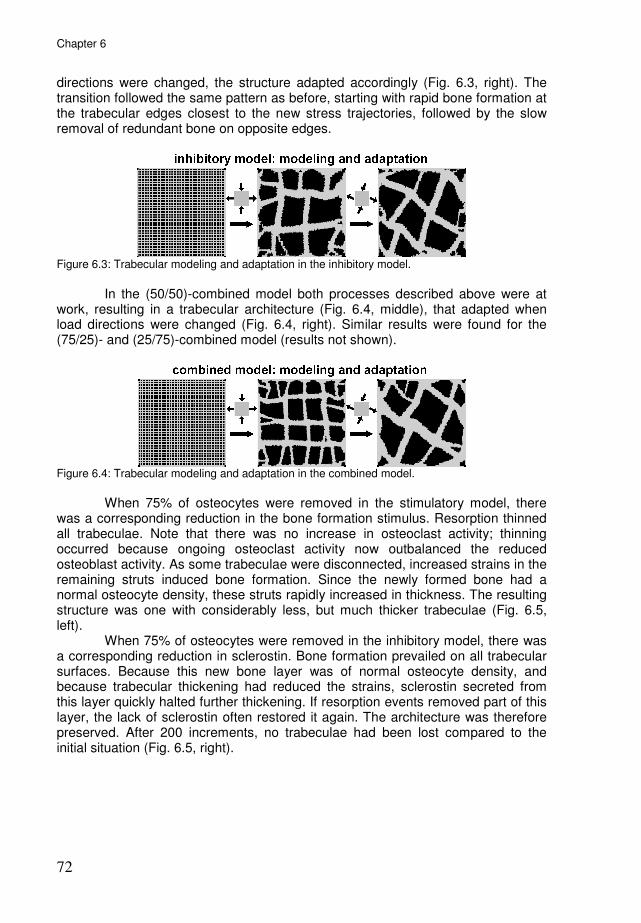
Chapter 6
72
directions were changed, the structure adapted accordingly (Fig. 6.3, right). The transition followed the same pattern as before, starting with rapid bone formation at the trabecular edges closest to the new stress trajectories, followed by the slow removal of redundant bone on opposite edges.
Figure 6.3: Trabecular modeling and adaptation in the inhibitory model.
In the (50/50)-combined model both processes described above were at work, resulting in a trabecular architecture (Fig. 6.4, middle), that adapted when load directions were changed (Fig. 6.4, right). Similar results were found for the (75/25)- and (25/75)-combined model (results not shown).
Figure 6.4: Trabecular modeling and adaptation in the combined model.
When 75% of osteocytes were removed in the stimulatory model, there was a corresponding reduction in the bone formation stimulus. Resorption thinned all trabeculae. Note that there was no increase in osteoclast activity; thinning occurred because ongoing osteoclast activity now outbalanced the reduced osteoblast activity. As some trabeculae were disconnected, increased strains in the remaining struts induced bone formation. Since the newly formed bone had a normal osteocyte density, these struts rapidly increased in thickness. The resulting structure was one with considerably less, but much thicker trabeculae (Fig. 6.5, left). When 75% of osteocytes were removed in the inhibitory model, there was a corresponding reduction in sclerostin. Bone formation prevailed on all trabecular surfaces. Because this new bone layer was of normal osteocyte density, and because trabecular thickening had reduced the strains, sclerostin secreted from this layer quickly halted further thickening. If resorption events removed part of this layer, the lack of sclerostin often restored it again. The architecture was therefore preserved. After 200 increments, no trabeculae had been lost compared to the initial situation (Fig. 6.5, right).

A sclerostin-based theory for strain-induced bone formation
73
Figure 6.5: Response to 75% osteocyte loss for all five models. In the stimulatory model model resorption prevailed initially and many trabeculae were lost. This effect was seen to a lesser extent in the (75/25)-combined model. In the other combined models and the inhibitory model the structure was preserved.
In the (75/25)-combined model a few trabeculae were lost (Fig. 6.5, second column), but much less than in the completely stimulatory model. In the (50/50)-combined model, osteocyte removal had practically no effect. The potential effect that a drop in stimulatory signals could have on bone formation appeared to be compensated by a similar drop in sclerostin. The structure (Fig. 6.5, middle) was maintained. The (25/75)-model behaved much like the completely inhibitory model and no trabeculae were lost.
Discussion Our simulations show that a sclerostin-based model is able to produce a load-aligned trabecular architecture that adapts when the loading conditions are changed. In this context it is necessary that mechanical stimuli reduce sclerostin secretion by osteocytes, as was recently confirmed by Robling et al. [94]. Compared to our previous stimulatory model, where strains stimulate osteocytes to stimulate osteoblasts, this model is the exact reverse: strains inhibit the inhibition of bone formation. The result is just the same. The real functional implications appear when osteocytes are lost. In the stimulatory model this dramatically reduces bone formation, in the inhibitory model it does the opposite. Consequently, many trabeculae were lost in the stimulatory model, whereas the structure was protected in the inhibitory model. This is not entirely advantageous, since the bone with the dead osteocytes is not renewed. It should be emphasized that we excluded any effects of osteocyte death on osteoclast activity. In this study we chose for random resorption, to ensure that any adaptation to mechanical load resulted from osteocyte-osteoblast crosstalk, be it via the stimulatory or the inhibitory pathway. However, it is believed that osteoclasts target dead osteocytes for resorption [4,130]. If the stimulatory model were combined with such targeted resorption, loss of osteocytes would result in an even greater loss of trabeculae than was seen here. If the inhibitory model were combined with targeted resorption, loss of osteocytes could induce temporary bone formation (a microcallus) on the outside of the trabecula combined with resorption

Chapter 6
74
of the dead osteocytes within. This combination has a better potential to preserve trabecular connectivity during removal of the dead bone. Likewise, the two models would show different behavior when osteocytes are absent from the start, such as in the remodeling of scaffolds or the turnover of calcified cartilage. The stimulatory model predicts little bone formation in such cases, whereas the inhibitory model predicts the exact opposite. Recently, Cox et al. [23] used computer simulations based on the stimulatory model to study the replacement of calcified cartilage by bone under the growth plate. They found that osteocytes at the bone-cartilage interface were able to facilitate this turnover via the stimulatory pathway. Nevertheless, the process might be facilitated even more via the inhibitory pathway, which would promote bone formation further from the bone-cartilage interface. The simulations with the combined models also produced a trabecular-like architecture that aligned to the loading conditions. It must be mentioned however, that the two pathways were combined simply by adding their effects. Without precise knowledge of both pathways, and where they act on the osteoblast cellular events leading to bone formation, this approach seems reasonable. What the combined model shows is that the regulation mechanism does not need to be either stimulatory or inhibitory, but can include both pathways. Regarding the response to osteocyte loss, the addition of the inhibitory pathway prevented loss of trabeculae, even in the (75/25)-combined model where the stimulatory pathway predominated. For the new inhibitory model, we assume that the secretion of sclerostin is inhibited by mechanical loading. A simple linear decrease in relation to strain-energy-density (SED) is used to capture this assumption, whereas in actual bone this might be a nonlinear decrease in relation to strain-induced fluid flow. On the receiving side, the osteoblastic reaction to osteocytic sclerostin is also implemented with a simple linear relation. Note that the older stimulatory pathway was also implemented with simple linear relations. We did not intend to present the precise physiological parameter values for these pathways here. We intended to demonstrate that, when mechanical loading "stimulates the stimulation" and/or "inhibits the inhibition" of bone formation, load-aligned structures can be produced. Whatever the precise relation, if mechanical loading were to increase sclerostin secretion, this would not facilitate the emergence of a load-aligned bone architecture. We further intended to demonstrate that these two pathways react differently to osteocyte loss. Whether osteoblast reaction to the stimulatory and inhibitory signals is linear or non-linear, this difference remains. Currently the inhibitory pathway via sclerostin receives a lot of attention, but there are also several studies pointing to stimulatory pathways [36,45,118,119,131]. Tatsumi et al. [118] were able to specifically kill 70-80% of osteocytes in mice, via a toxin that did not directly affect other bone cells; although they observed a marked decrease in sclerostin mRNA, they did not observe an increase in osteoblast activity, which lead them to suggest that "it is conceivable that in addition to negative regulators such as sclerostin, one or more positive regulators are produced by osteocytes". Taylor et al. [119] cocultured osteocytes exposed to fluid flow with osteoblasts shielded from this flow but connected to the osteocytes via gap junctions: fluid flow on osteocytes led to increased alkaline phosphatase activity in osteoblasts, but not if gap junctions were blocked. This indicates that there was a stimulatory signal reaching the osteoblasts via gap junctions. These stimulatory signals have not been identified yet. Prostaglandins

A sclerostin-based theory for strain-induced bone formation
75
have been implicated [9,16], but their role is unclear [113,119], and may have to do more with regulating osteocyte gap junctions [15], than directly stimulating osteoblast activity. But whatever the nature of this stimulatory signal, it need not conflict with the inhibitory pathway at all. The existence of multiple pathways only makes the system more robust. As the combined model has shown, the inhibitory and stimulatory model are not mutually exclusive, but can work side-by-side to achieve a load-adapted bone architecture.
Acknowledgements This work was supported by the Netherlands Organization for Scientific Research, section Computational Life Sciences (NWO/CLS, grant number 635.100.014).
Appendix A: discretization effect in the inhibitory model During preliminary testing of the inhibitory model, an unexpected effect was observed. The emerging trabeculae were covered with multiple protrusions, as shown in figure 6.6.
Figure 6.6: Trabeculae covered with protrusions in the inhibitory model.
We believe that this is not inherent to the proposed regulation mechanism, but a model artifact, which is explained in figure 6.7. Imagine for a moment that there would be such protrusions on a real trabecula (Fig. 6.7, left). These protrusions would be unloaded, in contrast to the center of the trabecula. Hence, more sclerostin should be produced within these protrusions, halting formation at their
surfaces (indicated by −). Surfaces near the center of the trabecula (indicated by +) on the other hand, should receive less sclerostin, allowing formation there. As a result the protrusions would be expected to disappear. Now if we look at a discretized trabecula (Fig. 6.7, right), bone formation is not determined per bone surface, but per element near the bone surface. All elements around the protrusions receive sclerostin. In between two protrusions, the sclerostin level is
strongest, inhibiting bone formation (indicated by −). At the protrusion tips, sclerostin levels are slightly weaker, allowing formation (indicated by +). Due to this discretication effect, the protrusions are maintained. Our approach to prevent it, given in the methods section, could be summarized as follows: the surface element still gets formation as long as one of its neighbor bone elements has low sclerostin.
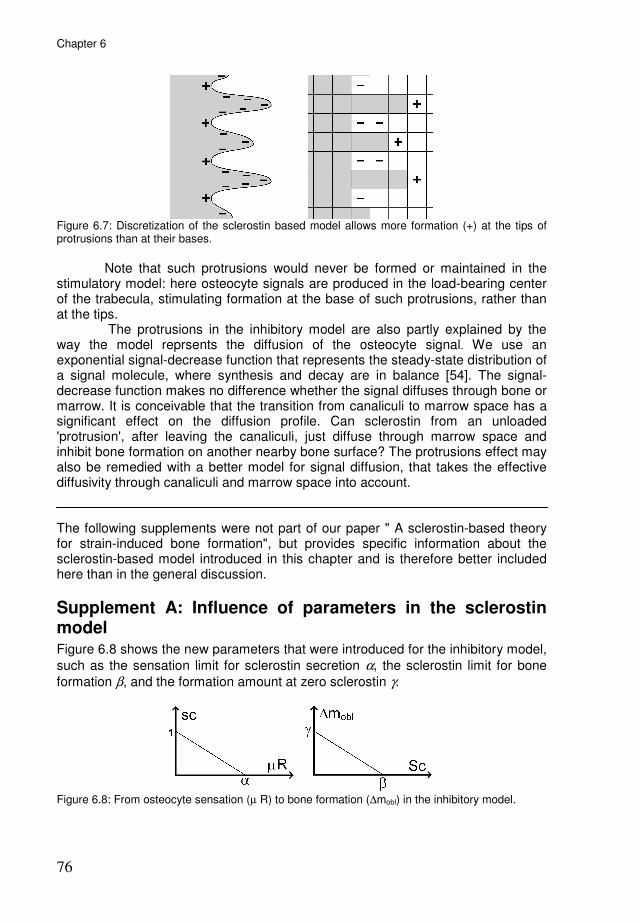
Chapter 6
76
Figure 6.7: Discretization of the sclerostin based model allows more formation (+) at the tips of protrusions than at their bases.
Note that such protrusions would never be formed or maintained in the stimulatory model: here osteocyte signals are produced in the load-bearing center of the trabecula, stimulating formation at the base of such protrusions, rather than at the tips. The protrusions in the inhibitory model are also partly explained by the way the model reprsents the diffusion of the osteocyte signal. We use an exponential signal-decrease function that represents the steady-state distribution of a signal molecule, where synthesis and decay are in balance [54]. The signal-decrease function makes no difference whether the signal diffuses through bone or marrow. It is conceivable that the transition from canaliculi to marrow space has a significant effect on the diffusion profile. Can sclerostin from an unloaded 'protrusion', after leaving the canaliculi, just diffuse through marrow space and inhibit bone formation on another nearby bone surface? The protrusions effect may also be remedied with a better model for signal diffusion, that takes the effective diffusivity through canaliculi and marrow space into account. The following supplements were not part of our paper " A sclerostin-based theory for strain-induced bone formation", but provides specific information about the sclerostin-based model introduced in this chapter and is therefore better included here than in the general discussion.
Supplement A: Influence of parameters in the sclerostin model Figure 6.8 shows the new parameters that were introduced for the inhibitory model,
such as the sensation limit for sclerostin secretion α, the sclerostin limit for bone
formation β, and the formation amount at zero sclerostin γ.
Figure 6.8: From osteocyte sensation (µ R) to bone formation (∆mobl) in the inhibitory model.
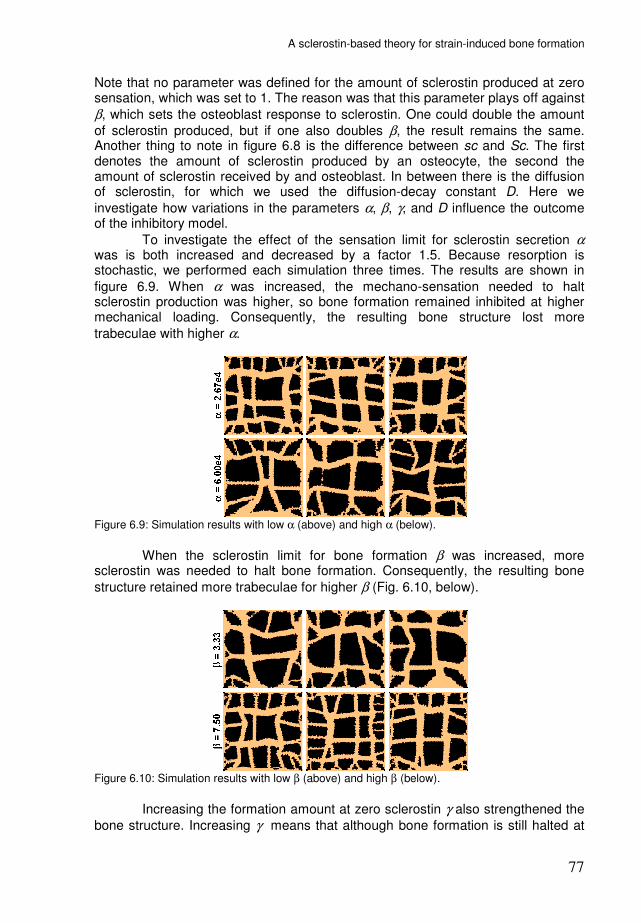
A sclerostin-based theory for strain-induced bone formation
77
Note that no parameter was defined for the amount of sclerostin produced at zero sensation, which was set to 1. The reason was that this parameter plays off against
β, which sets the osteoblast response to sclerostin. One could double the amount
of sclerostin produced, but if one also doubles β, the result remains the same. Another thing to note in figure 6.8 is the difference between sc and Sc. The first denotes the amount of sclerostin produced by an osteocyte, the second the amount of sclerostin received by and osteoblast. In between there is the diffusion of sclerostin, for which we used the diffusion-decay constant D. Here we
investigate how variations in the parameters α, β, γ, and D influence the outcome of the inhibitory model.
To investigate the effect of the sensation limit for sclerostin secretion α was is both increased and decreased by a factor 1.5. Because resorption is stochastic, we performed each simulation three times. The results are shown in
figure 6.9. When α was increased, the mechano-sensation needed to halt sclerostin production was higher, so bone formation remained inhibited at higher mechanical loading. Consequently, the resulting bone structure lost more
trabeculae with higher α.
Figure 6.9: Simulation results with low α (above) and high α (below).
When the sclerostin limit for bone formation β was increased, more sclerostin was needed to halt bone formation. Consequently, the resulting bone
structure retained more trabeculae for higher β (Fig. 6.10, below).
Figure 6.10: Simulation results with low β (above) and high β (below).
Increasing the formation amount at zero sclerostin γ also strengthened the
bone structure. Increasing γ means that although bone formation is still halted at

Chapter 6
78
the same sclerostin level, it proceeds more rapidly before that point is reached. Hence, resorption lacunae were filled up quicker, and the resulting bone structure retained more trabeculae.
Figure 6.11: Simulation results with low γ (above) and high γ (below).
In the simulations where we varied the diffusion-decay constant D, we also corrected the intensity of the signal, because simply increasing D increases the total accumulated signal. This should not change if we are simulating faster diffusion of the signal. Hence, when we adjusted D by a factor a, the signal intensity was adjusted by a factor a
-2. Increasing the diffusion-decay constant D
lead to loss of trabeculae and thickening of the surviving trabeculae (Fig. 6.12). It appears that far-reaching sclerostin from a disused region on a trabecula can disrupt bone formation within a larger region, making perforation of thin trabeculae more likely. The thickening was a secondary result of trabecular loss.
Figure 6.12: Simulation results with low D (above) and high D (below).
Influence of element size Another point of interest was the model's reaction to variations in element
size ∆x. All simulations in the paper were done at an element size of 40 µm. Figure 6.13 shows simulations of a 2x2 mm
2 volume at three different resolutions, with an
element size of 10, 20, and 40 µm. The results are roughly similar in terms of trabecular thickness.

A sclerostin-based theory for strain-induced bone formation
79
Figure 6.13: Simulations of a 2x2 mm2 volume with element size at 10, 20, and 40 µm.
In the simulation at 10 µm element size, the trabeculae were covered with protrusions, a result of the same discretization effect that was discussed in Appendix A of the paper. Our approach to prevent this effect appears less effective at small element size. To explain this, let us briefly summarize the discretization effect and our approach to prevent it. The original model determines bone formation not per bone surface, but per element at the bone surface. This never caused problems in the stimulatory model, but in the inhibitory model it produces and maintains these protrusions because elements in between the protrusions receive more sclerostin than elements at their tips. Our approach to prevent it could be summarized as follows: the surface element still gets formation as long as one of its neighbor bone elements has low sclerostin. However, in simulations with small element size even this does not help anymore because then the sclerostin strength decreases little relative to the element size. What may be ultimately needed, is a different approach to simulate the diffusion of signals.


81
Chapter 7
General discussion
Chapter 7
82
Main findings In our quest to understand bone remodeling we have always tried to explain as much of its aspects as possible with as little assumptions as possible. Huiskes' famous model [42] could produce trabeculae oriented along principal stress trajectories with just one assumption, that strain-induced osteocyte signals stimulate formation. This by itself is enough to get load-aligned trabeculae, but to get load-aligned osteons, the osteoclasts need guidance too. Therefore we introduced a strain-induced osteocyte signal that inhibits osteoclasts, to simulate osteon development along the dominant loading direction in cortical bone, and hemi-osteons along trabecular surfaces in cancellous bone. The load-aligned osteons and hemi-osteons were expected consequences of this mechanism, as hypothesized by Smit and Burger [109], but its greatest appeal lies in the results we did not anticipate at first. The mechanism guided osteoclasts to remove a region with dead osteocytes. It produced wider osteons at lower loading, which would explain why osteons are generally wider in the endosteal side of the cortex. Under a steep gradient in loading magnitude, it produced osteons that 'drifted' towards the less-loaded side. Thus far, the occurrence of 'drifting osteons' and their preferential drift towards the endosteal side of the cortex had not been explained. All these phenomena could be explained with this fairly simple theory. Reality tends to be more complex though. Recent years have seen the discovery of sclerostin, a signaling molecule by which osteocytes inhibit formation. That is the opposite of our assumed stimulatory signal, but this is not problematic if sclerostin is secreted under opposite circumstances: with disuse, rather than increased strain. This assumption was corroborated by a recent in vivo (rat) study [94] which found reduced sclerostin secretion form osteocytes in loaded bone. So we have a disuse-induced osteocyte signal that inhibits formation. We found in chapter 6 that this could produce load-aligned trabeculae, just like the strain-induced stimulatory signal. The interesting difference appears when osteocytes are lost. Whereas formation drops in the stimulatory model, it gets a temporary boost in the inhibitory model, which prevents the loss of trabeculae. This has interesting implications, in particular for microdamage repair. Microdamage repair could certainly use the help. In chapter 1 we demonstrated how a BMU would change its course to remove a 'damaged' region quite succesfully, but this damaged region was rather artificial. Once algorithms for the actual creation of damage based on mechanical loading were incorporated, it was soon found that microdamage repair is far from trivial. If stresses in the bone were already high enough to create damage, the appearance of resorption cavities might exacerbate the problem. Under continued loading, the osteoclasts could well create more damage than they remove. And because they would target this new damage as well, the process could enter a positive feedback loop between microdamage and resorption, that eventually leads to fracture. Such 'runaway resorption' has been encountered before in model studies by Martin [70] and Mulvihill et al. [84], and may be involved in the development of stress fractures [49,70,110]. At the scale of a single trabecula this process can lead to trabecular perforation [84]. In our simulations of damage remodeling in a trabecular structure, described in chapter 5, we saw instances of both succesful damage removal and trabecular perforation.
General discussion
83
Limitations We assume that osteocytes, upon mechanical loading, secrete signals to inhibit osteoclasts and stimulate osteoblasts. A simple linear relation between the strain-energy-density (the use of SED is discussed more extensively below) and signal secretion is used to capture this assumption, whereas in actual bone osteocytic signalling might be a nonlinear response to strain-induced fluid flow. On the receiving side, the reactions of osteoblasts and -clasts to osteocyte signals are also implemented with simple linear relations. More detailed relations could be implemented in the model, once the precise biochemical signals are conclusively identified, and their expression in relation to osteocyte mechanosensation, and effect on osteoblasts and -clasts are characterized. However, we believe that, as long as signals that inhibit osteoclasts and stimulate osteoblasts increase with mechanical loading, the main findings of this thesis will stand. In the model we use an exponential signal-decrease function to represent the diffusion of the osteocyte signal. This represents the steady-state distribution of a signal molecule, where synthesis and decay are in balance (this is described more extensively below). There are a few drawbacks to the simple signal-decrease function. The signal is assumed to spread evenly in all directions. However, microscopy reveals that canaliculi radiating from osteocyte lacunae have a preferred orientation along the direction in which the bone was laid down [51,93]. Further, the signal-decrease function makes no difference whether the signal diffuses through bone or marrow. It is conceivable that the transition from canaliculi to marrow space has a significant effect on the diffusion profile. To address such shortcomings, we may need to develop a better model for signal diffusion, that takes the effective diffusivity through various media into account. This relates to the 'protrusions' that were seen in the sclerostin-based model. We believe that these were a model artifact, rather than inherent in the proposed regulation mechanism. Can sclerostin from an unloaded 'protrusion', after leaving the canaliculi, just diffuse through marrow space and inhibit bone formation on another nearby bone surface? This is what caused these protrusions, and is partly due to the fact that our model makes no difference between diffusion through canaliculi in bone, and diffusion through the open marrow space. The cell simulation method for osteoclasts is quite complex and requires many parameters. During the initial stages of model development, we had osteoclasts just one element in size, that chose their path in a simple way: if adjacent to more than one bone element, resorb the one with weakest osteocyte signal. That these osteoclasts were one element in size, allowed only a very crude evaluation of their strain environment. Therefore, we wanted osteoclasts that occupied several elements, based on the typical size of osteoclasts. How to do this? What shape should they have? We thought about using osteoclasts with a fixed circular shape, several elements in size, that would move their body as a whole. This method would require few extra parameters (only osteoclast diameter), but was very inflexible. When we heard about the Cellular Potts Model, this appealed to us as an elegant method of cell simulation. We adapted it to simulate an osteoclast that (1) has a rounded, but flexible shape, (2) remains close to a ‘typical’ volume, (3) adheres to bone surfaces with weak osteocyte signal, and (4) proceeds to resorb this bone. These objectives are achieved with the current formalism and parameter set. However, it requires many parameters and makes the model somewhat of a “mathematical tour de force”.

Chapter 7
84
Thoughts on osteoclast-attracting signals Just like we propose a dual control of osteoblasts, with both stimulatory and inhibitory pathways, there could be something similar on the osteoclast side. Apart from the strain-induced osteocyte signal that inhibits resorption, there could be a disuse-induced osteocyte signal that stimulates resorption. Although the original hypothesis by Smit and Burger [109] only suggested an inhibitory signal at the sides of the cutting cone, a later development of their hypothesis [10] included chemotactic signals at the front of the cutting cone. Here it was assumed, that disuse in front of the cutting cone would induce osteocyte apoptosis, and that the apoptotic osteocytes would release chemotactic signals to attract osteoclasts. Martin [71] took this idea one step further and hypothesized that this chemotactic signal would normally steer BMUs in the loading direction, but also redirect them towards damaged bone. Notice that these concepts are almost identical to the ones we proposed in chapter 2, except that Martin focussed on osteoclast-attracting signals in front of the cutting cone, when we focussed on osteoclast-repelling signals at the sides. Although I have absolutely no problem with the idea of osteoclast-attracting signals from disused or apoptotic osteocytes, I see some problems with the added assumption that osteocytes become apoptotic in disuse. Osteocytes in front of the cutting cone experience relative disuse for about a week (assuming a cutting cone 'speed' of 40µm/day [47,48]). If this period were enough to induce osteocyte apoptosis, a week or two of immobilization would cause an osteocyte 'massacre' throughout the bone, and disuse-targeted resorption would have to continue long after this period.
Thoughts on RANKL and OPG Thusfar, the RANKL/OPG system has received little attention in this thesis, apart
from a brief mention in chapter 3. Receptor activator of NF-κB ligand (RANKL) is an important factor for osteoclast differentiation and survival, and osteoprotegerin (OPG) is its antagonist [112]. Both are expressed by osteocytes [144] and mechanical stimulation increases OPG relative to RANKL expression [140]. Thus OPG could be a candidate for the osteoclast-inhibiting signal at the sides of the cutting cone, with RANKL playing a stimulatory role at the front. RANKL and OPG are mainly thought to be secreted by (pre-)osteoblasts, and such signalling is not included in our models. What is the function of osteoblastic RANKL/OPG signalling within the BMU? In discussions of RANKL/OPG signaling between osteoblasts and osteoclasts the term ‘coupling’ is often used. However, 'coupling' signifies that resorption is followed by formation, and this is not explained by signals that go from osteoblast to osteoclast. The steering of the osteoclasts is also not explained by signals coming from the osteoblasts, but is more likely regulated by the osteocytes (as mentioned above, this may involve RANKL/OPG expression by osteocytes). Although the main two aspects of the BMU, steering and coupling, are probably not governed by osteoblastic RANKL/OPG, it may have a stabilizing effect on the BMU. There are indications that mature osteoblasts (located farther away from the cutting cone) secrete relatively more OPG [121]. OPG from these osteoblasts could provide extra stability to the closing cone, as it would keep osteoclasts from 'ignoring' the reversal zone. This idea was incorporated in a recent computer simulation study by Ryser [100], which was able to produce BMU's with well-defined cutting cones and closing cones.

General discussion
85
Within the BMU, a large proportion of the RANKL for the osteoclasts could come from the pre-osteoblasts that travel with the BMU. These would also not be able to steer the osteoclasts, but if they were to lower RANKL secretion in favor of OPG, they could terminate the BMU. It is conceivable that systemic factors that influence the RANKL/OPG system act primarily on these pre-osteoblasts.
On the use of strain-energy-density We use the strain energy density (SED) as our mechanical stimulus for osteocytes, because it has been shown to correlate well with bone adaptation patterns [8]. However, it's unlikely that osteocytes can sense strain energy. To quote Levenston & Carter [60]: "The formulation of a theory based on strain energy density does not necessarily imply the presence of cellular receptors for strain energy ... Rather the inherent assumption is that the chosen mathematical quantity increases with the actual physical stimulus, whatever that may be." So what do osteocytes actually feel? Direct cell strain would be the most obvious, but strains in bone (below 0.3%) are deemed too small: in vitro torture of osteocytes required higher strains (1-3%) to provoke a metabolic response [9]. It was therefore proposed that osteocytes respond to strain-induced fluid flow in the canalicular network [9,132,139]. However, Nicolella et al. [85] suggest that microstructural strains within the bone, near lacunae and microcracks, are much higher (up to 3%) than macrostructural strains and thus able to stimulate osteocytes directly. Ruimerman et al. [99] demonstrated that SED, maximal principal strain, volumetric strain, and their spatial gradients, could all be used as a mechanical stimulus to produce reasonable trabecular structures in bone remodeling algorithms. Of these, the maximum principal strain might correspond the most to direct cell strain, and volumetric strain gradients to fluid flow. Adachi and coworkers achieved realistic trabecular architectures using the local nonuniformity of stress/strain as the driving force for bone remodeling [1,122,123]. This nonuniformity, like strain gradients, could be interpreted as a correlate for fluid flow. Smit & Burger, after their initial FE-study which found that strains are high at the sides of the cutting cone and low at the tip [109], went on to demonstrate that the same holds for canalicular fluid flow [10,108]. The parameter chosen to represent osteocyte mechanosensation should increase with both tension and compression. Petrtyl et al. [91] have shown that osteons are aligned with the first principal stresses, for both tensile and compressive loading. With SED representing mechanosensation, our simulations direct osteoclasts in the main loading direction for both tensile and compressive loading, because SED increases with both tensile and compressive strain concentrations at the sides of the cutting cone. An early hypothesis for BMU steering by Martin [68] assumed that osteoclasts were inhibited by compressive stresses at the sides of the cutting cone; this could explain the load-alignment of osteons in compressive cortices, but, as Martin acknowledged, could not do the same for osteons in the tensile cortex.
On the exponential signal-decrease function Osteocyte signals are sent through the canaliculi towards the trabecular surface. In our model the signals are assumed to decrease in strength with increasing distance d from the osteocyte, according to:
Chapter 7
86
ddDdedf
−=)( ,
where Ddd is a diffusion-decay constant (the subscript dd was added here to distinguish Ddd from the diffusion coefficient D, which we will use shortly). Ddd is also the distance where the signal has decreased to 37% of its initial strength. The exponential influence function was first introduced by Mullender et al. [83] and represents the steady-state distribution of a signal molecule, where synthesis and decay are in balance. Once a cell starts synthesizing a signal molecule, its concentration rises in the cell and its immediate vicinity, and spreads out in a decreasing fashion. Soon the concentration at all points reaches a steady-state, where the rate of synthesis is exactly counterbalanced by diffusion and decay. This steady state can be reached very quickly, depending on the diffusion and decay rates of the signal molecule. For instance, in the case of a single endothelial cell synthesizing nitric oxide (NO), this steady state is achieved in approximately 20 seconds [54]. For a 1D-point source S [mol s
-1] at x = 0, secreting a signal molecule
with diffusion coefficient D [m2 s
-1] and decay rate λ [s
-1], the steady-state
concentration C follows [54]:
−=
Dx
D
SxC
λ
λexp
2)( .
This is like our function, with our diffusion-decay constant Ddd equal to λD . For
a 3D-point source at r = 0, the steady-state concentration C [mol/m3] follows [137]:
−=
Dr
rD
SrC
λ
πexp
4)(
Note that the exponential term in both versions is equal, but the major difference between the 1D-and 3D-version is the reciprocal term (1/r) in the latter. For diffusion via canaliculi however, the 1D-version seems appropriate.
On the lazy zone, the ambivalent zone, and lining cells Earlier bone adaptation models by Huiskes [43] included a ‘lazy zone’, a strain range where neither osteoblasts nor osteoclasts are active. In the current model there is no lazy zone, on the contrary there is a signal range where both osteoclast and osteoblast activity may occur (Fig. 7.1). This ‘ambivalent zone’ was necessary for the refilling of resorption cavities. If the strain-based signal that halted resorbing osteoclasts is still below the formation threshold, a cavity cannot be refilled. Does this mean that the concept of the ‘lazy zone’ is wrong? Note that the lazy zone was assumed in models at a larger, more abstract scale. That it does not function within the individual BMU-cavity, does not negate it at a larger scale. A difficulty with the ambivalent zone is that rules of priority are needed when osteoclasts and osteoblasts want to be active on the same bone surface. In the current model osteoclasts cannot originate on surfaces where osteoblasts are active, and formation cannot occur on surfaces occupied by osteoclasts. But can

General discussion
87
existing osteoclasts push aside osteoblasts, or do osteoblasts completely ‘protect’ the bone surface they cover? Even if the osteoclasts were able to push aside the osteoblasts in real bone, they would encounter an unmineralized layer of osteoid. This would present an obstacle for resorption, since bone mineral seems essential for osteoclast adhesion [124]. Therefore one may choose to make the osteoblast layer ‘resorption-proof’.
Figure 7.1: The lazy zone, used in earlier, larger-scale models, indicated a strain range at which no resorption or formation would occur. At the BMU level, however, the strain ranges for resorption and formation must overlap (the 'ambivalent' zone), in order to refill the cavity.
In real bone most (75%) of the surface is quiescent [89]. If osteoclasts can originate soon after formation stops, i.e. when osteoblasts become lining cells, quiescence will be rare. Indeed, in the trabecular simulations of chapter 2 most of the bone surface was actively remodeling. This problem may be resolved by assuming that inactive osteoblasts (lining cells) continue to protect the bone surface, for a certain signal range below their activation threshold. Several writers have proposed such a ‘gatekeeping’ function for lining cells [9,89]. Lining cells could digest the endosteal layer by secreting collagenase [14,75], thus allowing access of osteoclast precursors to the mineralized bone. In a model we could then assume that this occurs at a signal level far below the formation threshold, due to disuse or microdamage. Apart from accounting for the amount of quiescent surface, this gatekeeping function could also bridge the concepts of ‘ambivalent zone’ and ‘lazy zone’. Whilst in the individual BMU osteoclasts and osteoblasts operate at overlapping strain ranges (the ambivalent zone), lining cells on the trabecular surface maintain a quiescent strain range (the lazy zone/ quiescent zone).
Alternative hypotheses on osteon diameter In our paper "Relating osteon diameter to strain" we presented the hypothesis that osteon diameter is restricted by strain-induced signals at the sides of the cutting cone, and that such control would explain differences in osteon diameter between the endosteal and periosteal side of the cortex. Another hypothesis on osteon diameter is that it is determined by the blood vessel supply of pre-osteoclasts, nutrients and oxygen to the cutting cone. Jaworski [47] suggested that this could explain why osteons on the endosteal side of the cortex generally have a larger diameter than those on the periosteal side, since the direction of blood flow through

Chapter 7
88
cortical bone is mainly from the endosteal to the periosteal side [66]. However, this hypothesis would not explain the differences in osteon diameter between the compression and the tension cortex in the heel bone of hoofed animals [103,104,106], which could be related to differences in strain magnitude [111]. Further, it would not explain why periods of immobilization in primates lead to "unusually large osteons" [141]. Finally, drifting osteons and their direction of drift cannot be explained with this hypothesis, since the blood flow within a single BMU cannot differentiate between endosteal and periosteal side. It has also been suggested that the lifespan of osteoclast nuclei determines BMU width [88]. According to this hypothesis, pre-osteoclasts arrive at the apex of the cutting cone, after which the newly formed osteoclasts resorb sideways until their nuclei undergo apoptosis. This notion was based on the observation by Wright et al. [138] that osteoclast apoptosis occurs mostly at the sides of the cutting cone. In our model osteoclast adhesion is inhibited at the sides of the cutting cone. Therefore we suggest that detachment-induced apoptosis explains Wright’s observation. There is no reason why osteoclasts in the cutting cone would necessarily resorb sideways. However, the dynamics within the cutting cone, if detachment and apoptosis are more likely at the sides, while attachment of pre-osteoclasts is more likely at the front, could produce 'treadmill'-like behavior as proposed by Burger et al. [10]. This would be a result of the mechanism that controls osteon diameter, rather than the cause.
More on drifting osteons The simulation of the drifting osteon was a late addition to "Relating osteon diameter to strain", and received a little less attention than I feel it deserved. There was only one simulation with a drifting osteon. To increase confidence that this was a result of the specific strain environment, rather than model stochasticity, we performed some more simulations. It appears that steep gradients in strain magnitude do indeed produce drifting osteons (Fig. 7.2).
Figure 7.2: As strain gradients increase, the lesser strained side of the closing cone breaks up, and the osteon becomes a drifting osteon. Note that the figures do not show the entire simulation volume, but only the central part.
Drifting osteons, also named 'eccentric' osteons or 'waltzing' osteons, were first described by Sedlin, Frost, and Villanueva [102]. They must have noticed a systematic preference in drifting direction, as Epker and Frost [28] quickly followed up on this study to establish that 81% drift towards the marrow cavity, versus 10% towards the periosteum and 19% intermediately. They suggested that there had to
General discussion
89
be a mechanism responsible for this drift, one that promoted resorption on the endosteal side of a remodeling cavity and formation on the periosteal side. This is exactly what our proposed bone remodeling mechanism does, when the endosteal/periosteal strain gradient is steep enough. When the gradient is less steep, the same mechanism is still responsible for endosteal/periosteal differences in osteon diameter. Interestingly, the study by Sedlin et al [102] observed that drifting osteons are prevalent in young children but their incidence decreases continuously with age. We speculate that young children, because of their thinner bones, experience steeper strain gradients, which could explain the higher frequency of drifting osteons.
Future directions The sclerostin-based model was introduced, not only because of the evidence for this signaling molecule and the attention it is currently gaining, but because we envisioned it might facilitate microdamage repair. Whereas the stimulatory model responds to osteocyte death with a reduction of bone formation, the inhibitory model gives it a boost. Microdamage repair under continued loading could be compared to 'changing a tire while driving'. To continue this analogy, the extra bone formation provided by the inhibitory model, could be compared to adding an auxiliary wheel, so that the damaged wheel can be replaced without crashing the car. I believe this is the function of a 'microcallus', where bone is quickly laid down on the outside of the microdamaged trabecula, while resorption occurs within. To investigate this idea, the sclerostin and microdamage algorithms need to be combined within the larger model. Our theories on osteon diameter and drifting osteons provide prospects for histological studies. The idea of an inverse relation osteon diameter and strain magnitude in our paper "Relating osteon diameter to strain" already inspired Britz et al. [6] to investigate if there existed an inverse relation between osteon diameter and body weight. In their study on femoral osteons of 88 human cadavers between the ages of 17 and 97, they found that weight was negatively related to osteon diameter. This may be explained by our proposed mechanism, but such a conclusion remains tentative, because body weight does not necessarily equate to cortical strain. With increasing computation power and advanced algorithms, it will undoubtedly become feasible to perform large 3D-simulations of intracortical remodeling with multiple osteons. In such similations it would be interesting to study the interplay between remodeling and vascularization of the cortex. The current model does not incorporate any blood vessel supply, and would allow the closing cone to completely close the osteonal tunnel if strains are large enough. (Note that there must be an as-yet-unidentified mechanism that prevents the closing cone from constricting the osteon's blood vessel.) Once incorporated into the model, vascular (haversian) canals would present the starting point for new BMU's to further osteonalize/vascularize the tissue. Candidate signaling molecules can be evaluated and compared, by including their reach and lifetime. For example, nitric oxide (NO) and osteoprotegerin (OPG), are both candidates for the signal that 'steers' the BMU, but NO has a much shorter half-life and a much lower molecular weight than OPG. Due to such differences, it is expected that different signaling molecules will not reach the osteoclasts and -blasts at the same concentration. By evaluating their
Chapter 7
90
spatial distribution, their suitability as messengers within a proposed regulating mechanism can be determined. Such evaluations will require a better model for signal diffusion, that takes the effective diffusivity through canaliculi and marrow space into account. Once the precise biochemical signals are conclusively identified, the model will also help us to evaluate possible pharmaceutical treatment strategies. For example, the effects of antibodies for sclerostin, which are presently under development, on the bone structure can be evaluated and compared to, for example, strategies that aim at inhibiting the RANKL pathway.

91
References 1 Adachi T, Tomita Y, Sakaue H, Tanaka M. Simulation of trabecular surface
remodeling based on local stress nonuniformity. JSME Int J 1997;40C:782-92.
2 Agerbaek MO, Eriksen EF, Kragstrup J, Mosekilde L, Melsen F. A reconstruction of the remodelling cycle in normal human cortical iliac bone. Bone Miner 1991;12:101-12.
3 Bacabac RG, Smit TH, Mullender MG, Dijcks SJ, Van Loon JJ, Klein-Nulend J. Nitric oxide production by bone cells is fluid shear stress rate dependent. Biochem Biophys Res. Commun, 2004;315:823-9.
4 Bentolila V, Boyce TM, Fyhrie DP, Drumb R, Skerry TM, Schaffler MB. Intracortical remodeling in adult rat long bones after fatigue loading. Bone 1998;23:275-81.
5 Boyce TM, Fyhrie DP, Glotkowski MC, Radin EL, Schaffler MB. Damage type and strain mode associations in human compact bone bending fatigue. J Orthop Res 1998;16:322-9.
6 Britz HM, Thomas CDL, Clement JG, Cooper DML. The relation of femoral osteon geometry to age, sex, height and weight. Bone 2009;45:77-83.
7 Brockstedt H, Bollerslev J, Melsen F, Mosekilde L. Cortical bone remodeling in autosomal dominant osteopetrosis: a study of two different phenotypes. Bone 1996;18: 67-72.
8 Brown TD, Pedersen DR, Gray ML, Brand RA, Rubin CT. Toward an identification of mechanical parameters initiating periosteal remodeling: a combined experimental and analytic approach. J. Biomech 1990;23:893-905.
9 Burger EH, Klein-Nulend J. Mechanotransduction in bone – role of the lacuno-canalicular network. FASEB J 1999;13 Suppl:S101-12.
10 Burger EH, Klein-Nulend J, Smit TH. Strain-derived canalicular fluid flow regulates osteoclast activity in a remodeling osteon – a proposal. J Biomech 2003;36:1453-9.
11 Burr DB, Martin RB, Schaffler MB, Radin EL. Bone remodeling in response to in vivo fatigue microdamage. J Biomech 1985;18:189-200.
12 Carter DR, Caler WE. A cumulative damage model for bone fracture. J Orthop Res 1985;3:84-90.
13 Cattaneo C, Dimartino S, Scali S, Craig OE, Grandi M, Sokol RJ. Determining the human origin of fragments of burnt bone: a comparative study of histological, immunological and DNA techniques. Forensic Sci Int 1999;102:181-91.
14 Chambers TJ, Fuller K. Bone cells predispose bone surfaces to osteoclastic contact. J Cell Sci 1985;76:155-65.
15 Cheng B, Kato Y, Zhao S, Luo J, Sprague E, Bonewald LF. Jiang JX. PGE2 is essential for gap junction-mediated intercellular communication between osteocyte-like MLO-Y4 cells in response to mechanical strain. Endocrinology 2001;142:3464-73.
16 Chow JW, Chambers TJ. Indomethacin has distinct early and late actions on bone formation induced by mechanical stimulation. Am J Physiol Endocrinol Metab 1994;267:E287-92.

92
17 Chow JW, Wilson AJ, Chambers TJ, Fox SW. Mechanical loading stimulates bone formation by reactivation of bone lining cells in 13-week-old rats. J Bone Miner Res 1998;13:1760-7.
18 Colletti LA, Edwards J, Gordon L, Shary J, Bell NH. The effects of muscle-building exercise on bone mineral density of the radius, spine, and hip in young men. Calcif Tissue Int 1989;45:12-4.
19 Colopy SA, Benz-Dean J, Barrett JG, Sample SJ, Lu Y, Danova NA, Kalscheur VL, Vanderby R Jr, Markel MD, Muir P. Response of the osteocyte syncytium adjacent to and distant from linear microcracks during adaptation to cyclic fatigue loading. Bone 2004;35:881-91.
20 Courteix D, Lespessailles E, Peres SL, Obert P, Germain P, Benhamou CL. Effects of physical training on bone mineral density in prepubertal girls: a comparative study between impact-loading and non-impact-loading sports. Osteopor Int 1998;8:152-8.
21 Cowin SC, Moss-Salentijn L, Moss ML. Candidates for the mechanosensory system in bone. J Biomech Eng 1991;113:191-7.
22 Cowin SC. The significance of bone microstructure in mechanotransduction. J Biomech 2007;40 Suppl:S105-9.
23 Cox LGE, van Donkelaar CC, van Rietbergen B, Huiskes R, Ito K. Osteocytes in bone can regulate the turnover of adjacent mineralized growth plate cartilage. ASME Summer Bioengng Conf 2009; Lake Tahoe, Ca (pp. SBC-2009-206251).
24 Currey JD. Bones: Structure and Mechanics. Princeton University Press, Princeton, NJ; 2002.
25 Currey JD. The effect of porosity and mineral content on the Young’s modulus of elasticity of compact bone. J Biomech 1988;21:131-91.
26 Diab T, Vashishth D. Morphology, localization and accumulation of in vivo microdamage in human cortical bone. Bone 2007;40:612-8.
27 Doblare M, Garcia JM. Anisotropic bone remodelling model based on a continuum damage-repair theory. J Biomech 2002;35:1–17.
28 Epker BN, Frost HM. The direction of transverse drift of actively forming osteons in human rib cortex. J Bone Joint Surg 1965;47:1211-5.
29 Eriksen EF, Kassem M. The cellular basis of bone remodeling. Triangle 1992;31;45-57.
30 Fredericson M, Jennings F, Beaulieu C, Matheson GO. Stress fractures in athletes. Top Magn Reson Imaging 2006;17:309-25.
31 Frost HM. Skeletal structural adaptations to mechanical usage (SATMU): 2. Redefining Wolff's Law: The remodeling problem. Anat Rec 1990;226:414-22.
32 Frost HM. Vital biomechanics. Proposed general concepts for skeletal adaptation to mechanical usage. Calcif Tissue Int 1987;45:145-56.
33 Fukushima O, Bekker PJ, Gay CV. Characterization of the functional stages of osteoclasts by enzyme histochemistry and electron microscopy. Anat Rec 1991;231:298-315.
34 Gibson VA, Stover SM, Gibeling JC, Hazelwood SJ, Martin RB. Osteonal effects on elastic modulus and fatigue life in equine bone. J Biomech 2006;39:217-25.
35 Glazier JA, Graner F. Simulation of the differential adhesion driven rearrangement of biological cells. Phys Rev E 1993;47:2128-54.
93
36 Heino TJ, Hentunen TA, Väänänen HK. Conditioned medium from osteocytes stimulates the proliferation of bone marrow mesenchymal stem cells and their differentiation into osteoblasts. Exp Cell Res 2004;294:458-68.
37 Heino TJ, Hentunen TA, Väänänen HK. Osteocytes inhibit osteoclastic bone resorption through transforming growth factor-β: enhancement by estrogen. J Cell Biochem 2002;85:185-97.
38 Hert J, Fiala P, Petrtyl M. Osteon orientation of the diaphysis of the long bones in man. Bone 1994;15:269-77.
39 Hillam RA, Skerry TM. Inhibition of bone resorption and stimulation of formation by mechanical loading of the modeling rat ulna in vivo. J Bone Miner Res 1995:10;683-9.
40 Hiller LP, Stover SM, Gibson VA, Gibeling JC, Prater CS, Hazelwood SJ, Yeh OC, Martin RB. Osteon pullout in the equine third metacarpal bone: effects of ex vivo fatigue. J Orthop Res 2003;21:481-8.
41 Huiskes R. If bone is the answer, then what is the question? J Anat 2000;197:145-56.
42 Huiskes R, Ruimerman R, van Lenthe GH, Janssen JD. Effects of mechanical forces on maintenance and adaptation of form in trabecular bone. Nature 2000;405:704-6.
43 Huiskes R, Weinans H, Grootenboer HJ, Dalstra M, Fudala B, Slooff TJ. Adaptive bone-remodeling theory applied to prosthetic-design analysis. J Biomech 1987;20:1135-50.
44 Hogeweg P. Evolving mechanisms of morphogenesis: on the interplay between differential adhesion and cell differentiation. J Theor Biol 2000;203:317-33.
45 Imai S, Heino TJ, Hienola A, Kurata K, Büki K, Matsusue Y, Väänänen HK, Rauvala H. Osteocyte-derived HB-GAM (pleiotrophin) is associated with bone formation and mechanical loading. Bone 2009;44:785-94.
46 Jaworski ZFG, Duck B, Sekaly G. Kinetics of osteoclasts and their nuclei in evolving secondary haversian systems. J Anat 1981;133:397-405.
47 Jaworski ZFG. Haversian systems and haversian bone. In: Hall BK, ed. Bone metabolism and mineralization, Vol. 4. Boca Raton, FL: CRC Press; 1992; p. 21-45.
48 Jaworski ZFG, Lok E. The rate of osteoclastic bone erosion in Haversian remodeling sites in adult dog's rib. Calcif Tissue Res 1972;10:103-12.
49 Johnson LC. Morphologic analysis of pathology. In: Frost HM, editor. Bone biodynamics. Boston, MA: Little, Brown, and Company; 1964; p. 543-654.
50 Jiang Y, Levine H, Glazier J. Possible cooperation of differential adhesion and chemotaxis in mound formation of Dictyostelium. Biophys J 1998;75:2615-25.
51 Kameo Y, Adachi T, Sato N, Hojo M. Estimation of bone permeability considering the morphology of lacuno-canalicular porosity. J Mech Behav Biomed Mater 2010;3:240-8.
52 Kiratli BJ, Smith AE, Nauenberg T, Kallfelz CF, Perkash I. Bone mineral and geometric changes through the femur with immobilization due to spinal cord injury. J Rehab Res Dev 2000;37:225-33.
53 Klein-Nulend J, Nijweide PJ, Burger EH. Osteocyte and bone structure. Curr Osteoporos Rep 2003;1:5-10.
54 Lancaster J. Diffusion of free nitric oxide. Methods Enzymol 1996;268;31–50.
94
55 Lanyon LE. Osteocytes, strain detection, bone modeling and remodeling. Calcif Tissue Int 1993;53 Suppl:S102-7.
56 Leblanc AD, Schneider VS, Evans HJ, Engelbretson DA, Krebs JM. Bone mineral loss and recovery after 17 weeks of bedrest. J Bone Miner Res 1990;5:843-50.
57 Lee TC, Staines A, Taylor D. Bone adaptation to load: microdamage as a stimulus for bone remodelling. J Anat 2002;201:437-46.
58 Lee WR. Appositional bone formation in canine bone: a quantitative microscopic study using tetracycline markers. J Anat 1964;98:665-77.
59 Lemaitre J. A continuous damage mechanics model for ductile fracture. J Engng Mater Technol 1985;107:83–9.
60 Levenston MA, Carter DR. An energy dissipation-based model for damage stimulated bone adaptation. J Biomech 1998;31:579-86.
61 Li W, You L, Schaffler MB, Wang L. The dependency of solute diffusion on molecular weight and shape in intact bone. Bone 2009;45:1017-23.
62 Mancini L, Moradi-Bidhendi N, Brandi ML, MacIntyre I. Nitric oxide superoxide and peroxynitrite modulate osteoclast activity. Biochem Biophys Res Commun 1998;243:785-90.
63 Manson JD, Waters NE. Observations on the rate of maturation of the cat osteon. J Anat 1965;99:539-49.
64 Marée AFM, Hogeweg P. How amoeboids self-organize into a fruiting body: multicellular coordination in Dictyostelium discoideum. Proc Natl Acad Sci USA 2001;98:3879-83.
65 Marotti G, Cané V, Palazzini S, Palumbo C. Structure-function relationships in the osteocyte. Ital J Miner Elecrolyte Metab 1990;4:93-106.
66 Marotti G, Zambonin Zallone A. Changes in the vascular network during the formation of Haversian systems. Acta anat 1980;106:84-100.
67 Martin RB, Burr DB, Sharkey NA, eds. Skeletal Tissue Mechanics. Springer, New York, 1998; p. 204.
68 Martin RB, Burr DB. Structure, function and adaptation of compact bone. Raven Press, New York; 1989; p. 248-51.
69 Martin RB. Is all cortical bone remodeling initiated by microdamage? Bone 2002;30:8-13.
70 Martin RB. Mathematical model for repair of fatigue damage and stress fracture in osteonal bone. J Orthop Res 1995;13:309-16.
71 Martin RB. Targeted bone remodeling involves BMU steering as well as activation. Bone 2007;40:1574–80.
72 Mathews CHE, Aswani SP, Parfitt AM. Hypogravitational effects of hypodynamia on bone cell function and the dynamics of bone remodeling. In: Kazarian L, Cann C, Parfitt M, Simmons D, Morey-Holton E, eds. A 14-day ground-based hypokinesia study in nonhuman primates: a compilation of results. NASA Tech. Mem. 81268. Springfield, VA: NTIS; 1981; p. 16-28.
73 McBryde AM. Stress fractures in athletes. J Sports Med 1975;3:212-7. 74 McNamara LM, Prendergast PJ. Bone remodelling algorithms incorporating
both strain and microdamage stimuli. J Biomech 2007;40:1381-91. 75 Meikle MC, Bord S, Hembry RM, Compston J, Croucher PI, Reynolds JJ.
Human osteoblasts in culture synthesize collagenase and other matrix metalloproteinases in response to osteotropic hormones and cytokines. J Cell Sci 1992;103:1093-9.

95
76 Milgrom C, Giladi M, Stein M, Kashtan H, Margulies JY, Chisin R, Steinberg R, Aharonson Z. Stress fractures in military recruits. A prospective study showing an unusually high incidence. J Bone Joint Surg Br 1985;67:732-5.
77 Miyamoto T, Suda T. Differentiation and function of osteoclasts. Keio J Med 2003;52:1-7.
78 Mohsin S, O'Brien FJ, Lee TC. Osteonal crack barriers in ovine compact bone. J Anat 2006;208:81-9.
79 Mori S, Burr DB. Increased intracortical remodeling following fatigue damage. Bone 1993;14:103-9.
80 Mosekilde L. Consequences of the remodeling process for vertebral trabecular bone structure: a scanning electron microscopy study (uncoupling of unloaded structures). Bone Miner 1990;10:13-35.
81 Mullender MG, Huiskes R. Proposal for the regulatory mechanism of Wolff’s law. J Orthop Res, 1995;13:503-12.
82 Mullender MG, Huiskes R, Versleyen H, Buma P. Osteocyte density and histomorphometric parameters in cancellous bone of the proximal femur in five mammalian species. J Orthop Res 1996;14:972–9.
83 Mullender MG, Huiskes R, Weinans H. A physiological approach to the simulation of bone remodeling as a self-organizational control process. J Biomech 1994;27:1389-94.
84 Mulvihill BM, McNamara LM, Prendergast PJ. Loss of trabeculae by mechano-biological means may explain rapid bone loss in osteoporosis. J R Soc Interface 2008;5:1243-53.
85 Nicolella DP, Nicholls AE, Lankford J, Davy DT. Machine vision photogrammetry: a technique for measurement of microstructural strain in cortical bone. J Biomech 2001;34:135-9.
86 Noble B. Bone microdamage and cell apoptosis. Eur Cell Mater 2003;6:46-55.
87 Parfitt AM, Mathews CHE, Villanueva AR, Kleerekoper M, Frame B, Raos DS. Relationships between surface, volume, and thickness of iliac trabecular bone in aging and osteoporosis: implications for the microanatomic and cellular mechanisms of bone loss. J Clin Invest 1983;72:1396-409.
88 Parfitt AM, Mundy GR, Roodman GD, Hughes DE, Boyce BF. A new model for the regulation of bone resorption, with particular reference to the effects of bisphosphonates. J Bone Miner Res 1996;11:150-9.
89 Parfitt AM. Osteonal and hemi-osteonal remodeling: the spatial and temporal framework for signal traffic in adult human bone. J Cell Biochem 1994;55:273-86.
90 Pead MJ, Suswillo RFL, Skerry TM, Vedi S, Lanyon LE. Increased 3H-uridine
levels in osteocytes following a single short period of dynamic bone loading in vivo. Calcif Tissue Int 1988;43:92-6.
91 Petrtyl M, Hert J, Fiala P. Spatial organization of the haversian bone in man. J Biomech 1996;29:161-9.
92 Qiu S-J, Hoshaw SJ, Gibson GJ, Lundin-Cannon KD, Schaffler MB. Osteocyte apoptosis in reaction to matrix damage in compact bone. Trans Orthop Res Soc 1997;22:89.
93 Rensberger JM, Watabe M. Fine structure of bone in dinosaurs, birds and mammals. Nature 2000;406:619-22.
94 Robling AG, Niziolek PJ, Baldridge LA, Condon KW, Allen MR, Alam I, Mantila SM, Gluhak-Heinrich J, Bellido TM, Harris SE, Turner CH.
96
Mechanical stimulation of bone in vivo reduces osteocyte expression of Sost/sclerostin. J Biol Chem 2008;283:5866-75.
95 Robling AG, Stout SD. Morphology of the drifting osteon. Cells Tissues Organs 1999;164:192-204.
96 Roux W. Der Kampf der Teile im Organismus. Leipzig: Engelmann; 1881. 97 Ruimerman R, Hilbers PAJ, van Rietbergen B, Huiskes R. A theoretical
framework for strain-related trabecular bone maintenance and adaptation. J Biomech 2005;38:931-41.
98 Ruimerman R, Huiskes R, van Lenthe GH, Janssen JD. A computer-simulation model relating bone-cell metabolism to mechanical adaptation of trabecular architecture. Comp Meth Biomech Biomed Eng 2001;4:433-48.
99 Ruimerman R, van Rietbergen B, Hilbers P, Huiskes R. The effects of trabecular-bone loading variables on the surface signaling potential for bone remodeling and adaptation. Ann Biomed Eng 2005;33:71-8.
100 Ryser MD, Nigam N, Komarova SV. Mathematical modeling of spatio-temporal dynamics of a single bone multicellular unit. J Bone Miner Res 2009;24:860-70.
101 Sakai H, Kobayashi Y, Sakai E, Shibata M, Kato Y. Cell adhesion is a prerequisite for osteoclast survival. Biochem Biophys Res Commun 2000;270:550-6.
102 Sedlin ED, Frost HM, Villanueva AR. Age changes in resorption in human rib cortex. J Gerontol 1963;18:345-9.
103 Skedros JG, Mason MW, Bloebaum RD. Differences in osteonal morphology between tensile and compressive cortices of a bending skeletal system: indications of potential strain-specific differences in bone microstructure. Anat Rec 1994;239:405-13.
104 Skedros JG, Mason MW, Bloebaum RD. Modeling and remodeling in a developing artiodactyl calcaneus: a model for evaluating Frost's Mechanostat hypothesis and its corollaries. Anat Rec 2001;263:167-85.
105 Skedros JG, Sorenson SM, Jenson NH. Are distributions of secondary osteon variants useful for interpreting load history in mammalian bones? Cells Tissues Organs 2007;185;285-307.
106 Skedros JG, Su SC, Bloebaum RD. Biomechanical implications of mineral content and microstructural variations in cortical bone of horse, elk, and sheep calcanei. Anat Rec 1997;249:297-316.
107 Skerry TM, Bitensky L, Chayen J, Lanyon LE. Early strain-related changes in enzyme activity in osteocytes following bone loading in vivo. J Bone Miner Res 1989;4:783-8.
108 Smit TH, Burger EH, Huyghe JM. A case for strain-induced fluid flow as a regulator of BMU-coupling and osteonal alignment. J Bone Miner Res 2002;17:2021-9.
109 Smit TH, Burger EH. Is BMU-coupling a strain-regulated phenomenon? A finite element analysis. J Bone Miner Res 2000;15:301-7.
110 Stover SM. The epidemiology of thoroughbred racehorse injuries. Clin Tech Equine Pract 2003;2:312-22.
111 Su SC, Skedros JG, Bachus KN, Bloebaum RD. Loading conditions and cortical bone construction of an artiodactyl calcaneus. J Exp Biol 1999;202:3239-54.
112 Suda T, Takahashi N, Udagawa N, Jimi E, Gillespie MT, Martin TJ. Modulation of osteoclast differentiation and function by the new members of

97
the tumor necrosis factor receptor and ligand families. Endocr Rev 1999;20;345-57.
113 Suponitzky I, Weinreb M. Differential effects of systemic prostaglandin E2 on bone mass in rat long bones and calvariae. J Endocrinol 1998;156:51-7.
114 Tan SD, de Vries TJ, Kuijpers-Jagtman AM, Semeins CM, Everts V, Klein-Nulend J. Osteocytes subjected to fluid flow inhibit osteoclast formation and bone resorption. Bone 2007;41:745-51.
115 Tanck E, Hannink G, Ruimerman R, Buma P, Burger EH, Huiskes R. Cortical bone development under the growth plate is regulated by mechanical load transfer. J Anat 2006;208:73-9.
116 Tanck E, Ruimerman R, Huiskes R. Trabecular architecture can remain intact for both disuse and overload enhanced resorption characteristics. J Biomech 2006;39:2631-7.
117 Tappen NC. Three-dimensional studies of resorption spaces and developing osteons. Am J Anat 1977;149:301-32.
118 Tatsumi S, Ishii K, Amizuka N, Li M, Kobayashi T, Kohno K, Ito M, Takeshita S, Ikeda K. Targeted ablation of osteocytes induces osteoporosis with defective mechanotransduction. Cell Metab 2007;5:464-75.
119 Taylor AF, Saunders MM, Shingle DL, Cimbala JM, Zhou Z, Donahue HJ. Mechanically stimulated osteocytes regulate osteoblastic activity via gap junctions. Am J Physiol Cell Physiol 2007;292:545-52.
120 Taylor D, Hazenberg J, Lee TC. The cellular transducer in bone: What is it? Technol Health Care 2006;14:367-77.
121 Thomas GP, Baker SU, Eisman JA, Gardiner EM. Changing RANKL/OPG mRNA expression in differentiating murine primary osteoblasts. J Endocrinol 2001;170:451–60.
122 Tsubota K, Adachi T, Tomita Y. Functional adaptation of cancellous bone in human proximal femur predicted by trabecular surface remodeling simulation toward uniform stress state. J Biomech 2002;35:1541-51.
123 Tsubota K, Suzuki Y, Yamada T, Hojo M, Makinouchi A, Adachi T. Computer simulation of trabecular remodeling in human proximal femur using large-scale voxel FE models: Approach to understanding Wolff's law. J Biomech 2009;42:1088-94.
124 Väänänen HK, Horton M. The osteoclast clear zone is a specialised cell-extracellular matrix adhesion structure. J Cell Sci 1995;108:2729-32.
125 Väänänen HK, Zhao H, Mulari M, Halleen JM. The cell biology of osteoclast function. J Cell Sci 2000;113:377-81.
126 van Bezooijen RL, Svensson JP, Eefting D, Visser A, van der Horst G, Karperien M, Quax PH, Vrieling H, Papapoulos SE, ten Dijke P, Löwik CW. Wnt but not BMP signaling is involved in the inhibitory action of sclerostin on BMP-stimulated bone formation. J Bone Miner Res 2007;22:19-28.
127 Van Buskirk WC, Ashman RB. The elastic moduli of bone. In: Cowin SC, ed. Mechanical properties of bone. New York: ASME; 1981; p. 131-44.
128 van Oers RFM, Ruimerman R, Tanck E, Hilbers PAJ, Huiskes R. A unified theory for osteonal and hemi-osteonal remodeling. Bone 2008;42:250-9.
129 van Oers RFM, Ruimerman R, van Rietbergen B, Hilbers PAJ, Huiskes R. Relating osteon diameter to strain. Bone 2008;43:476-82.
130 Verborgt O, Gibson GJ, Schaffler MB. Loss of osteocyte integrity in association with microdamage and bone remodeling after fatigue in vivo. J Bone Miner Res 2000;15:60-7.
98
131 Vezeridis PS, Semeins CM, Chen Q, Klein-Nulend J. Osteocytes subjected to pulsating fluid flow regulate osteoblast proliferation and differentiation. Biochem Biophys Res Comm 2006;348:1082–8.
132 Weinbaum S, Cowin SC, Zeng Y. A model for the excitation of osteocytes by mechanical loading-induced bone fluid shear stresses. J Biomech 1994;27:339-60.
133 Weinreb M, Rodan GA, Thompson DD. Osteopenia in the immobilized rat hind limb is associated with increased bone resorption and decreased bone formation. Bone 1989;10:187-94.
134 Whedon GD. Disuse osteoporosis: physiological aspects. Calcif Tissue Int 1984;36 Suppl:S146-50.
135 Winkler DG, Sutherland MK, Geoghegan JC, Yu C, Hayes T, Skonier JE, Shpektor D, Jonas M, Kovacevich BR, Staehling-Hampton K, Appleby M, Brunkow ME, Latham JA Osteocyte control of bone formation via sclerostin, a novel BMP antagonist. EMBO J 2003;22:6267-76.
136 Wolff J. Das Gesetz der Transformation der Knochen. Berlin: Hirschwald; 1892; translated as: The law of bone remodeling. Berlin: Springer; 1986.
137 Wood J, Garthwaite J. Models of the diffusional spread of nitric oxide: implications for neural nitric oxide signalling and its pharmacological properties. Neuropharmacology 1994;33:1235-44.
138 Wright KR, Hughes DE, Guise TA, Boyle IT, Devlin R, Windle J, Roodman GD, Mundy GR, Boyce BF. Osteoclasts undergo apoptosis at the interface between resorption and formation in bone remodelling units. J Bone Miner Res 1994;9 Suppl:S174.
139 You L, Cowin SC, Schaffler MB, Weinbaum S. A model for strain amplification in the actin cytoskeleton of osteocytes due to fluid drag on pericellular matrix. J Biomech 2001;34:1375-86.
140 You L, Temiyasathit S, Lee P, Kim C, Tummala P, Yao W, Kingery W, Malone AM, Kwon RY, Jacobs CR. Osteocytes as mechanosensors in the inhibition of bone resorption due to mechanical loading. Bone 2008;42:172-9.
141 Young DR, Niklowitz WJ, Brown RJ, Jee WSS. Immobilization-associated osteoporosis in primates. Bone 1986;7:109-17.
142 Zerwekh JE, Ruml LA, Gottschalk F, Pak CYC. The effects of twelve weeks of bed rest on bone histology, biochemical markers of bone turnover, and calcium homeostasis in eleven normal subjects. J Bone Miner Res 1998;6:1594-1601.
143 Zhao H, Ross FP, Teitelbaum SL. Unoccupied αvβ3 integrin regulates osteoclast apoptosis by transmitting a positive death signal. Mol Endocrinol 2005;19:771-80.
144 Zhao S, Kato Y, Zhang Y, Harris S, Ahuja SS, Bonewald LF. MLO-Y4 osteocyte-like cells support osteoclast formation and activation. J Bone Miner Res 2002;17:2068-79.
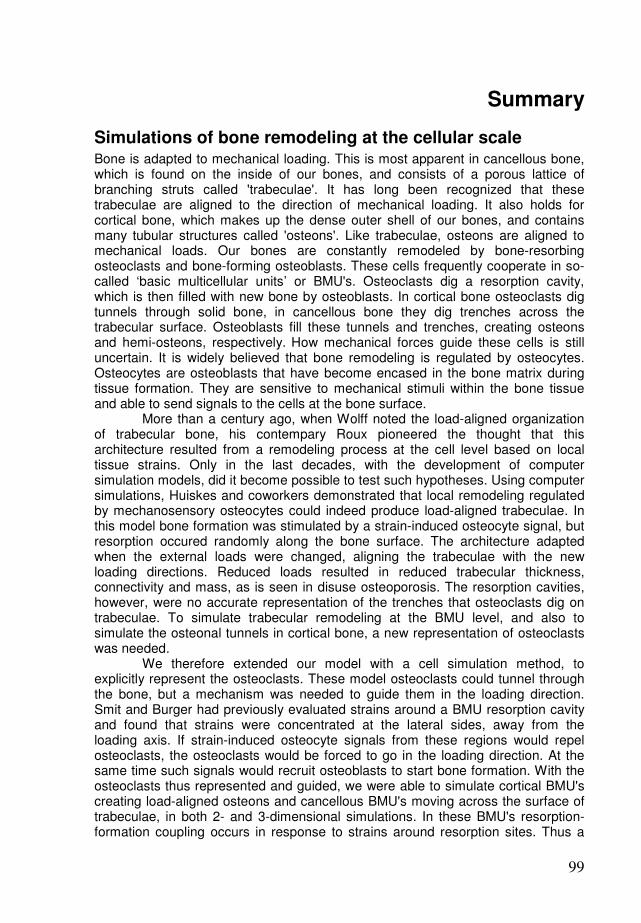
99
Summary
Simulations of bone remodeling at the cellular scale Bone is adapted to mechanical loading. This is most apparent in cancellous bone, which is found on the inside of our bones, and consists of a porous lattice of branching struts called 'trabeculae'. It has long been recognized that these trabeculae are aligned to the direction of mechanical loading. It also holds for cortical bone, which makes up the dense outer shell of our bones, and contains many tubular structures called 'osteons'. Like trabeculae, osteons are aligned to mechanical loads. Our bones are constantly remodeled by bone-resorbing osteoclasts and bone-forming osteoblasts. These cells frequently cooperate in so-called ‘basic multicellular units’ or BMU's. Osteoclasts dig a resorption cavity, which is then filled with new bone by osteoblasts. In cortical bone osteoclasts dig tunnels through solid bone, in cancellous bone they dig trenches across the trabecular surface. Osteoblasts fill these tunnels and trenches, creating osteons and hemi-osteons, respectively. How mechanical forces guide these cells is still uncertain. It is widely believed that bone remodeling is regulated by osteocytes. Osteocytes are osteoblasts that have become encased in the bone matrix during tissue formation. They are sensitive to mechanical stimuli within the bone tissue and able to send signals to the cells at the bone surface. More than a century ago, when Wolff noted the load-aligned organization of trabecular bone, his contempary Roux pioneered the thought that this architecture resulted from a remodeling process at the cell level based on local tissue strains. Only in the last decades, with the development of computer simulation models, did it become possible to test such hypotheses. Using computer simulations, Huiskes and coworkers demonstrated that local remodeling regulated by mechanosensory osteocytes could indeed produce load-aligned trabeculae. In this model bone formation was stimulated by a strain-induced osteocyte signal, but resorption occured randomly along the bone surface. The architecture adapted when the external loads were changed, aligning the trabeculae with the new loading directions. Reduced loads resulted in reduced trabecular thickness, connectivity and mass, as is seen in disuse osteoporosis. The resorption cavities, however, were no accurate representation of the trenches that osteoclasts dig on trabeculae. To simulate trabecular remodeling at the BMU level, and also to simulate the osteonal tunnels in cortical bone, a new representation of osteoclasts was needed. We therefore extended our model with a cell simulation method, to explicitly represent the osteoclasts. These model osteoclasts could tunnel through the bone, but a mechanism was needed to guide them in the loading direction. Smit and Burger had previously evaluated strains around a BMU resorption cavity and found that strains were concentrated at the lateral sides, away from the loading axis. If strain-induced osteocyte signals from these regions would repel osteoclasts, the osteoclasts would be forced to go in the loading direction. At the same time such signals would recruit osteoblasts to start bone formation. With the osteoclasts thus represented and guided, we were able to simulate cortical BMU's creating load-aligned osteons and cancellous BMU's moving across the surface of trabeculae, in both 2- and 3-dimensional simulations. In these BMU's resorption-formation coupling occurs in response to strains around resorption sites. Thus a

100
simple regulation mechanism, in which strain-induced osteocyte signals inhibit osteoclasts and stimulate osteoblasts, could regulate the steering of and coupling within BMU's. Some of the most intriguing results were unforeseen. We found that the model produced wider osteons at a lower loading magnitude. This could explain the difference in osteon diameter that exists between the endosteal (inner) and periosteal (outer) side of the cortex, with generally wider osteons in the less-strained endosteal side. We also found that a steep gradient in loading magnitude could produce an osteon that 'drifted' towards the less-loaded side. In real bone such 'drifting' osteons generally drift towards the less-strained endosteal side of the cortex, a phenomenon that had not yet been explained. We also found that if a region of osteocyte death (therefore lacking osteoclast-repelling signals) was introduced near the path of the BMU, it would redirect its course to resorb this region. This may provide a mechanism for damage removal, because osteocyte death is associated with microdamage. The dead osteocyte region, however, was quite artificial, since no damage algorithms were included in the model. Therefore, we incorporated damage algorithms into the model, to better understand the implications of microdamage-targeted resorption. That remodeling will repair damage is far from trivial. Especially when loading is already intense enough to cause microdamage, adding resorption spaces might just make the problem worse. There are indications that so-called 'fatigue fractures' are preceded by 'runaway resorption'. In our simulations we found that remodeling tends to remove damage under a 'moderate' fatigue regimen, but it exacerbates damage under an 'intense' fatigue regimen. In this light it became of interest to review the effect of osteocyte death on bone formation. In our models we assumed strain-induced stimulatory signals from osteocyte to osteoblast, and osteocyte death would therefore cause a drop in bone formation. However, it was discovered in recent years that osteocytes inhibit bone formation via the protein sclerostin. This appears to be at odds with our stimulatory model, but if sclerostin secretion by the osteocyte decreases with strain, it could fulfill the same function. We used computer simulations to show that a sclerostin-based model is also able to produce a load-aligned trabecular architecture. The interesting difference appears when osteocytes are lost. Whereas formation drops in the stimulatory model, it gets a temporary boost in the inhibitory model, which prevents the loss of trabeculae. This has interesting implications, in particular for microdamage repair.
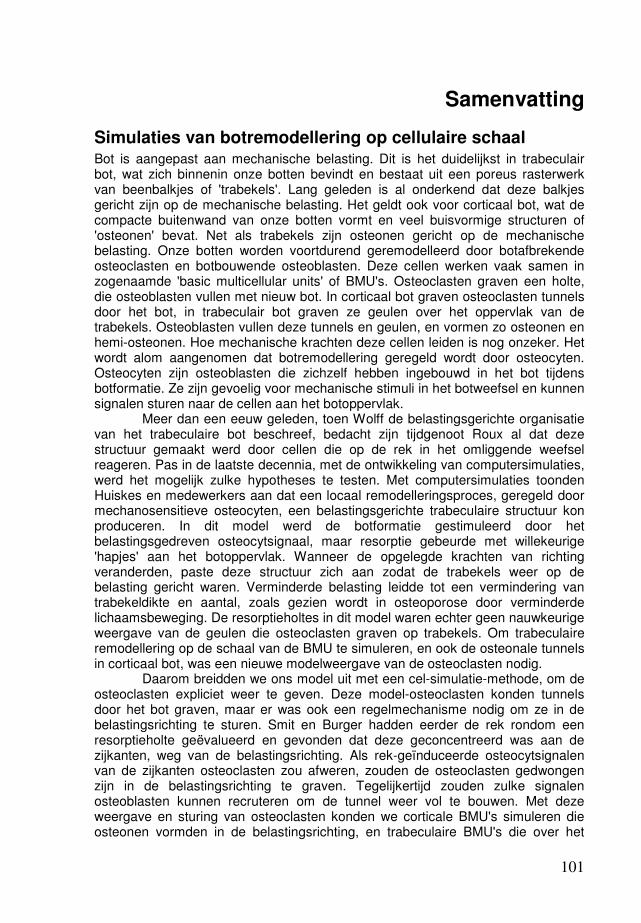
101
Samenvatting
Simulaties van botremodellering op cellulaire schaal Bot is aangepast aan mechanische belasting. Dit is het duidelijkst in trabeculair bot, wat zich binnenin onze botten bevindt en bestaat uit een poreus rasterwerk van beenbalkjes of 'trabekels'. Lang geleden is al onderkend dat deze balkjes gericht zijn op de mechanische belasting. Het geldt ook voor corticaal bot, wat de compacte buitenwand van onze botten vormt en veel buisvormige structuren of 'osteonen' bevat. Net als trabekels zijn osteonen gericht op de mechanische belasting. Onze botten worden voortdurend geremodelleerd door botafbrekende osteoclasten en botbouwende osteoblasten. Deze cellen werken vaak samen in zogenaamde 'basic multicellular units' of BMU's. Osteoclasten graven een holte, die osteoblasten vullen met nieuw bot. In corticaal bot graven osteoclasten tunnels door het bot, in trabeculair bot graven ze geulen over het oppervlak van de trabekels. Osteoblasten vullen deze tunnels en geulen, en vormen zo osteonen en hemi-osteonen. Hoe mechanische krachten deze cellen leiden is nog onzeker. Het wordt alom aangenomen dat botremodellering geregeld wordt door osteocyten. Osteocyten zijn osteoblasten die zichzelf hebben ingebouwd in het bot tijdens botformatie. Ze zijn gevoelig voor mechanische stimuli in het botweefsel en kunnen signalen sturen naar de cellen aan het botoppervlak. Meer dan een eeuw geleden, toen Wolff de belastingsgerichte organisatie van het trabeculaire bot beschreef, bedacht zijn tijdgenoot Roux al dat deze structuur gemaakt werd door cellen die op de rek in het omliggende weefsel reageren. Pas in de laatste decennia, met de ontwikkeling van computersimulaties, werd het mogelijk zulke hypotheses te testen. Met computersimulaties toonden Huiskes en medewerkers aan dat een locaal remodelleringsproces, geregeld door mechanosensitieve osteocyten, een belastingsgerichte trabeculaire structuur kon produceren. In dit model werd de botformatie gestimuleerd door het belastingsgedreven osteocytsignaal, maar resorptie gebeurde met willekeurige 'hapjes' aan het botoppervlak. Wanneer de opgelegde krachten van richting veranderden, paste deze structuur zich aan zodat de trabekels weer op de belasting gericht waren. Verminderde belasting leidde tot een vermindering van trabekeldikte en aantal, zoals gezien wordt in osteoporose door verminderde lichaamsbeweging. De resorptieholtes in dit model waren echter geen nauwkeurige weergave van de geulen die osteoclasten graven op trabekels. Om trabeculaire remodellering op de schaal van de BMU te simuleren, en ook de osteonale tunnels in corticaal bot, was een nieuwe modelweergave van de osteoclasten nodig. Daarom breidden we ons model uit met een cel-simulatie-methode, om de osteoclasten expliciet weer te geven. Deze model-osteoclasten konden tunnels door het bot graven, maar er was ook een regelmechanisme nodig om ze in de belastingsrichting te sturen. Smit en Burger hadden eerder de rek rondom een resorptieholte geëvalueerd en gevonden dat deze geconcentreerd was aan de zijkanten, weg van de belastingsrichting. Als rek-geïnduceerde osteocytsignalen van de zijkanten osteoclasten zou afweren, zouden de osteoclasten gedwongen zijn in de belastingsrichting te graven. Tegelijkertijd zouden zulke signalen osteoblasten kunnen recruteren om de tunnel weer vol te bouwen. Met deze weergave en sturing van osteoclasten konden we corticale BMU's simuleren die osteonen vormden in de belastingsrichting, en trabeculaire BMU's die over het
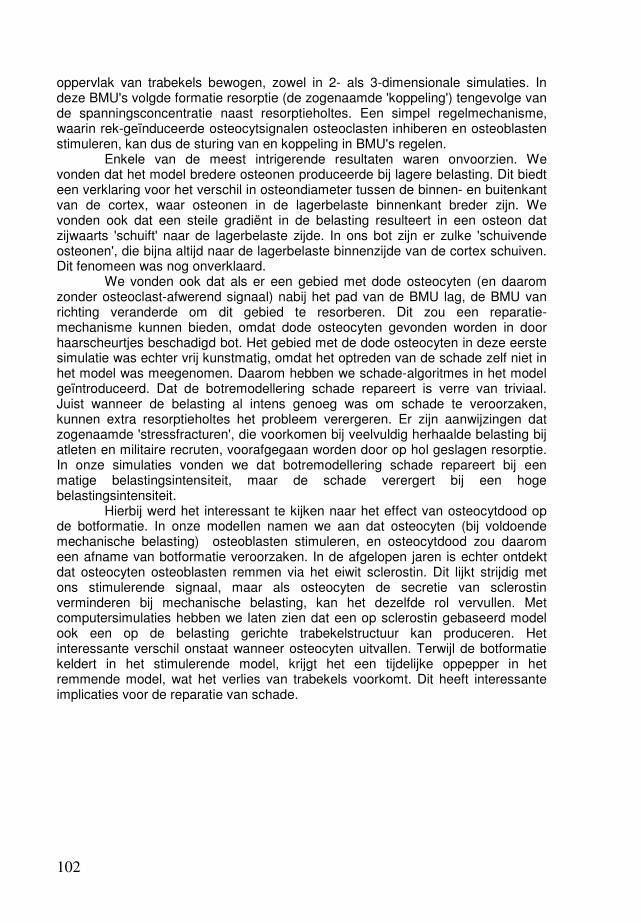
102
oppervlak van trabekels bewogen, zowel in 2- als 3-dimensionale simulaties. In deze BMU's volgde formatie resorptie (de zogenaamde 'koppeling') tengevolge van de spanningsconcentratie naast resorptieholtes. Een simpel regelmechanisme, waarin rek-geïnduceerde osteocytsignalen osteoclasten inhiberen en osteoblasten stimuleren, kan dus de sturing van en koppeling in BMU's regelen. Enkele van de meest intrigerende resultaten waren onvoorzien. We vonden dat het model bredere osteonen produceerde bij lagere belasting. Dit biedt een verklaring voor het verschil in osteondiameter tussen de binnen- en buitenkant van de cortex, waar osteonen in de lagerbelaste binnenkant breder zijn. We vonden ook dat een steile gradiënt in de belasting resulteert in een osteon dat zijwaarts 'schuift' naar de lagerbelaste zijde. In ons bot zijn er zulke 'schuivende osteonen', die bijna altijd naar de lagerbelaste binnenzijde van de cortex schuiven. Dit fenomeen was nog onverklaard. We vonden ook dat als er een gebied met dode osteocyten (en daarom zonder osteoclast-afwerend signaal) nabij het pad van de BMU lag, de BMU van richting veranderde om dit gebied te resorberen. Dit zou een reparatie-mechanisme kunnen bieden, omdat dode osteocyten gevonden worden in door haarscheurtjes beschadigd bot. Het gebied met de dode osteocyten in deze eerste simulatie was echter vrij kunstmatig, omdat het optreden van de schade zelf niet in het model was meegenomen. Daarom hebben we schade-algoritmes in het model geïntroduceerd. Dat de botremodellering schade repareert is verre van triviaal. Juist wanneer de belasting al intens genoeg was om schade te veroorzaken, kunnen extra resorptieholtes het probleem verergeren. Er zijn aanwijzingen dat zogenaamde 'stressfracturen', die voorkomen bij veelvuldig herhaalde belasting bij atleten en militaire recruten, voorafgegaan worden door op hol geslagen resorptie. In onze simulaties vonden we dat botremodellering schade repareert bij een matige belastingsintensiteit, maar de schade verergert bij een hoge belastingsintensiteit. Hierbij werd het interessant te kijken naar het effect van osteocytdood op de botformatie. In onze modellen namen we aan dat osteocyten (bij voldoende mechanische belasting) osteoblasten stimuleren, en osteocytdood zou daarom een afname van botformatie veroorzaken. In de afgelopen jaren is echter ontdekt dat osteocyten osteoblasten remmen via het eiwit sclerostin. Dit lijkt strijdig met ons stimulerende signaal, maar als osteocyten de secretie van sclerostin verminderen bij mechanische belasting, kan het dezelfde rol vervullen. Met computersimulaties hebben we laten zien dat een op sclerostin gebaseerd model ook een op de belasting gerichte trabekelstructuur kan produceren. Het interessante verschil onstaat wanneer osteocyten uitvallen. Terwijl de botformatie keldert in het stimulerende model, krijgt het een tijdelijke oppepper in het remmende model, wat het verlies van trabekels voorkomt. Dit heeft interessante implicaties voor de reparatie van schade.

103
Dankwoord Mijn eerste aanraking met computermodellen van bot was bij het vak "Computersimulaties en Biomedische Applicaties", gegeven door de BioModeling en bioInformatics groep van Peter Hilbers. Ik herinner me nog dat ik helemaal enthousiast was over de trabekelstructuur die zich op mijn computerscherm ontwikkelde. De andere onderwerpen in deze groep waren al even interessant (mag ik dat zeggen?), van de fosfolipiden die samen een celmembraan vormden tot de hartspiercellen die elkaar aanvuurden. Ten eerste wil ik daarom Peter bedanken, naast zijn hulp aan mijn promotiewerk, voor het fijne en vrije onderzoeksklimaat in zijn groep. Hier heb ik tijdens mijn afstudeer- en promotiejaren een stimulerende werkplek gehad. De man van de botmodellen was daar Ronald Ruimerman. Bij jou kon ik tijdens mijn afstuderen en de eerste jaren van mijn promotie altijd terecht voor overleg en discussies. Ik heb ook erg genoten van de conferenties waar we samen naar toe gingen, zoals in Chicago en in Geneve, en waar je me een beetje wegwijs hebt gemaakt (in eerste instantie altijd naar de Starbucks). Mijn promotie ben ik begonnen onder leiding van Rik Huiskes. Rik, jouw enthousiasme voor botonderzoek en je grote ervaring in het veld hebben me erg gestimuleerd. Ik wil je ook bedanken voor de hulp die je hebt geboden bij mijn eerste artikels, en voor de interesse die je altijd in mijn werk hebt getoond. Toen Ronald van werkgever veranderde, en ook Rik vanwege zijn gezondheid minder betrokken kon zijn bij mijn promotiewerk, miste ik dan ook dat fijne overleg dat ik altijd met jullie had gehad. Bert, ik weet nog dat je toen bij me kwam met de vraag "Wie begeleidt jou nu eigenlijk?" Vanaf dat moment was jij het in ieder geval. Ik kon altijd bij je aankloppen voor overleg. Je ongedwongen houding en positieve kijk waren daarbij zeer prettig. Ik wil je ook erg bedanken voor je hulp bij het schrijven van de artikelen. Keita, bedankt voor je aansporingen om mijn onderzoek te focussen en eens een datum te gaan prikken. Zonder dat had dit boekje hier vast nog niet gelegen. I would also like to thank Chris, Patrick, Klaas, and Vincent for being on my commitee and taking the time and interest to read my thesis. Rikkert en Sander, bedankt dat jullie mijn paranimfen wilden zijn, geheel volgens onze Paranimf Triple Entente. Daarnaast kon ik ook altijd op jullie rekenen voor gezellige avondjes uit, en drukke gameweekenden. Ook alle anderen uit het BMI lab, met wie ik censuurwaardige lunchtafelgesprekken, bioclubs, filmavonden, borrels, kanotochten, Diplomacy-, Civ- en Age-games gedeeld heb, wil ik bedanken voor een fijne tijd. Probeer het lunchlogboek een beetje te blijven vullen! And a similar thank you goes to my colleagues from the Orthopaedic Biomechanics group. I enjoyed our time together, whether at the TUE, in Udine, at conferences, or in Gemmenich. More philosophical and intoxicated discussions should follow. Verder wil ik nog mijn familie, vrienden, en huisgenoten bedanken voor hun interesse en de nodige afleiding. Aan het thuisfront wil ik met name mijn ouders bedanken. Pap, dat ik je computerarsenaal voor mijn werk heb mogen inzetten, en mam, dat ik bij jullie in Arcen zo luxueus aan mijn proefschrift heb kunnen werken. En Sonrisa, jou wil ik bedanken voor de mooie tijden die we samen beleefd hebben en hopelijk nog zullen beleven.

105
Curriculum vitae René van Oers was born on June 15, 1980, in Meijel, The Netherlands. He attended the Valuascollege in Venlo, where he obtained his Gymnasium diploma in 1998. He studied Biomedical Engineering at the Eindhoven University of Technology (TU/e) from 1998 until February 2005. As part of this study he did an internship for four months at the Royal College of Surgeons in Ireland (RCSI), Dublin, under professor Clive Lee. This internship involved fatigue testing of bone and the staining of microcracks. René continued on the subject of bone in his graduation project, at the TU/e within the BioModeling and bioInformatics group, where he worked with computational models of bone remodeling. After obtaining his MSc degree, he continued this work in his PhD research under professor Rik Huiskes, within the Bone- and Orthopaedic Biomechanics group. In this research he used computer models to simulate bone remodeling at the cellular scale.

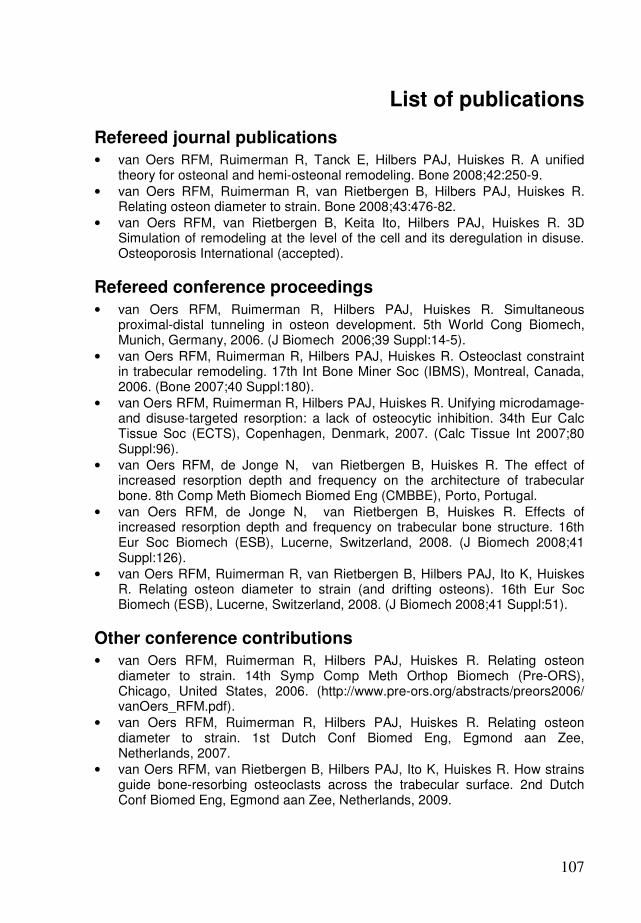
107
List of publications
Refereed journal publications
• van Oers RFM, Ruimerman R, Tanck E, Hilbers PAJ, Huiskes R. A unified theory for osteonal and hemi-osteonal remodeling. Bone 2008;42:250-9.
• van Oers RFM, Ruimerman R, van Rietbergen B, Hilbers PAJ, Huiskes R. Relating osteon diameter to strain. Bone 2008;43:476-82.
• van Oers RFM, van Rietbergen B, Keita Ito, Hilbers PAJ, Huiskes R. 3D Simulation of remodeling at the level of the cell and its deregulation in disuse. Osteoporosis International (accepted).
Refereed conference proceedings
• van Oers RFM, Ruimerman R, Hilbers PAJ, Huiskes R. Simultaneous proximal-distal tunneling in osteon development. 5th World Cong Biomech, Munich, Germany, 2006. (J Biomech 2006;39 Suppl:14-5).
• van Oers RFM, Ruimerman R, Hilbers PAJ, Huiskes R. Osteoclast constraint in trabecular remodeling. 17th Int Bone Miner Soc (IBMS), Montreal, Canada, 2006. (Bone 2007;40 Suppl:180).
• van Oers RFM, Ruimerman R, Hilbers PAJ, Huiskes R. Unifying microdamage- and disuse-targeted resorption: a lack of osteocytic inhibition. 34th Eur Calc Tissue Soc (ECTS), Copenhagen, Denmark, 2007. (Calc Tissue Int 2007;80 Suppl:96).
• van Oers RFM, de Jonge N, van Rietbergen B, Huiskes R. The effect of increased resorption depth and frequency on the architecture of trabecular bone. 8th Comp Meth Biomech Biomed Eng (CMBBE), Porto, Portugal.
• van Oers RFM, de Jonge N, van Rietbergen B, Huiskes R. Effects of increased resorption depth and frequency on trabecular bone structure. 16th Eur Soc Biomech (ESB), Lucerne, Switzerland, 2008. (J Biomech 2008;41 Suppl:126).
• van Oers RFM, Ruimerman R, van Rietbergen B, Hilbers PAJ, Ito K, Huiskes R. Relating osteon diameter to strain (and drifting osteons). 16th Eur Soc Biomech (ESB), Lucerne, Switzerland, 2008. (J Biomech 2008;41 Suppl:51).
Other conference contributions
• van Oers RFM, Ruimerman R, Hilbers PAJ, Huiskes R. Relating osteon diameter to strain. 14th Symp Comp Meth Orthop Biomech (Pre-ORS), Chicago, United States, 2006. (http://www.pre-ors.org/abstracts/preors2006/ vanOers_RFM.pdf).
• van Oers RFM, Ruimerman R, Hilbers PAJ, Huiskes R. Relating osteon diameter to strain. 1st Dutch Conf Biomed Eng, Egmond aan Zee, Netherlands, 2007.
• van Oers RFM, van Rietbergen B, Hilbers PAJ, Ito K, Huiskes R. How strains guide bone-resorbing osteoclasts across the trabecular surface. 2nd Dutch Conf Biomed Eng, Egmond aan Zee, Netherlands, 2009.
108
• van Oers RFM, van Rietbergen B, Hilbers PAJ, Ito K, Huiskes R. A sclerostin-based theory for strain-induced bone formation. 19th Dutch Soc Calc Bone Metab (NVCB), Zeist, Netherlands, 2009.