Simulation of Roll CompactionSimulation of Roll...
43
Simulation of Roll Compaction Simulation of Roll Compaction Bruno C. Hancock, PhD
Transcript of Simulation of Roll CompactionSimulation of Roll...

Simulation of Roll CompactionSimulation of Roll Compaction
Bruno C. Hancock, PhD

Acknowledgements• Glenn Carlson• Mike Cavanaugh
g
• Beth Langdon• Jeff Moriarty• Matthew Mullarneyy• Cindy Oksanen• Chris Sinko• Barbara Spong• Barbara Spong• Andre Zinchuk

Outline
• Motivation• Scale-up parameters• Approach taken• Verification• Limitations• Custom instrument design

Motivation
• Roll compaction process development consumes a i ifi t t f d f i t tsignificant amount of powder for equipment set-up
and to achieve steady-state operation
• Can the process by simulated to save material early in development?in development?
C t i t• Constraints– Quick and simple
Achieve proof of concept using existing equipment– Achieve proof-of-concept using existing equipment– Fit-for-purpose

Roll compactionp
Powder
PowderRibbons Granules
Ribbon
(Images courtesy of PharmTech magazine)

History• Fuel “briquette” production
took off in 1870s Europe & USUS
• Initially horizontal fixed rollers used ; gravity-fed
• Used today for variety of y ymetal ores & chemicals
• Frank Chilson developed a pgranulator in mid-1950s
• Fitzpatrick started to make pharmaceutical mills in p1940s
• First “Chilsonator” Model SN in late 1950s
(Slide courtesy of Ian Smales)

ine)
ech
mag
azi
of P
harm
Tees
cou
rtesy
(Im
age

(Images courtesy of PharmTech magazine)

Feeder
Rolls
Mill
Lab scale Pilot scale
(Images courtesy of Vector Corp)

Important considerations for simulation
1. Continuous process2 N d t d t d
• Can we simulate using a batch process?2. Need to understand
critical product attributes3. Need to identify important
batch process?• How best to characterize
product (ribbons)?3. Need to identify important process parameters
4. Slow compaction & low ti f
p ( )• Process parameter
criticality?N d f lcompaction forces
5. Integral feeding & milling operations
• No need for complex hydraulics
• May need to simulateoperations May need to simulate feeding and milling

Solid Fraction Spectrum
TabletsTablets
Ribbons
P dPowders
0.0 0.1 0.2 0.3 0.4 0.5 0.6 0.7 0.8 0.9 1.0Solid Fraction

Ribbon Solid Fraction SurveyyThickness and solid fraction of ribbons produced
during clinical manufacturing(n = 23, Vector type compactors)
Parameter Solid Fraction Thickness (mm)
Mean 0.71 1.91
Maximum 0.80 3.43
Minimum 0.57 1.33
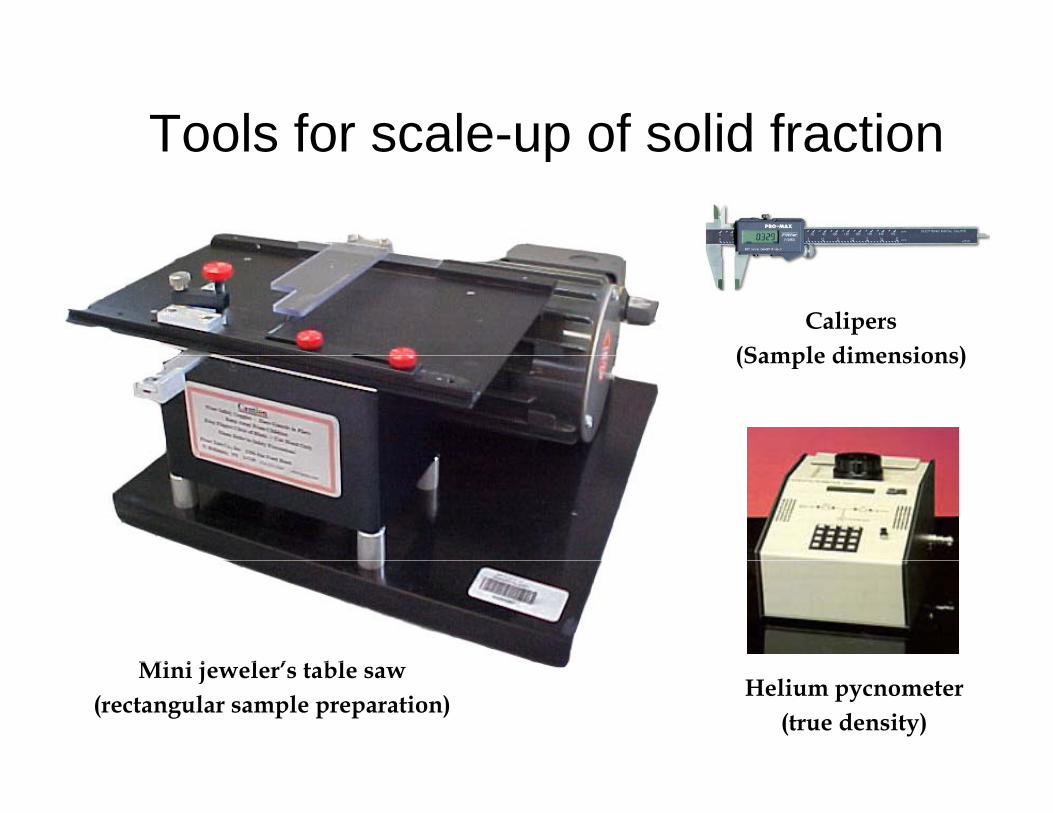
Tools for scale-up of solid fractionTools for scale up of solid fraction
Calipers(Sample dimensions)(Sample dimensions)
Mi i j l ’ t bl Mini jeweler’s table saw(rectangular sample preparation)
Helium pycnometer(true density)

Ribbon Solid Fraction Determination
mm
Flat or serrated ribbons
t
)**(Fρρ
s
t
e VtlwVS +==
nwthVs **139.0*)( −=w1 w2
l2
t1h1w1 w2
l2
t1h1
Sample
l
2
Ribbon
SerrationSample
l
2
Ribbon
Serration
l1
t2h2
l1
t2h2

Ribbon Solid Fraction by Displacement
GeoPyc (Micromeritics Corp)

Comparison of methods

Ribbon Solid Fraction by Lasery• Includes automated weighing• Irregular shaped samples OK• Irregular shaped samples OK
Laserwww.customlabsoftware.com/
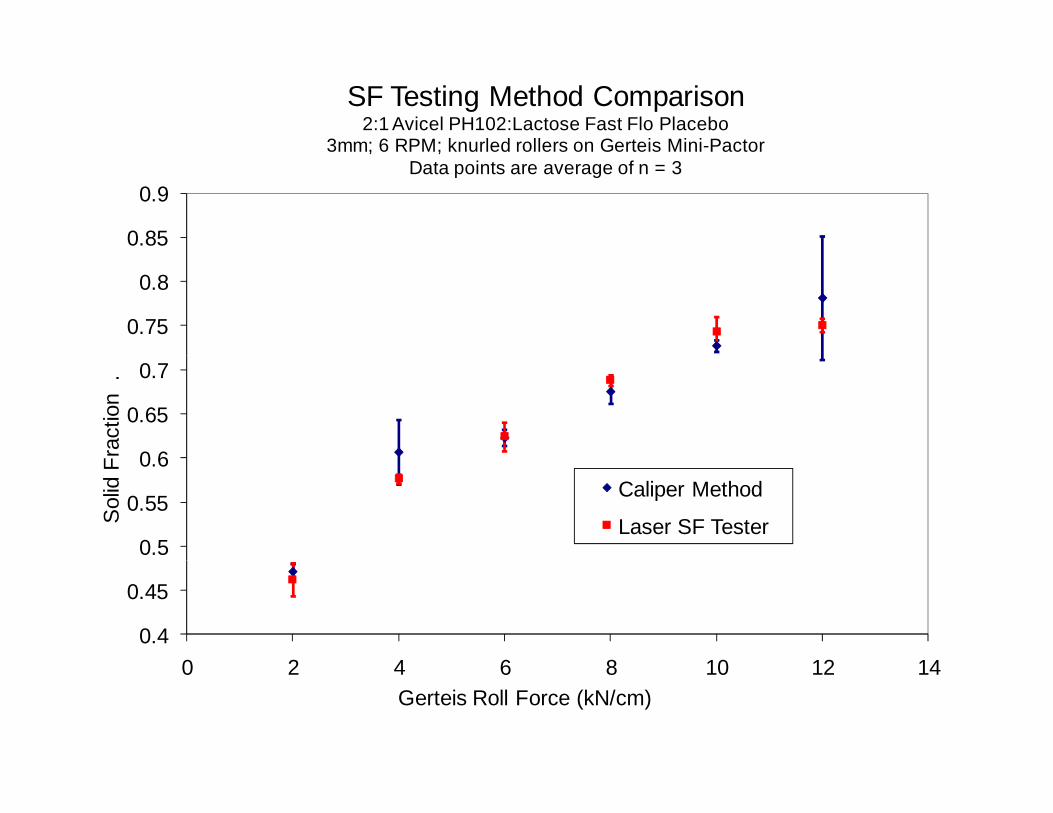
SF Testing Method Comparison 2:1 Avicel PH102:Lactose Fast Flo Placebo
3mm; 6 RPM; knurled rollers on Gerteis Mini-Pactor
0.85
0.9
3mm; 6 RPM; knurled rollers on Gerteis Mini Pactor Data points are average of n = 3
0.75
0.8
0 6
0.65
0.7
ract
ion
.
0.5
0.55
0.6
Sol
id F
Caliper Method
Laser SF Tester
0.4
0.45
0 2 4 6 8 10 12 140 2 4 6 8 10 12 14Gerteis Roll Force (kN/cm)

Tensile Strength DeterminationF
W t
RIBBON SAMPLE
1
2 3L
1.8
2T tWLF
23σ
××
=
1 01.21.41.61.8
(kg)
σT - Tensile Strength
0.40.60.81.0
Forc
e (
Ribbon fracture
0.00.2
500 700 900 1100Time (nominal)
Sample Dimensions:~ 10mm X 25mm

Precision of Ribbon Tests
• Solid fraction– Mean measurement RSD ~3 %
Ribbon SFs of 0.66 & 0.69 are equivalentS f & ffRibbon SFs of 0.66 & 0.70 are different
• Tensile strength– Mean measurement RSD ~6 %
Ribbon TSs of 1.00 MPa & 1.06 MPa are equivalentRibbon TSs of 1.00 MPa & 1.10 MPa are different

Critical process parameters– roll dimensions
• diameter, width, type– material mass flow rate
• ribbon thickness & solid fraction (density)– compaction conditions
• force (pressure) & force application rate (roll speed & di t )diameter)
– feeding & milling conditionsfeeder design screen size etc• feeder design, screen size, etc
– environmental conditions• temperature and humidity• temperature and humidity

Simulation approach
<<Insert picture of tooling>>p g

Principal underlying simulationy g

Simulation Proof of Concept
5 0
6.0Real Ribbons
Si l t d Ribb
4.0
5.0
h (M
Pa)
Simulated Ribbons
3.0
e S
tren
gth
1 0
2.0
Ten
sile
0.0
1.0
0.45 0.50 0.55 0.60 0.65 0.70 0.75Solid Fraction

Scale-up30.0
58686-10-74 (Stability Lot)
53783-100-74 (Microformulation Lot)
20.0
25.0
d
( )
ED-G-111-402 (Clinical Lot)
15.0
% R
etai
ned
5 0
10.0
%
0.0
5.0
840 420 250 177 149 74 44 <44840 420 250 177 149 74 44 <44Particle Size Distribution (micrometers)

Limitations
• Shear forces are neglected– However, these are expected to be quite low in
pharmaceutical roll compactors• By pass is not simulated• By-pass is not simulated
– Easily accounted for by adding uncompacted powder to the ribbons
• Interaction with seals (at ribbon edge) not simulated– Solid fraction variability can be introduced by varying y y y g
compaction settings during the experiments• Feeding process is not simulated
– Same as for tablet compaction simulation

Unanswered questions
• Force/pressure measurements– See next slide
• Feeding simulation– Pulsing from screw feeders– Air entrapment
Optimal roll design• Optimal roll design– Smooth vs. knurled
• Lubrication• Lubrication– Friction with rolls?– Nip angle?– Nip angle?
• Milling simulation

Use in Formulation
50 70
One Example: Correlation between Roller Compactor Pressure and Simulator Compression Stress Can be Used for Process Scale-up
40
45
50
m2 )
60
70
MPa
)
Avicel PH 101Material AMaterial B
real ribbons
25
30
35
re (k
g f/c
m
40
50
Stre
ss (Msimulated ribbons
15
20
25
l Pre
ssur
20
30
pres
sion
5
10
15
Rol
10
20
Com
p
00.40 0.45 0.50 0.55 0.60 0.65 0.70 0.75 0.80
Solid Fraction
0

Development of a custom instrument
• Motivation– Eliminate the need to use tablet compaction simulator– Portability
Increased level of powder containment– Increased level of powder containment– High volume/throughput operation– Custom software and analysis toolsCustom software and analysis tools

Touch Panel Control Screen & Electronics
Self Contained Compaction
A /A blArea/Assembly
Hydraulic DriveSystem
HEPA filtering unit
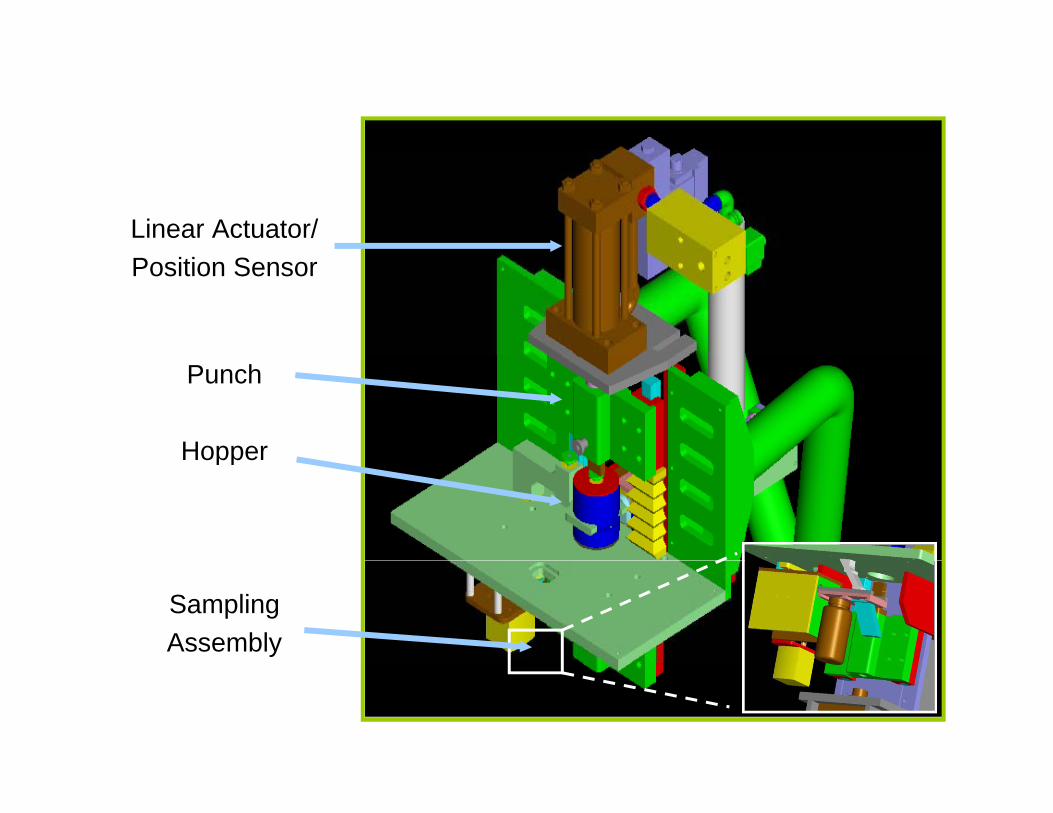
Linear Actuator/Position Sensor
Punch
HopperHopper
Sampling Assembly


Integrated Milling f Ribbof Ribbons

Custom milling simulatorg
• Diameter and width reduced
• Screens cut down to fit

Software Interface & Controls•User can select
degrees (o) or # of rotations for cw/ccw
movement
•Rotational speed•Rotational speed (0..180 RPM) is scaled
down to equivalent rotor tip speeds on
the Mini-pactorthe Mini pactor
•Counter counts number or rotationnumber or rotation
cycles•Run/Stop buttons allow the mill to be
38
run continuously until user hits stop
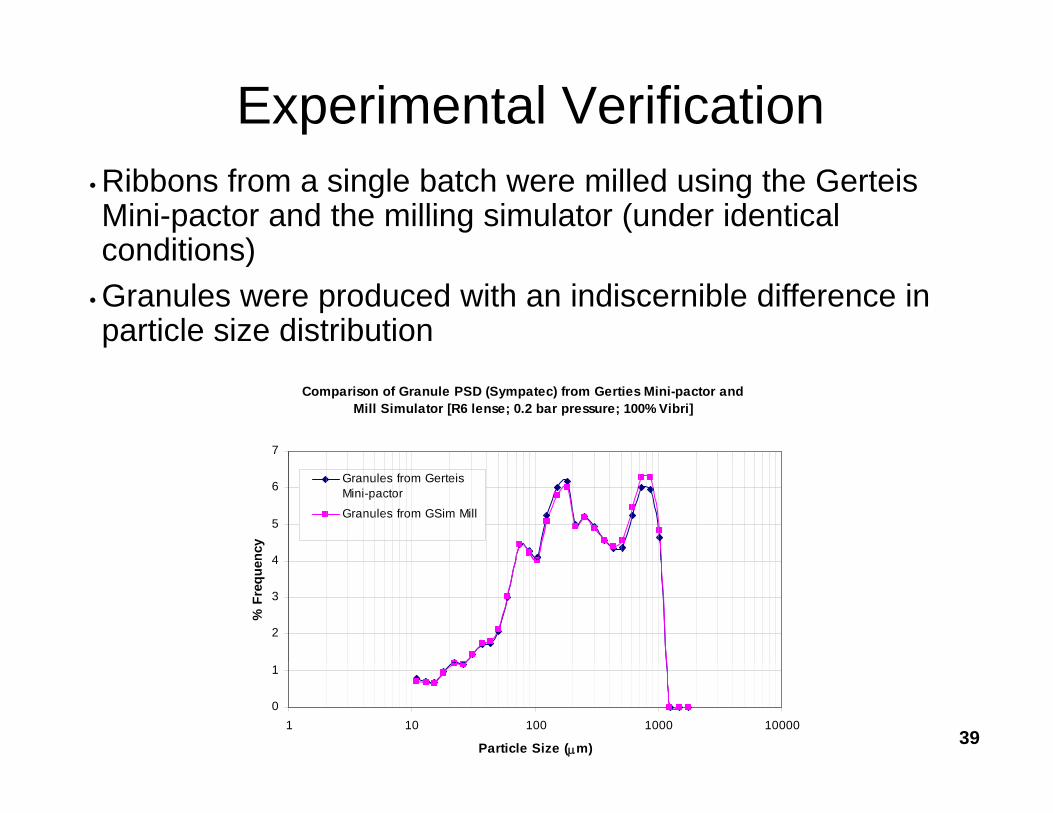
Experimental Verification• Ribbons from a single batch were milled using the Gerteis Mini-pactor and the milling simulator (under identical conditions)conditions)
• Granules were produced with an indiscernible difference in particle size distribution
Comparison of Granule PSD (Sympatec) from Gerties Mini-pactor and Mill Simulator [R6 lense; 0.2 bar pressure; 100% Vibri]
7
4
5
6
ncy
Granules from GerteisMini-pactorGranules from GSim Mill
2
3
4
% F
requ
e
39
0
1
1 10 100 1000 10000
Particle Size (μm)

Summaryy
• Simulation of roll compaction can be achieved by dif i th i fil t bl tmodifying the compression profile on a tablet
compaction simulatorTh i lifi ti / i ti i d• The simplifications/approximations required appear to be reasonable
• Material property tests for ribbons need to be• Material property tests for ribbons need to be developed and implemented
• The impact of processing changes can be studied in• The impact of processing changes can be studied in detail using less than 100g of powder blend
• If needed a custom simulator can be readily builtIf needed, a custom simulator can be readily built


![IEEE TRANSACTIONS ON SEMICONDUCTOR …people.clarkson.edu/~ccetinka/Articles/1_PDF_Files/Article051_2009... · 10–40 nm and 60 nm polystyrene latex (PSL) [11], [12]). As with other](https://static.fdocuments.us/doc/165x107/5a7a6b2e7f8b9a01528e0db1/ieee-transactions-on-semiconductor-ccetinkaarticles1pdffilesarticle05120091040.jpg)