ASIAN LANGUAGE AND CULTURE: IMPLICATIONS FOR ASSESSMENT AND INTERVENTION

Simulating network intervention strategies: Implications for adoption ofbehaviour
Badham, J., Kee, F., & Hunter, R. F. (2018). Simulating network intervention strategies: Implications for adoptionof behaviour. Network Science, 6(2), 265-280.
Published in:Network Science
Document Version:Peer reviewed version
Queen's University Belfast - Research Portal:Link to publication record in Queen's University Belfast Research Portal
Publisher rights© 2017 Cambridge University Press.This work is made available online in accordance with the publisher’s policies. Please refer to any applicable terms of use of the publisher.
General rightsCopyright for the publications made accessible via the Queen's University Belfast Research Portal is retained by the author(s) and / or othercopyright owners and it is a condition of accessing these publications that users recognise and abide by the legal requirements associatedwith these rights.
Take down policyThe Research Portal is Queen's institutional repository that provides access to Queen's research output. Every effort has been made toensure that content in the Research Portal does not infringe any person's rights, or applicable UK laws. If you discover content in theResearch Portal that you believe breaches copyright or violates any law, please contact [email protected].
Download date:13. Nov. 2021
ZU064-05-FPR Seeds*Implications 13 April 2017 16:17
Under consideration for publication in Network Science 1
Simulating network intervention strategies:Implications for adoption of behaviour
JENNIFER BADHAM, FRANK KEE and RUTH F HUNTERUKCRC Centre of Excellence (Northern Ireland), Queens University Belfast
University Rd, Belfast BT7 1NN, United Kingdom
Abstract
This study uses simulation over real and artificial networks to compare the eventual adoption out-comes of network interventions, operationalised as idealised contagion processes with different setsof seeds. While the performance depends on the details of both the network and behaviour adop-tion mechanism, interventions with seeds that are central to the network are more effective thanrandom selection in the majority of simulations, with faster or more complete adoption throughoutthe network. These results provide additional theoretical justification for utilising relevant networkinformation in the design of public health behaviour interventions.
Research furthering our understanding of the structure and function of social networkshas provided new opportunities for the design and implementation of behaviour change in-terventions to improve the health of individuals and populations (Kim et al., 2015; Valenteet al., 2015). Social network interventions involve purposeful efforts to use social networkdata to help generate social influence, accelerate behaviour change, and/or achieve desir-able outcomes among individuals, communities, organizations, or populations (Valente,2012). For example, social network data can be used to reach new participants, selectindividuals on the basis of some network property who may have greater roles in providinginformation or support, or focus the intervention on certain groups of people; thereforeimproving the efficiency and effectiveness of public health interventions.
Such interventions work by the spreading or diffusion of knowledge and behaviouracross interpersonal ties (Valente & Davis, 1999). Mechanisms that might explain theeffect of networks on health behaviour change include conformity to group norms, socialfacilitation, social learning, social comparison, social support, coercion, and competition(Berkman et al., 2014; Latkin & Knowlton, 2015).
Designing interventions that deliberately foster such mechanisms requires (1) someunderstanding of the network over which the intervention is to be applied, (2) the identifi-cation of certain individuals or groups within a network to spread or diffuse the knowledgeand/or behaviour, and (3) that these individuals or groups are willing to take part in theintervention and implement the intervention processes.
A recent review (Valente, 2012) identified four categories of approaches in which socialnetworks could be used to change behaviours within public health interventions:
• Individuals: identify participants with specific network properties to act as behaviourchange agents;
ZU064-05-FPR Seeds*Implications 13 April 2017 16:17
2 Badham, Kee, Hunter
• Segmentation: identify communities for the intervention to be applied to all mem-bers;
• Induction: encourage additional use of network, for example by encouraging par-ticipants to talk about specific issues with their friends or asking participants tonominate potential participants;
• Alteration: change the network, for example by assigning a support person for eachparticipant, introducing new people and edges into the network.
The ‘Individuals’ category provides the most basic intervention approach and includesmethods to identify seed participants based on their network position, with the objectivethat these participants will then promote the desired health behaviour to their social net-work via different mechanisms of behaviour change. A common real world intervention ofthis type involves using peer nominations to identify leaders to promote behaviour changeand has been shown to increase behaviour adoption in both real world studies and fittedsimulations (Kim et al., 2015; Zhang et al., 2015). Other network informed interventionapproaches, such as identifying peripherals or bridges to act as seeds, have received onlylimited attention.
Some network intervention approaches in the other categories can also be conceptualisedas identifying seeds for cascades of behaviour adoption; segmentation identifies groups ofpeople to change at the same time, and induction stimulates peer-to-peer interaction tocreate cascades in information/behavioural diffusion. However, the specific network prop-erties to be used to identify such seeds so as to maximise the diffusion of the intervention,and thus the behaviour, is not clear.
The purpose of this study is to extend the work by Valente (2012) in describing andclassifying these network interventions, so as to investigate the potential impact of theseapproaches on the effectiveness of public health behaviour, as measured by speed or reachof behaviour adoption. We show that interventions seeded with people who are most centralin the network would lead to greater and faster adoption than random initial participantsover a variety of network structures under two general diffusion mechanisms.
1 Methods
We compare the effect of interventions using agent-based simulation, with a model imple-mented in NetLogo (Wilensky, 1999). Fifteen network interventions are included; sevenfrom the Individuals class, two Segmentation, four Induction, and two random selectionmethods for comparison (Table 1). To ensure comparability across simulations, we havenot included interventions that alter the network (distinct class in Valente, 2012) or cannotbe operationalised in the form of identification of seed participants for behaviour diffusion.
These interventions were used to select seed adopters in both real and generated net-works. Required network properties were calculated using a combination of the NetLogoNetwork extension (Wilensky, 1999), NetLogo R extension (Thiele & Grimm, 2010) toaccess R (R Core Team, 2015, v3.2) and the R packages ‘igraph’ (Csardi & Nepusz, 2006)and ‘keyplayer’ (An & Liu, 2016), which implements group selection (Borgatti, 2006).
The interventions were simulated over eight different networks: four real-world net-works and four generated networks (including the hypothetical network used by Valente
ZU064-05-FPR Seeds*Implications 13 April 2017 16:17
Diffusion Seeds 3
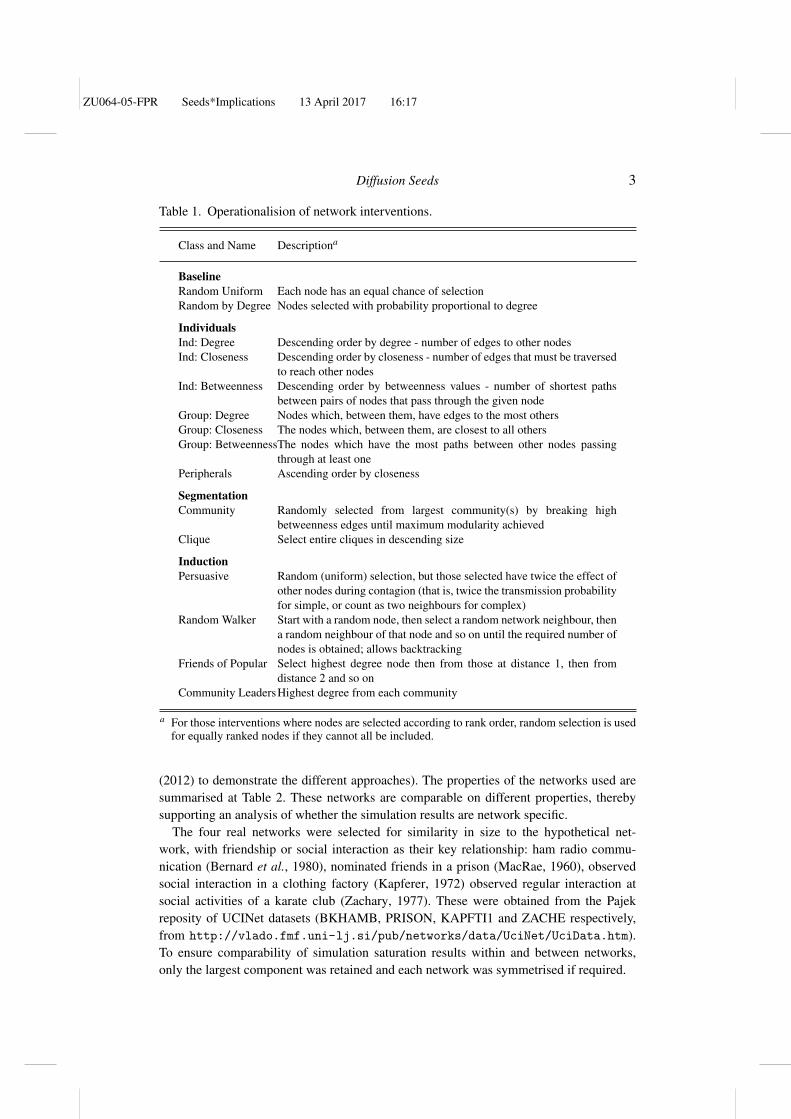
Table 1. Operationalision of network interventions.
Class and Name Descriptiona
BaselineRandom Uniform Each node has an equal chance of selectionRandom by Degree Nodes selected with probability proportional to degree
IndividualsInd: Degree Descending order by degree - number of edges to other nodesInd: Closeness Descending order by closeness - number of edges that must be traversed
to reach other nodesInd: Betweenness Descending order by betweenness values - number of shortest paths
between pairs of nodes that pass through the given nodeGroup: Degree Nodes which, between them, have edges to the most othersGroup: Closeness The nodes which, between them, are closest to all othersGroup: BetweennessThe nodes which have the most paths between other nodes passing
through at least onePeripherals Ascending order by closeness
SegmentationCommunity Randomly selected from largest community(s) by breaking high
betweenness edges until maximum modularity achievedClique Select entire cliques in descending size
InductionPersuasive Random (uniform) selection, but those selected have twice the effect of
other nodes during contagion (that is, twice the transmission probabilityfor simple, or count as two neighbours for complex)
Random Walker Start with a random node, then select a random network neighbour, thena random neighbour of that node and so on until the required number ofnodes is obtained; allows backtracking
Friends of Popular Select highest degree node then from those at distance 1, then fromdistance 2 and so on
Community LeadersHighest degree from each community
a For those interventions where nodes are selected according to rank order, random selection is usedfor equally ranked nodes if they cannot all be included.
(2012) to demonstrate the different approaches). The properties of the networks used aresummarised at Table 2. These networks are comparable on different properties, therebysupporting an analysis of whether the simulation results are network specific.
The four real networks were selected for similarity in size to the hypothetical net-work, with friendship or social interaction as their key relationship: ham radio commu-nication (Bernard et al., 1980), nominated friends in a prison (MacRae, 1960), observedsocial interaction in a clothing factory (Kapferer, 1972) observed regular interaction atsocial activities of a karate club (Zachary, 1977). These were obtained from the Pajekreposity of UCINet datasets (BKHAMB, PRISON, KAPFTI1 and ZACHE respectively,from http://vlado.fmf.uni-lj.si/pub/networks/data/UciNet/UciData.htm).To ensure comparability of simulation saturation results within and between networks,only the largest component was retained and each network was symmetrised if required.
ZU064-05-FPR Seeds*Implications 13 April 2017 16:17
4 Badham, Kee, Hunter
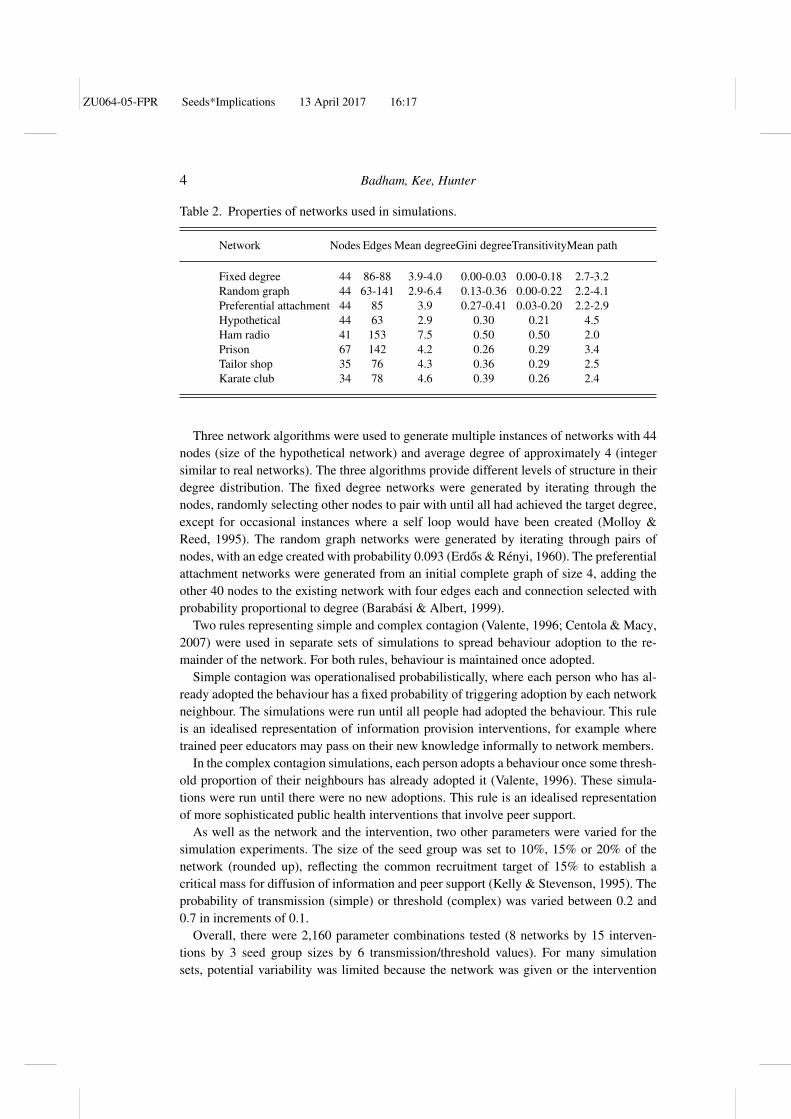
Table 2. Properties of networks used in simulations.
Network Nodes Edges Mean degreeGini degreeTransitivityMean path
Fixed degree 44 86-88 3.9-4.0 0.00-0.03 0.00-0.18 2.7-3.2Random graph 44 63-141 2.9-6.4 0.13-0.36 0.00-0.22 2.2-4.1Preferential attachment 44 85 3.9 0.27-0.41 0.03-0.20 2.2-2.9Hypothetical 44 63 2.9 0.30 0.21 4.5Ham radio 41 153 7.5 0.50 0.50 2.0Prison 67 142 4.2 0.26 0.29 3.4Tailor shop 35 76 4.3 0.36 0.29 2.5Karate club 34 78 4.6 0.39 0.26 2.4
Three network algorithms were used to generate multiple instances of networks with 44nodes (size of the hypothetical network) and average degree of approximately 4 (integersimilar to real networks). The three algorithms provide different levels of structure in theirdegree distribution. The fixed degree networks were generated by iterating through thenodes, randomly selecting other nodes to pair with until all had achieved the target degree,except for occasional instances where a self loop would have been created (Molloy &Reed, 1995). The random graph networks were generated by iterating through pairs ofnodes, with an edge created with probability 0.093 (Erdos & Renyi, 1960). The preferentialattachment networks were generated from an initial complete graph of size 4, adding theother 40 nodes to the existing network with four edges each and connection selected withprobability proportional to degree (Barabasi & Albert, 1999).
Two rules representing simple and complex contagion (Valente, 1996; Centola & Macy,2007) were used in separate sets of simulations to spread behaviour adoption to the re-mainder of the network. For both rules, behaviour is maintained once adopted.
Simple contagion was operationalised probabilistically, where each person who has al-ready adopted the behaviour has a fixed probability of triggering adoption by each networkneighbour. The simulations were run until all people had adopted the behaviour. This ruleis an idealised representation of information provision interventions, for example wheretrained peer educators may pass on their new knowledge informally to network members.
In the complex contagion simulations, each person adopts a behaviour once some thresh-old proportion of their neighbours has already adopted it (Valente, 1996). These simula-tions were run until there were no new adoptions. This rule is an idealised representationof more sophisticated public health interventions that involve peer support.
As well as the network and the intervention, two other parameters were varied for thesimulation experiments. The size of the seed group was set to 10%, 15% or 20% of thenetwork (rounded up), reflecting the common recruitment target of 15% to establish acritical mass for diffusion of information and peer support (Kelly & Stevenson, 1995). Theprobability of transmission (simple) or threshold (complex) was varied between 0.2 and0.7 in increments of 0.1.
Overall, there were 2,160 parameter combinations tested (8 networks by 15 interven-tions by 3 seed group sizes by 6 transmission/threshold values). For many simulationsets, potential variability was limited because the network was given or the intervention
ZU064-05-FPR Seeds*Implications 13 April 2017 16:17
Diffusion Seeds 5
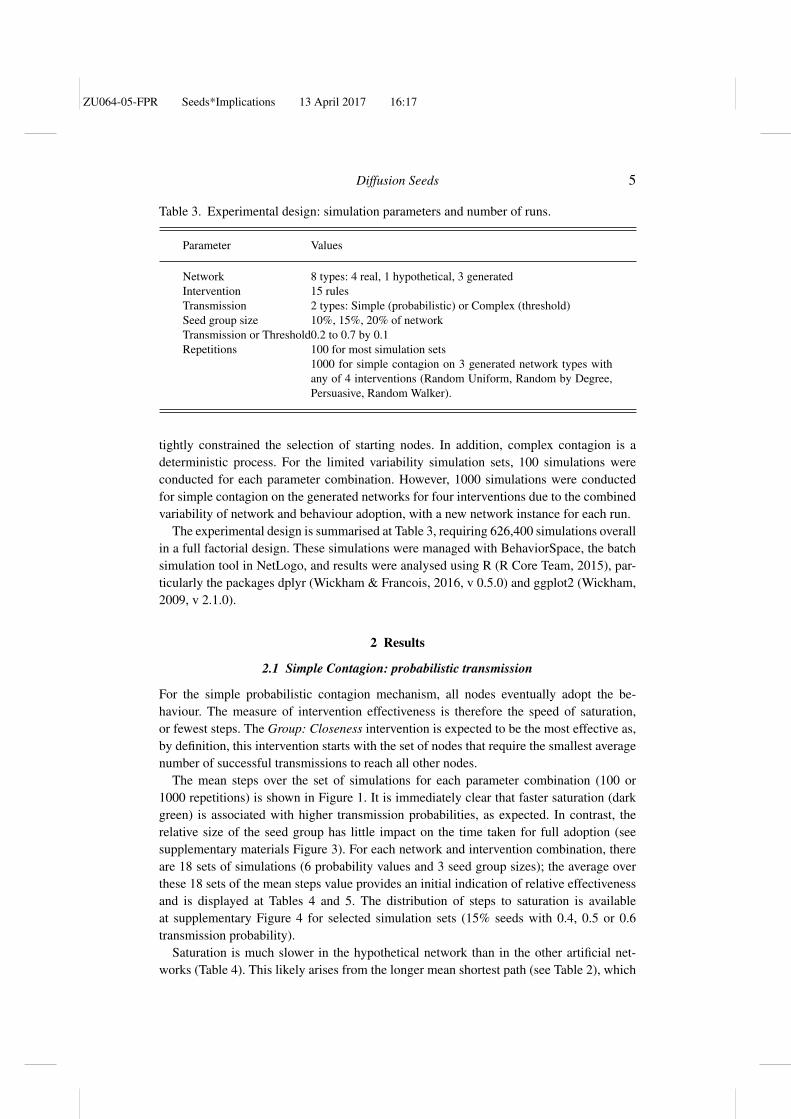
Table 3. Experimental design: simulation parameters and number of runs.
Parameter Values
Network 8 types: 4 real, 1 hypothetical, 3 generatedIntervention 15 rulesTransmission 2 types: Simple (probabilistic) or Complex (threshold)Seed group size 10%, 15%, 20% of networkTransmission or Threshold0.2 to 0.7 by 0.1Repetitions 100 for most simulation sets
1000 for simple contagion on 3 generated network types withany of 4 interventions (Random Uniform, Random by Degree,Persuasive, Random Walker).
tightly constrained the selection of starting nodes. In addition, complex contagion is adeterministic process. For the limited variability simulation sets, 100 simulations wereconducted for each parameter combination. However, 1000 simulations were conductedfor simple contagion on the generated networks for four interventions due to the combinedvariability of network and behaviour adoption, with a new network instance for each run.
The experimental design is summarised at Table 3, requiring 626,400 simulations overallin a full factorial design. These simulations were managed with BehaviorSpace, the batchsimulation tool in NetLogo, and results were analysed using R (R Core Team, 2015), par-ticularly the packages dplyr (Wickham & Francois, 2016, v 0.5.0) and ggplot2 (Wickham,2009, v 2.1.0).
2 Results
2.1 Simple Contagion: probabilistic transmission
For the simple probabilistic contagion mechanism, all nodes eventually adopt the be-haviour. The measure of intervention effectiveness is therefore the speed of saturation,or fewest steps. The Group: Closeness intervention is expected to be the most effective as,by definition, this intervention starts with the set of nodes that require the smallest averagenumber of successful transmissions to reach all other nodes.
The mean steps over the set of simulations for each parameter combination (100 or1000 repetitions) is shown in Figure 1. It is immediately clear that faster saturation (darkgreen) is associated with higher transmission probabilities, as expected. In contrast, therelative size of the seed group has little impact on the time taken for full adoption (seesupplementary materials Figure 3). For each network and intervention combination, thereare 18 sets of simulations (6 probability values and 3 seed group sizes); the average overthese 18 sets of the mean steps value provides an initial indication of relative effectivenessand is displayed at Tables 4 and 5. The distribution of steps to saturation is availableat supplementary Figure 4 for selected simulation sets (15% seeds with 0.4, 0.5 or 0.6transmission probability).
Saturation is much slower in the hypothetical network than in the other artificial net-works (Table 4). This likely arises from the longer mean shortest path (see Table 2), which
ZU064-05-FPR Seeds*Implications 13 April 2017 16:17
6 Badham, Kee, Hunter
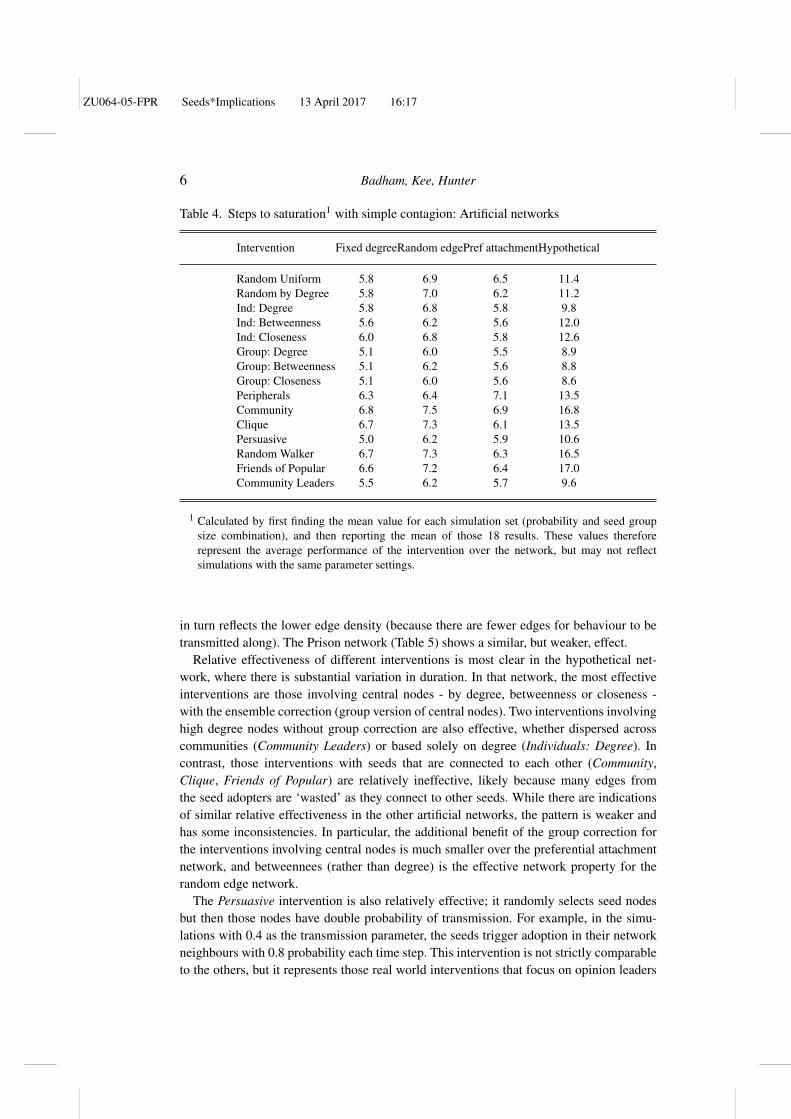
Table 4. Steps to saturation1 with simple contagion: Artificial networks
Intervention Fixed degreeRandom edgePref attachmentHypothetical
Random Uniform 5.8 6.9 6.5 11.4Random by Degree 5.8 7.0 6.2 11.2Ind: Degree 5.8 6.8 5.8 9.8Ind: Betweenness 5.6 6.2 5.6 12.0Ind: Closeness 6.0 6.8 5.8 12.6Group: Degree 5.1 6.0 5.5 8.9Group: Betweenness 5.1 6.2 5.6 8.8Group: Closeness 5.1 6.0 5.6 8.6Peripherals 6.3 6.4 7.1 13.5Community 6.8 7.5 6.9 16.8Clique 6.7 7.3 6.1 13.5Persuasive 5.0 6.2 5.9 10.6Random Walker 6.7 7.3 6.3 16.5Friends of Popular 6.6 7.2 6.4 17.0Community Leaders 5.5 6.2 5.7 9.6
1 Calculated by first finding the mean value for each simulation set (probability and seed groupsize combination), and then reporting the mean of those 18 results. These values thereforerepresent the average performance of the intervention over the network, but may not reflectsimulations with the same parameter settings.
in turn reflects the lower edge density (because there are fewer edges for behaviour to betransmitted along). The Prison network (Table 5) shows a similar, but weaker, effect.
Relative effectiveness of different interventions is most clear in the hypothetical net-work, where there is substantial variation in duration. In that network, the most effectiveinterventions are those involving central nodes - by degree, betweenness or closeness -with the ensemble correction (group version of central nodes). Two interventions involvinghigh degree nodes without group correction are also effective, whether dispersed acrosscommunities (Community Leaders) or based solely on degree (Individuals: Degree). Incontrast, those interventions with seeds that are connected to each other (Community,Clique, Friends of Popular) are relatively ineffective, likely because many edges fromthe seed adopters are ‘wasted’ as they connect to other seeds. While there are indicationsof similar relative effectiveness in the other artificial networks, the pattern is weaker andhas some inconsistencies. In particular, the additional benefit of the group correction forthe interventions involving central nodes is much smaller over the preferential attachmentnetwork, and betweennees (rather than degree) is the effective network property for therandom edge network.
The Persuasive intervention is also relatively effective; it randomly selects seed nodesbut then those nodes have double probability of transmission. For example, in the simu-lations with 0.4 as the transmission parameter, the seeds trigger adoption in their networkneighbours with 0.8 probability each time step. This intervention is not strictly comparableto the others, but it represents those real world interventions that focus on opinion leaders

ZU064-05-FPR Seeds*Implications 13 April 2017 16:17
Diffusion Seeds 7
Table 5. Steps to saturation1 with simple contagion: Real world networks.
Intervention Ham radioPrisonTailor shopKarate Club
Random Uniform 7.6 9.2 6.8 5.9Random by Degree 7.5 9.4 6.7 5.6Ind: Degree 7.2 9.1 6.8 5.1Ind: Betweenness 7.0 9.1 6.5 5.0Ind: Closeness 7.3 9.4 6.6 5.1Group: Degree 6.9 7.9 5.8 4.9Group: Betweenness 7.3 8.3 6.0 4.9Group: Closeness 6.9 7.5 5.7 4.9Peripherals 7.5 7.9 7.0 5.9Community 7.8 10.6 7.5 7.0Clique 7.4 10.2 6.9 5.6Persuasive 7.4 8.5 6.1 5.3Random Walker 7.7 10.5 6.9 6.2Friends of Popular 7.6 11.0 6.9 6.6Community Leaders 7.6 9.0 6.2 4.9
1 Calculated by first finding the mean value for each simulation set (probability and seed groupsize combination), and then reporting the mean of those 18 results. These values thereforerepresent the average performance of the intervention over the network, but may not reflectsimulations with the same parameter settings.
within the network, regardless of their network characteristics. It is likely, of course, thatsuch leaders in the real world will also be popular, but that combined effect is not simulated.
The broad pattern of intervention efficiency also occurs over real networks; interventionsthat involve central nodes result in shorter times to saturation than interventions withseeds from a single community (Table 5). As with the artificial networks, the need forthe group correction is network dependent, with a larger impact for the Prison and Tailorshop networks in comparison to the Ham radio and Karate club networks. The CommunityLeaders intervention has no performance benefit over Random Uniform selection for theHam Radio network. As for the artificial networks, Community, Clique and Friends ofPopular are relatively ineffective; except that Clique is effective over two networks, Hamradio and Karate Club.
While the average durations for the 18 parameter combinations provide a broad pattern,the relative performance must be examined for comparable simulation sets: each specificcombination of transmission probability and seed proportion. From Figure 1 (and supple-mentary Figure 4), the general pattern observed in the mean durations (Tables 4 and 5)is a reasonable indicator of relative effectiveness for comparable simulations, with somenoise in the patterns. The Peripherals intervention is consistently ineffective, as expectedbecause the seeds are selected to be as far from other nodes as possible (and will thereforerequire the maximum number of steps to saturate the network). Those that use a connectedsubnetwork (Community, Random Walker, Friends of Popular) have similar results as Ran-dom Uniform seeds are generally even less effective than Peripherals, perhaps indicatinga tendency for the behaviour adoption to be ‘trapped’ in part of the network. The Clique
ZU064-05-FPR Seeds*Implications 13 April 2017 16:17
8 Badham, Kee, Hunter
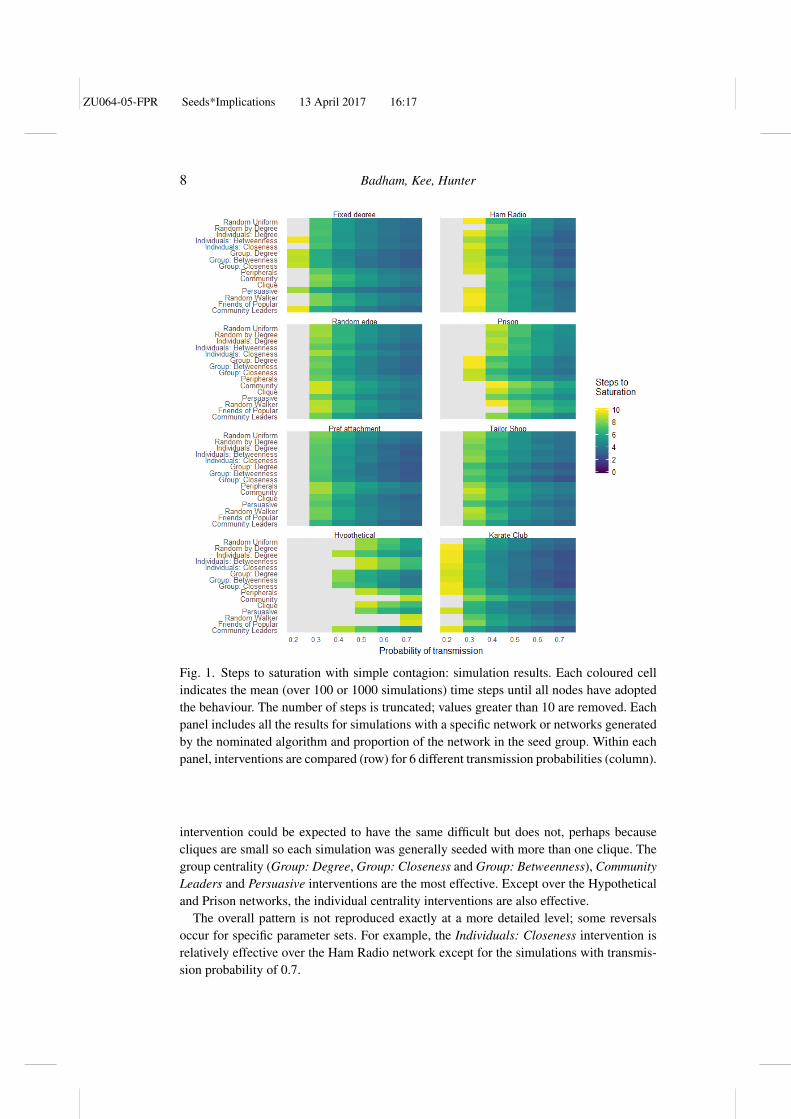
Fig. 1. Steps to saturation with simple contagion: simulation results. Each coloured cellindicates the mean (over 100 or 1000 simulations) time steps until all nodes have adoptedthe behaviour. The number of steps is truncated; values greater than 10 are removed. Eachpanel includes all the results for simulations with a specific network or networks generatedby the nominated algorithm and proportion of the network in the seed group. Within eachpanel, interventions are compared (row) for 6 different transmission probabilities (column).
intervention could be expected to have the same difficult but does not, perhaps becausecliques are small so each simulation was generally seeded with more than one clique. Thegroup centrality (Group: Degree, Group: Closeness and Group: Betweenness), CommunityLeaders and Persuasive interventions are the most effective. Except over the Hypotheticaland Prison networks, the individual centrality interventions are also effective.
The overall pattern is not reproduced exactly at a more detailed level; some reversalsoccur for specific parameter sets. For example, the Individuals: Closeness intervention isrelatively effective over the Ham Radio network except for the simulations with transmis-sion probability of 0.7.
ZU064-05-FPR Seeds*Implications 13 April 2017 16:17
Diffusion Seeds 9
2.2 Complex Contagion: Adoption with neighbourhood threshold
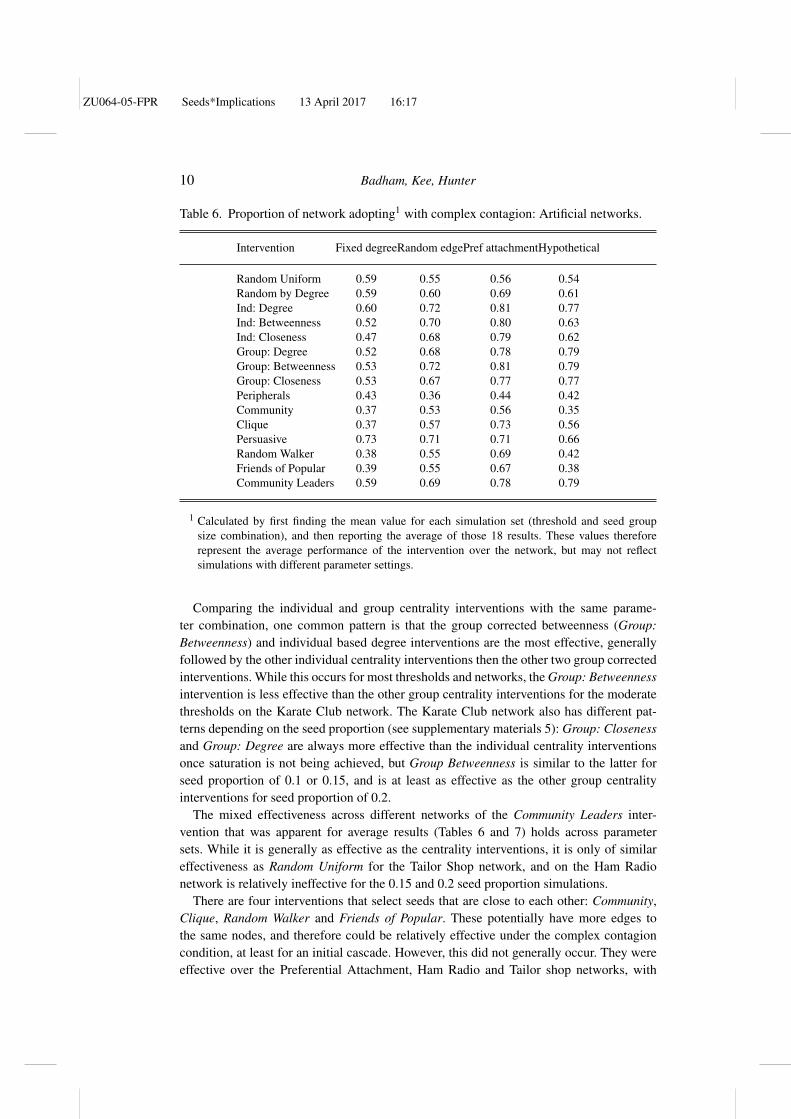
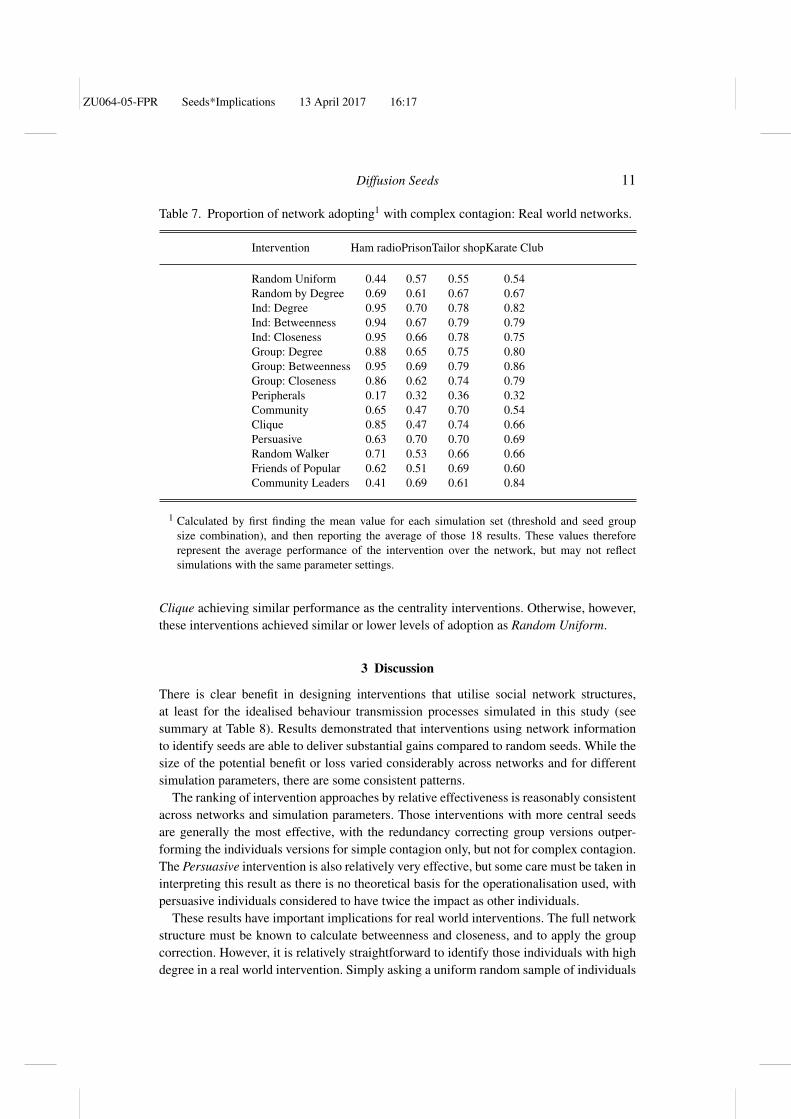
For the complex threshold contagion mechanism, the simulation ends when no new nodesadopt the behaviour. The measure of intervention effectiveness is therefore the proportionof the network that eventually adopt the behaviour. For each network and interventioncombination, there are 18 sets of simulations (6 threshold levels and 3 seed group sizes);the average over these 18 sets of the mean proportion adopted is displayed at Tables 6and 7. The distribution of proportion adopted is available at supplementary Figure 6 forselected simulation sets (15% seeds with 0.4, 0.5 or 0.6 threshold proportion).
For many combinations of network and intervention, the median result is that all nodesadopt (not shown specifically, but visible for some simulation sets in supplementary Figure6). That is, for each threshold and seed proportion combination, more than half the sim-ulations lead to adoption by all nodes. Nevertheless, there is sufficient differentiation tosuggest that the pattern for complex contagion has much in common with that for simplecontagion.
The individual and group centrality interventions are most effective but, unlike simplecontagion, the group versions do not lead to higher levels of adoption than the individualsversions. Weighting random selection by degree (Random by Degree) provides some ofthe benefit of central seeds (except for the Fixed Degree network, where such weightinghas no effect). The Persuasive intervention is consistently relatively effective (with similarperformance as the centrality interventions except over the Ham Radio network), and thePeripherals intervention consistently ineffective.
Community Leaders, Community and Clique interventions have mixed results, with noeffect on some networks, but strong relative effectiveness or ineffectiveness on others. aregenerally effective, but have no effect or perform poorly on some networks. For example,Community and Clique perform well over the Ham Radio and Tailor Shop networks, butpoorly on the Prison network, while Community Leaders performs well on the Prison andKarate Club networks but poorly on the Ham Radio and Tailor Shop networks.
For detailed analysis of effectiveness, the mean proportion adopted over the set of simu-lations for each parameter combination (100 repetitions) is shown in Figure 2. As expected,a higher proportion of the network as seeds (see supplementary materials 5) and a lowerthreshold are both associated with higher saturation; the former because there are morenodes already adopted to provide network neighbours that contribute to the pressure toadopt, and the latter because less pressure is required. At the lowest threshold tested,every intervention on every network leads to all nodes adopting except for the Peripheralsintervention on the Ham Radio network, which has no diffusion from the seeds. At theother extreme with a 0.7 threshold, only some interventions are successful in diffusingto new nodes; with only one set of simulations able to reach saturation, the IndividualsBetweenness intervention over the Ham Radio network with 20% of the nodes as seeds.The largest difference in effect between interventions therefore arises for intermediatethresholds, where only some are able to trigger potentially several steps in an adoptioncascade. At a threshold of 0.5, some of the interventions induce more than 3 times theadoption level than is achieved by uniform random selection over almost all networks andseed proportions (not Fixed Degree, and only for starting proportion of 0.1 for Hypotheticaland Prison networks).
ZU064-05-FPR Seeds*Implications 13 April 2017 16:17
10 Badham, Kee, Hunter
Table 6. Proportion of network adopting1 with complex contagion: Artificial networks.
Intervention Fixed degreeRandom edgePref attachmentHypothetical
Random Uniform 0.59 0.55 0.56 0.54Random by Degree 0.59 0.60 0.69 0.61Ind: Degree 0.60 0.72 0.81 0.77Ind: Betweenness 0.52 0.70 0.80 0.63Ind: Closeness 0.47 0.68 0.79 0.62Group: Degree 0.52 0.68 0.78 0.79Group: Betweenness 0.53 0.72 0.81 0.79Group: Closeness 0.53 0.67 0.77 0.77Peripherals 0.43 0.36 0.44 0.42Community 0.37 0.53 0.56 0.35Clique 0.37 0.57 0.73 0.56Persuasive 0.73 0.71 0.71 0.66Random Walker 0.38 0.55 0.69 0.42Friends of Popular 0.39 0.55 0.67 0.38Community Leaders 0.59 0.69 0.78 0.79
1 Calculated by first finding the mean value for each simulation set (threshold and seed groupsize combination), and then reporting the average of those 18 results. These values thereforerepresent the average performance of the intervention over the network, but may not reflectsimulations with different parameter settings.
Comparing the individual and group centrality interventions with the same parame-ter combination, one common pattern is that the group corrected betweenness (Group:Betweenness) and individual based degree interventions are the most effective, generallyfollowed by the other individual centrality interventions then the other two group correctedinterventions. While this occurs for most thresholds and networks, the Group: Betweennessintervention is less effective than the other group centrality interventions for the moderatethresholds on the Karate Club network. The Karate Club network also has different pat-terns depending on the seed proportion (see supplementary materials 5): Group: Closenessand Group: Degree are always more effective than the individual centrality interventionsonce saturation is not being achieved, but Group Betweenness is similar to the latter forseed proportion of 0.1 or 0.15, and is at least as effective as the other group centralityinterventions for seed proportion of 0.2.
The mixed effectiveness across different networks of the Community Leaders inter-vention that was apparent for average results (Tables 6 and 7) holds across parametersets. While it is generally as effective as the centrality interventions, it is only of similareffectiveness as Random Uniform for the Tailor Shop network, and on the Ham Radionetwork is relatively ineffective for the 0.15 and 0.2 seed proportion simulations.
There are four interventions that select seeds that are close to each other: Community,Clique, Random Walker and Friends of Popular. These potentially have more edges tothe same nodes, and therefore could be relatively effective under the complex contagioncondition, at least for an initial cascade. However, this did not generally occur. They wereeffective over the Preferential Attachment, Ham Radio and Tailor shop networks, with
ZU064-05-FPR Seeds*Implications 13 April 2017 16:17
Diffusion Seeds 11
Table 7. Proportion of network adopting1 with complex contagion: Real world networks.
Intervention Ham radioPrisonTailor shopKarate Club
Random Uniform 0.44 0.57 0.55 0.54Random by Degree 0.69 0.61 0.67 0.67Ind: Degree 0.95 0.70 0.78 0.82Ind: Betweenness 0.94 0.67 0.79 0.79Ind: Closeness 0.95 0.66 0.78 0.75Group: Degree 0.88 0.65 0.75 0.80Group: Betweenness 0.95 0.69 0.79 0.86Group: Closeness 0.86 0.62 0.74 0.79Peripherals 0.17 0.32 0.36 0.32Community 0.65 0.47 0.70 0.54Clique 0.85 0.47 0.74 0.66Persuasive 0.63 0.70 0.70 0.69Random Walker 0.71 0.53 0.66 0.66Friends of Popular 0.62 0.51 0.69 0.60Community Leaders 0.41 0.69 0.61 0.84
1 Calculated by first finding the mean value for each simulation set (threshold and seed groupsize combination), and then reporting the average of those 18 results. These values thereforerepresent the average performance of the intervention over the network, but may not reflectsimulations with the same parameter settings.
Clique achieving similar performance as the centrality interventions. Otherwise, however,these interventions achieved similar or lower levels of adoption as Random Uniform.
3 Discussion
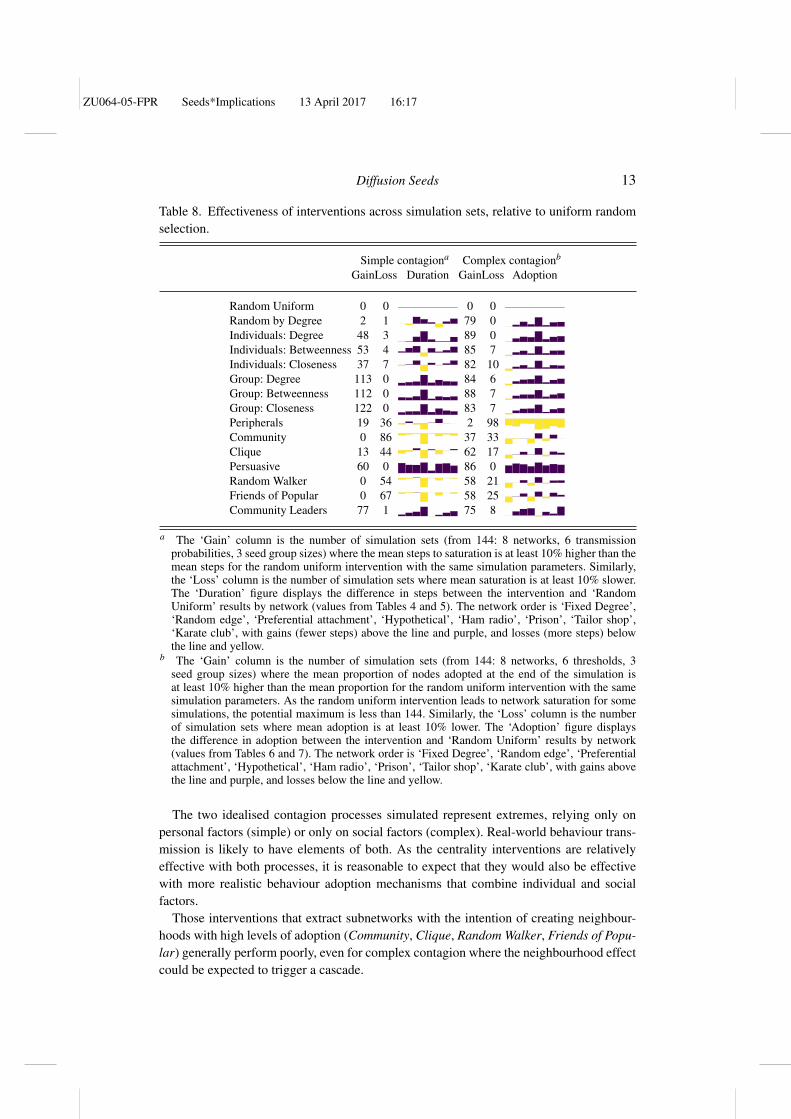
There is clear benefit in designing interventions that utilise social network structures,at least for the idealised behaviour transmission processes simulated in this study (seesummary at Table 8). Results demonstrated that interventions using network informationto identify seeds are able to deliver substantial gains compared to random seeds. While thesize of the potential benefit or loss varied considerably across networks and for differentsimulation parameters, there are some consistent patterns.
The ranking of intervention approaches by relative effectiveness is reasonably consistentacross networks and simulation parameters. Those interventions with more central seedsare generally the most effective, with the redundancy correcting group versions outper-forming the individuals versions for simple contagion only, but not for complex contagion.The Persuasive intervention is also relatively very effective, but some care must be taken ininterpreting this result as there is no theoretical basis for the operationalisation used, withpersuasive individuals considered to have twice the impact as other individuals.
These results have important implications for real world interventions. The full networkstructure must be known to calculate betweenness and closeness, and to apply the groupcorrection. However, it is relatively straightforward to identify those individuals with highdegree in a real world intervention. Simply asking a uniform random sample of individuals

ZU064-05-FPR Seeds*Implications 13 April 2017 16:17
12 Badham, Kee, Hunter
Fig. 2. Proportion of network adopting with complex contagion: simulation results. Eachcoloured cell indicates the mean (over 100 simulations) proportion of nodes that haveadopted the behaviour when no further nodes will adopt. Each panel includes all theresults for simulations with a specific network or networks generated by the nominatedalgorithm and proportion of the network as seed adopters. Within each panel, interventionsare compared (row) for 6 different thresholds that represent the proportion of networkneighbours that must have already adopted for the nodes to adopt the behaviour (column).
to each nominate one of their friends generates a sample that is biased by degree (andwill be weighted by degree with enough steps, see Noh & Rieger, 2004), which achievessome effectiveness gains for complex contagion. Further, such a process is relatively robustwith in-degree highly correlated with the number of nominations for 30% samples insmall networks and smaller proportions in large networks (Costenbader & Valente, 2003;Leskovec & Faloutsos, 2006). This approach has been shown to be effective in publichealth interventions (Kim et al., 2015). Alternatively, nominations can be used to identifyleaders, capturing elements of both degree and persuasive interventions (Campbell et al.,2008).
ZU064-05-FPR Seeds*Implications 13 April 2017 16:17
Diffusion Seeds 13
Table 8. Effectiveness of interventions across simulation sets, relative to uniform randomselection.
Simple contagiona Complex contagionb
GainLoss Duration GainLoss Adoption
Random Uniform 0 0 0 0Random by Degree 2 1 79 0Individuals: Degree 48 3 89 0Individuals: Betweenness 53 4 85 7Individuals: Closeness 37 7 82 10Group: Degree 113 0 84 6Group: Betweenness 112 0 88 7Group: Closeness 122 0 83 7Peripherals 19 36 2 98Community 0 86 37 33Clique 13 44 62 17Persuasive 60 0 86 0Random Walker 0 54 58 21Friends of Popular 0 67 58 25Community Leaders 77 1 75 8
a The ‘Gain’ column is the number of simulation sets (from 144: 8 networks, 6 transmissionprobabilities, 3 seed group sizes) where the mean steps to saturation is at least 10% higher than themean steps for the random uniform intervention with the same simulation parameters. Similarly,the ‘Loss’ column is the number of simulation sets where mean saturation is at least 10% slower.The ‘Duration’ figure displays the difference in steps between the intervention and ‘RandomUniform’ results by network (values from Tables 4 and 5). The network order is ‘Fixed Degree’,‘Random edge’, ‘Preferential attachment’, ‘Hypothetical’, ‘Ham radio’, ‘Prison’, ‘Tailor shop’,‘Karate club’, with gains (fewer steps) above the line and purple, and losses (more steps) belowthe line and yellow.
b The ‘Gain’ column is the number of simulation sets (from 144: 8 networks, 6 thresholds, 3seed group sizes) where the mean proportion of nodes adopted at the end of the simulation isat least 10% higher than the mean proportion for the random uniform intervention with the samesimulation parameters. As the random uniform intervention leads to network saturation for somesimulations, the potential maximum is less than 144. Similarly, the ‘Loss’ column is the numberof simulation sets where mean adoption is at least 10% lower. The ‘Adoption’ figure displaysthe difference in adoption between the intervention and ‘Random Uniform’ results by network(values from Tables 6 and 7). The network order is ‘Fixed Degree’, ‘Random edge’, ‘Preferentialattachment’, ‘Hypothetical’, ‘Ham radio’, ‘Prison’, ‘Tailor shop’, ‘Karate club’, with gains abovethe line and purple, and losses below the line and yellow.
The two idealised contagion processes simulated represent extremes, relying only onpersonal factors (simple) or only on social factors (complex). Real-world behaviour trans-mission is likely to have elements of both. As the centrality interventions are relativelyeffective with both processes, it is reasonable to expect that they would also be effectivewith more realistic behaviour adoption mechanisms that combine individual and socialfactors.
Those interventions that extract subnetworks with the intention of creating neighbour-hoods with high levels of adoption (Community, Clique, Random Walker, Friends of Popu-lar) generally perform poorly, even for complex contagion where the neighbourhood effectcould be expected to trigger a cascade.
ZU064-05-FPR Seeds*Implications 13 April 2017 16:17
14 Badham, Kee, Hunter
The relative effectiveness of other interventions varies between networks and type ofcontagion. In particular, Community Leaders could be expected to be effective as it usesnodes with high degree as seeds, but they may be in different communities and potentiallyfar apart so the benefit may be dispersed. This intervention performed poorly over two realworld networks under both contagion conditions (Ham Radio for both, Prison for simple,and Tailor Shop for complex). The variation suggests that specific structural aspects of theparticular network are important for these interventions.
Further work is required with a selection of networks with similar and dissimilar prop-erties to potentially derive rules for intervention selection based on specific network prop-erties. One of the properties to be varied should be the number of nodes, to assess whetherdifferences in the effectiveness of interventions are affected by network size.
Some prior level of knowledge of the network structure is required to optimise thenetwork intervention approach and most effectively focus intervention resources on a rel-atively small number of seed participants. Innovative methods are being used for datacollection in large networks (Perkins et al., 2015; Shakya et al., 2017), but mapping wholesocial networks is costly and may not be feasible in real-world interventions. If we are toimplement interventions that purposefully utilise inherent networks to inform interventiondesign, then we must also develop simple, low cost methods to estimate relevant structuralproperties.
Further, if network interventions are to meaningfully inform public health policy andpractice, then a number of implementation factors must be overcome. For example, thosepeople identified as the preferred seeds may not wish to participate in any trial intervention,may withdraw during the study period, or may participate but not respond to the interven-tion. In addition, unlike the simulations, people have relevant characteristics other thantheir network position, and seeds may be chosen or excluded for reasons such as access,greater need, presence of other health risks, or motivation.
4 Conclusion
Utilising the social network to most effectively deliver a public health behaviour interven-tion has the potential to increase the reach and sustainability of the intervention at minimalcost. The best intervention (as defined by selection of seed adopters) and the potentialgain available depend fundamentally on characteristics of the network and the behaviouradoption mechanism.
For a broad range of networks with around 50 people, interventions that use those peoplewho are most central in the network as seeds would lead to greater and faster adoptionthan random recruitment. Further work is required to test the results on larger networks,and also to isolate the properties of networks that influence the effectiveness of specificinterventions.
Acknowledgements
The authors would like to thank the reviewers for their helpful comments and questions.This work is primarily supported by a NIHR Career Development Fellowship. It was under-taken under the auspices of the UKCRC Centre of Excellence for Public Health Research

ZU064-05-FPR Seeds*Implications 13 April 2017 16:17
* 15
Northern Ireland, which is funded by the British Heart Foundation, Cancer Research UK,Economic and Social Research Council, Medical Research Council, the National Institutefor Health Research, and the Wellcome Trust.
References
An, Weihua, & Liu, Yu-Hsin. (2016). keyplayer: An R package for locating key players insocial networks. The R Journal, 8(1), 257–268. R package version 1.0.1.
Barabasi, Albert-Laszlo, & Albert, Reka. (1999). Emergence of scaling in randomnetworks. Science, 286(5439), 509–512.
Berkman, Lisa F., Kawachi, Ichiro, & Glymour, M. Maria (eds). (2014). SocialEpidemiology. 2 edn. Oxford University Press.
Bernard, H Russell, Killworth, Peter D, & Sailer, Lee. (1980). Informant accuracy in socialnetwork data IV: A comparison of clique-level structure in behavioral and cognitivenetwork data. Social Networks, 2(3), 191–218.
Borgatti, Stephen P. (2006). Identifying sets of key players in a social network.Computational and Mathematical Organization Theory, 12(1), 21–34.
Campbell, R, Starkey, F, Holliday, J, Audrey, S, Bloor, M, Parry-Langdon, N, Hughes,R, & Moore, L. (2008). An informal school-based peer-led intervention for smokingprevention in adolescence (ASSIST): a cluster randomised trial. The Lancet, 371(9624),15951602.
Centola, Damon, & Macy, Michael. (2007). Complex contagion and the weakness of longties. American Journal of Sociology, 113(3), 702–734.
Costenbader, Elizabeth, & Valente, Thomas W. (2003). The stability of centrality measureswhen networks are sampled. Social Networks, 25(4), 283307.
Csardi, Gabor, & Nepusz, Tamas. (2006). The igraph software package for complexnetwork research. InterJournal, Complex Systems, 1695.
Erdos, P., & Renyi, A. (1960). On the evolution of random graphs. Publications of theInstitute of Mathematics, Hungarian Academy of Science, 5, 17–60.
Kapferer, Bruce. (1972). Strategy and Transaction in an African factory: African workersand Indian management in a Zambian town. Manchester University Press.
Kelly, JA, & Stevenson, LY. (1995). Opinion leader HIV Prevention Training Manual.Milwaukee, WI: Center for AIDS Intervention Research, Medical College of Wisconsin.
Kim, David A, Hwong, Alison R, Stafford, Derek, Hughes, D Alex, OMalley, A James,Fowler, James H, & Christakis, Nicholas A. (2015). Social network targeting tomaximise population behaviour change: A cluster randomised controlled trial. TheLancet, 386(9989), 145–153.
Latkin, Carl A., & Knowlton, Amy R. (2015). Social network assessments andinterventions for health behavior change: A critical review. Behavioral Medicine, 41(3),90–97.
Leskovec, Jure, & Faloutsos, Christos. (2006). Sampling from large graphs. Pages 631–636 of: Proceedings of the 12th ACM SIGKDD international conference on KnowledgeDiscovery and Data Mining. ACM.
MacRae, Duncan. (1960). Direct factor analysis of sociometric data. Sociometry, 360–371.Molloy, Michael, & Reed, Bruce. (1995). A critical point for random graphs with a given
degree sequence. Random structures & algorithms, 6(2-3), 161–180.
ZU064-05-FPR Seeds*Implications 13 April 2017 16:17
16 Badham, Kee, Hunter
Noh, Jae Dong, & Rieger, Heiko. (2004). Random walks on complex networks. PhysicalReview Letters, 92(Mar), 118701.
Perkins, Jessica M., Subramanian, S.V., & Christakis, Nicholas A. (2015). Social networksand health: A systematic review of sociocentric network studies in low- and middle-income countries. Social Science & Medicine, 125(Jan), 60–78.
R Core Team. (2015). R: A Language and Environment for Statistical Computing. RFoundation for Statistical Computing, Vienna, Austria.
Shakya, Holly B, Stafford, Derek, Hughes, D Alex, Keegan, Thomas, Negron, Rennie,Broome, Jai, McKnight, Mark, Nicoll, Liza, Nelson, Jennifer, Iriarte, Emma, & et al.(2017). Exploiting social influence to magnify population-level behaviour change inmaternal and child health: study protocol for a randomised controlled trial of networktargeting algorithms in rural Honduras. BMJ Open, 7(3), e012996.
Thiele, Jan C., & Grimm, Volker. (2010). NetLogo meets R: Linking agent-based modelswith a toolbox for their analysis. Environmental Modelling & Software, 25(8), 972974.
Valente, Thomas W. (1996). Social network thresholds in the diffusion of innovations.Social Networks, 18(1), 6989.
Valente, Thomas W. (2012). Network interventions. Science, 337(6090), 49–53.Valente, Thomas W., & Davis, Rebecca L. (1999). Accelerating the diffusion of
innovations using opinion leaders. The ANNALS of the American Academy of Politicaland Social Science, 566(1), 55–67.
Valente, Thomas W., Palinkas, Lawrence A., Czaja, Sara, Chu, Kar-Hai, & Brown,C. Hendricks. (2015). Social network analysis for program implementation. PLoS ONE,10(6), e0131712.
Wickham, Hadley. (2009). ggplot2: Elegant Graphics for Data Analysis. Springer-VerlagNew York.
Wickham, Hadley, & Francois, Romain. (2016). dplyr: A Grammar of Data Manipulation.R package version 0.5.0.
Wilensky, Uri. (1999). NetLogo http://ccl.northwestern.edu/netlogo/. Tech. rept. Centerfor Connected Learning and Computer-Based Modeling, Northwestern University,Evanston, IL.
Zachary, Wayne W. (1977). An information flow model for conflict and fission in smallgroups. Journal of Anthropological Research, 452–473.
Zhang, Jun, Shoham, David A., Tesdahl, Eric, & Gesell, Sabina B. (2015). Networkinterventions on physical activity in an afterschool program: An agent-based socialnetwork study. American Journal of Public Health, 105(S2), S236–S243.

ZU064-05-FPR Seeds*Implications 13 April 2017 16:17
* 17
5 SUPPLEMENTARY MATERIALS
Supplementary materials to include:
• NetLogo model (download)• simulation results dataset (download)• additional figures
ZU064-05-FPR Seeds*Implications 13 April 2017 16:17
18 Badham, Kee, Hunter
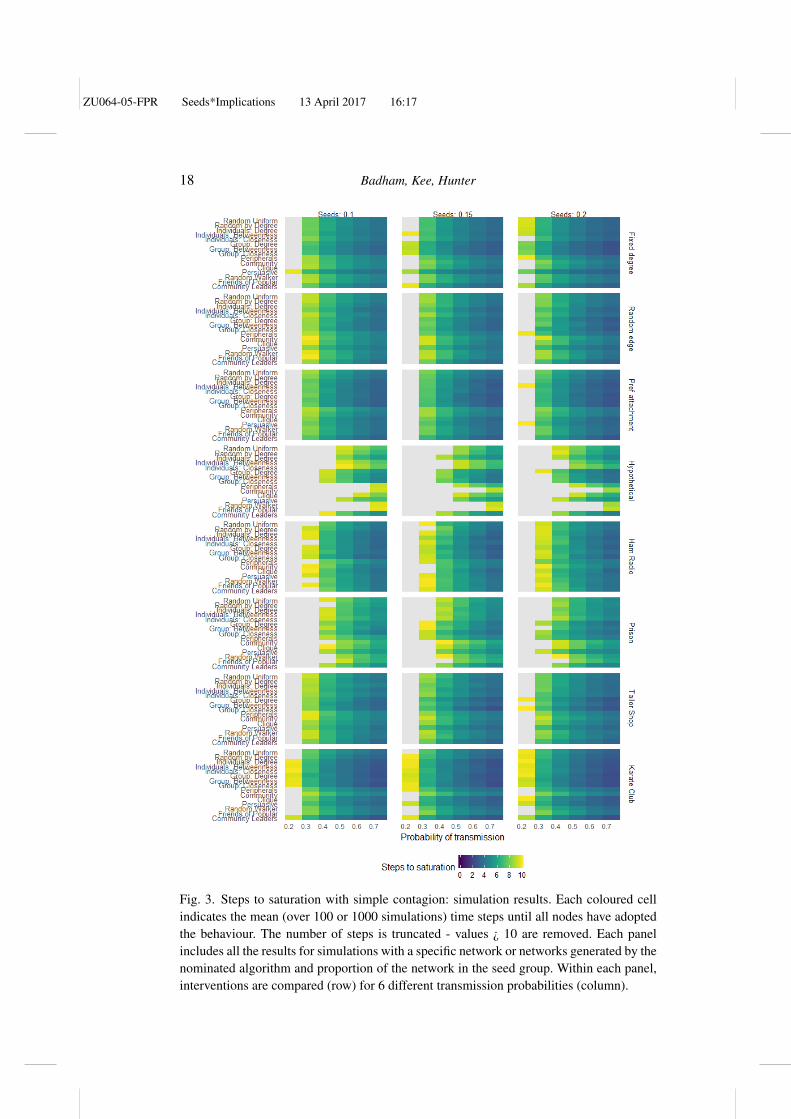
Fig. 3. Steps to saturation with simple contagion: simulation results. Each coloured cellindicates the mean (over 100 or 1000 simulations) time steps until all nodes have adoptedthe behaviour. The number of steps is truncated - values ¿ 10 are removed. Each panelincludes all the results for simulations with a specific network or networks generated by thenominated algorithm and proportion of the network in the seed group. Within each panel,interventions are compared (row) for 6 different transmission probabilities (column).
ZU064-05-FPR Seeds*Implications 13 April 2017 16:17
* 19
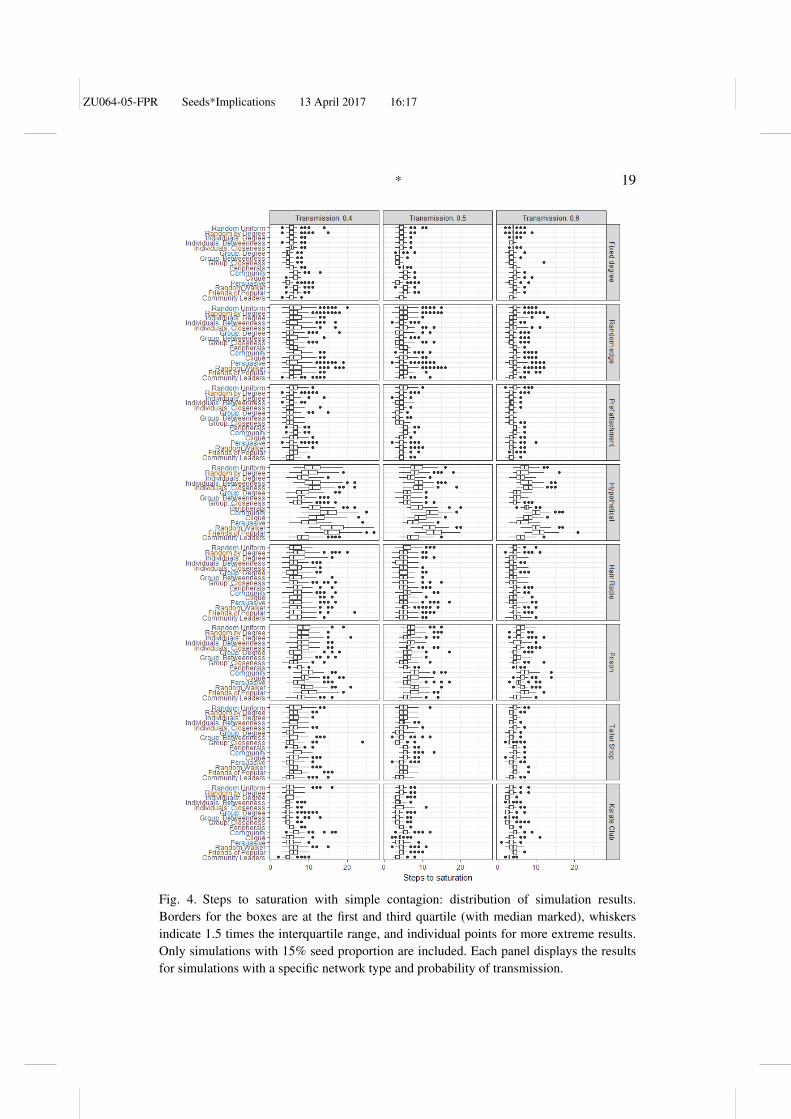
Fig. 4. Steps to saturation with simple contagion: distribution of simulation results.Borders for the boxes are at the first and third quartile (with median marked), whiskersindicate 1.5 times the interquartile range, and individual points for more extreme results.Only simulations with 15% seed proportion are included. Each panel displays the resultsfor simulations with a specific network type and probability of transmission.
ZU064-05-FPR Seeds*Implications 13 April 2017 16:17
20 Badham, Kee, Hunter
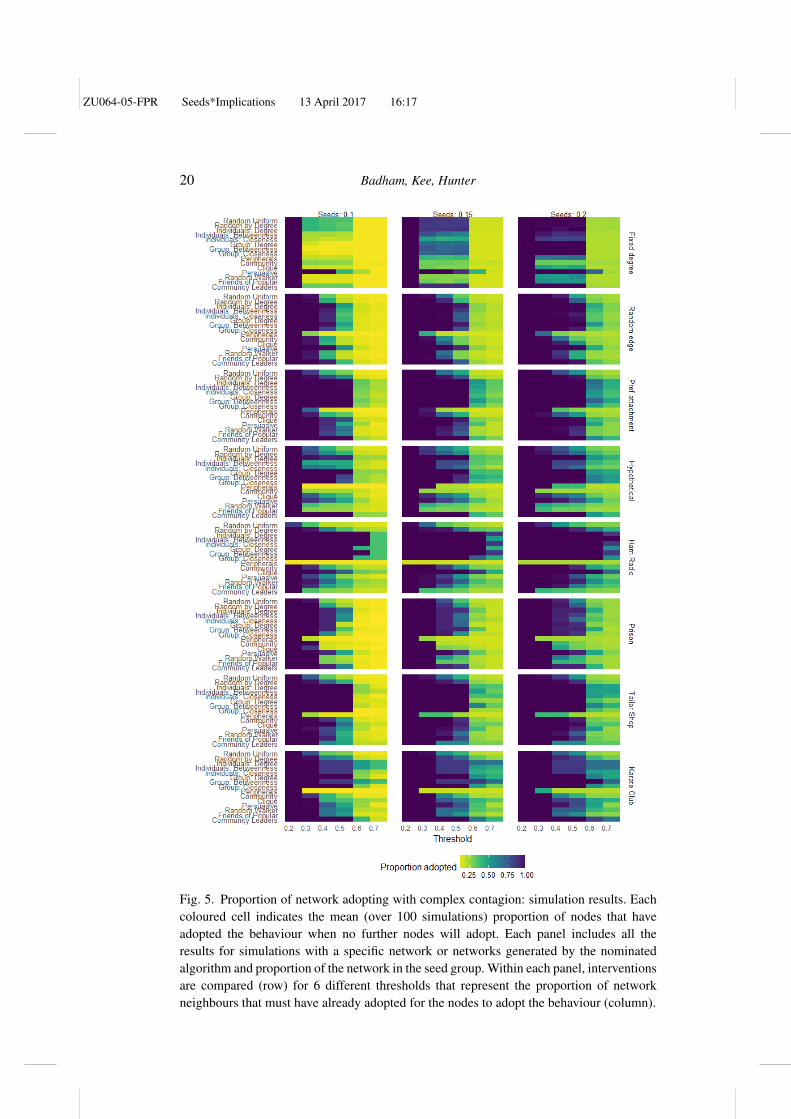
Fig. 5. Proportion of network adopting with complex contagion: simulation results. Eachcoloured cell indicates the mean (over 100 simulations) proportion of nodes that haveadopted the behaviour when no further nodes will adopt. Each panel includes all theresults for simulations with a specific network or networks generated by the nominatedalgorithm and proportion of the network in the seed group. Within each panel, interventionsare compared (row) for 6 different thresholds that represent the proportion of networkneighbours that must have already adopted for the nodes to adopt the behaviour (column).

ZU064-05-FPR Seeds*Implications 13 April 2017 16:17
* 21
Fig. 6. Proportion of network adopting with complex contagion: distribution of simulationresults. Borders for the boxes are at the first and third quartile (with median marked),whiskers indicate 1.5 times the interquartile range, and individual points for more extremeresults. Only simulations with 15% seed proportion are included. Each panel displays theresults for simulations with a specific network type and threshold.

ZU064-05-FPR Seeds*Implications 13 April 2017 16:17