SIMS 213: User Interface Design & Development Marti Hearst Tues Mar 15, 2005.
date post
20-Dec-2015Category
view
213download
0
SIMS 213: User Interface Design & Development
Marti HearstThurs, March 13, 2003
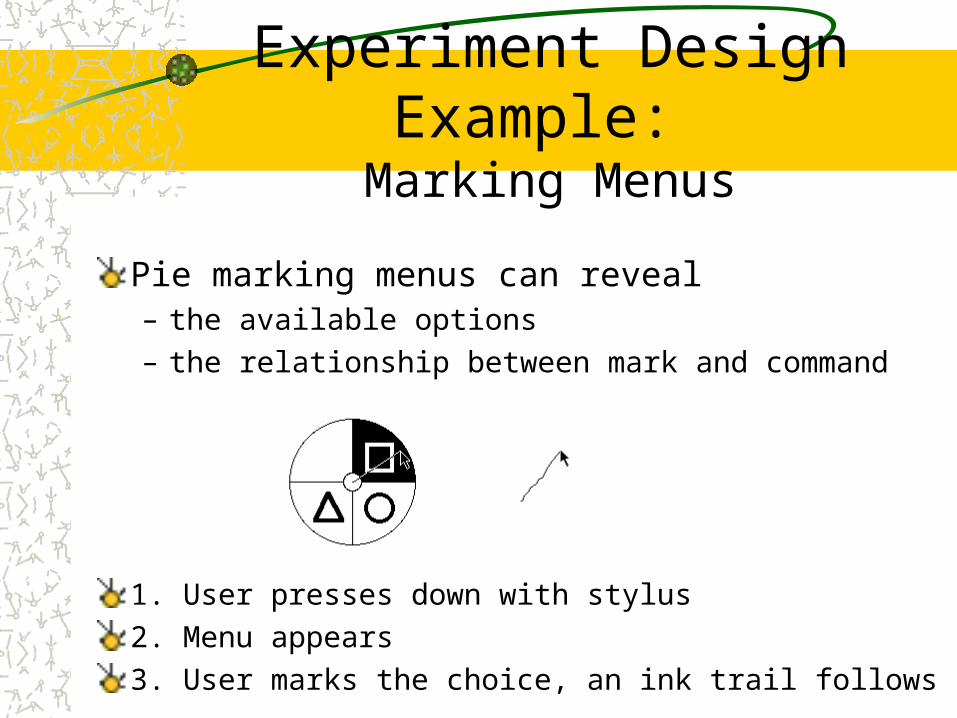
Experiment Design Example: Marking Menus
Pie marking menus can reveal – the available options – the relationship between mark and command
1. User presses down with stylus2. Menu appears3. User marks the choice, an ink trail follows

What do we want to know?
Are marking menus better than pie menus?– Do users have to see the menu?– Does leaving an “ink trail” make a difference?– Do people improve on these new menus as they
practice?
Related questions:– What, if any, are the effects of different input
devices?– What, if any, are the effects of different size menus?

Experiment Factors
Isolate the following factors (independent variables):
– Menu condition• exposed, hidden, hidden w/marks (E,H,M)
– Input device• mouse, stylus, track ball (M,S,T)
– Number of items in menu • 4,5,7,8,11,12 (note: both odd and even)
Response variables (dependent variables):– Response Time – Number of Errors

Experiment Hypotheses
Note these are stated in terms of the factors (independent variables)– Exposed menus will yield faster response times and
lower error rates, but not when menu size is small– Response variables will monotonically increase with
menu size for exposed menus– Response time will be sensitive to number of menu
choices for hidden menus (familiar ones will be easier, e.g., 8 and 12)
– Stylus better than Mouse better than Track ball

Experiment Hypotheses
Device performance is independent of menu typePerformance on hidden menus (both marking and hidden) will improve steadily across trials. Performance on exposed menus will remain constant.

Experiment Design
One between-subjects factor – Menu Type
• Three levels: E, H, or M
Two within-subjects factors– Device Type
• Three levels: M, T, or S
– Number of Menu Items• Six levels: 4, 5, 7, 8, 11, 12
How should we arrange these?

Experiment Design
M
T
S
T
S
M
S
M
T
E H M
5 11
12 8
7 4
Block by sizethen
randomize the
blocks.
(Note: the order of each set of blockswill differ for each participant in each square)

Experiment Overall Results
Group Mean RT(s.d)
Mean Errors(s.d.)
Mean %Errors
Exposed 0.98 (.23) 0.64 (1.0) 1.6%
Hidden 1.10 (.31) 3.27 (3.57) 8.2%
Marking 1.10 (.31) 3.76 (3.67) 9.4%
So exposing menus is faster … or is it?Let’s factor things out more.
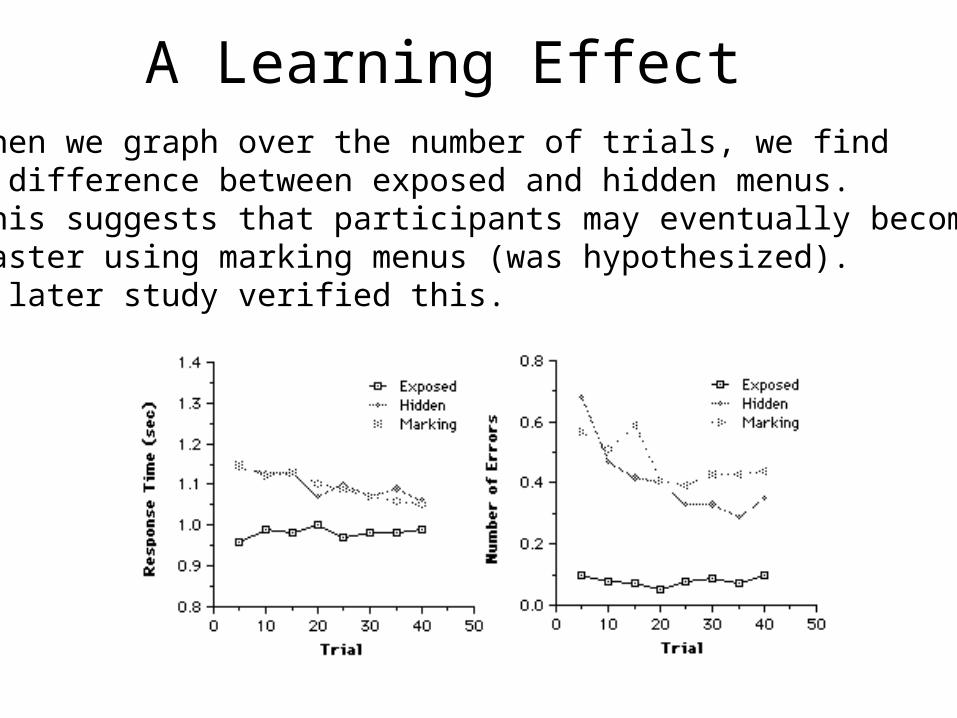
A Learning EffectWhen we graph over the number of trials, we finda difference between exposed and hidden menus.This suggests that participants may eventually becomefaster using marking menus (was hypothesized).A later study verified this.

Factoring to Expose InteractionsIncreasing menu size increases selection time and number of errors (was hypothesized).No differences across menu groups in terms of response time.That is, until we factor by menu size AND group– Then we see that menu size has effects on hidden groups not seen
on exposed group– This was hypothesized (12 easier than 11)

Factoring to Expose Interactions
Stylus and mouse outperformed trackball (hypothesized)Stylus and mouse the same (not hypothesized)Initially, effect of input device did not interact with menu type– this is when comparing globally– BUT ...
More detailed analysis:– Compare both by menu type and device type– Stylus significantly faster with Marking group– Trackball significantly slower with Exposed group– Not hypothesized!

Average response time and errors as a function of device, menu size, and menu type.
Potential explanations:
Markings provide feedbackfor when stylus is pressedproperly.Ink trail is consistent withthe metaphor of using a pen.

Experiment Design
M
T
S
T
S
M
S
M
T
E H M
How can we tell if order in which the device appears has an effect on the final outcome?
Some evidence:There is no significant difference among devices in the Hidden group.Trackball was slowest and most error prone in all three cases.Still, there may be some hidden interactions, but unlikelyto be strong given the previous graph.

Statistical Tests
Need to test for statistical significance– This is a big area– Assuming a normal distribution:
• Students t-test to compare two variables• ANOVA to compare more than two variables

Adapted from slide by James Landay
Analyzing the Numbers
Example: trying to get task time <=30 min. – test gives: 20, 15, 40, 90, 10, 5– mean (average) = 30– median (middle) = 17.5– looks good! – wrong answer, not certain of anything
Factors contributing to our uncertainty– small number of test users (n = 6)– results are very variable (standard deviation = 32)
• std. dev. measures dispersal from the mean
Adapted from slide by James Landay
Analyzing the Numbers (cont.)
This is what statistics is forCrank through the procedures and you find– 95% certain that typical value is between 5 & 55
Usability test data is quite variable– need lots to get good estimates of typical values– 4 times as many tests will only narrow range by 2x

Followup Work
Hierarchical Markup Menu study
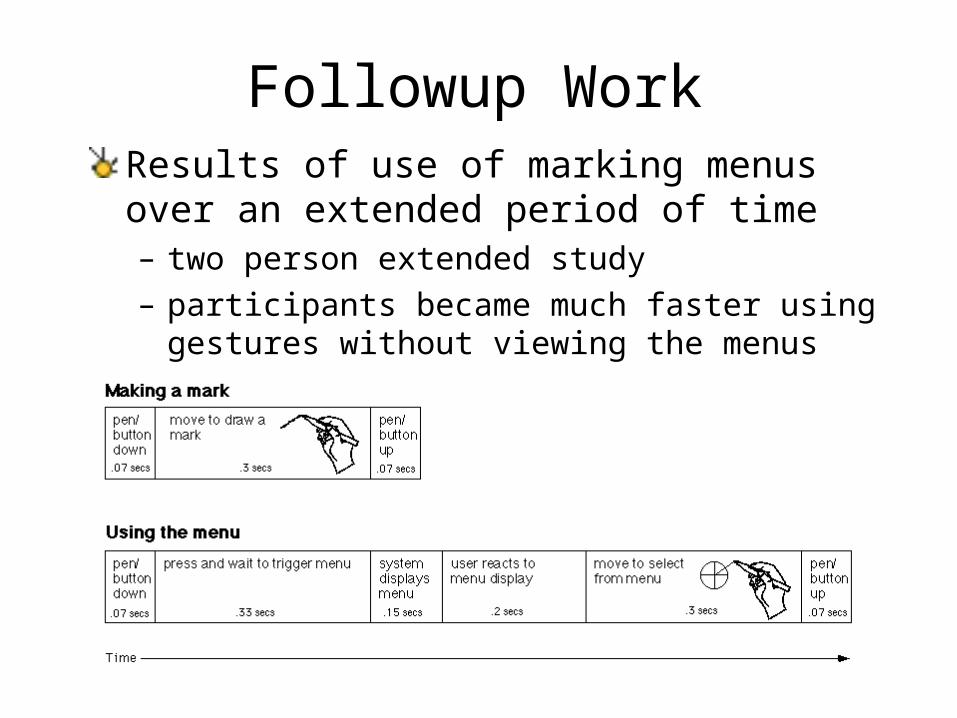
Followup WorkResults of use of marking menus over an extended period of time– two person extended study– participants became much faster using gestures without
viewing the menus

Followup WorkResults of use of marking menus over an extended period of time– participants temporarily returned to “novice” mode when they
had been away from the system for a while

Summary
Formal studies can reveal detailed information but take extensive time/effortHuman participants entail special requirementsExperiment design involves– Factors, levels, participants, tasks, hypotheses– Important to consider which factors are likely to have real effects on the
results, and isolate theseAnalysis– Often need to involve a statistician to do it right– Need to determine statistical significance– Important to make plots and explore the data

References
Kurtenbach, Sellen, and Buxton, Some Articulartory and Cognitive Aspects of “Marking Menus”, Graphics Interface ‘94, http://reality.sgi.com/gordo_tor/papersKurtenbach and Buxton, User Learning and Performance with Marking Menus, Graphics Interface ‘94, http://reality.sgi.com/gordo_tor/papersJain, The art of computer systems performance analysis, Wiley, 1991http://www.statsoft.com/textbook/stanman.htmlGonick and Smith, The Cartoon Guide to Statistics, HarperPerennial, 1993Dix et al. textbook