Interaction Models I Marti Hearst (UCB SIMS) SIMS 213, UI Design & Development March 9, 1999.
date post
20-Dec-2015Category
view
220download
1
1
SIMS 247: Information Visualization and PresentationMarti Hearst
Oct 24, 2005

2
Today
• Finish temporal visualization• Serial information visualization• Video visualization

3
Searching Time Sequence Data

4
Motivation: Standard time plots are very compelling, but can only display a limited amount of data
Timebox widgets for interactive explorationHochheiser and Shneiderman ‘02

5
Idea:
Query the data!
(See video)

6
Usability studies
• 24 Computer Science students completed various tasks using different but semantically equivalent input mechanisms:– Timebox queries– Fill-in– Range sliders
7
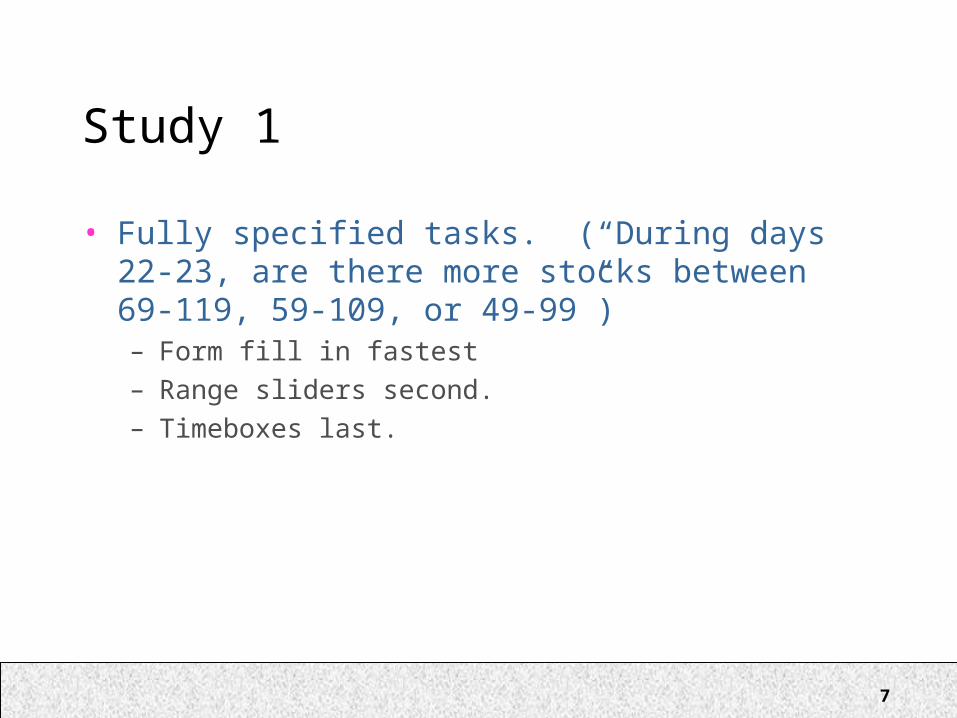
Study 1
• Fully specified tasks. (“During days 22-23, are there more stocks between 69-119, 59-109, or 49-99”)– Form fill in fastest– Range sliders second.– Timeboxes last.

8
Study 2
• More open-ended tasks.• Compare:
– Timeboxes with graphical output– Forms with graphical output– Forms with tabular output
• No statistically significant difference.
(Were the users already familiar with timeboxes?)

9
Compare to Wattenberg’sTime Graph Sketch

10
Visualizing Serial Data

11
Visualization for Analysis• Carlis & Konstan, UIST 1998
• For: data that is both periodic and serial– Time students spend on different activities– Tree growth patterns
• Time: which year• Period: yearly
– Multi-day races such as the Tour de France– Calendars arbitrarily wrap around at end of month– Octaves in music
• Problem: How to find patterns along both dimensions?

12
Analyzing Complex Periodic Data
Carlis & Konstan, UIST 1998.

13
Carlis & Konstan, UIST 1998.
•All 112 foods, alphabetical
•Color corresponds to food type
•Rings rather than blots to aid visibility

14
Analyzing Complex Periodic Data
Carlis & Konstan, UIST 1998.
•12 most common foods
•Consumption values for each month appear as spikes
•Each food has its own color
•Boundary line (in black) shows when season begins/ends

15
Analyzing Complex Periodic Data
Carlis & Konstan, UIST 1998.
•Different use of the viz in the chimp domain
•2 chimps (red and blue)
•Length of line is size of the group they travel with
•Top spiral is average size
•Bottom spiral is max size

16
Analyzing Complex Periodic Data
Carlis & Konstan, UIST 1998.
Analyzing properties of sound

17
Analyzing Complex Periodic Data
Carlis & Konstan, UIST 1998.

18
Carlis & Konstan
• An excellent example of infoviz– Provides clarity about information that is not
otherwise possible– Makes excellent use of visual principles
• Color, size, position all used properly• Different features are easy to discriminate, do not
interfere with one another
– Applicable to many different types of problems• Different levels of complexity

19
Video Visualization

20
MediaBrowserDrucker et al. ‘04
http://research.microsoft.com/~sdrucker/interest.htm

21
SmartSkipDrucker et al. ‘01
http://research.microsoft.com/~sdrucker/interest.htm

22
SmartSkipDrucker et al. ‘01
http://research.microsoft.com/~sdrucker/interest.htm

23
SmartSkipDrucker et al. ‘01
http://research.microsoft.com/~sdrucker/interest.htm
24
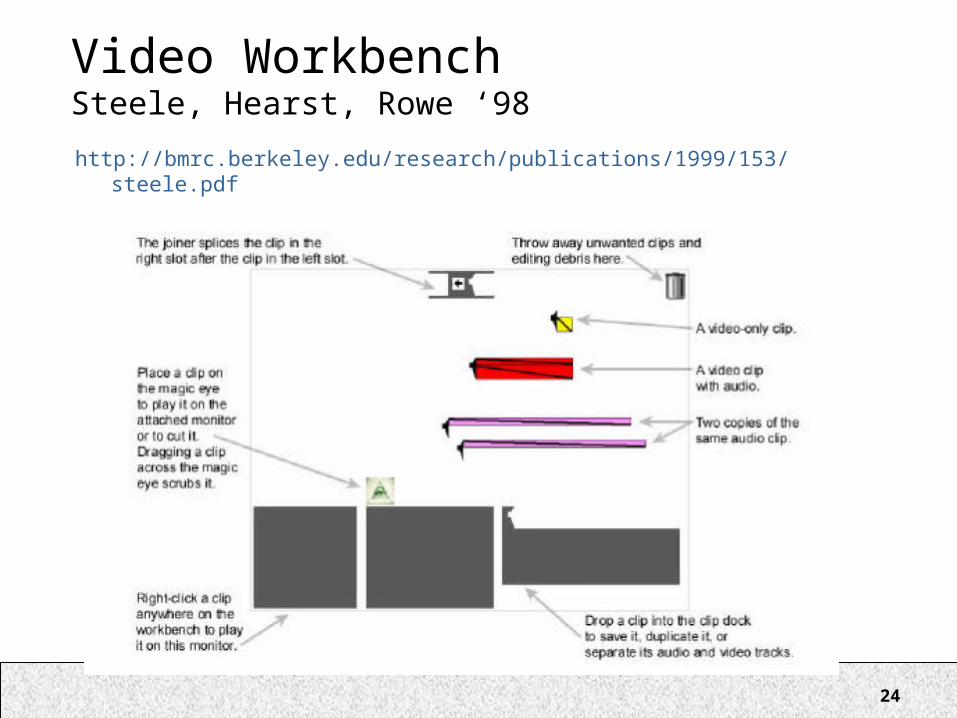
Video WorkbenchSteele, Hearst, Rowe ‘98
http://bmrc.berkeley.edu/research/publications/1999/153/steele.pdf
25
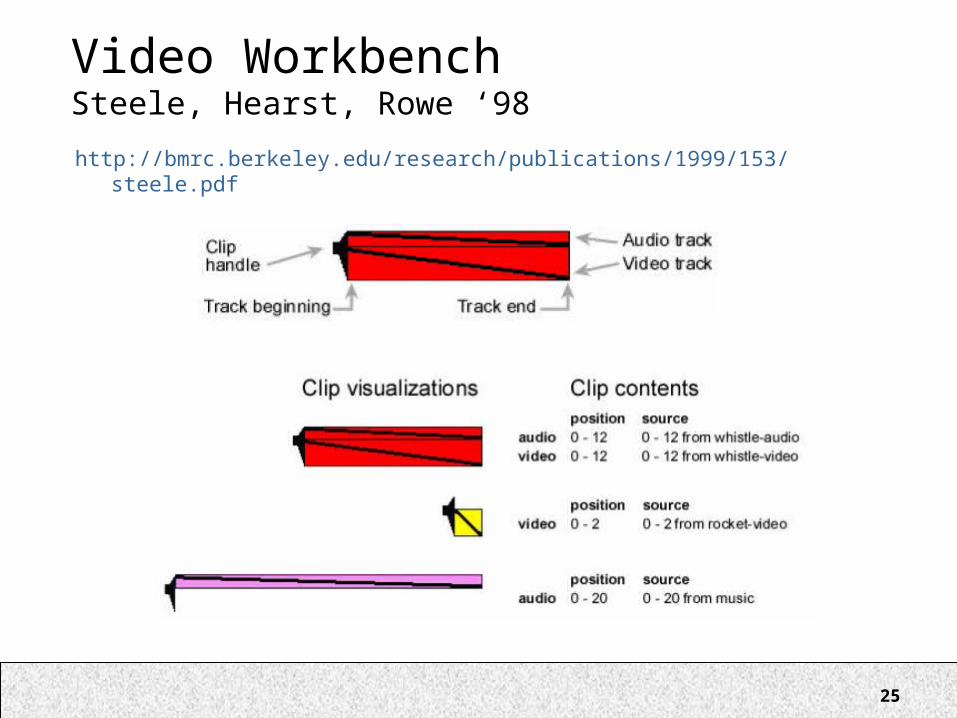
Video WorkbenchSteele, Hearst, Rowe ‘98
http://bmrc.berkeley.edu/research/publications/1999/153/steele.pdf

26
Video WorkbenchSteele, Hearst, Rowe ‘98http://bmrc.berkeley.edu/research/publications/1999/153/steele.pdf

27
Video WorkbenchSteele, Hearst, Rowe ‘98http://bmrc.berkeley.edu/research/publications/1999/153/steele.pdf

28
Video WorkbenchSteele, Hearst, Rowe ‘98http://bmrc.berkeley.edu/research/publications/1999/153/steele.pdf

29
DIVAMacKay & Lafon ’98http://www-ihm.lri.fr/~mbl/DIVA/chi98-paper/introduction.html

30
DIVAMacKay & Lafon ’98http://www-ihm.lri.fr/~mbl/DIVA/chi98-paper/introduction.html

31
DIVAMacKay & Lafon ’98http://www-ihm.lri.fr/~mbl/DIVA/chi98-paper/introduction.html

32
DIVAMacKay & Lafon ’98http://www-ihm.lri.fr/~mbl/DIVA/chi98-paper/introduction.html

33
Media StreamsDavis ‘95

34
Usability in Video Interfaces
• Christel & Moraveji ’04. Finding the Right Shots: Assessing Usability and Performance of a Digital Video Library Interface.
• Hauptman & Christel ’04 . Successful Approaches in the TREC Video Retrieval Evaluations.
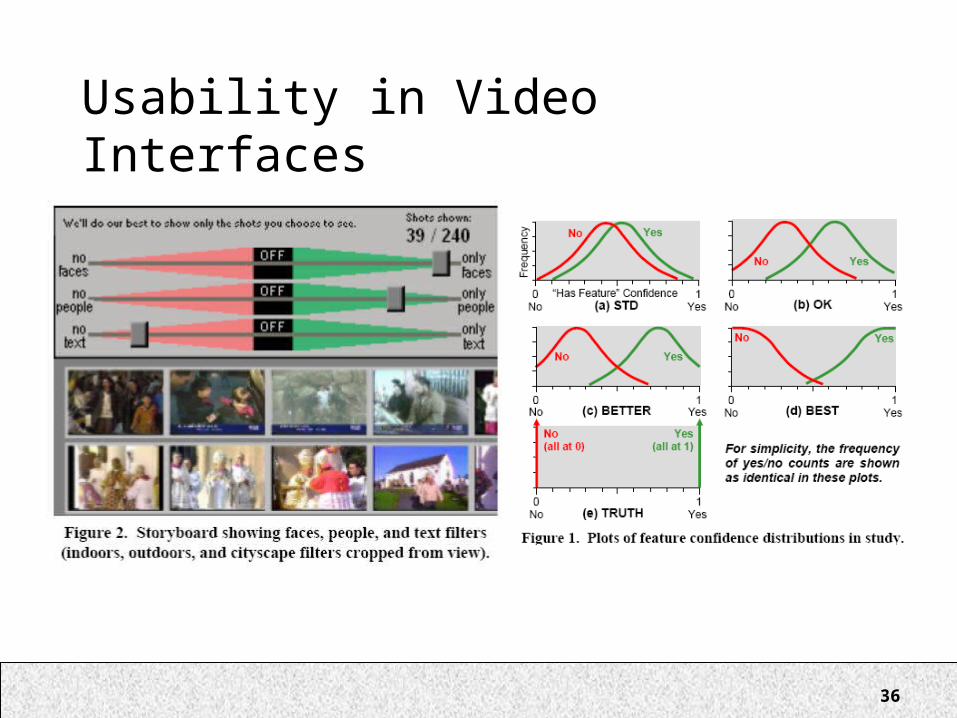
• Christel, M., Moraveji, N., and Huang, C. ’04 Evaluating Content-Based Filters for Image and Video Retrieval.

35
Usability in Video Interfaces
36
Usability in Video Interfaces