Siemens Digital Industries Software Opcenter Intelligence ...
24
siemens.com/software Siemens Digital Industries Software Opcenter Intelligence Electronics A powerful solution for multisite big data collection and analytics
Transcript of Siemens Digital Industries Software Opcenter Intelligence ...

siemens.com/software
Siemens Digital Industries Software
Opcenter Intelligence ElectronicsA powerful solution for multisite big data collection and analytics

Electronics manufacturing has become increasingly dynamic and customized over the past few years. In this complex environ-ment, full production-floor visibility is vital to ensure productivity, traceability, quality con-trol and cost management. But visibility alone isn’t enough – manufacturers also need smart analytics to predict and prevent problems before they happen.
2
Addressing the most pressing challenges in electronics manufacturing
High-variation, low-volume manufacturingWith the rise of customization across almost every manufacturing sector, the days of most orders being high-volume, low-mix are all but gone. High-mix, low-volume (HMLV) produc-tion is becoming the norm. In electronics manufacturing, where each new product introduction (NPI) requires significant time and resources to achieve high yield and efficiency, HMLV presents an enormous challenge.
Making data usefulResearch shows that while the amount of data generated by manufacturing operations is increasing exponentially, only a small portion is collected, and an even smaller portion is analyzed. The data that is analyzed is often descriptive and diagnostic, focusing on what has already happened, and does not include data-based insights to predict and prevent problems before they occur.
Optimizing material usageApproximately 70 percent of electronics manufacturing costs are related to material usage, including scrap, moisture-sensitive devices (MSD), surplus materials and inven-tory turnover. Manufacturers need advanced tools to pinpoint problems, prevent mass recalls and correct errors before they lead to material waste.
ComplianceManufacturers are required to maintain a full account of every product’s history for compli-ance and traceability purposes. They need massive storage capacity for long-term trace-ability data and ongoing monitoring to collect data in compliance with customer and regula-tory requirements.
Designed specifically for printed circuit board (PCB) assembly and system assembly manu-facturing, Opcenter Intelligence Electronics offers a powerful solution for multi-site, big data collection and analytics.
3

Opcenter Intelligence Electronics provides out-of-the-box reports that make it easy for manufacturers to understand what’s happen-ing, why it’s happening and how to improve. By creating a comprehensive digital twin of all operations, Opcenter Intelligence Electronics:
• Improves asset management with accurate, real-time utilization and overall equipment effectiveness (OEE)
• Helps capture and investigate complete material and process traceability data for PCBs and assemblies using big-data, high-availability storage
• Optimizes operation and labor by measuring and analyzing how resources are spent
• Tracks work-in-progress (WIP) in real-time
• Safeguards quality and drives improvement by identifying and analyzing process defects and material and process failures
• Increases design-to-manufacturing efficiency by detecting factors affecting yield and areas for improvement
While Opcenter Intelligence Electronics can be integrated with any MES, it is seamlessly integrated into Siemens’ Opcenter Execution Electronics MES. Together, they offer PCB manufacturers a comprehensive solution that includes datasets and key performance indi-cators (KPIs) specific to the PCB assembly industry and reports that help answer crucial questions for PCB manufacturers.
• Best-in-class, out-of-the-box shop floor connectivity
• Outstanding material management capabilities
• Integrated with product lifecycle management (PLM), enterprise resource planning (ERP) and manufacturing operations management (MOM) software
Opcenter Intelligence Electronics incorporates cutting-edge technologies including the MicroStrategy advanced analytics platform, Vertica data storage and aggregation and the Talend extract, transform, load (ETL) data collection layer.
The data challenge: turning big data into smart data
BIG DATAv Volume
v Velocity
v Variety
v Value
v Validity
SMART DATAv Formatted data
v Provides insight or foresight
v Understood at consumption point
v Immediately actionable
Opcenter Electronics Intelligence offers out-of-the-box reports with the following capabilities:
• Self-service – create custom visualization, custom metrics and more
• Alarms and notifications
• Enrich data with other data sources
• Natural language query
• Schedule regular reports to be sent by email
• Available machine intelligence (MI) and artificial intelligence (AI) formulas
• Mobile access
• Enable big data
• User access control
4

Opcenter Intelligence Electronics acquires data from all shop-floor stations (automated as well as manual) all the way to box-build. Process and material data is sent to the ETL platform through the Opcenter Execution Electronics MES, and process and quality measurements are collected directly into the Opcenter Intelligence Electronics platform.
Our ETL solution Talend pulls data from the MES databases and places it into the big data database, Vertica. Vertica is designed to manage large, fast-growing volumes of data and provide very fast query performance. MicroStrategy is the reporting tool employed by the end user, enabling in-depth analysis of the data and simple visibility.
Design ERP
MES Opcenter Execution Electronics
Process
Data acquisition: IoT/CIO/PAC
Material management
External data enrichment
PLM
Electronic/ mechanical CAD data
Work order, operation, product, BOM…
Engineering data
ECO dataWork
instructions
Op In EL
Reporting tool
KPI-centric reporting
Real-time reporting
Dashboards
Alerts
In-depth analysis – ML, prediction, correlation…
Self-service analysis
Big data database
Dimensions
Metrics
Aggregation
Raw data
ETL
Process and quality
measurements
Opcenter Intelligence Electronics architecture overview
5

Contents
Multisite KPI overview Site 360° ............................................................... 7Material 360° ........................................................ 8
Equipment performanceMachine utilization ................................................ 9Overall equipment effectiveness (OEE) ................. 10Pick up errors ...................................................... 11Change over analysis ........................................... 12
Quality and measurementsQuality history KPIs.............................................. 13Defective material ............................................... 14Measurements real time ...................................... 15Statistical process control (SPC) ........................... 16
Material, product and process traceabilityMaterial traceability ............................................ 17Work in process (WIP) .......................................... 18Board process history .......................................... 19Box build report .................................................. 20Process traceability .............................................. 21
Supply chain and material managementMaterial inventory ............................................... 22Material consumption.......................................... 23
6

The Opcenter Intelligence Electronics home page displays the Site 360° overview. This dashboard offers a complete production analysis for all business domains including quality, material and line utiliza-tion, as well as all KPI scores for the current period compared to the previous 12 months.
Value• Out-of-the-box “go-to” report
• Complete shop-floor visibility and in-depth analysis with customizable drill-down
• Rapid identification and resolution of shop floor bottlenecks
Site 360°
7

The visualization provides complete material ana-lysis, with data from different points in the site, including material consumption and defects from the shop floor and material inventory from the warehouse. The analysis includes quality data-based insights and part manufacturer recommendations.
Value• Full visibility of material across the entire site
• “Go-to” report of essential material data for production managers
• One concise dashboard with aggregated data from different material reports
• Highlighted part manufacturer recommendations to support better part selection
Material 360°
8

The machine utilization report displays actual machine statuses, availability, and performance metrics for each machine in each line for each day in the selected time period. The report also displays customized statuses to analyze reasons for machine stops.
Value• Operator visibility of machine utilization
• Bottleneck identification at the machine and line level
• Comparison of actual versus planned machine production times
Machine utilization
9

The OEE history report provides statistics on machine availability, performance, quality and overall equipment effectiveness (OEE) for the site or line during pre-defi-ned or custom time periods. The real-time OEE report provides the same data in real time.
Value• OEE display at site, line or machine level
• Critical line efficiency data for production managers
• Drill-down capabilities at the machine level for in-depth investigation of metrics (using the machine utilization report)
Equipment performance
Overall equipment effectiveness (OEE)
10

The pick-and-place pickup error reports and dash-boards provide statistics on the number of errors occurring on each line, machine within the line and feeder used on the machine. The error count repre-sents the difference between the number of picked components and the number of placed components.Included reports: real-time, history, self-service
Value• Machine performance visibility for operators
• Identification of faulty feeders that require maintenance
• Analysis of pickup errors trends
Equipment performance
Pickup errors
11

This report displays detailed changeover informati-on for each line, piece of equipment and lane in the factory. It shows the changeover time distribution and overall production statistics per work order, including number of boards, number of errors, cycle time, com-ponents per hour (CPH) and work percentage.
Value• Monitoring of changeover times
• User-defined KPIs for acceptable/unacceptable/mediocre changeover times
• Analysis of changeover times based on custom KPIs
• Information for changeover optimization
Equipment performance
Changeover analysis
12

The quality history report analyzes defects, symp-toms and repairs from site level down to the specific event. It displays a wealth of attributes and metrics with out-of-the-box KPIs that enable in-depth analysis.
Value• Quality overview for managers
• Trend analysis and decision support to determine root cause and enable calculated decisions
• Dozens of pre-calculated KPIs can be added to the report according to need
Quality and measurements
Quality history KPIs
13

The defective material report aggregates data from two business domains, quality and material traceability, and cross-links defect events and material data. It provides defect analysis and trends, sorted by defect and ope-ration type. The dashboard also provides a highlighted part manufacturer analysis, in both quantity and cost terms.
Value• Analysis of defect costs per part manufacturer, so operators can
choose manufacturers with the lowest defects rate
• Defect trend monitoring to enable quicker action when defect thresholds are crossed
• Defect sorting by category, operation type, assembly, work order, equipment and more, allowing easy detection of abnormal results and urgent issues
Equipment performance
Defective material
14

This report displays near-real-time measurements collected from all automated testing machines in the site and aggregated according to assembly, work order, equipment and more. It allows tracking and monitoring of the data collection from automatic testing machines. Quality measurements by board includes all measurements collected for each board from all automated testing machines.
Value• Monitoring to ensure data is being collected in compliance
with customer requirements
• Identification of fails in near-real-time, early reaction to abnormal rates
• Visibility of all measurements collected per board for compliance and traceability purposes
Quality and measurements
Measurements real time
15

Statistical process control is a quality control report that employs statistical methods to monitor and control quality measurements. SPC confirms that the process operates efficiently, producing more specification- conforming product with less waste (rework or scrap).
Value• Out-of-the-box SPC report
• Insufficient process result detection to optimize processes
• Predefined email alerts of deviation from normal rates
• Assurance that processes are stable and predictable
Quality and measurements
Statistical process control (SPC)
16

Material traceability data provides information on boards, work orders and material placements. It pro-vides full visibility of materials and processes on each completed board, automatic and manual, as well as the program and machines used in its production, including board, reel and lot traceability.
Value• Automated traceability reports for compliance with
customer requirements
• Quality comparison between material suppliers
• Big database storage for long-term traceability data
• Analysis of trends over extended periods (when paired with Opcenter Intelligence Electronics)
• Reel traceability that can be used in product recalls to minimize the number of recalled boards
Material traceability
Material traceability
17

The report shows the progress of each work order, including how many operations have been completed, the average duration for each operation and the ave-rage duration between operations.
The report also features work order status, completion percentage and work order quality KPIs.
Value• Visibility of work order status and complete route per work
order, with breakdown for each operation
• Estimation of real versus planned completion time
• Identification of bottlenecks through visibility of long pending times
• Manager-led operational decisions for production improvement
Product traceability
Work in process (WIP)
18

Board process history displays all production infor-mation for a specified board. For each operation, the report shows information such as equipment used, operator, start and end time and operation success or failure.
Value• A full account of the board process history
• Full visibility of the operations carried out on the board during assembly
Product traceability
Board process history
19

Box build by board ID provides a map of all subassem-blies used to build a specific product. Box build by work order provides a listing of all boards and sub-boards within a specific work order.
Increasing levels of indentation are used to show the level of sub-boards. The first level shows all boards of the selected board ID. Varying levels of sub-boards are displayed beneath each boxboard build. Value• Full visibility of subassemblies associated with a final product
• Easy extraction of product traceability information for customers
• In cases of malfunctioning products, errors can be traced by product, board or component
Product traceability
Box build report
20

The process traceability domain presents information on the manufacturing process itself. For example, it allows designated reports on each process (screen printer, oven, etc.) and the parameters used in each process. It displays process control charts and de-tailed information on the boards produced.
Value• Out-of-the-box SPC calculation for process measurement
(screen printer and oven)
• Detection of insufficient trends to optimize processes
• Predefined alerts are sent by email to notify of deviation from normal rates
• Quality managers can confirm that processes are stable and predictable
Process traceability
Process traceability
21

Material inventory presents real-time inventory status on a corporate level, with the option to drill-down into specific sites. It gives the user insights on material loca-tion, aging and cost.
Material inventory self service provides insight on mate-rial inventory and consumption for the entire history as well as insight on material location, aging, cost and consumption with the basic KPIs: inventory turnover, days of sales and inventory age. Value• Full visibility of material inventory in terms of material
amounts, costs and location
• Data to support informed decisions about material purchase, transport and disposal
• Trend analysis to optimize material purchase plans, considering the type of materials, amounts and costs
Supply chain and material management
Material inventory
22
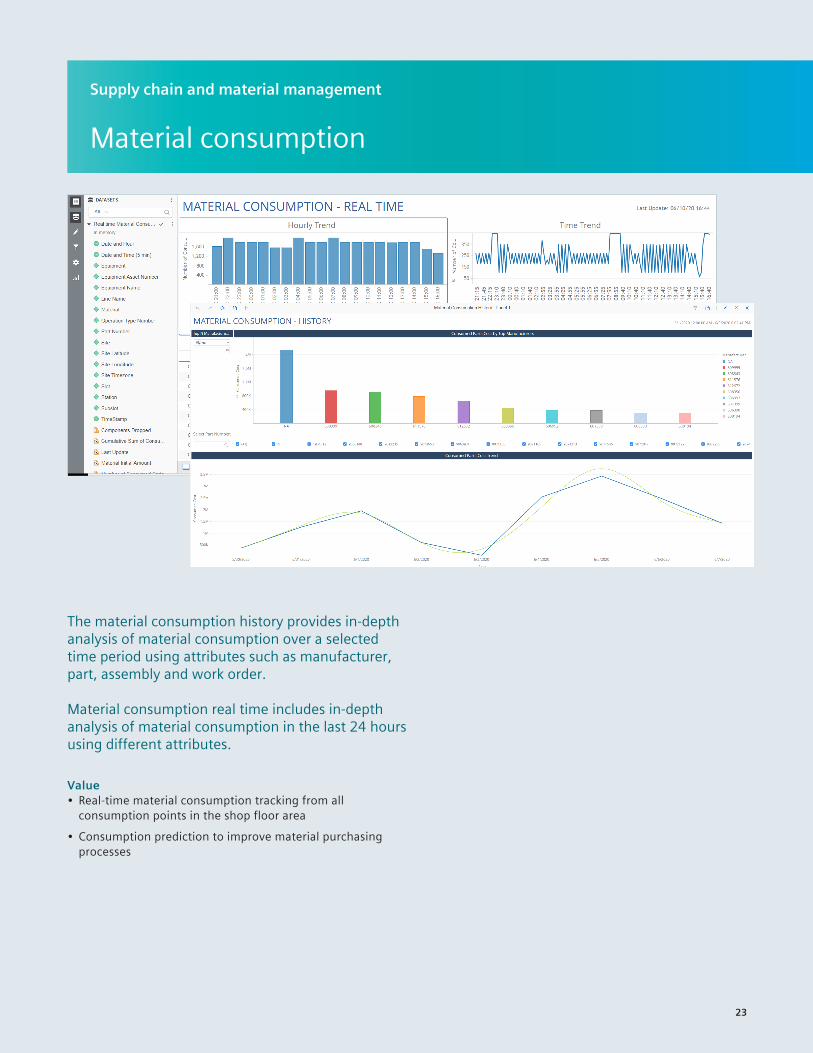
The material consumption history provides in-depth analysis of material consumption over a selected time period using attributes such as manufacturer, part, assembly and work order.
Material consumption real time includes in-depth analysis of material consumption in the last 24 hours using different attributes. Value• Real-time material consumption tracking from all
consumption points in the shop floor area
• Consumption prediction to improve material purchasing processes
Supply chain and material management
Material consumption
23

About Siemens Digital Industries SoftwareSiemens Digital Industries Software is driving transformation to enable a digital enterprise where engineering, manufacturing and electronics design meet tomorrow. The Xcelerator portfolio helps companies of all sizes create and leverage digital twins that provide organizations with new insights, opportunities and levels of automation to drive innovation. For more information on Siemens Digital Industries Software products and services, visit siemens.com/software or follow us on LinkedIn, Twitter, Facebook and Instagram. Siemens Digital Industries Software – Where today meets tomorrow.
For more information about Opcenter Intelligence Electronics, visit the website
Headquarters: Americas: Europe: Asia-Pacific:
+1 972 987 3000 +1 314 264 8499 +44 (0) 1276 413200 +852 2230 3333
© 2021 Siemens. A list of relevant Siemens trademarks can be found here. Other trademarks belong to their respective owners. 82641-C7 6/21 A