Should the Decline in the Personal Saving Rate Be a Cause ...the personal saving rate since the...
24
Should the Decline in the Personal Saving Rate Be a Cause for Concern? By C. Alan Garner T he personal saving rate has been drifting downward for the last two decades. According to the latest statistics, personal saving declined from about 10 percent of disposable income in the early 1980s to 1.8 percent in 2004. The decline has received particular attention recently because saving was negative in 2005 for the first time since the Great Depression. Although saving declined in other developed countries during this period, the U.S. decline was more pronounced than in most of these countries. Many analysts and policymakers have expressed concern about the decline in the personal saving rate. A major concern is whether U.S. households are providing adequately for long-term needs, such as future retirement and medical expenses. With average life expectancies length- ening and the large baby-boom generation approaching retirement, many households will need to tap their personal savings to supplement increasingly pressured public and corporate retirement programs. In addition, low personal saving has created short-run concerns that a sudden increase in the saving rate could reduce growth of consumer spending, real output, and employment. C. Alan Garner is an assistant vice president and economist at the Federal Reserve Bank of Kansas City. Thomas Schwartz, a research associate at the bank, provided research assistance. The article is on the bank’s website at www.KansasCityFed.org. 5
Transcript of Should the Decline in the Personal Saving Rate Be a Cause ...the personal saving rate since the...

Should the Decline in the Personal Saving Rate Be a Cause for Concern?
By C. Alan Garner
The personal saving rate has been drifting downward for the lasttwo decades. According to the latest statistics, personal savingdeclined from about 10 percent of disposable income in the
early 1980s to 1.8 percent in 2004. The decline has received particularattention recently because saving was negative in 2005 for the first timesince the Great Depression. Although saving declined in other developedcountries during this period, the U.S. decline was more pronounced thanin most of these countries.
Many analysts and policymakers have expressed concern about thedecline in the personal saving rate. A major concern is whether U.S.households are providing adequately for long-term needs, such as futureretirement and medical expenses. With average life expectancies length-ening and the large baby-boom generation approaching retirement,many households will need to tap their personal savings to supplementincreasingly pressured public and corporate retirement programs. Inaddition, low personal saving has created short-run concerns that asudden increase in the saving rate could reduce growth of consumerspending, real output, and employment.
C. Alan Garner is an assistant vice president and economist at the Federal ReserveBank of Kansas City. Thomas Schwartz, a research associate at the bank, providedresearch assistance. The article is on the bank’s website at www.KansasCityFed.org.
5
But there is another, often overlooked side to this story. Two majorfactors suggest the decline in the personal saving rate may not be asalarming as it is sometimes made out to be. First, various measurementproblems with the personal saving rate from the national income andproduct accounts suggest household saving may not have declined asmuch as the statistics suggest. Second, economic theory assumes thathouseholds rationally anticipate future labor income and asset returnsand plan their spending accordingly. If this assumption is correct, thelow personal saving rate may not foreshadow wrenching future adjust-ments in consumer spending.
This article provides some perspective on the decline in the per-sonal saving rate over the last two decades. The first section describesthe decline in the most common measure of the personal saving rateand the economic explanations offered for this decline. The secondsection surveys some of the measurement issues related to the declineand presents some alternative saving measures. After weighing theissues, the third section concludes that, although there are some legiti-mate reasons for concern, the decline in the personal saving rate maynot be as alarming as it first appears.
I. THE DECLINE IN THE PERSONAL SAVING RATE
The downward trend in the personal saving rate has promptedexpressions of concern by economists and other observers. Roach wrotethat “the U.S. needs to end its buying binge and rediscover the art ofsaving,” while Eisinger worried that the United States will end up with“zombie consumers” similar to the “zombie companies” that littered theJapanese economic landscape in the 1990s. Lansing warned that “thedecline in the U.S. personal saving rate and the dearth of internal savingraise concerns for the future.” Underlying these and virtually everyother discussion of saving trends is a point of agreement—saving for thefuture is important. This section begins by reviewing why saving isimportant and then provides some background on the downward trendin the U.S. personal saving rate.
6 FEDERAL RESERVE BANK OF KANSAS CITY
ECONOMIC REVIEW • SECOND QUARTER 2006 7
Why saving matters
The purpose of saving is to increase the resources available forfuture consumption. This point is true both for individual consumersand the nation as a whole. Households put aside some of their currentincome to provide for future consumption, such as a major vacation orbasic living expenses during retirement. Saving also helps protectagainst an unexpected loss of household income caused, for example, byillness or an unanticipated layoff. Typically, households invest theirsavings in financial assets, such as a bank account or mutual fund, orbuild equity in a real asset, such as a home. These assets can beredeemed or sold to others in the future to provide the funds needed tobuy consumer goods and services.
Personal saving is also important for the nation as a whole.Today’s saving influences future consumption because investments infinancial assets are channeled into productive investments in factories,industrial machinery, computers, and other kinds of capital. Increasesin the capital stock raise the nation’s ability to produce consumergoods and services in the future. A higher capital stock also raises theproductivity of future workers and their wages, providing increasedincome with which to purchase the increased quantity of consumergoods and services.1
Much of the concern about the low personal saving rate reflects theaging of the U.S. population and the pressure that aging will place on thenation’s healthcare and retirement systems. The U.S. population has beenaging gradually in recent decades, but the share of the population 65 andolder will rise much faster over the next 25 years as the large postwarbaby-boom generation ages. Various factors, including population agingand new medical technologies, have also caused medical costs to climbfaster than the overall inflation rate. As a result, the Social Security andMedicare programs face huge unfunded liabilities (Hakkio andWiseman). Meeting these future obligations might require higher taxburdens on future working-age families. Increased saving could helpreduce such burdens by raising the domestic capital stock and increasingoutput per worker. More productive workers would receive higher wages,making it easier for working-age families to pay higher social insurancetaxes if fiscal policymakers should decide to raise these taxes in the future.
8 FEDERAL RESERVE BANK OF KANSAS CITY
The decline in the NIPA saving rate
The most commonly cited measure of personal saving is from thenational income and product accounts (NIPA) produced by the U.S.Department of Commerce. The NIPA saving rate measures funds takenout of current household income and made available for capital forma-tion, such as investment in a new home or business equipment.2
Personal saving in NIPA equals disposable personal income less per-sonal outlays. Disposable personal income is the after-tax spendableincome of the household and nonprofit sector. Personal outlays aremostly personal consumption expenditures, but also include transfersand nonmortgage interest payments.3
The NIPA personal saving rate does not include capital gains andlosses on existing assets. These accounts were designed to measurecurrent productive activity, but an increase or decrease in the value of anexisting asset does not correspond to current production. This defini-tion of saving is also well suited to national income accounting becauseits calculation requires only current information on income, taxes paid,and personal outlays. The national income accountant does not have tomake forecasts of any future values, which would be uncertain and,perhaps, controversial.
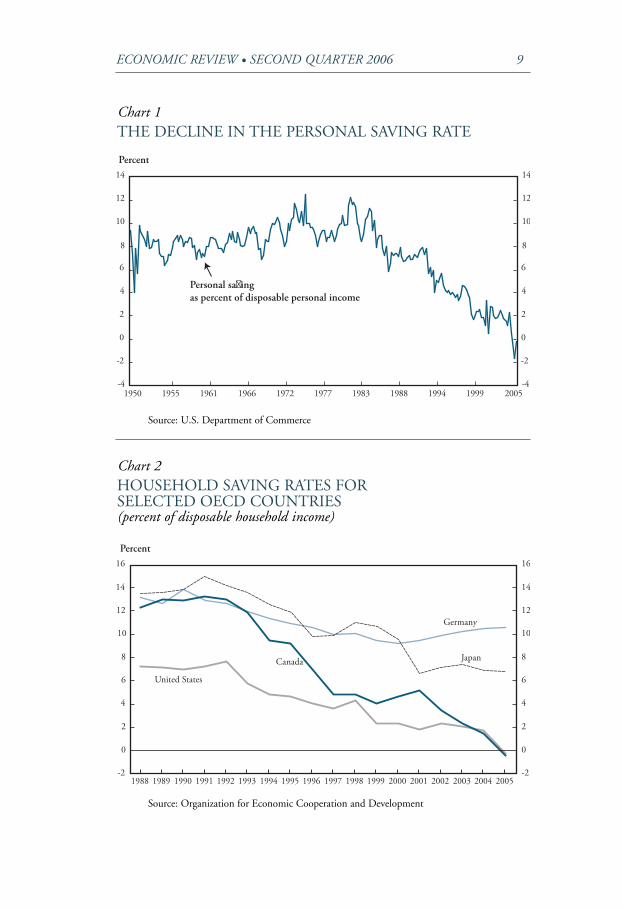
Based on currently available statistics, the decline in the NIPA per-sonal saving rate appears to have begun in the mid-1980s (Chart 1).After averaging 9.6 percent of disposable income in the 1970s, the per-sonal saving rate rose to 10.4 percent in 1980-84. However, thepersonal saving rate declined steadily thereafter from 7.7 percent in1985-89 to 6.5 percent in 1990-94, 3.8 percent in 1995-99, and 2.1percent in 2000-04. The current NIPA estimate for the saving rate in2005 is -0.4 percent. As will be explained later, the current estimate willlikely be revised in the future as new data sources become available andthe Commerce Department refines its statistical procedures.
Although the saving rate declined in many other developed countriesover this period, the downward trend in the U.S. saving rate was particu-larly pronounced. The personal saving rates for Canada, Germany, Japan,and the United States all declined from 1988 to 2005 (Chart 2).4 Thehousehold saving rate for Germany declined modestly from 13.2 percentof disposable income in 1988 to 10.6 percent in 2005, a decline of 2.6
ECONOMIC REVIEW • SECOND QUARTER 2006 9
Chart 1THE DECLINE IN THE PERSONAL SAVING RATE
Percent
-4
-2
0
2
4
6
8
10
12
14
-4
-2
0
2
4
6
8
10
12
14
1950 1955 1961 1966 1972 1977 1983 1988 1994 1999 2005
Personal saving as percent of disposable personal income
Source: U.S. Department of Commerce
Chart 2HOUSEHOLD SAVING RATES FOR SELECTED OECD COUNTRIES(percent of disposable household income)
Percent
-2
0
2
4
6
8
10
12
14
16
1988 1989 1990 1991 1992 1993 1994 1995 1996 1997 1998 1999 2000 2001 2002 2003 2004 2005-2
0
2
4
6
8
10
12
14
16
United States
Canada
Germany
Japan
Source: Organization for Economic Cooperation and Development
10 FEDERAL RESERVE BANK OF KANSAS CITY
percentage points. The Japanese saving rate declined by a much larger 6.8percentage points over that period, almost as large as the decline in theU.S. rate. However, the Japanese saving rate was much higher at thebeginning of the period and thus remained about seven percentage pointsabove the U.S. rate in 2005. The Canadian saving rate was well above theU.S. rate in 1988 but fell more sharply over this period and, like the U.S.rate, was slightly negative in 2005.
Possible economic explanations
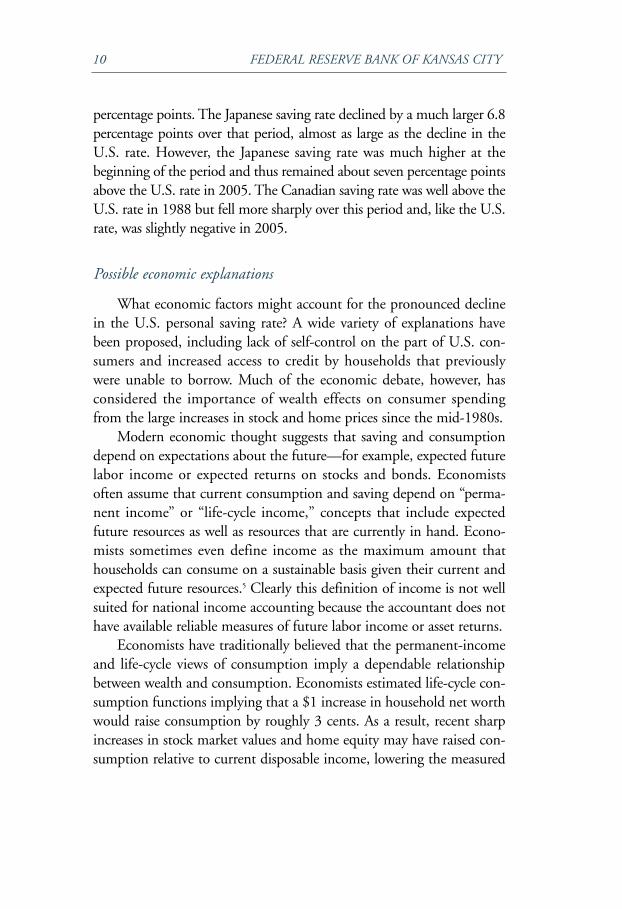
What economic factors might account for the pronounced declinein the U.S. personal saving rate? A wide variety of explanations havebeen proposed, including lack of self-control on the part of U.S. con-sumers and increased access to credit by households that previouslywere unable to borrow. Much of the economic debate, however, hasconsidered the importance of wealth effects on consumer spendingfrom the large increases in stock and home prices since the mid-1980s.
Modern economic thought suggests that saving and consumptiondepend on expectations about the future—for example, expected futurelabor income or expected returns on stocks and bonds. Economistsoften assume that current consumption and saving depend on “perma-nent income” or “life-cycle income,” concepts that include expectedfuture resources as well as resources that are currently in hand. Econo-mists sometimes even define income as the maximum amount thathouseholds can consume on a sustainable basis given their current andexpected future resources.5 Clearly this definition of income is not wellsuited for national income accounting because the accountant does nothave available reliable measures of future labor income or asset returns.
Economists have traditionally believed that the permanent-incomeand life-cycle views of consumption imply a dependable relationshipbetween wealth and consumption. Economists estimated life-cycle con-sumption functions implying that a $1 increase in household net worthwould raise consumption by roughly 3 cents. As a result, recent sharpincreases in stock market values and home equity may have raised con-sumption relative to current disposable income, lowering the measured
ECONOMIC REVIEW • SECOND QUARTER 2006 11
saving rate. For example, Juster and others argued that the decline inthe personal saving rate since the mid-1980s is mostly due to the largecapital gains on corporate stocks in this period.6
But estimates of the wealth effect on consumption have been diffi-cult to pin down empirically. For example, Ludvigson and Steindelfound that conventional estimates of the life-cycle wealth effect varysubstantially depending on which historical period is chosen for esti-mating the relationship. Poterba noted that recent estimates of theeffect of stock market wealth range from around 1 cent on the dollar atthe low end to 5 cents on the dollar at the high end.
Recent research also differs on the size of the wealth effect associ-ated with a change in home values. Some recent research finds that anincrease in housing wealth has a larger effect on consumer spendingthan changes in other kinds of wealth. Gains in stock market wealthmight have less effect in the short run on personal consumption becausehouseholds are aware that stock prices are highly volatile and, thus, donot feel certain that recent gains in stock market wealth will persist.Consistent with this view, Case, Quigley, and Shiller found a “ratherlarge effect of housing wealth upon household consumption.” In con-trast, Poterba’s survey of the empirical literature before 2000 found “atbest a weak link between house price changes and nonhousing con-sumption.” The sharp fluctuations in corporate stock prices and thelarge gain in home prices in recent years may eventually provide evi-dence that will help researchers settle such empirical disputes. Butreliable empirical results will also require an understanding of the prob-lems involved in measuring household saving accurately.
II. ISSUES IN MEASURING PERSONAL SAVING
One major reason that the decline in the personal saving rate maynot be as alarming as it first appears is that the decline may partly reflectmeasurement problems rather than a true decline in saving. This sectionfirst shows that several alternative measures based on the NIPA defini-tions may imply a somewhat higher or lower personal saving rate, butsuch measures do not eliminate the downward trend. Evidence is thenpresented that the personal saving rate has historically been revisedupward by fairly large amounts, although there is no guarantee that
12 FEDERAL RESERVE BANK OF KANSAS CITY
future revisions will be upward to the same extent. The section closes bynoting that possible conceptual changes in the national accounts relatedto growth of the knowledge economy might raise estimated U.S. savingand capital formation.
Alternative NIPA-concept measures
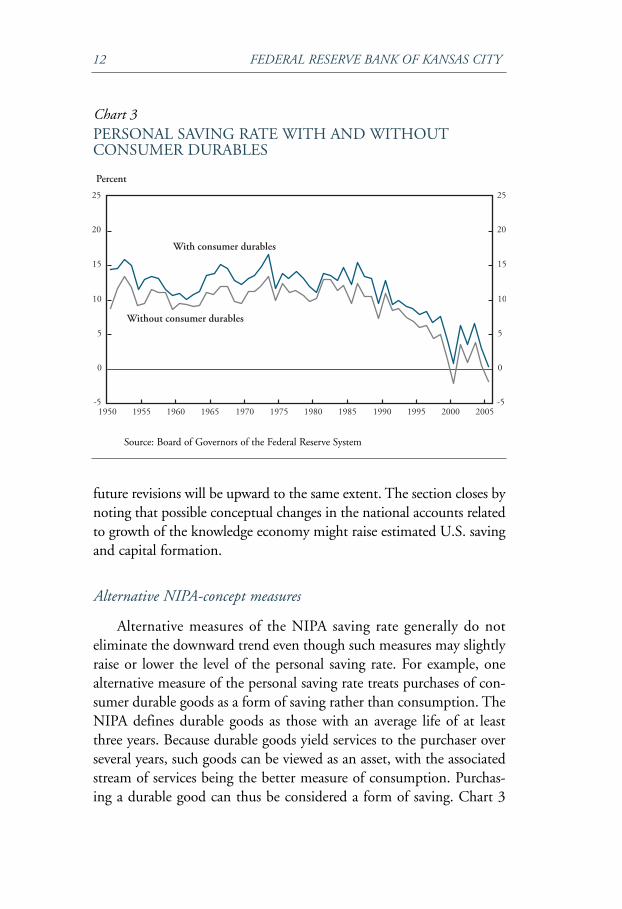
Alternative measures of the NIPA saving rate generally do noteliminate the downward trend even though such measures may slightlyraise or lower the level of the personal saving rate. For example, onealternative measure of the personal saving rate treats purchases of con-sumer durable goods as a form of saving rather than consumption. TheNIPA defines durable goods as those with an average life of at leastthree years. Because durable goods yield services to the purchaser overseveral years, such goods can be viewed as an asset, with the associatedstream of services being the better measure of consumption. Purchas-ing a durable good can thus be considered a form of saving. Chart 3
Chart 3PERSONAL SAVING RATE WITH AND WITHOUTCONSUMER DURABLES
1950 1955 1960 1965 1970 1975 1980 1985 1990 1995 2000 2005-5
0
5
10
15
20
25
-5
0
5
10
15
20
25
With consumer durables
Without consumer durables
Percent
Source: Board of Governors of the Federal Reserve System

ECONOMIC REVIEW • SECOND QUARTER 2006 13
presents alternative measures of the NIPA-concept personal saving ratefrom the Federal Reserve’s flow of funds (FOF) accounts.7 Althoughtaken from a different source than the national income accounts, thebasic saving measure in this chart is conceptually identical to the NIPAmeasure. Essentially it is an alternative calculation of the same concept,which can differ from the NIPA measure at any point in time butshows a similar downward trend. The second series in the chart alsoadopts the NIPA concepts except that purchases of consumer durablegoods are classified as saving.
Counting purchases of consumer durables as a form of saving raisesthe personal saving rate but does not eliminate the downward trend inthe 1980s and 1990s. The NIPA-concept saving rate calculated fromthe FOF statistics was actually negative in 2000, a year when the com-parable saving rate from the national income accounts was positive. Butcounting consumer durables as saving raises the personal saving rate in2000 to about 1 percent. On average, counting consumer durables assaving added about 2 percent to the saving rate from 1990 to 2004,with the increase closer to 21/2 percent since 2000 because of the generalstrength in consumer durables purchases. Nevertheless, recent savingrates with consumer durables included in saving are still down substan-tially from a rate near 13 percent in the 1970s and 1980s.
Another adjustment that tends to increase the measured personalsaving rate without eliminating the downward trend is to add federaltaxes on capital gains back into disposable personal income (Reinsdorf).Critics of the standard NIPA measure of the personal saving rate some-times note that it excludes capital gains and losses from personal incomebut nevertheless subtracts tax payments on realized capital gains whencomputing disposable income. An alternative measure leaves federaltaxes on realized capital gains in disposable income. This measure resultsin a personal saving rate that is 1.65 percent higher in 2000, a periodwhen capital gains realizations were unusually high. But the measurecontinued to display a sharp downward trend in the 1980s and 1990s.
In contrast, other measures of the NIPA-concept personal saving rateslightly lower the household saving rate. However, these alternative meas-ures also do not eliminate the downward trend. One possible adjustmentis to remove nonprofit institutions from the saving calculation. Because
14 FEDERAL RESERVE BANK OF KANSAS CITY
nonprofit institutions add more to personal income than to personaloutlays, this adjustment slightly lowers the household saving rate, but thisalternative measure has a similar downward trend.
Another adjustment that slightly lowers the personal saving rate isto exclude defined benefit pensions from the household sector of thenational income accounts. The NIPA treats pension plans as part of thehousehold sector, an approach that is clearly appropriate for 401(k)accounts and other defined-contribution plans because employees ownthe assets and bear the risks of asset-market fluctuations. The treatmentof defined-benefit plans is less clear, however, because employers makethe investment decisions and bear the risks for such plans. Under stan-dard NIPA accounting, an employer’s contribution to a pension fundand the investment income from the fund are counted as personalincome. Because of the strong gain in equity values during the 1990s,many employers were able to reduce their pension plan contributionswithout reducing benefit payments to current retirees. Reduced pensioncontributions thus lowered the measured personal saving rate, but alter-native calculations suggest that this factor did not drive the overalldecline in the personal saving rate (Reinsdorf ). An alternative measureof the personal saving rate that excludes private and governmentdefined-benefit plans yields a lower personal saving rate that still showsa pronounced downward trend.
Possible future revisions
The decline in the personal saving rate may not be as alarming as itfirst appears partly because of the possibility of future upward revisions.In practice, forecasters and policymakers must use the latest vintage ofeconomic statistics available at any point in time. But government stat-isticians continue to revise their estimates of personal income andoutlays for many years after the initial release as new informationsources become available and improved methodologies emerge. Per-sonal saving is the difference between personal income and personaloutlays, both of which are very large numbers. Relatively small percent-age revisions to either of these numbers can produce large percentagerevisions to the estimated personal saving rate.
ECONOMIC REVIEW • SECOND QUARTER 2006 15
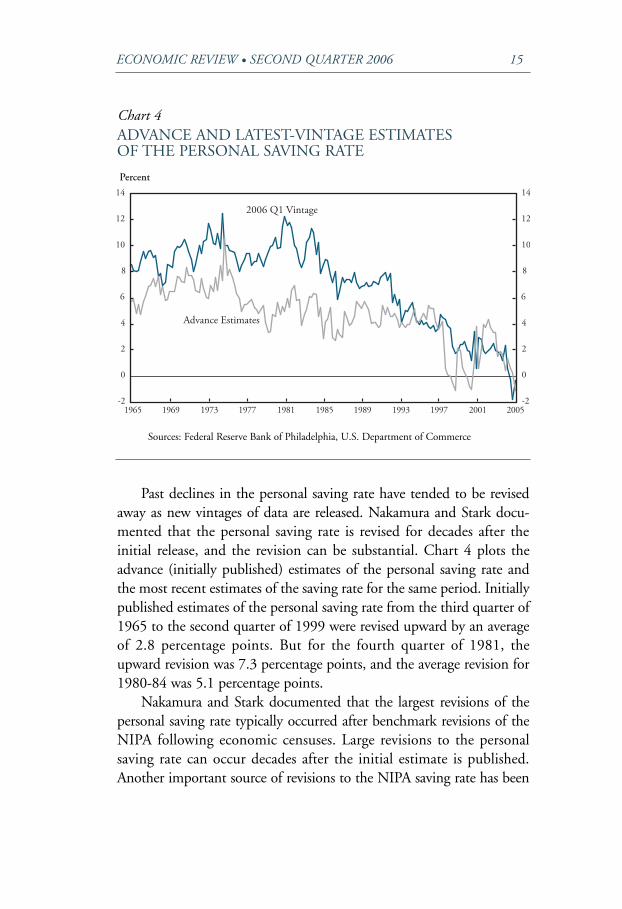
Past declines in the personal saving rate have tended to be revisedaway as new vintages of data are released. Nakamura and Stark docu-mented that the personal saving rate is revised for decades after theinitial release, and the revision can be substantial. Chart 4 plots theadvance (initially published) estimates of the personal saving rate andthe most recent estimates of the saving rate for the same period. Initiallypublished estimates of the personal saving rate from the third quarter of1965 to the second quarter of 1999 were revised upward by an averageof 2.8 percentage points. But for the fourth quarter of 1981, theupward revision was 7.3 percentage points, and the average revision for1980-84 was 5.1 percentage points.
Nakamura and Stark documented that the largest revisions of thepersonal saving rate typically occurred after benchmark revisions of theNIPA following economic censuses. Large revisions to the personalsaving rate can occur decades after the initial estimate is published.Another important source of revisions to the NIPA saving rate has been
Chart 4ADVANCE AND LATEST-VINTAGE ESTIMATES OF THE PERSONAL SAVING RATE
-2
0
2
4
6
8
10
12
14
-2
0
2
4
6
8
10
12
14
1965 1969 1973 1977 1981 1985 1989 1993 1997 2001 2005
2006 Q1 Vintage
Advance Estimates
Percent
Sources: Federal Reserve Bank of Philadelphia, U.S. Department of Commerce

16 FEDERAL RESERVE BANK OF KANSAS CITY
conceptual or methodological changes made during the benchmark revi-sions that incorporated previously unmeasured sources of householdincome. Nakamura and Stark noted, for example, that random IRSaudits to assess growth of the underground economy led to substantialupward revisions to estimated income in the 1985 benchmark NIPArevisions, with an associated upward revision to the personal saving rate.
Although future revisions to the saving rate do not necessarily haveto be upward, some evidence is accumulating that the next benchmarkNIPA revision may raise the personal saving rate. The U.S. CensusBureau benchmarked retail and food services sales to the 2002 EconomicCensus, revising some spending categories back as far as 1992. Retail andfood services sales for 2005, for example, were revised downward by 1.6percent. Such revisions suggest that personal consumption expendituresmay have been overstated in the NIPA accounts. Feroli estimated thatthis overstatement of personal consumption expenditures lowered theNIPA personal saving rate by 1.5 percentage points. Assuming no othersources of revision to NIPA consumption or income, this downwardrevision to consumer spending would be enough to return the personalsaving rate to a positive but still low value.
Saving and the knowledge economy
Growth of the knowledge economy is an important factor in assess-ing the possibility of future upward revisions to NIPA saving.Greenspan noted in 1996 that it would have been virtually impossiblein the mid-20th century to imagine the extent to which “concepts andideas would substitute for physical resources and human brawn in theproduction of goods and services.” In the ten years since that commentwas made, the trend toward a knowledge economy has only accelerated.This change in the economy may eventually require major statisticaland conceptual changes in the national accounts.
A growing share of real output is devoted to producing new ideasrather than investing in physical capital. Nakamura has argued that a largeshare of national wealth resides in intangible assets, such as patents, brandnames, copyrights, and data bases. Traditional accounting practices treatexpenditures to develop such assets as a business expense rather than thepurchase of a productive asset. If such expenditures were treated as capital
ECONOMIC REVIEW • SECOND QUARTER 2006 17
investment, similar to the purchase of a new factory or equipment, cor-porate profits and assets would be higher. One step in this direction wasthe Commerce Department’s decision to treat business purchases of soft-ware as a kind of investment rather than as a business expense.
At the household level, a similar measurement issue is the treatmentof private education expenditures. In an economy in which knowledge isthe key productive asset, educational expenditures could be considered aform of saving. Households build up knowledge capital that is expectedto result in higher incomes in the future, either for current wage earnersor their children. But current NIPA procedures count such expendituresas consumption. Household expenditures on education and researchamounted to over $224 billion in 2005. If such expenditures wereexcluded from personal consumption, the saving rate would rise from itslow negative value to about 2 percent of disposable income.
III. HOW WORRIED SHOULD WE BE?
Although there are reasons to think that the personal saving ratemight be revised upward in the years ahead, exceptionally large revisionswould be needed to eliminate the current downward trend. But there areother economic factors that should be weighed in assessing the low per-sonal saving rate. Some of these factors suggest concern is warranted,while others imply the decline may not be a serious problem. Thissection weighs these various economic factors along with the measure-ment issues to provide some perspective on the low personal saving rate.
Rising household net worth
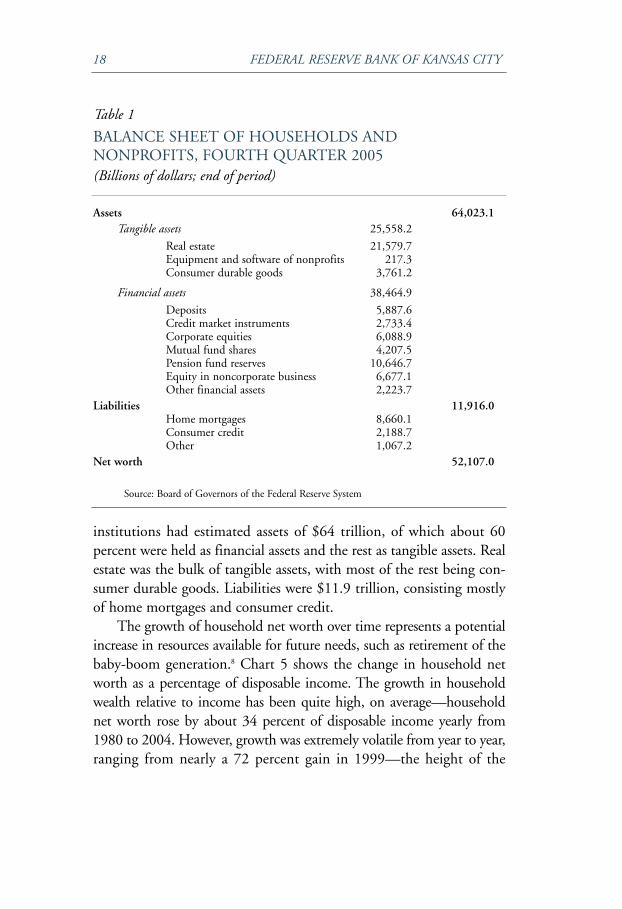
An important factor in assessing the low personal saving rate is therising net worth of U.S. households. In sharp contrast to the decliningNIPA personal saving rate, household net worth has increased substan-tially over the last decade. Standard measures of household net worthcome from the FOF accounts constructed by the staff at the Board ofGovernors of the Federal Reserve System. Accompanying these accountsare estimated balance sheets for the U.S. economy that report assets,both tangible and financial, and liabilities at the end of each quarter(Table 1). For the fourth quarter of 2005, households and nonprofit
18 FEDERAL RESERVE BANK OF KANSAS CITY
institutions had estimated assets of $64 trillion, of which about 60percent were held as financial assets and the rest as tangible assets. Realestate was the bulk of tangible assets, with most of the rest being con-sumer durable goods. Liabilities were $11.9 trillion, consisting mostlyof home mortgages and consumer credit.
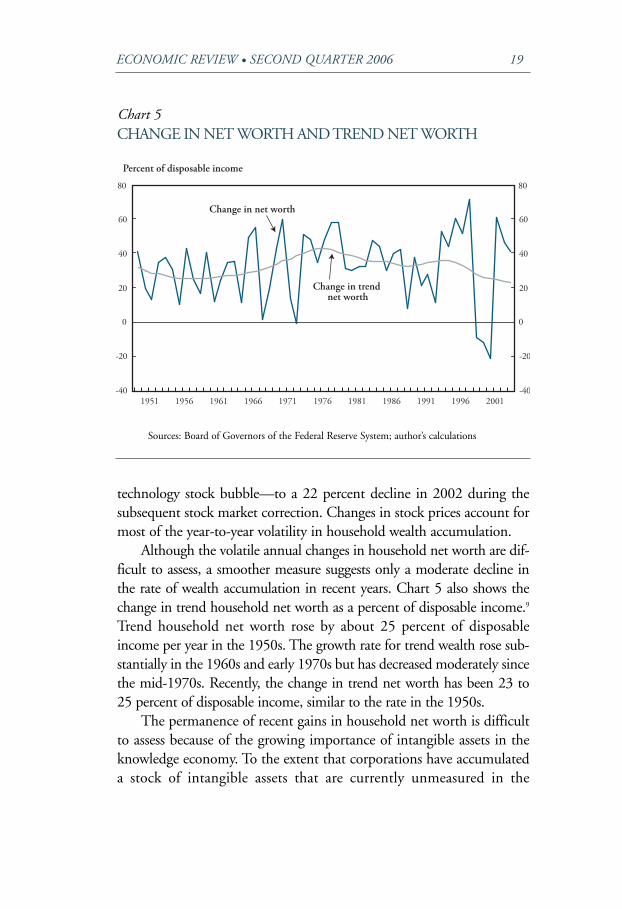
The growth of household net worth over time represents a potentialincrease in resources available for future needs, such as retirement of thebaby-boom generation.8 Chart 5 shows the change in household networth as a percentage of disposable income. The growth in householdwealth relative to income has been quite high, on average—householdnet worth rose by about 34 percent of disposable income yearly from1980 to 2004. However, growth was extremely volatile from year to year,ranging from nearly a 72 percent gain in 1999—the height of the
Assets 64,023.1Tangible assets 25,558.2
Real estate 21,579.7Equipment and software of nonprofits 217.3Consumer durable goods 3,761.2
Financial assets 38,464.9
Deposits 5,887.6Credit market instruments 2,733.4Corporate equities 6,088.9Mutual fund shares 4,207.5Pension fund reserves 10,646.7Equity in noncorporate business 6,677.1Other financial assets 2,223.7
Liabilities 11,916.0Home mortgages 8,660.1Consumer credit 2,188.7Other 1,067.2
Net worth 52,107.0
Table 1
BALANCE SHEET OF HOUSEHOLDS ANDNONPROFITS, FOURTH QUARTER 2005(Billions of dollars; end of period)
Source: Board of Governors of the Federal Reserve System
ECONOMIC REVIEW • SECOND QUARTER 2006 19
technology stock bubble—to a 22 percent decline in 2002 during thesubsequent stock market correction. Changes in stock prices account formost of the year-to-year volatility in household wealth accumulation.
Although the volatile annual changes in household net worth are dif-ficult to assess, a smoother measure suggests only a moderate decline inthe rate of wealth accumulation in recent years. Chart 5 also shows thechange in trend household net worth as a percent of disposable income.9
Trend household net worth rose by about 25 percent of disposableincome per year in the 1950s. The growth rate for trend wealth rose sub-stantially in the 1960s and early 1970s but has decreased moderately sincethe mid-1970s. Recently, the change in trend net worth has been 23 to25 percent of disposable income, similar to the rate in the 1950s.
The permanence of recent gains in household net worth is difficultto assess because of the growing importance of intangible assets in theknowledge economy. To the extent that corporations have accumulateda stock of intangible assets that are currently unmeasured in the
Chart 5CHANGE IN NET WORTH AND TREND NET WORTH
-40
-20
0
20
40
60
80
-40
-20
0
20
40
60
80
1951 1956 1961 1966 1971 1976 1981 1986 1991 1996 2001
Percent of disposable income
Change in net worth
Change in trend net worth
Sources: Board of Governors of the Federal Reserve System; author’s calculations
20 FEDERAL RESERVE BANK OF KANSAS CITY
national accounts, a higher stock price may be justified. Relatively highstock values in the late 1990s and early 2000s may reflect investors’growing realization of the importance of such intangible assets.
Research by Hall suggested that some part of the sharp increase inhousehold net worth over the last decade may be sustainable. It repre-sents corporate accumulation of intangible assets related to growth ofthe knowledge economy. Hall emphasized what he called “e-capital,” abody of business methods and organizational knowledge that hasallowed some industries to dramatically raise productivity and customerservice. Hall argued that this rapid accumulation of e-capital was essen-tially an “upsurge in saving resulting at least in part from technicalprogress in forming e-capital.” Such saving does not appear in corporateaccounts or the NIPA, but the evidence for this saving is “manifested inthe rising stock market.”
Greater inclusion of intangible assets in the national incomeaccounts also would increase measured corporate and net nationalsaving. Corrado, Hulten, and Sichel have estimated the amount ofintangible investment excluded from GDP, finding that the amountcould be as much as $800 billion annually.10 Omission of intangibleassets may also lead to an understatement of the business capital stock byup to $3 trillion. Because intangible investments accelerated in the1990s, including such investments in the national accounts would likelyoffset some of the apparent decline in the national saving rate as well asmake current corporate share valuations appear more sustainable.
Weighing the long-run concerns
Weighing the long-run concerns may be more difficult than assessingthe short-term risks to economic performance.11 Although cyclical changesin the personal saving rate have occurred in the past, the projected aging ofthe U.S. population over the next 25 years is unprecedented in our nation’shistory and therefore might pose unanticipated challenges. Most econo-mists and policymakers feel that more personal saving would be desirableto meet such challenges, but putting any dollar amount on the neededincrease in saving seems highly speculative at this point. Instead, twofactors are noted that suggest that any long-term saving deficit may not beas alarming as some discussions would imply.
ECONOMIC REVIEW • SECOND QUARTER 2006 21
First, the measurement problems discussed earlier are relevant inassessing the long-term adequacy of household savings. Even if the per-sonal saving rate were revised upward, it would still be low unless therevisions are much larger than average. But if the growth of the knowl-edge economy were fully incorporated in saving measures, the personalsaving rate would likely rise, and current high asset values would appearmore sustainable. Such assets could provide financial resources to meetfuture retirement needs for the U.S. population, and the associatedgrowth in productivity of U.S. firms and workers could contributeneeded additional output of real goods and services.
Second, new simulation models provide growing evidence that mostU.S. households are behaving in line with the predictions of economictheory. If households follow the permanent income hypothesis or thelife-cycle model, they rationally assess future retirement needs and adjustsaving and consumption appropriately as current asset values change.Scholz and others found that over 80 percent of U.S. households haveaccumulated more wealth than their optimal targets, taking into accounttheir demographic characteristics and realistic expectations about futureearnings and retirement benefits. But even though most householdsappear to be on track to reach their required retirement nest eggs, somehouseholds are not. Undersavers are concentrated in the bottom half ofthe lifetime income distribution and tend to be disproportionatelysingle-person households.12 In addition, large unanticipated shocks tothe economy and financial markets might endanger the retirement plansof households whose savings appear to be on track. Thus, the long-runconcerns about personal saving should not be dismissed entirely, but theproblem may not be as severe as the downward trend in the personalsaving rate suggests.
Weighing the short-run concerns
With respect to short-term economic performance, many commen-tators have expressed concern that the low personal saving rate increasesthe risk of a sharp slowdown in the future. Generally, the concern isthat saving is unsustainably low and that a retrenchment in consumerspending will reduce aggregate demand and real economic growth. In2005, personal consumption was $7,857 billion in chained (2000)
22 FEDERAL RESERVE BANK OF KANSAS CITY
dollars, and disposable personal income was $8,120 billion. If the per-sonal saving rate were suddenly to increase by one percentage point ofdisposable income, with the increase occurring solely through a declinein personal consumption, then consumption would have to fall byabout $80 billion, or 0.7 percent of real GDP in 2005. If this declineoccurred in one quarter, it would reduce real GDP growth by 2.8percent at an annual rate, which would be a substantial drag on overallgrowth. Moreover, such a one-percentage-point increase in the savingrate would still leave the personal saving rate well below its average ofaround 7.5 percent since 1950, suggesting any upward correction in thesaving rate might exceed one percentage point.
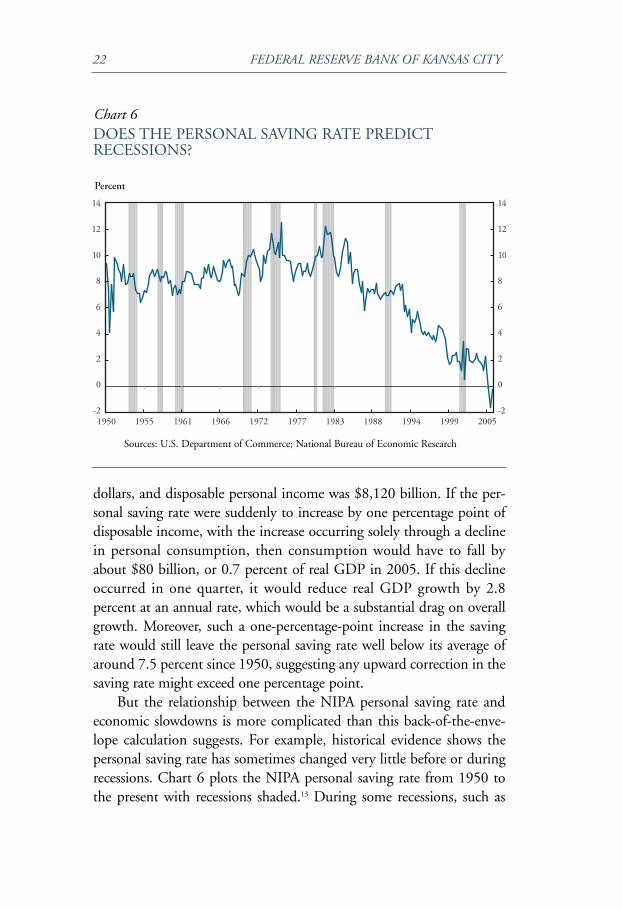
But the relationship between the NIPA personal saving rate andeconomic slowdowns is more complicated than this back-of-the-enve-lope calculation suggests. For example, historical evidence shows thepersonal saving rate has sometimes changed very little before or duringrecessions. Chart 6 plots the NIPA personal saving rate from 1950 tothe present with recessions shaded.13 During some recessions, such as
Chart 6DOES THE PERSONAL SAVING RATE PREDICTRECESSIONS?
-2
0
2
4
6
8
10
12
14
-2
0
2
4
6
8
10
12
14
1950 1955 1961 1966 1972 1977 1983 1988 1994 1999 2005
Percent
Sources: U.S. Department of Commerce; National Bureau of Economic Research
ECONOMIC REVIEW • SECOND QUARTER 2006 23
those in the 1970s and early 1980s, the personal saving rate increasedsharply before or during the recession. But such a pattern was not at allclear during the 1950s and early 1960s or in the last two recessions. Forexample, during the relatively mild 1990-91 recession, the saving ratewas fairly flat immediately before and during the recession, and thebroader trend during this period was a decline.
An increase in the personal saving rate need not occur as describedin the preceding illustrative calculation in which personal consumptionexpenditures fall. For example, the personal saving rate could adjustupward gradually if consumption grows at its longer-term average rate,while the growth rate of disposable income increases. This alternativescenario could be consistent with a permanent-income or life-cycletheory of consumer behavior. Forward-looking households would haveinitially incorporated all available information about future income intotheir consumption plans. If new information were to become availablethat disposable income is likely to increase faster in the future, house-holds might immediately boost their estimates of permanent income,and would increase their consumption accordingly. Because the increasein consumption precedes the anticipated increase in income, the meas-ured saving rate initially might decline. But if the income increasesmaterialize as expected, consumption need not be adjusted further, andthe more rapid gains in disposable income would raise the measuredsaving rate.
Some empirical research supports the view that a low personalsaving rate predicts faster economic growth rather than the more widelydiscussed scenario of a slowdown. Ireland estimated a quarterly modelof labor income and savings and imposed restrictions derived from thepermanent income model. The resulting model had smaller forecastingerrors than economic models without such restrictions. Most impor-tant, Ireland concluded that “Estimates from this model show that theU.S. data conform not to conventional wisdom, but to the intuitionprovided by the permanent income hypothesis; historically, declines insavings have preceded periods of faster, not slower, income growth.”
In contrast, Nakamura and Stark found that saving rates are notuseful for forecasting economic growth in a real-time setting. Theyconducted forecasting experiments similar to those of Ireland, butusing real disposable income instead of labor income for reasons of
24 FEDERAL RESERVE BANK OF KANSAS CITY
data availability. Although Ireland’s results appear to be correct forheavily revised data, which should more closely reflect the “true” per-sonal saving rate, the real-time data available historically to forecastershave not improved predictions of real disposable income, real GDP, orpersonal consumption.
Although such evidence does not guarantee that a sudden increase inthe personal saving rate will not hurt short-run economic performance,both empirical evidence and theoretical reasoning suggest a low personalsaving rate does not necessarily imply painful economic adjustments.
IV. CONCLUSION
Economists and policymakers have expressed concern about thedecline in the personal saving rate over the last two decades. This articledoes not mean to suggest that saving should not be a matter of policyconcern. Some part of the U.S. population likely is not saving ade-quately for future retirement needs, and large adjustments in thepersonal saving rate could pose short-term cyclical problems if theadjustments occurred sharply. However, this article has provided someperspective on the issue by examining various measurement problemsand economic arguments. There are reasons to think that the NIPA esti-mate of the personal saving rate might be revised upward in the future.In addition, a revised accounting framework that better reflected growthof the knowledge economy would likely raise estimated personal savingas well as making current stock market valuations appear more sustain-able. To the extent that American households have correctly anticipatedfuture gains in productivity and labor income and incorporated theseexpectations into their spending plans, any future adjustments in con-sumption spending need not be wrenching. Although there are somelegitimate reasons for concern, the decline in the personal saving ratemay not be as alarming as it appears.
ECONOMIC REVIEW • SECOND QUARTER 2006 25
ENDNOTES
1This article focuses on the decline in the personal saving rate. A completeunderstanding of the forces affecting the U.S. capital stock and productivity,however, requires a look at national saving. National saving is the sum of personalsaving, corporate saving, and government saving. The national saving rate,defined as national saving as a percentage of gross national income, has alsotrended downward in recent decades. Corporate saving has not had the pro-nounced downward trend seen in personal saving, and in fact, corporate savingwas relatively strong at 3.7 percent of gross national income in 2005. But the gov-ernment has consistently run a deficit—its saving has been negative—and thathas substantially lowered the national saving rate in recent decades. Combiningthese rates, the national saving rate was 0.9 percent in 2005, down from 8.3 per-cent in 1970.
2Gross saving includes funds that go to replace depreciating capital goods. Ifsuch depreciation is subtracted out, net saving represents resources that are avail-able to increase the capital stock over and above its level at the start of the period.Although discussions of economic growth typically focus on net saving, gross sav-ing may also be important because the replacement of existing equipment andsoftware often introduces newer and more productive technologies.
3Personal income includes wage and salary income and benefits, interest anddividend income, proprietors’ and rental income, and net transfer payments. Dis-posable personal income is personal income minus personal taxes. In the NIPAaccounts, disposable personal income includes the income of nonprofit institu-tions and unincorporated businesses in addition to households. Personal con-sumption expenditures were more than 96 percent of personal outlays in 2005.
4Chart 2 presents net household saving rates published by the Organizationfor Economic Cooperation and Development.
5Ireland provides an excellent discussion of Friedman’s permanent incomehypothesis. Similar ideas are developed in the life-cycle hypothesis of Modiglianiand Brumberg.
6Their overall estimate of the wealth effect was consistent with the 3 cents onthe dollar figure. However, disaggregating by asset class, the study found a muchlarger estimate of the stock market wealth effect—as much as 19 cents on the dol-lar. A complete review of estimates of the wealth effect is beyond the scope of thisarticle. Poterba provided an excellent overview of studies up to 2000.
7Teplin provides an overview of the U.S. FOF accounts and some of theiruses. The FOF accounts record net transactions in over 40 types of financialinstruments by 30 economic sectors, including incorporated and unincorporatedbusinesses, the federal government, state and local governments, and variousfinancial intermediaries. The household information discussed here is, thus, asmall part of the information in the FOF accounts.
8An important limitation of the aggregate measures of household net worthis that such measures do not reflect differing developments across householdincome or wealth categories. Because wealth is distributed unevenly, capital gainsby wealthy households might disguise a deteriorating financial situation for
26 FEDERAL RESERVE BANK OF KANSAS CITY
households with lower wealth. The Federal Reserve Board’s Survey of ConsumerFinances showed, for example, a complex pattern of distributional changesbetween 2001 and 2004 (Bucks, Kennickell, and Moore).
9The trend in household net worth was computed using the Hodrick-Prescott filter with annual data and the default tuning parameter of 100 in theRATS statistical package. The change in the trend is then expressed as a percentof disposable personal income.
10In an earlier study, Nakamura estimated that excluding intangible invest-ments could lower GDP by over $1 trillion annually. National income statisticiansbegan to include some expenditures on intangible assets as business investment in1999 when computer software was added to NIPA business investment.
11This section focuses on the long-term challenge from population aging.The low personal saving rate is also related, however, to the large U.S. currentaccount deficit. An increase in the personal saving rate would raise national sav-ing—other factors held constant—and reduce the need for the United States toborrow abroad to finance domestic investment.
12Scholz and others noted, however, that these results applied specifically to asample of households age 51 to 61 in 1992. Caution should be used in generaliz-ing the findings to younger households, especially if the social security program ischanged substantially in the future.
13The shaded regions in Chart 6 are recessions as dated by the NationalBureau of Economic Research. The NBER determines monthly dates for peaksand troughs in economic activity. Chart 6 presents quarterly observations withthe peaks and troughs corresponding to the quarters in which the monthlyNBER turning-point dates fall.
ECONOMIC REVIEW • SECOND QUARTER 2006 27
REFERENCES
Board of Governors of the Federal Reserve System. 2006. “Z1 Release. Flow ofFunds Accounts of the United States,” March 9, http://www.federalreserve.gov/releases/z1/current/default.htm.
Bucks, Brian K., Arthur B. Kennickell, and Kevin B. Moore. 2006. “RecentChanges in U.S. Family Finances: Evidence from the 2001 and 2004 Surveyof Consumer Finances,” Federal Reserve Bulletin, http://www.federalreserve.gov/pubs/bulletin/default.htm.
Case, Karl E., John M. Quigley, and Robert J. Shiller. 2005. “ComparingWealth Effects: The Stock Market versus the Housing Market,” Advancesin Macroeconomics, vol. 5, no. 1.
Corrado, Carol A., Charles R. Hulten, and Daniel E. Sichel. 2006. “IntangibleCapital and Economic Growth,” National Bureau of Economic Researchworking paper no. 11948, January.
Eisinger, Jesse. 2006. “Long & Short: Night of the Living Debt—OverextendedConsumers Present A Serious Issue for the Economy, And How Will RetailersReact?” The Wall Street Journal, January 4.
Federal Reserve Bank of Philadelphia. 2006. “Real-Time Data Set,”http://www.phil.frb.org/econ/forecast/reaindex.html.
Feroli, Michael. 2006. “Personal Saving Rate Understated by 11/2 PercentagePoints,” JPMorgan Chase Bank, U.S. Weekly Prospects, April 21.
Friedman, Milton. 1957. A Theory of the Consumption Function. Princeton:Princeton University Press.
Greenspan, Alan. 1996. “Technological Advances and Productivity,” speech tothe 80th Anniversary Awards Dinner of the Conference Board, New York,October 16.
Hakkio, Craig S., and Elisha J. Wiseman. 2006. “Social Security and Medicare:The Impending Fiscal Challenge,” Federal Reserve Bank of Kansas CityEconomic Review, First Quarter.
Hall, Robert E. 2000. “E-Capital: The Link between the Stock Market and theLabor Market in the 1990s,” Brookings Papers on Economic Activity, no. 2.
Ireland, Peter N. 1995. “Using the Permanent Income Hypothesis for Forecasting,”Federal Reserve Bank of Richmond Economic Quarterly, Winter.
Juster, F. Thomas, Joseph P. Lupton, James P. Smith, and Frank Stafford. 2006.“The Decline in Household Saving and the Wealth Effect,” Review ofEconomics and Statistics, February.
Lansing, Kevin J. 2005. “Spendthrift Nation,” Federal Reserve Bank of SanFrancisco Economic Letter, no. 2005-30, November 10.
Ludvigson, Sydney, and Charles Steindel. 1999. “How Important is the StockMarket Effect on Consumption?” Federal Reserve Bank of New YorkEconomic Policy Review, July.
Modigliani, Franco, and Richard Brumberg. 1954. “Utility Analysis and theConsumption Function: An Interpretation of Cross-Section Data,” inKenneth K. Kurihara, ed., Post-Keynesian Economics. New Brunswick: RutgersUniversity Press.
28 FEDERAL RESERVE BANK OF KANSAS CITY
Nakamura, Leonard. 2001. “Investing in Intangibles: Is a Trillion Dollars Missingfrom GDP?” Federal Reserve Bank of Philadelphia Business Review, FourthQuarter.
Nakamura, Leonard, and Tom Stark. 2005. “Benchmark Revisions and the U.S.Personal Saving Rate,” Federal Reserve Bank of Philadelphia working paperno. 05-6, April.
National Bureau of Economic Research, http://www.nber.org/cycles/cyclesmain.html.Organization for Economic Cooperation and Development. 2005. “Annex Table
23. Household saving rates,” http://www.oecd.org/dataoecd/5/48/2483858.xls.Poterba, James M. 2000. “Stock Market Wealth and Consumption,” Journal of
Economic Perspectives, Spring.Reinsdorf, Marshall B. 2004. “Alternative Measures of Personal Saving,” Survey of
Current Business, September.Roach, Stephen. 2006. “Save More! Save Less!” March 7, http://money.cnn.com/
2006/03/03/news/international/chinasaving_fortune/index.htm.Scholz, John Karl, Ananth Seshadri, and Surachai Khitatrakun. 2005. “Are
Americans Saving ‘Optimally’ for Retirement?” December, forthcoming inJournal of Political Economy.
Teplin, Albert M. 2001. “The U.S. Flow of Funds Accounts and Their Uses,”Federal Reserve Bulletin, July.
U.S. Census Bureau. 2006. Annual Revision of Monthly Retail and Food Services:Sales and Inventories—January 1992 Through February 2006, March.
U.S. Department of Commerce. 2006. Gross Domestic Product: FourthQuarter 2005 (Final), BEA 06-11, March 30, http://www.bea.gov/bea/newsrelarchive/2006/gdp405f.pdf.