
Short-Run Response or Structural Change? · Originally published by the IRC Press in 1987, as part...
26
A QUEEN’S UNIVERSITY IRC ARCHIVE DOCUMENT Originally published by the IRC Press in 1987, as part of the Queen’s Papers in Industrial Relations Recent Wage Deceleration: Short-Run Response or Structural Change? Pradeep Kumar Associate Director, School of Industrial Relations/Industrial Relations Centre, Queen's University Industrial Relations Centre (IRC) School of Policy Studies Queen’s University Kingston, ON K7L 3N6 Tel: 613-533-6628 Fax: 613-533-6812 Email: [email protected] Visit us at: irc.queensu.ca
Transcript of Short-Run Response or Structural Change? · Originally published by the IRC Press in 1987, as part...

A QUEEN’S UNIVERSITY IRC ARCHIVE DOCUMENT Originally published by the IRC Press in 1987, as part of the Queen’s Papers in Industrial Relations
Recent Wage Deceleration: Short-Run Response or Structural Change?
Pradeep Kumar Associate Director, School of Industrial Relations/Industrial Relations Centre, Queen's University
Industrial Relations Centre (IRC) School of Policy Studies Queen’s University Kingston, ON K7L 3N6
Tel: 613-533-6628 Fax: 613-533-6812 Email: [email protected] Visit us at: irc.queensu.ca

ISBN: 0-88886-158-3 Printed and bound in Canada. Industrial Relations Centre Queen's University Kingston, Ontario Canada K7L 3N6 © 1987 Queen’s University IRC
Note: The author is grateful to David Arrowsmith and Mary Lou Coates for their valuable research assistance, and to Professors W. Donald Wood, Steve Kaliski, and Charles Beach for helpful comments and suggestions. A preliminary version of this paper was presented at the annual meeting of the Canadian Industrial Relations Association held in Winnipeg in May 1986.

Table of Contents I. Trends in Aggregate Wage Series ....................................................................................................... 1
II. Wage and Related Outcomes of Collective Bargaining ...................................................................... 2
III. Explanations for the Wage Deceleration and Flexibility .................................................................... 4
IV. Conclusions and Policy Implications .................................................................................................. 6
References ..................................................................................................................................................... 19

1
Since 1982, wage inflation in Canada has shown a pronounced deceleration. Wage settlements and rates of increase in various measures of earnings have declined to their lowest level in the past 25 years. Wage cuts, wage freezes, de-indexing, and flexible compensation in the form of two-tier wage systems and lump-sum payments in lieu of wage increases have become a frequent occurrence in collective bargaining. This wage experience is somewhat of a novelty for Canada, and is also unique among OECD countries.
Many observers are wondering if the recent wage behaviour and related collective bargaining outcomes mark a turning point in industrial relations.i More specifically, do the wage developments of the past few years reflect a fundamental change in wage setting processes or are they simply a natural and temporary response to the long and severe recession of 1981-82 and the subsequent uneven pattern of economic recovery?
This paper attempts to explore these questions. Its purpose is twofold: (a) to review recent trends in various wage indicators, in particular the wage and related outcomes of collective bargaining; and (b) to assess empirically if these trends are a product of the changed economic and labour market conditions or represent a structural change in wage setting processes.
The paper is divided into four sections. The first section looks at various aggregate wage and earnings series, including the base rate increase in new collective agreements, with a view to deriving some firm conclusions on the recent wage behaviour. Wage performance in post-war recessions and recoveries, and the developments in Canada and the U.S. are also briefly compared and contrasted. The following section examines in more detail wage and related outcomes of collective bargaining. In section three, predictions from estimated Phillips Curve wage equations are compared with actual wage increases to assess whether the recent wage deceleration can be explained by the high rates of unemployment and the steady decline in inflation since 1982, or represents a structural change in wage setting processes. The last section of the paper summarizes the extent and nature of wage flexibility and its policy implications.
I. Trends in Aggregate Wage Series
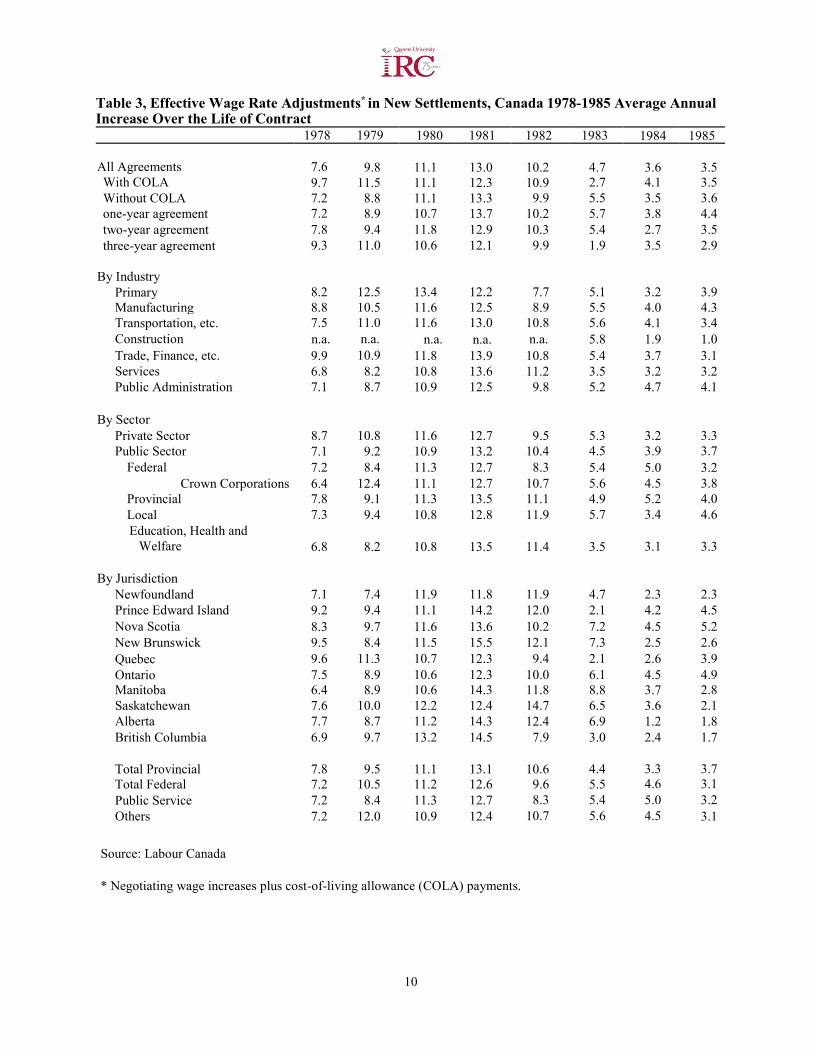
Tables 1, 2, and 3 present average annual rates of change in three key series of compensation: (1) average hourly compensation, which covers all forms of employee compensation and is derived by dividing the estimates of labour income with the estimates of total hours worked; (2) average weekly earnings in the non-agricultural commercial sector; and (3) negotiated and "effective" base rate increases in new settlements including the potential payments under cost-of-living (COLA) clauses. Table 1 shows average rates of increase in various aggregate series by major industry groups for the period 1958-1985 as well as the annual rates of inflation and unemployment. Table 2 presents annual rates of increase in average weekly earnings by province for the years 1958-1985. Table 3 gives average effective annual adjustments since 1978 in base rates in new settlements by industry, jurisdiction and selected contract characteristics.
All three series show a marked deceleration in wage inflation over the past 4 years following a steady decline in rates of increase in consumer prices and an escalation in the unemployment rate. The downward trend began in mid-1982 after one full year of economic recession, gained momentum in 1983 and 1984, and appeared to have stabilized in 1985. Average annual rates of increase in wage settlements and other earnings measures during the period 1984-85 have been the lowest in over 25 years. Recent trends and
2
patterns in various series similarly indicate that although rates of increase by industry and region have varied, reflecting uneven labour market conditions, the deceleration has been broad-based.
The length and the depth of wage deceleration since 1982 is also in sharp contrast to the experience in earlier post-war recessions and recoveries, (Wood and Kumar, 1984 & 1985; Finance Canada, 1985), reflecting the unique nature and extent of the 1981-82 recession and subsequent recovery. None of the previous post-war recessions has been as long and as severe or has had as many serious repercussions on the labour market as the 1981-82 recession; recessions in Canada during the past three decades were mild and short-lived and did not generate long and pronounced deceleration of nominal wages. Similarly, previous recoveries have seldom witnessed such persistent high rates of unemployment as the current recovery or a decline in wage and price inflation of the magnitude of 1983-85. According to Finance Canada estimates, average compensation rose slightly in the first year of the past five recoveries compared to the decline of 4.5 percent in 1983-84.
A comparative analysis of wage behaviour in major industrialized countries also reveals that "Canada recorded the fastest deceleration in wage inflation of any OECD country in 1982 and 1983" (OECD, 1986, pp. 22-24; OECD, 1985, pp. 36-50). A comparison of Canadian and U.S. wage developments similarly indicates that although the wage response to economic conditions was faster in the U.S.,ii the wage deceleration in Canada since 1982 has been relatively longer, greater and more extensive.
II. Wage and Related Outcomes of Collective Bargaining
Recent wage settlements provide a more complete perspective on the nature and extent of deceleration and its potential implications for labour market flexibility. Table 3 shows effective base rate adjustments in new settlements since 1978 including the potential payments from COLA clauses. Table 4 compares average annual increases over the life of the contract and for the first year in selected key settlements concluded in 1984-85 with the increases negotiated in the previous bargaining round. The figures illustrate the dramatic turn-around in union wage behaviour since 1982. In the absence of a non-union wage series, however, it is not possible to confirm whether the unionized sector led the wage deceleration as appears to be the case in the United States.iii
Many features of the wage experience in collective bargaining are noteworthy:
1. While there was evidence of a downward trend in negotiated wage adjustments as early as the first quarter of 1982, the deceleration became pronounced and widespread only in 1983 with the marked decline in rates of increase in consumer prices and the serious deterioration in labour market conditions. Wage settlements reached a record low in 1984-85 following a steady downward trend in inflation, persistent double-digit rates of unemployment, weak and uneven employment recovery, and the sustained efforts by private sector employers to improve their competitive cost position. In both 1984 and 1985 average base rate increases in new settlements were below the prevailing rate of inflation.iv
2. Although wage deceleration has been broad-based, occurring in all settlements with or without a cost-of-living allowance (COLA) clause and for contracts of short-term or long-term duration, there has been a marked divergence in wage behaviour across firms, industries and provinces reflecting the uneven impact of recession and recovery. For example, compared to the

3
manufacturing industry and provinces such as Ontario, wage settlements have been significantly lower in construction and in the provinces of Alberta and British Columbia, which were hardest hit by the recession and where economic recovery has been extremely weak and uncertain. Also, in general, negotiated wage increases in the public sector have exceeded the private sector adjustments.
3. In many bargaining situations the collective bargaining response to changed economic conditions has also included wage freezes and nominal wage cuts, particularly in the first year of the contract. For example, in 1983 wage freezes or cuts were a feature of 65 settlements (10 percent of the total) affecting more than 200 thousand workers (14 percent of the employees covered by new settlements). The number of settlements providing a wage freeze or cuts in 1984 increased to 139 agreements (25 percent of the total) involving close to 300 thousand workers (one quarter of the total). While the incidence of the freeze dropped off substantially in 1985, there were still 78 settlements (16 percent of the total) affecting 168 thousand workers where wage rates in the first year of the contract were either frozen or cut. Nominal wage freezes or cuts have been particularly marked in the western provinces, where nearly one of every two settlements has included a wage freeze or cut, and in the construction industry. In most of these cases, there was either evidence of significant wage escalation in the past, or growing non-union and other competitive pressures, in addition to the extremely weak labour market conditions resulting from the severe recession and/or the poor economic recovery.
4. Wage settlements in recent years have been more "individualized" and "organization specific", reflecting the uneven impact of the recession and recovery.v The current emphasis on decentralized bargaining is in sharp contrast to the heavy use of pattern bargaining and the trend towards multi-plant, multi-employer settlements in the late 1970s and early 1980s.vi
5. Unions and management in recent years have also negotiated a variety of other provisions to make compensation more flexible. Prominent among these are two-tier wage systems, lump-sum payments in lieu of wage rate increases, and profit sharing/employee stock ownership plans.vii Two-tier wage systems have become a popular feature of agreements in retail food stores and air-lines. Lump-sum payments have been appearing frequently in settlements in education, hospitals and manufacturing in lieu of retroactive pay or as a no-strike bonus productivity allowance or as a special adjustment. Lump-sum payments are a special feature of settlements where wage rates have been frozen. Profit sharing/stock-ownership plans are perhaps the most infrequent provision, negotiated in only about seven settlements so far.
6. Finally, the recent collective bargaining experience has been characterized by an increasing trend towards multi-year contracts, a decline in the relative importance of COLA clauses, an increase in back-loading, i.e. smaller wage adjustments in the first year compared with later years of the contract, and a marked decrease in the incidence of work stoppages and the resulting loss in working time. In addition, recent years have also seen a growing emphasis on job and income security provisions, training and re-training, flexible work arrangements, pay and employment equity, and, in a limited number of situations, more effective consultation and communication mechanisms (Wood & Kumar, 1985; Kumar et al., 1986; Labour Canada, 1985).

4
III. Explanations for the Wage Deceleration and Flexibility
The unprecedented length and breadth of wage deceleration and the associated changes in collective bargaining processes and outcomes in a period of economic recovery oriented towards wage flexibility has raised questions as to whether these recent developments are simply a natural and temporary response to severe economic and labour market pressures facing labour and management, or signals of a fundamental change in established wage setting mechanisms and practices.
While it may be premature to derive firm conclusions about the general direction and the overall significance of these diverse changes, it appears that at least the wage deceleration is primarily a short-run response to the decline in inflationary expectations and the severe labour market conditions. Similarly, many of the related developments, such as the emergence of two-tier wage systems, freezes and cuts in nominal wages, lump-sum payments in lieu of wage rate increases, the decline in the relative importance of COLA clauses, back-loading, and the growing emphasis on decentralized bargaining, reflect attempts by employers to improve their cost competitiveness and to regain flexibility for better adaptation and adjustment to external change.
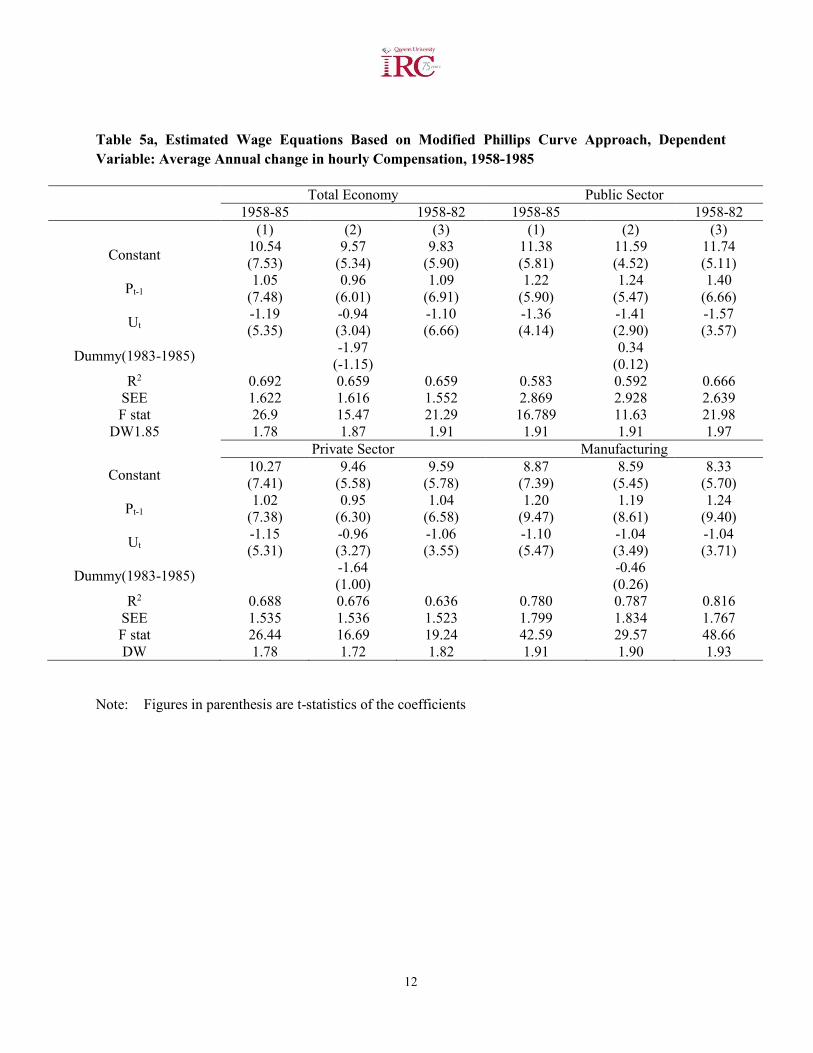
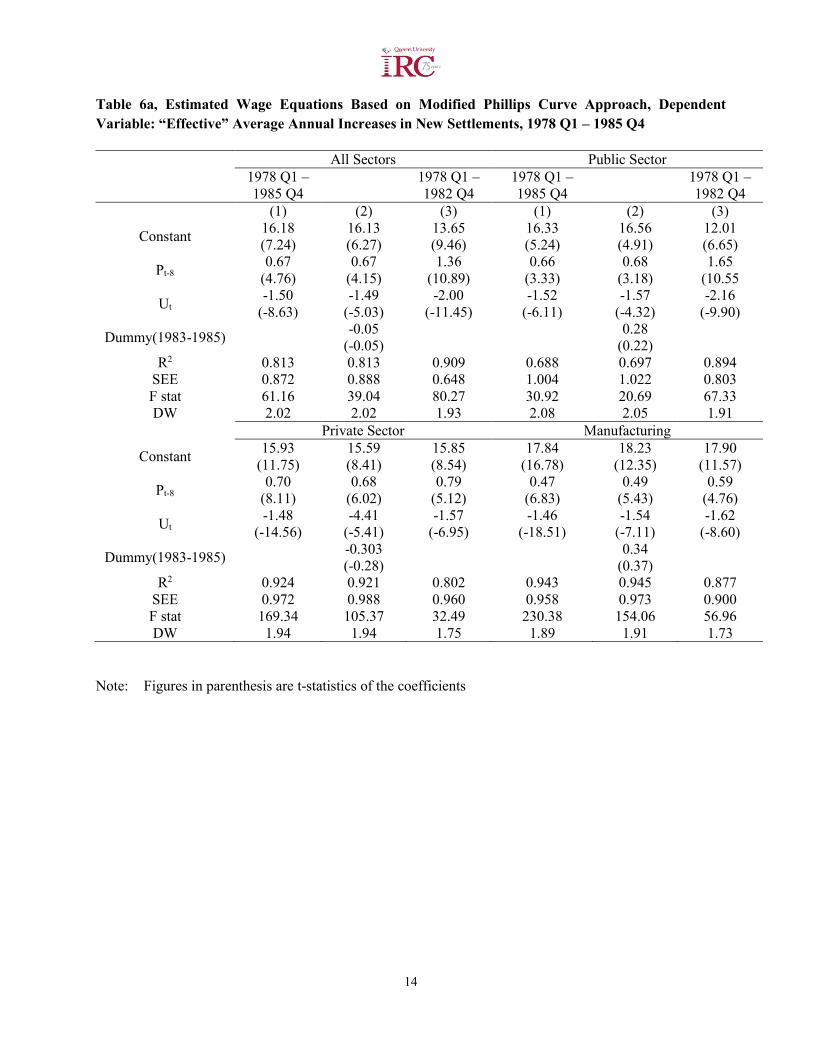
The Phillips Curve approach provides the simplest framework for evaluating the significance of the recent decline in wage inflation.viii Using this approach, wage changes can be explained by changes in inflationary expectations and labour market conditions. To assess the general validity of this approach, and to examine how well the Phillips Curve framework is able to account for the recent wage deceleration, a number of wage equations were estimated using various annual and quarterly wage series. The dependent variable in all equations was the average annual change in wages. The two explanatory variables were the lagged value of the average annual increase in the Consumer Price Index (a measure of inflation expectations) and the unemployment rate (a key indicator of labour market conditions). Estimates using average annual change in hourly compensation for the total economy, public and private sectors, and manufacturing and for average weekly earnings and negotiated average annual increases in "base rates" in new settlements for the sample period 1958-1985 are shown in Table 5a and 5b. Table 6a, 6b, and 6c presents estimates of wage equations using quarterly "effective" base rate adjustments in new settlements for a number of industrial sectors, contract status groups, and for Ontario and British Columbia. Estimated wage equations clearly indicate a very high degree of responsiveness of wages to inflation expectations and labour market conditions. The coefficients of the explanatory variables suggest that nominal wage changes respond positively to changes in consumer prices and negatively to unemployment.
There are three ways in which wage equations based on the Phillips Curve approach can be used to examine whether wage responsiveness has changed in the recent period. First, wage equations can be re-estimated with a dummy variable added as an additional explanatory variable taking the value of one for the years 1983-85 and zero otherwise. The statistical significance of the estimated coefficient of the dummy variable would indicate if there has been a change in the wage determination process over the period 1983-85. A second alternative is to estimate wage equations for the sample period ending 1982. The estimates of these equations can then be used to calculate simulated wage increases for the period 1983-85. A comparison of these simulations with actual increases would show whether the recent wage deceleration has been solely on account of high unemployment and low inflation or due to some other factors. A third and final test would involve estimating two sets of equations, one for the sample period

5
ending 1982 and the other for the complete period including the recent years 1983-85. A statistical test can be performed to test the equality of the estimated coefficients in the two sets of equations. Equality of the coefficients would suggest no significant change in wage responsiveness. Inequality would confirm that there has been a change.
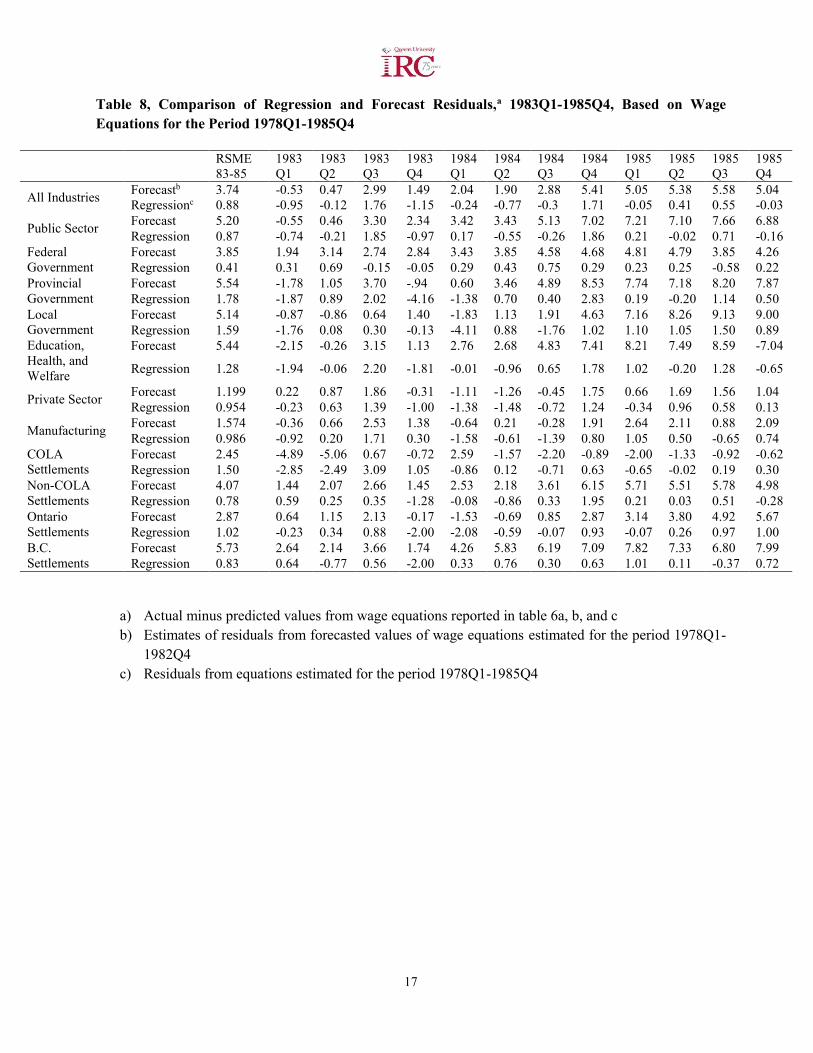
The experiment with the dummy variable (reported in tables 5 and 6) provided no evidence of any structural change in the wage determination process.ix In all wage equations, using both annual wage series and quarterly wage settlement data, the coefficient of the dummy variable was statistically insignificant: the only exceptions were the wage equations using effective base rate adjustments in COLA settlements and in the federal public service where the dummy was significant at the 90 percent probability level suggesting a possible structural break in the wage determination process or the presence of additional factors. Similarly, a comparison of actual and predicted increases based on estimated wage equations for the sample period ending 1982 (reported in tables 5 and 6) indicated that wage developments during 1983-85 can be explained by higher unemployment and low inflation in the Phillips Curve framework. In wage equations using annual data, predicted increases were generally higher for 1983 and slightly lower than the actual for 1984 and 1985. The pattern of prediction errors was somewhat different for quarterly effective wage settlement series: the predicted increases from all wage equations were lower than the actual with the exception of settlements with COLA clauses in which the actual were either the same or slightly higher than the predicted wage increases. We also performed a stability test of the equations using the ex post forecast errors (actual minus predicted wage increases), from the equations estimated for the period ending 1982, and the residuals from the equations estimated over the full sample period. A comparison of the root mean square errors from the two sets of equations revealed that while the two residuals were similar in equations using annual wage series (see Table 7), they differed markedly in the case of quarterly wage settlement series (see Table 8), suggesting a structural change in wage outcomes under collective bargaining. Our third test also produced the same results. Wage responsiveness to unemployment and inflation was unchanged in the two sample periods using annual wage series, 1958-82 and 1958-85. However wage outcomes in collective bargaining showed evidence of change in both the responsiveness to unemployment and to inflation; a comparison of the two sets of equations based on the sum of squares of residuals and differences in coefficient estimates,x indicated that wage settlements have become more res-ponsive to unemployment. In brief, our experiments suggest that (1) the recent wage deceleration in aggregate wage series is primarily a product of the steady decline in price inflation and the deterioration in labour market conditions;xi and (2) there is some evidence that wage outcomes in collective bargaining have become more responsive to economic conditions than before, reflecting unusually high unemployment rates during 1983-85.
The significance of the decline in inflation expectations and the persistence of high unemployment for recent wage deceleration was further evaluated by examining the predictive performance of wage equations in five large scale econometric forecasting models - the CANDIDE model of the Economic Council of Canada, the DRI (Data Resources Inc.) model, the Infometrica model (TIM), the RDX model of the Bank of Canada, and the MTFM model of the Conference Board of Canada. Although the individual specifications of the wage equation vary, all five models have a number of common features. Except for the Conference Board model in which wage changes are a weighted average of "nominal output growth, consumer prices and the change in the real interest rate", all models use unemployment and price inflation as the major determinants of wage inflation.xii In all five models elasticity of wages with respect to inflation expectations is unity or close to unity, implying that a percentage point change in

6
inflation leads to a one percentage point change in wages. The impact of unemployment on wages varies between -0.54 and -1.00. While the CANDIDE and Infometrica models use annual data, all others use quarterly series. The wage measure used is labour income per hour or per employed person in the CANDIDE, Infometrica, and DRI models, and the industry composite of average weekly earnings in MTFM and RDX models.
Table 9 presents predicted increases from each of the five models together with the actual increases in respective wage series. The differences between actual and predicted increases is also shown to evaluate how well the models have performed in tracking the wage deceleration. All five models appear to predict fairly well the sharp decline in wage inflation since 1982. Predicted increases account for 50 percent or more of the actual increases, suggesting that higher unemployment and lower price inflation have been the primary source of wage deceleration in the past four years. The pattern of prediction errors also indicates the presence of additional pressures on wage adjustments from the uneven labour market impact of recession and recovery.
IV. Conclusions and Policy Implications
The recent wage behaviour, marked by pronounced broad-based wage deceleration and innovative flexible pay systems, contrasts sharply with the inflationary wage-price spiral experienced in the 1970s and early 1980s. The decline in average rates of increase in wage settlements and other measures of compensation, the lowest in the past twenty-five years, has been dramatic. Similarly, although not as wide spread, nominal wage cuts and wage freezes, a decline in the relative importance of COLA clauses and deferred adjustments, back-loading of wage increases in multi-year contracts, and replacement of pattern bargaining by more organization-specific wage settlements have been exceptional collective bargaining responses to changes in economic conditions.
Do these changes represent a structural break in wage setting processes and mechanism, and more generally a change in the attitudes and behaviour of workers, unions and employers? The answer is yes and no. The evidence presented in this paper based on estimated wage equations using the simple Phillips Curve framework shows that the recent wage deceleration in aggregate wage series can be attributed largely to a sharp reduction in price inflation and the persistent slack in the labour market since 1982. This conclusion is further corroborated by the evaluation of wage predictions from the large scale econometric forecasting models. However, our empirical analysis of collective bargaining wage outcomes also indicates that wage settlements in recent years have become more responsive to labour market conditions demonstrating a heightened sense of realism and a willingness on the part of unions and management to compromise in adverse circumstances through wage and employment trade-offs.
It is clear that the recent wage deceleration and the many union and management initiatives towards wage flexibility are unusual developments. It is much less clear, however, what these developments mean for future labour market flexibility in the union sector and for macro-economic policy making. There is no doubt that many of the changes negotiated at the collective bargaining table and elsewhere are temporary and short-run, a product of the pronounced decline in inflationary expectations and the serious concern over job security in an environment of slow economic growth and persistent high rates of unemployment. Consequently, if there is a resurgence in inflation or if by some miracle the economic growth were to pick up, wage pressures would once again reappear with growing demands for catch-up for past losses in real

7
incomes and for relative wage adjustments. At the moment this is a most unlikely scenario in light of the consensus among economic forecasters that economic growth will remain weak and the unemployment level will remain high until at least the early 1990s. Indeed, there are many other reasons for continuing optimism on wage inflation and flexibility. Prominent among these are (a) marked sectoral and regional labour market imbalances, (b) growing international competition and increasing protectionism, (c) accelerated pace of technological change, (d) record high budget deficits of provincial and federal governments and (e) public policy initiatives on privatization, deregulation and freer trade. All of these changes in the external environment, because of their potential short-run adverse employment impacts, are creating added job security concerns on the part of workers and their organizations, and have strengthened management emphasis on wage and employment flexibility.
While there appears to be a greater awareness among both unions and management of the emerging difficult and uncertain environment and the consequent need for a change in adversarial attitudes and behaviour through better communication, more effective consultation and information sharing, there has been very little progress made towards long-term flexibility. For example, unions remain adamantly opposed to profit sharing or gain sharing plans. Changes in work rules and work methods to enhance mobility and to improve long-term trend productivity growth have been infrequent. Nor has there been much attention paid to training and retraining needs for better adaptation and adjustment to new technology and shifting markets. In brief, much of the collective bargaining response appears to be ad hoc and temporary, a part of the short-run survival strategy rather than an attempt at reassessing the overall compensation and employment systems required for an enduring increase in work flexibility.
It is apparent that for the recent wage responsiveness and flexibility to endure, not only would the unions and employers have to show a greater sense of adventure, but the role of public policy in bringing about the change would have to increase. Government action may be required to promote flexible pay systems (e.g. more favourable treatment of profit sharing along the lines of the February 1984 federal budget proposal), appropriate level of information disclosure, universal consultative mechanisms similar to the existing statutory occupational health and safety committees, and to provide incentives for employer sponsored training and retraining. Most importantly, economic policies to stimulate employment growth are desired to ensure job security — a key prerequisite for encouraging innovation and change.

8
Table 1, Average Annual Rate of Increase in Various Measures of Compensation, 1958- 1985
Year
Average Hourly Compensation Average Weekly Earnings Average Base Rage
Changes
Consumer Price Index
Unemployment Rate Total
Economy Public Sector
Private Sector
Manufac-turing
Constr-uction
Industry Composite
Manufac-turing
Constr-uction
1958 4.7 4.2 4.7 5.1 0.1 3.6 3.4 1.3 4.0 2.7 7.0
1959 3.4 0.0 3.8 3.8 3.0 4.3 4.7 2.2 4.2 1.3 6.0
1960 4.8 0.2 5.8 5.3 7.8 3.2 3.1 5.6 4.6 1.3 7.0
1961 4.2 5.9 3.8 2.6 7.5 3.3 3.4 0.0 3.5 1.0 7.1
1962 3.6 4.9 3.0 3.0 -1.0 2.9 3.0 2.8 3.7 1.0 5.9
1963 4.4 4.7 4.3 3.6 3.2 3.4 3.5 4.7 3.3 1.9 5.5
1964 5.0 5.1 5.0 3.8 2.9 3.9 4.0 5.2 4.9 1.8 4.7
1965 6.9 6.9 6.9 5.0 8.2 5.2 4.8 8.3 5.6 2.4 3.9
1966 10.0 12.0 9.6 7.8 11.9 5.8 5.6 12.1 8.0 3.5 3.4
1967 7.9 7.1 7.9 7.7 11.1 6.7 6.4 9.1 8.3 3.7 3.8
1968 8.6 11.5 7.8 7.3 4.9 6.9 7.4 5.2 7.9 4.1 4.5
1969 8.9 10.7 8.4 7.5 11.5 7.2 7.5 9.2 7.7 4.5 4.4
1970 8.0 6.8 8.1 7.6 10.2 7.6 8.1 11.0 8.5 3.3 5.7
1971 8.6 10.2 8.2 7.6 15.7 8.6 8.4 13.1 7.8 2.9 6.2
1972 8.5 9.0 8.4 7.2 5.9 8.4 8.4 11.5 7.7 4.7 6.2
1973 11.1 11.1 11.1 10.2 15.2 7.5 7.3 7.4 7.8 7.7 5.5
1974 15.1 18.0 14.2 15.8 16.0 11.0 10.8 11.0 13.1 10.9 5.3
1975 15.3 16.0 14.8 14.2 20.5 14.2 15.0 16.2 17.4 10.8 6.9
1976 15.6 17.6 14.9 15.0 7.4 12.1 13.0 13.8 10.4 7.5 7.1
1977 10.0 12.8 9.0 11.2 8.7 9.6 10.3 11.7 7.6 8.0 8.1
1978 6.0 7.0 5.6 6.7 2.3 6.2 7.4 5.3 6.9 9.0 8.3
1979 9.1 10.8 8.7 10.8 0.0 8.7 8.9 8.5 8.0 9.0 7.4
1980 11.1 12.2 10.6 10.4 10.2 10.1 10.0 9.2 8.3 10.2 7.5
1981 13.2 12.7 13.3 16.0 14.8 11.8 11.9 12.9 12.2 12.5 7.5
1982 11.4 11.7 11.1 10.3 8.9 10.1 10.8 7.3 9.7 10.8 11.0
1983 5.1 3.1 5.5 6.8 4.2 7.2 6.8 7.7 4.1 5.8 11.9
1984 3.4 5.6 2.8 2.1 -2.4 5.5 6.3 1.0 3.2 4.4 11.3
1985 4.0 6.0 3.7 5.1 6.0 3.5 4.9 2.8 3.2 4.0 10.5
Source: Statistics Canada and Labour Canada (various publications and unpublished estimates)

9
Table 2, Average Annual Rates of Increase in Average Weekly Earnings by Province, 1958-1985
Year Nfld P.E.I. N.S. N.B. Que. Ont. Man. Sask. Alta. B.C. 1958 0.0 0.3 3.4 1.6 3.7 4.0 5.0 4.3 4.2 2.7 1959 2.7 6.2 3.1 3.8 4.5 4.2 4.8 2.9 3.2 5.7 1960 9.6 4.8 4.2 3.6 3.1 3.3 2.3 2.8 3.1 3.7 1961 5.4 3.1 2.0 4.6 3.3 3.6 2.6 2.8 4.6 2.6 1962 2.0 1.9 2.7 3.1 2.9 3.4 2.7 3.6 0.9 2.5 1963 3.3 4.9 4.0 4.1 3.1 3.5 2.6 2.8 3.2 3.4 1964 3.4 3.0 3.1 4.0 4.2 4.3 1.9 2.5 2.6 4.5 1965 3.6 3.3 4.7 5.3 5.1 4.9 4.1 4.5 4.7 7.0 1966 5.6 2.7 4.9 6.0 5.3 7.0 2.6 5.0 5.6 6.7 1967 7.4 10.0 7.3 7.6 6.5 6.7 8.9 7.5 6.3 6.6 1968 9.1 2.6 6.7 5.0 7.2 6.7 9.3 6.6 7.1 5.5 1969 6.9 11.7 7.2 8.1 7.1 5.9 7.2 5.7 9.2 7.1 1970 11.0 3.6 10.3 7.4 8.2 7.1 7.6 6.5 8.6 6.7 1971 5.2 7.3 8.3 9.0 8.8 7.9 6.9 5.9 8.3 10.5 1972 8.7 12.3 9.2 10.4 8.3 8.2 9.5 9.4 8.0 8.2 1973 10.8 10.0 9.1 7.1 6.9 8.0 6.8 6.8 7.5 8.2 1974 13.0 14.2 11.6 15.4 9.6 12.0 12.4 13.1 10.9 12.5 1975 16.5 18.0 14.9 18.0 12.9 15.2 14.4 17.0 16.0 14.7 1976 12.8 14.0 12.1 11.1 11.7 11.6 12.1 14.1 14.2 12.8 1977 9.4 9.9 9.8 10.3 9.1 10.1 8.5 8.6 10.6 9.5 1978 2.4 4.8 5.5 4.3 5.8 7.4 5.9 6.3 5.5 6.0 1979 9.4 6.6 9.6 12.0 8.2 8.1 8.1 10.1 11.0 8.6 1980 6.4 9.7 8.4 8.5 9.1 11.0 9.3 10.1 11.5 11.1 1981 13.6 8.7 11.4 10.2 11.7 11.5 11.0 10.9 14.2 12.0 1982 10.3 11.4 11.4 9.1 9.8 9.8 10.3 11.0 11.5 9.4 1983 6.1 6.0 6.3 8.0 7.8 6.6 8.6 7.3 7.2 7.1 1984 5.1 15.0 6.2 6.1 5.8 5.9 6.3 5.2 4.1 3.1 1985 0.6 2.3 2.8 2.6 4.5 3.2 2.0 3.8 2.2 2.6
Source: Statistics Canada, Employment Earning and Hours, various issues.
10
Table 3, Effective Wage Rate Adjustments* in New Settlements, Canada 1978-1985 Average Annual Increase Over the Life of Contract 1978 1979 1980 1981 1982 1983 1984 1985
All Agreements 7.6 9.8 11.1 13.0 10.2 4.7 3.6 3.5 With COLA 9.7 11.5 11.1 12.3 10.9 2.7 4.1 3.5 Without COLA 7.2 8.8 11.1 13.3 9.9 5.5 3.5 3.6 one-year agreement 7.2 8.9 10.7 13.7 10.2 5.7 3.8 4.4 two-year agreement 7.8 9.4 11.8 12.9 10.3 5.4 2.7 3.5 three-year agreement 9.3 11.0 10.6 12.1 9.9 1.9 3.5 2.9
By Industry
Primary 8.2 12.5 13.4 12.2 7.7 5.1 3.2 3.9 Manufacturing 8.8 10.5 11.6 12.5 8.9 5.5 4.0 4.3 Transportation, etc. 7.5 11.0 11.6 13.0 10.8 5.6 4.1 3.4 Construction n.a. n.a. n.a. n.a. n.a. 5.8 1.9 1.0 Trade, Finance, etc. 9.9 10.9 11.8 13.9 10.8 5.4 3.7 3.1 Services 6.8 8.2 10.8 13.6 11.2 3.5 3.2 3.2 Public Administration 7.1 8.7 10.9 12.5 9.8 5.2 4.7 4.1
By Sector
Private Sector 8.7 10.8 11.6 12.7 9.5 5.3 3.2 3.3 Public Sector 7.1 9.2 10.9 13.2 10.4 4.5 3.9 3.7
Federal 7.2 8.4 11.3 12.7 8.3 5.4 5.0 3.2 Crown Corporations 6.4 12.4 11.1 12.7 10.7 5.6 4.5 3.8
Provincial 7.8 9.1 11.3 13.5 11.1 4.9 5.2 4.0 Local 7.3 9.4 10.8 12.8 11.9 5.7 3.4 4.6 Education, Health and
Welfare 6.8 8.2 10.8 13.5 11.4 3.5 3.1 3.3
By Jurisdiction
Newfoundland 7.1 7.4 11.9 11.8 11.9 4.7 2.3 2.3 Prince Edward Island 9.2 9.4 11.1 14.2 12.0 2.1 4.2 4.5 Nova Scotia 8.3 9.7 11.6 13.6 10.2 7.2 4.5 5.2 New Brunswick 9.5 8.4 11.5 15.5 12.1 7.3 2.5 2.6 Quebec 9.6 11.3 10.7 12.3 9.4 2.1 2.6 3.9 Ontario 7.5 8.9 10.6 12.3 10.0 6.1 4.5 4.9 Manitoba 6.4 8.9 10.6 14.3 11.8 8.8 3.7 2.8 Saskatchewan 7.6 10.0 12.2 12.4 14.7 6.5 3.6 2.1 Alberta 7.7 8.7 11.2 14.3 12.4 6.9 1.2 1.8 British Columbia 6.9 9.7 13.2 14.5 7.9 3.0 2.4 1.7
Total Provincial 7.8 9.5 11.1 13.1 10.6 4.4 3.3 3.7 Total Federal 7.2 10.5 11.2 12.6 9.6 5.5 4.6 3.1 Public Service 7.2 8.4 11.3 12.7 8.3 5.4 5.0 3.2 Others 7.2 12.0 10.9 12.4 10.7 5.6 4.5 3.1
Source: Labour Canada
* Negotiating wage increases plus cost-of-living allowance (COLA) payments.

11
Table 4 Comparison of Recent Settlements to Previous Settlements by Selected Industry
Bargaining Units Workers (dates of settlement) Covered
Average Effective Increase in Base Rates 1984-85 Settlement Previous Settlement
Life of Contract
1st Year
Life of Contract 1st Year
B.C. Forest & Wood Products Industry
(Jan. 1984) Pulp & Paper Mills British
Columbia (June 1984) Ontario & Quebec (Sept. - Oct. 1984)
32,000
9,000
25,000
2.8
2.8
3.6-4.3
0.0
0.0
2.5-3.7
14.0
14.0
8.9-12.2
15.0
15.0
8.3-13.4
Atlantic Provinces 2,500 3.8 2.5 11.0 12.0 (Dec. 1984 - Jan. 1985)
Steel Companies 22,000 4.4-4.8 2.2-3.2 10.3-12.2 19.4-22.7 (April-May 1984)
Mining Companies 24,500 0-4.7 0-3.9 0.0-16.3 0.0-17.5 (June-Sept. 1984)
Meat Packing 8,000 0.00 0.00 9.8-12.4 11.1-13.2 (Aug.-Sept. 1984)
Supermarkets 40,000 1.6-6.0 0.0-6.7 5.1-12.0 5.1-12.0 (Sept.-Nov. 1984)
Auto Manufacturers 46,000 4.3-5.2 4.4-5.9 3.7-5.8 3.2-5.8 (Oct.-Nov. 1984)
Printing 4,500 5.0-6.1 4.0-6.1 6.5-12.5 6.5-13.0 (May-June 1984)
*Railways (1983-84) 78,000 5.0-6.0 5.0-6.0 12.8 12.8
Hydro British Columbia 7,000 1.5 0.0 8.0-13.8 11.1-14.7 (Jan.-March 1984) Saskatchewan 2,500 2.4-2.5 1.2-2.0 11.5-12.3 12.0-12.7 (Feb.-June 1984) Manitoba (May 1984) 2,000 3.6 3.6 7.3-11.4 7.3-11.4 *Ontario (Aug.1984) 16,000 4.5-5.2 4.5-7.0 12.8 12.8 New Brunswick 1,400 3.3 0.0 9.8-15.00 15.1-23.3 (Jan.1985)
Urban Transit Edmonton (May 1984) 1,500 0.0 0.0 14.3 15.0 Winnipeg (Sept. 1984) 1,250 3.0 3.0 11.7 13.0 Montreal (Nov. 1984) 4,100 3.8 3.6 6.4 7.0 Calgary (Oct. 1984) 1,200 0.0 0.0 15.8 18.3 Ottawa (March 1984) 1,600 3.5 4.3 8.4 6.0 *Toronto (1984-85) 7,500 5.0 5.0 12.4 11.1 Vancouver (March 1985) 2,600 2.0 3.0 12.9 11.1
Bell Canada 21,000 0.0 0.0 11.0 12.0 (March 1985)
Canada Post (1983-84) 59,000 5.0-6.0 5.0-6.0 12.8-17.8 12.6-16.6
Source: Labour Canada.
* Legislated settlement under the Income Restraint Program.
12
Table 5a, Estimated Wage Equations Based on Modified Phillips Curve Approach, Dependent Variable: Average Annual change in hourly Compensation, 1958-1985
Total Economy Public Sector 1958-85 1958-82 1958-85 1958-82 (1) (2) (3) (1) (2) (3)
Constant 10.54 (7.53)
9.57 (5.34)
9.83 (5.90)
11.38 (5.81)
11.59 (4.52)
11.74 (5.11)
Pt-1 1.05
(7.48) 0.96
(6.01) 1.09
(6.91) 1.22
(5.90) 1.24
(5.47) 1.40
(6.66)
Ut -1.19 (5.35)
-0.94 (3.04)
-1.10 (6.66)
-1.36 (4.14)
-1.41 (2.90)
-1.57 (3.57)
Dummy(1983-1985) -1.97 (-1.15) 0.34
(0.12)
R2 0.692 0.659 0.659 0.583 0.592 0.666 SEE 1.622 1.616 1.552 2.869 2.928 2.639 F stat 26.9 15.47 21.29 16.789 11.63 21.98
DW1.85 1.78 1.87 1.91 1.91 1.91 1.97 Private Sector Manufacturing
Constant 10.27 (7.41)
9.46 (5.58)
9.59 (5.78)
8.87 (7.39)
8.59 (5.45)
8.33 (5.70)
Pt-1 1.02
(7.38) 0.95
(6.30) 1.04
(6.58) 1.20
(9.47) 1.19
(8.61) 1.24
(9.40)
Ut -1.15 (5.31)
-0.96 (3.27)
-1.06 (3.55)
-1.10 (5.47)
-1.04 (3.49)
-1.04 (3.71)
Dummy(1983-1985) -1.64 (1.00) -0.46
(0.26)
R2 0.688 0.676 0.636 0.780 0.787 0.816 SEE 1.535 1.536 1.523 1.799 1.834 1.767 F stat 26.44 16.69 19.24 42.59 29.57 48.66 DW 1.78 1.72 1.82 1.91 1.90 1.93
Note: Figures in parenthesis are t-statistics of the coefficients

13
Table 5b, Estimated Wage Equations Based on Modified Phillips Curve Approach, Dependent Variable: Average Annual Change in Average Hourly Weekly Earnings and Base Rates, 1958-85.
Total Economy Public Sector 1958-85 1958-82 1958-85 1958-82 (1) (2) (3) (1) (2) (3)
Constant 6.69 (5.85)
6.27 (4.59)
6.46 (4.71)
6.21 (5.10)
5.50 (3.64)
5.79 (4.22)
Pt-1 0.87
(7.72) 0.84
(6.86) 0.89
(6.82) 0.88
(7.32) 0.80
(5.97) 0.93
(7.08)
Ut -0.63 (3.58)
0.54 (2.26)
-0.61 (2.51)
-0.53 (2.83)
-0.35 (1.37)
-0.51 (2.12)
Dummy(1983-1985) -0.82 (0.61) -1.47
(1.05)
R2 0.682 0.673 0.657 0.655 0.611 0.676 SEE 1.234 1.249 1.239 1.035 1.304 1.205 F stat 25.78 16.48 21.04 22.80 12.54 22.90
DW1.85 1.93 1.93 1.90 1.94 1.94 1.92 Construction Base Rates in New Settlements
Constant 11.24 (5.24)
12.21 (4.50)
11.97 (4.19)
9.63 (7.14)
8.67 (5.03)
8.93 (5.36)
Pt-1 1.02
(4.60) 1.07
(4.45) 1.02
(3.83) 0.95
(6.93) 8.67
(5.03) 8.93
(5.36)
Ut -1.33 (3.80)
-1.54 (3.08)
-1.46 (2.74)
-1.10 (5.09)
-0.89 (2.90)
-1.02 (3.36)
Dummy(1983-1985) 1.74 (0.60) -1.66
(-0.96)
R2 0.464 0.471 0.361 0.569 0.639 0.617 SEE 2.804 2.841 2.927 1.636 1.642 1.590 F stat 10.38 7.11 6.21 23.23 14.15 17.75 DW 1.86 1.85 1.81 1.93 1.92 2.01
Note: Figures in parenthesis are t-statistics of the coefficients
14
Table 6a, Estimated Wage Equations Based on Modified Phillips Curve Approach, Dependent Variable: “Effective” Average Annual Increases in New Settlements, 1978 Q1 – 1985 Q4
All Sectors Public Sector
1978 Q1 – 1985 Q4 1978 Q1 –
1982 Q4 1978 Q1 – 1985 Q4 1978 Q1 –
1982 Q4 (1) (2) (3) (1) (2) (3)
Constant 16.18 (7.24)
16.13 (6.27)
13.65 (9.46)
16.33 (5.24)
16.56 (4.91)
12.01 (6.65)
Pt-8 0.67
(4.76) 0.67
(4.15) 1.36
(10.89) 0.66
(3.33) 0.68
(3.18) 1.65
(10.55
Ut -1.50
(-8.63) -1.49
(-5.03) -2.00
(-11.45) -1.52
(-6.11) -1.57
(-4.32) -2.16
(-9.90)
Dummy(1983-1985) -0.05 (-0.05) 0.28
(0.22)
R2 0.813 0.813 0.909 0.688 0.697 0.894 SEE 0.872 0.888 0.648 1.004 1.022 0.803 F stat 61.16 39.04 80.27 30.92 20.69 67.33 DW 2.02 2.02 1.93 2.08 2.05 1.91
Private Sector Manufacturing
Constant 15.93 (11.75)
15.59 (8.41)
15.85 (8.54)
17.84 (16.78)
18.23 (12.35)
17.90 (11.57)
Pt-8 0.70
(8.11) 0.68
(6.02) 0.79
(5.12) 0.47
(6.83) 0.49
(5.43) 0.59
(4.76)
Ut -1.48
(-14.56) -4.41
(-5.41) -1.57
(-6.95) -1.46
(-18.51) -1.54
(-7.11) -1.62
(-8.60)
Dummy(1983-1985) -0.303 (-0.28) 0.34
(0.37)
R2 0.924 0.921 0.802 0.943 0.945 0.877 SEE 0.972 0.988 0.960 0.958 0.973 0.900 F stat 169.34 105.37 32.49 230.38 154.06 56.96 DW 1.94 1.94 1.75 1.89 1.91 1.73
Note: Figures in parenthesis are t-statistics of the coefficients

15
Table 6b, Estimated Wage Equations Based on Modified Phillips Curve Approach, Dependent Variable: “Effective” Average Annual change in Base Rates in New Settlements, 1978 Q1 – 1985 Q4
All Sectors Public Sector
1978 Q1 – 1985 Q4 1978 Q1 –
1982 Q4 1978 Q1 – 1985 Q4 1978 Q1 –
1982 Q4 (1) (2) (3) (1) (2) (3)
Constant 20.87 (13.13)
18.26 (8.61)
16.86 (9.04)
13.82 (4.49)
15.17 (4.87)
11.95 (5.74)
Pt-8 0.43
(4.25) 0.28
(2.18) 0.50
(3.23) 0.76
(3.83) 0.85
(4.30) 1.64
(8.62)
Ut -1.75
(-14.74) -1.23
(-4.05) -1.31
(-5.80) -1.34
(-5.36) -1.63
(-4.99) -2.15
(-8.67)
Dummy(1983-1985) -2.36 (-1.82) 1.38
(1.28)
R2 0.906 0.912 0.723 0.666 0.707 0.840 SEE 1.281 1.232 0.960 0.893 0.885 0.778 F stat 134.70 93.25 80.87 27.95 21.71 41.86 DW 2.04 1.99 2.04 2.05 2.00 1.96
British Columbia Settlements Ontario Settlements
Constant 15.95 (5.03)
19.21 (4.17)
16.21 (5.27)
12.90 (6.00)
11.44 (3.39)
10.89 (5.70)
Pt-8 0.42
(1.87) 0.46
(2.10) 1.15
(3.55) 0.73
(4.92) 0.64
(3.11) 1.25
(8.31)
Ut -1.16
(-5.94) -1.40
(-4.45) -2.04
(-5.17) -1.40
(-5.94) -1.18
(-2.75) -1.80
(-6.34)
Dummy(1983-1985) -1.84 (-0.95) 0.76
(0.57)
R2 0.640 0.670 0.572 0.653 0.628 0.837 SEE 1.566 1.570 1.729 1.105 1.118 0.959 F stat 24.87 18.29 10.67 26.36 15.19 41.13 DW 2.15 2.17 1.99 2.06 2.06 1.89
Note: Figures in parenthesis are t- statistics of the coeffcients

16
Table 7, Comparison of Regression and Forecast Residuals,a 1983-1985, Based on Wage Equations for the Period 1958-1985.
RMSE 1983-85
1983 1984 1985
Hourly Compensation Total Economy Forecastb 2.156 -3.44 1.04 1.05
Regressionc 1.953 -2.96 1.09 1.22 Public Forecast 3.624 -5.04 2.48 2.80
Regression 4.001 -5.31 3.12 3.20 Private Forecast 1.721 -2.79 0.28 1.01
Regression 1.537 -2.34 0.44 1.19 Manufacturing Forecast 2.161 -2.49 -1.60 2.29
Regression 1.925 -1.81 -1.11 2.63 Weekly Earnings Industrial Composite Forecast 1.218 -1.25 -1.50 0.80
Regression 1.160 -1.14 1.48 -0.74 Manufacturing Forecast 1.614 -2.47 1.31 0.05
Regression 1.799 -2.32 2.08 0.01 Construction Forecast 1.837 2.46 -0.93 1.79
Regression 1.509 1.76 -1.42 1.31 Base Rate Increases In New Settlements Forecast 2.048 -3.24 1.31 0.61
Regression 1.838 -2.78 1.33 0.80
a - actual minus predicted values from wage equations reported in table 5a and 5b
b - estimates of residuals from forecasted values of wage equations estimated for the period of 1958-1982
c - residuals from equations estimated for the period of 1958-1985
17
Table 8, Comparison of Regression and Forecast Residuals,a 1983Q1-1985Q4, Based on Wage Equations for the Period 1978Q1-1985Q4
RSME 83-85
1983 Q1
1983 Q2
1983 Q3
1983 Q4
1984 Q1
1984 Q2
1984 Q3
1984 Q4
1985 Q1
1985 Q2
1985 Q3
1985 Q4
All Industries Forecastb 3.74 -0.53 0.47 2.99 1.49 2.04 1.90 2.88 5.41 5.05 5.38 5.58 5.04 Regressionc 0.88 -0.95 -0.12 1.76 -1.15 -0.24 -0.77 -0.3 1.71 -0.05 0.41 0.55 -0.03
Public Sector Forecast 5.20 -0.55 0.46 3.30 2.34 3.42 3.43 5.13 7.02 7.21 7.10 7.66 6.88 Regression 0.87 -0.74 -0.21 1.85 -0.97 0.17 -0.55 -0.26 1.86 0.21 -0.02 0.71 -0.16
Federal Government
Forecast 3.85 1.94 3.14 2.74 2.84 3.43 3.85 4.58 4.68 4.81 4.79 3.85 4.26 Regression 0.41 0.31 0.69 -0.15 -0.05 0.29 0.43 0.75 0.29 0.23 0.25 -0.58 0.22
Provincial Government
Forecast 5.54 -1.78 1.05 3.70 -.94 0.60 3.46 4.89 8.53 7.74 7.18 8.20 7.87 Regression 1.78 -1.87 0.89 2.02 -4.16 -1.38 0.70 0.40 2.83 0.19 -0.20 1.14 0.50
Local Government
Forecast 5.14 -0.87 -0.86 0.64 1.40 -1.83 1.13 1.91 4.63 7.16 8.26 9.13 9.00 Regression 1.59 -1.76 0.08 0.30 -0.13 -4.11 0.88 -1.76 1.02 1.10 1.05 1.50 0.89
Education, Health, and Welfare
Forecast 5.44 -2.15 -0.26 3.15 1.13 2.76 2.68 4.83 7.41 8.21 7.49 8.59 -7.04
Regression 1.28 -1.94 -0.06 2.20 -1.81 -0.01 -0.96 0.65 1.78 1.02 -0.20 1.28 -0.65
Private Sector Forecast 1.199 0.22 0.87 1.86 -0.31 -1.11 -1.26 -0.45 1.75 0.66 1.69 1.56 1.04 Regression 0.954 -0.23 0.63 1.39 -1.00 -1.38 -1.48 -0.72 1.24 -0.34 0.96 0.58 0.13
Manufacturing Forecast 1.574 -0.36 0.66 2.53 1.38 -0.64 0.21 -0.28 1.91 2.64 2.11 0.88 2.09 Regression 0.986 -0.92 0.20 1.71 0.30 -1.58 -0.61 -1.39 0.80 1.05 0.50 -0.65 0.74
COLA Settlements
Forecast 2.45 -4.89 -5.06 0.67 -0.72 2.59 -1.57 -2.20 -0.89 -2.00 -1.33 -0.92 -0.62 Regression 1.50 -2.85 -2.49 3.09 1.05 -0.86 0.12 -0.71 0.63 -0.65 -0.02 0.19 0.30
Non-COLA Settlements
Forecast 4.07 1.44 2.07 2.66 1.45 2.53 2.18 3.61 6.15 5.71 5.51 5.78 4.98 Regression 0.78 0.59 0.25 0.35 -1.28 -0.08 -0.86 0.33 1.95 0.21 0.03 0.51 -0.28
Ontario Settlements
Forecast 2.87 0.64 1.15 2.13 -0.17 -1.53 -0.69 0.85 2.87 3.14 3.80 4.92 5.67 Regression 1.02 -0.23 0.34 0.88 -2.00 -2.08 -0.59 -0.07 0.93 -0.07 0.26 0.97 1.00
B.C. Settlements
Forecast 5.73 2.64 2.14 3.66 1.74 4.26 5.83 6.19 7.09 7.82 7.33 6.80 7.99 Regression 0.83 0.64 -0.77 0.56 -2.00 0.33 0.76 0.30 0.63 1.01 0.11 -0.37 0.72
a) Actual minus predicted values from wage equations reported in table 6a, b, and c b) Estimates of residuals from forecasted values of wage equations estimated for the period 1978Q1-
1982Q4 c) Residuals from equations estimated for the period 1978Q1-1985Q4

18
Table 9, Actual and Predicted Wage Increases from Forecasting Models
Year
Canidue Average hourly compensation
Conference Board Industry composite of average weekly earnings
DRI Labour income per employed person
RDX Industry composite of average weekly earnings
Infometrica Average annual earnings
Predicted Increase 1982 12.4 10.1 8.6 10.1 11.2 1983 9.1 63.7 6.8 7.0 8.1 1984 6.0 4.3 3.0 4.1 3.8 1985 4.9 3.5 2.9 3.4 1.5
Actual Increase 1982 12.6 10.1 10.6 10.1 10.7 1983 4.9 7.2 4.6 7.2 4.6 1984 3.4 5.5 3.5 5.5 3.5 1985 4.0 3.5 4.1 3.5 4.1
Residual 1982 0.2 0.0 2.0 0.0 -0.5 1983 -4.2 0.5 -2.2 0.2 -3.5 1984 -2.6 1.2 0.5 1.4 -0.3 1985 -0.9 0.0 1.2 0.1 2.7
Source: Obtained from the research staff of forecasting agencies.

19
References Coe, David T., and Francesco Gagliardi, Nominal Wage Determination In Ten OECD
Countries, OECD Working Papers No.19, 1985.
Conference Board of Canada, Industrial Relations 1986: Outlook and Issues, (Preen Benimadhu, ed.), Report 05-86, Ottawa, The Conference Board, 1986.
Conference Board of Canada, Compensation Planning Outlook, mimeograph, Ottawa, The Conference Board, annual.
Craig, Alton, W.J. The System of Industrial Relations in Canada, 2nd Ed., Scarborough, Ontario, Prentice Hall Inc, 1986, pp. 170-171.
Davies, Robert J., "The Structure of Collective Bargaining in Canada" in Canadian Labour Relations, (Research Coordinator - W. Craig Riddell) Toronto, University of Toronto Press, 1986.
Finance Canada, Economic Review, Ottawa, Supply and Services Canada, 1985.
Flanagan, Robert J. "Wage Concessions and Long-Term Union Wage Flexibility", Brookings Paper on Economic Activity, 1:1984, pp. 183-221.
Freedman, Audrey, The New Look In Wage Policy and Employee Relations, The Conference Board Report No. 865, New York, The Conference Board, 1985.
Grady Economics and Associates, The State of the Art in Canadian Macroeconomic Modelling, Canada, Department of Finance, March 1985.
Kmenta, Jan, Elements of Econometrics, New York, MacMillian, 1971.
Kochan, Thomas A., Challenges and Choices Facing American Labor, Cambridge, Mass., MIT Press, 1985.
Kumar, Pradeep, Mary Lou Coates, and David Arrowshith, The Current Industrial Relations Scene in Canada, 1986, Kingston, Industrial Relations Centre, Queens University, 1986.
Labour Canada, Provisions In Major Collective Agreements in Canada Covering 500 and More Employees, Ottawa, Supplies and Services Canada, 1985.
Mitchell, Daniel, "Shifting Norms in Wage Determination" Brookings Paper On Economic Activity, 2:1985 pp. 575-608.
OECD, The OECD Observer, No.138, Paris, OECD, 1986. OEDC, OECD Economic Outlook, 38, December, 1985.
Stewart, Mark B. and Kenneth F. Wallis, Introductory Econometrics, 2nd Edition, Oxford, Basil Blackwell, 1981.

20
Voyer, Jean-Pierre, Recent Trends in Wages: Is the Slowdown Purely Cyclical, National Union of Provincial Public Employees, Ottawa, mimeographed, 1985.
Wilton, David A., "Public Sector Wage Compensation" in Canadian Labour Relations, (Research Coordinator - W. Craig Riddell), Toronto, University of Toronto Press, 1985.
Wood, W.D. and Pradeep Kumar, The Current Industrial Scene in Canada, 1985, Kingston, Industrial Relations Centre, Queens University, 1985.
Wood, W.D. and Pradeep Kumar, The Current Industrial Scene in Canada, 1984, Kingston, Industrial Relations Centre, Queen's University, 1984.
i See for example the Conference Board of Canada (1986, pp. 13-16), and Voyer, (1985). The discussion on whether the process of wage determination has changed in recent years and whether there is evidence of innovation in wage bargaining is not limited to Canada. A voluminous literature is emerging on this question in the United States and in European countries (See Freedman, 1985; Mitchell, 1985; Kochan 1985; Coe and Gagliardi, 1985, and Flanagan, 1984).
ii There may be many reasons for a faster wage response to economic conditions in the U.S. First, the downward trend in inflation started much earlier in the U.S. than in Canada. Inflation rates in Canada peaked in the third quarter of 1981 and did not show any pronounced deceleration until the last quarter of 1982. In the U.S. on the other hand, inflation peaked in the first half of 1980 and had declined almost 8 1/2 percentage points to 5.8 percent in the third quarter of 1981 when the recession began. Second, while the unemployment rate in the U.S. was rising in 1980 and 1981 it was fairly stable in Canada until the last quarter of 1981. A third factor is the more intense competitive pressures in the U.S. in several sectors of the economy and the deregulation of the airline and trucking industries starting in the latter part of the 1970s. Reflecting these pressures, the wage deceleration, including wage freezes and cuts, became widespread in the United States as early as 1981 and gained momentum in 1982 and 1983. See Mitchell (1985).
iii The U.S. Dept. of Labor figures show that the wage deceleration in the unionized sector was not only quicker but also more pronounced than in the non-union sector. For example the rate of increase in union wages peaked in 1980 and declined from 10.9 percent annually in 1980 to 3.1 percent in 1985. By comparison, non-union wages continued to accelerate until the end of 1981 and the rate of increase moderated from 8.5 percent in 1981 to 4.6 percent in 1985. Also Mitchell (1985) shows that actual union wage adjustments over the period 1980-84 have been much lower than expected given economic conditions in contrast to non-union wages. While there is no non-union wage series available in Canada, the Conference Board of Canada surveys indicate that wage increases in the union sector have been smaller than those for non-unionized workers.
iv An analysis of "effective" wage adjustments, including potential COLA payments, in individual major settlements covering 500 and more workers shows that increases were below the prevailing rate of increase in the CPI in more than half of the settlements concluding in 1983, 1984 and 1985. The below inflation rate adjustments were found in only 18 percent of all settlements negotiated in 1981 and in 49 percent of the agreements in 1982.
v An indication of this trend is the increase in relative dispersion in base rate adjustments in new settlements. The coefficient of variation (standard deviation divided by the mean) in negotiated base rate adjustments has gone up from

21
32 percent in 1981 to 64 percent in 1985. In effective annual wage adjustments in new settlements the coefficient of variation in 1985 was 55 percent compared with 22 percent in 1981.
vi For changes in bargaining structures between 1965 and 1982 see Davies (1986). For recent data see Craig (1986).
vii Since 1981, two-tier wage systems have been introduced in 50 major contracts, affecting over 40,000 workers; of the total, as many as 17 (27,000 workers) were negotiated in 1984 and 1985. Although two-tier provisions are largely concentrated in airlines and food stores, they have been spreading to manufacturing, services and utilities. Similarly lump-sum payments have been increasing in frequency. Lump-sum payments were a feature of 46 new settlements, affecting close to 92,000 workers in 1985, 28 settlements affecting 98,000 employees in 1984, 14 contracts in 1983 with 73,000 employees, and of 14 settlements covering 24,000 workers in 1982.
viii See Mitchell (1985) and Coe and Gagliardi (1985) for an application of Phillips Curve approach to an examination of changes in wage determination process.
ix Wilton (1986) arrives at the same conclusion in his examination of the possible effects of 6-5 program in 1982-83 on wage settlements.
x The hypothesis of structural change was tested using Fisher's F -distribution (Stewart and Wallis, 1981, pp. 200-201). The test statistic can be expressed as follows:
F1_ = (RSSc - RSS1)/m
RSS1/(n - k)
Where RSS1 and RSS, are the residual sum of squares from wage equations covering the period ending 1982 and the complete sample period to 1985 respectively. The number of observations to the period ending 1982 is denoted by n, m is the additional number of observations for the period 1982-85, and k is the number of explanatory variables.
For the wage equations using annual data for the period 1958-1985 all F-statistics were less than their critical value at the 95 per cent probability level, indicating a lack of evidence to suggest a structural change in wage setting behaviour during the recent period, 1983-85. For wage equations using quarterly wage settlement series test statistics provided support for the structural change hypothesis at the 95 per cent probability level for the aggregate unionized sector, settlements without a cost-of-living clause, and for public and semi-public sector settlements covering provincial-local governments, education and health and welfare.
Differences in coefficients of unemployment and inflation in wage equations covering the period ending 1982 and the complete sample period were tested by two methods. First, two interactive variables, products of each of unemployment and inflation and the dummy variable for the period 1983-85 were added as explanatory variables. The interactive variable for both inflation and unemployment was found to be statistically insignificant in wage equations using annual data for the period 1958-85. However, in wage equations using quarterly wage settlement series for the period 1978-1985, the interactive variable with inflation was found to be statistically significant at the 95 per cent probability level in 9 of the 12 equations (the three exceptions were settlements in British Columbia, the federal public service, and agreements with a COLA clause). The interactive variable with unemployment was found to be statistically significant for settlements in Ontario, British Columbia, and for settlements without a COLA clause.
The second test of coefficeint change involved calculating a t-statistic by dividing the difference in the value of the coefficients from two wage equations, one for the period ending 1982 and the other for the complete sample period, with the standard error of this difference (Kmenta, 1971). Again for the wage equations using annual data, test statistics did not support change in either the unemployment or the inflation coefficient. However for wage equations using quarterly settlement data,

22
unemployment coefficients were found to be significantly different at the 95 per cent probability level in the case of all settlements, settlements without a COLA clause, and for the public sector and B.C. settlements. There was also some evidence (at the 90 per cent probability level) of a change in the unemployment coefficient in the case of COLA settlements, and for settlements in the federal public service. In all wage equations except those for the private sector, manufacturing, British Columbia, the federal public service and COLA settlements, test statistics indicated change in the inflation coefficient at the 95 per cent probability level.
xi These results are corroborated by similar studies elsewhere, using the Phillips Curve framework. For example Coe and Gagliardi (1985) estimated nominal wage equations for ten OECD countries including Canada. They found that "the decline in wage growth in the early 1980s and continued moderation through 1984 is relatively well explained by the high rates of unemployment and the additional downward pressures of inflation from commodity prices, direct demand effects on prices, and in some countries, exchange rate movements"(p. 28). Their study discovered no evidence of structural change in wage formation process for any of the ten countries, except the U.K.
xii The five wage equations also include other variables (e.g. labour productivity) in addition to measures of inflation expectations and labour market conditions. For a specification of these models see Grady Economics and Associates (1985).
Industrial Relations Centre (IRC)
Queen’s University Kingston, ON K7L 3N6
irc.queensu.ca