Shop Space Opportunities - Phoenix Commercial...
13
The information contained herein has been obtained from sources believed reliable. While we do not doubt its accuracy, we have not verified it and make no guarantee, warranty or representation about it. It is your responsibility to independently confirm its accuracy and completeness. Any projections, opinions, assumptions or estimates used are for example only, and do not represent the current or future performance of the property. The value of this transaction to you depends on tax and other factors which should be evaluated by your tax, financial and legal advisors. You and your advisors should conduct a careful, independent investigation of the property to determine to your satisfaction the suitability of the property for your needs. [189] AUG 30, 2018 Population Summary: 1 Mile 3 Miles 5 Mile 2017 Total 14,749 90,796 279,284 2022 Total 15,611 96,753 298,840 Average HH Income: 1 Mile 3 Miles 5 Miles 2017 $122,302 $97,220 $85,580 Traffic Counts: N ±17,400 VPD (NB & SB) S ±16,900 VPD (NB & SB) E ±34,600 VPD (EB & WB) W ±29,900 VPD (EB & WB) Available: ±1,200 SF to ±3,000 SF Rates: Call for rates Zoning: C-2, City of Chandler Comments: Neighborhood center located at one of Chandler’s strongest intersections and within walking distance from Corona del Sol High School. Great incomes and a captive audience with the center being surrounded by homes. Join: 3131 East Camelback Road, Suite 340 Phoenix, Arizona 85016 Phone: 602-957-9800 Fax: 602-957-0889 www.phoenixcommercialadvisors.com Shop Space Opportunities NEC Rural Rd & Ray Rd | Chandler, AZ www.phoenixcommercialadvisors.com/listings/info/ruraray.htm Michelle Gatti 602-734-7205 [email protected] Greg Laing 602-734-7207 [email protected] Nick DeDona 602-734-7208 [email protected] *Chandler 2016 & ADOT 2015 Join Aspire Fitness, Xtreme Air, & First Watch!
Transcript of Shop Space Opportunities - Phoenix Commercial...

The information contained herein has been obtained from sources believed reliable. While we do not doubt its accuracy, we have not verified it and make no guarantee, warranty or representation about it. It is your responsibility to independently confirm its accuracy and completeness. Any projections, opinions, assumptions or estimates used are for example only, and do not represent the current or future performance of the property. The value of this transaction to you depends on tax and other factors which should be evaluated by your tax, financial and legal advisors. You and your advisors should conduct a careful, independent investigation of the property to determine to your satisfaction the suitability of the property for your needs. [189] AUG 30, 2018
Population Summary: 1 Mile 3 Miles 5 Mile 2017 Total 14,749 90,796 279,284 2022 Total 15,611 96,753 298,840
Average HH Income: 1 Mile 3 Miles 5 Miles 2017 $122,302 $97,220 $85,580
Traffic Counts: N ±17,400 VPD (NB & SB) S ±16,900 VPD (NB & SB) E ±34,600 VPD (EB & WB) W ±29,900 VPD (EB & WB)
Available: ±1,200 SF to ±3,000 SF
Rates: Call for rates
Zoning: C-2, City of Chandler Comments: Neighborhood center located at one of Chandler’s strongest intersections and within walking distance from Corona del Sol High School. Great incomes and a captive audience with the center being surrounded by homes.
Join:
3131 East Camelback Road, Suite 340Phoenix, Arizona 85016Phone: 602-957-9800 Fax: 602-957-0889www.phoenixcommercialadvisors.com
Shop Space Opportunities
NEC Rural Rd & Ray Rd | Chandler, AZ
www.phoenixcommercialadvisors.com/listings/info/ruraray.htm
Michelle Gatti602-734-7205
Greg Laing602-734-7207
Nick DeDona 602-734-7208
*Chandler 2016 & ADOT 2015
JoinAspire Fitness,
Xtreme Air, & First Watch!

The information contained herein has been obtained from sources believed reliable. While we do not doubt its accuracy, we have not verified it and make no guarantee, warranty or representation about it. It is your responsibility to independently confirm its accuracy and completeness. Any projections, opinions, assumptions or estimates used are for example only, and do not represent the current or future performance of the property. The value of this transaction to you depends on tax and other factors which should be evaluated by your tax, financial and legal advisors. You and your advisors should conduct a careful, independent investigation of the property to determine to your satisfaction the suitability of the property for your needs. [189] AUG 30, 2018
3131 E Camelback Rd, Ste 340 | Phoenix, AZ 85016Phone: 602-957-9800 | Fax: 602-957-0889
www.phoenixcommercialadvisors.com
For more information, please contact
Greg Laing602-734-7207
Michelle Gatti602-734-7205
[email protected] plan not drawn to scale
N
NEC Rural Rd & Ray Rd | Chandler, AZ
RURA
L ROA
D
RAY ROAD
NOT PARTOF PROJECT
ChandlerSunsetLibrary
(Not a Part)
1,80
0 1,
200
1,367
Shop Space Opportunities
Nick DeDona 602-734-7208
1,20
0
1,71
3

- 13183 4910 W. Ray, Rd. Chandler, AZJanuary 8, 2014
NORTH
SCALE: 1/4" = 1'-0"

The information contained herein has been obtained from sources believed reliable. While we do not doubt its accuracy, we have not verified it and make no guarantee, warranty or representation about it. It is your responsibility to independently confirm its accuracy and completeness. Any projections, opinions, assumptions or estimates used are for example only, and do not represent the current or future performance of the property. The value of this transaction to you depends on tax and other factors which should be evaluated by your tax, financial and legal advisors. You and your advisors should conduct a careful, independent investigation of the property to determine to your satisfaction the suitability of the property for your needs. [189] AUG 30, 2018
3131 E Camelback Rd, Ste 340 | Phoenix, AZ 85016Phone: 602-957-9800 | Fax: 602-957-0889
www.phoenixcommercialadvisors.com
NEC Rural Rd & Ray Rd | Chandler, AZ
Shop Space Opportunities

DOWNTOWN GILBERT
AERIAL
PHOENIX COMMERCIAL ADVISORSGilbert Rd & Vaughn Ave | GILBERT, AZ
±17,
440
VPD
±34,600 VPD
±16,
900
VPD
±29,900 VPD
Chandler SunsetLibrary
RAY RDRAY RD
RURA
L RD
RURA
L RD
PLANNED
This map was produced using data from private and governmental sources deemed to be reliable. The information is provided without representation or warranty.
NEC Rural Rd & Ray Rd | Chandler, AZ
N

DOWNTOWN GILBERT
AERIAL
PHOENIX COMMERCIAL ADVISORSGilbert Rd & Vaughn Ave | GILBERT, AZ
CHANDLER HIGH SCHOOL3241 STU
CORONA DEL SOL HIGH SCHOOL2773 STU
DOBSON HIGH SCHOOL2517 STU
MARCOS DE NIZA HIGH SCHOOL1452 STU
CHANDLER FASHION CENTER
THE GROVES
CHANDLER FESTIVAL
CHANDLERPAVILIONS
48TH
ST
48TH ST
51ST ST
56TH
ST
ALM
A S
CHO
OL
RDA
LMA
SCH
OO
L RD
ARI
ZON
A A
VEA
RIZO
NA
AVE
AVEN
IDA
DEL
YAQ
UI
CARVER RD
CHANDLER BLVD CHANDLER BLVD
CORNELL DR
CO
UN
TRY
CLU
B WAY
DO
BSON RD
DO
BSO
N R
DD
OBS
ON
RD
EL D
ORA
DO
ELLIOT RD ELLIOT RD
ELLI
S ST
FRYE RD
GALVESTON ST
GUADALUPE RD
HA
MIL
TON
ST
HA
R DY
DR
HA
RTFO
RD S
T
KEATING AVE
KNOX RD
KYRE
NE
RDKY
REN
E RD
LAKE
SHO
RE D
RLA
KESH
ORE
DR
LIBR A DR
LINDNER AVE
LOS FELIZ DR
MCC
LIN
TOCK
DR
MCC
LIN
TOCK
DR
MEDINA AVE
MILL AVE
OXFORD DR
PATT
ERSO
N
PERALTA AVEPR
IEST
DR
RAY RD RAY RD
RIVE R
PKW
Y
RURA
L RD
RURA
L RD
SU M MIT PL
WARNER RD WARNER RDWARNER RD
South Mtn Fwy
65101
65202
.-,10
RHYTHYM400 UNITS
"Future"
"Active"MPC/Housing Data
This map was produced using data from private and governmental sources deemed to be reliable. The information is provided without representation or warranty.
NEC Rural Rd & Ray Rd | Chandler, AZ
N

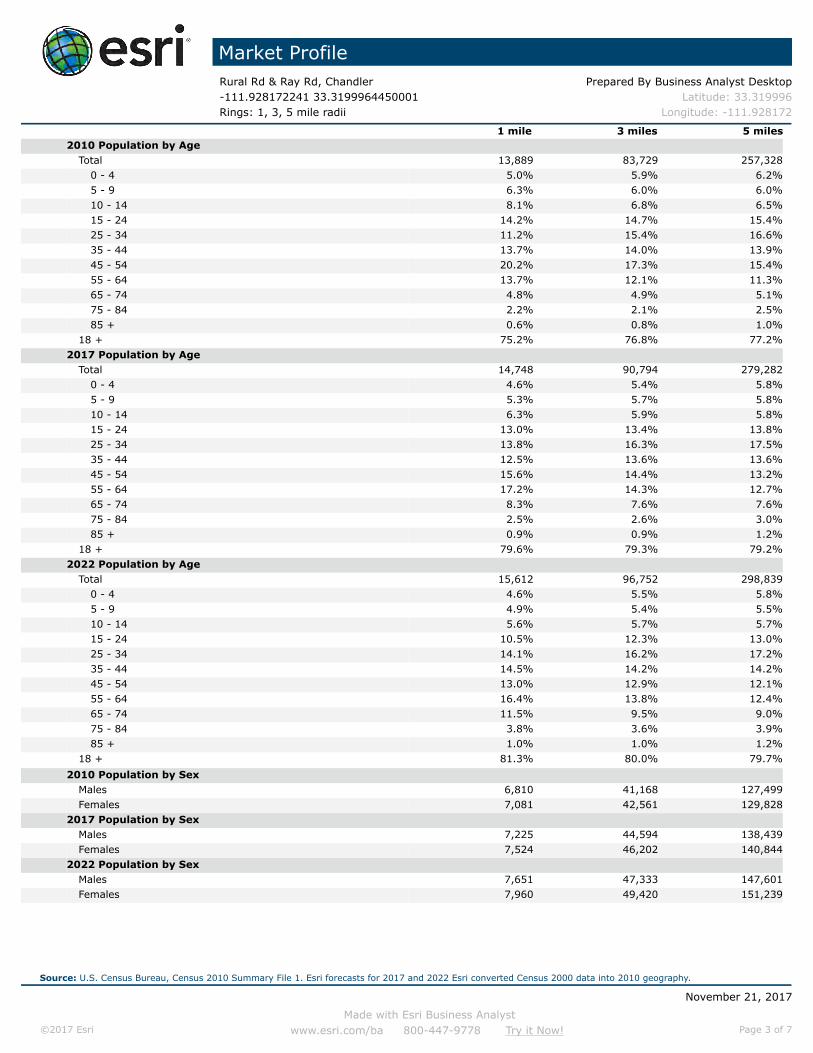
Market ProfileRural Rd & Ray Rd, Chandler Prepared By Business Analyst Desktop-111.928172241 33.3199964450001 Latitude: 33.319996Rings: 1, 3, 5 mile radii Longitude: -111.928172
1 mile 3 miles 5 milesPopulation Summary
2000 Total Population 14,915 86,876 257,9352010 Total Population 13,891 83,729 257,3272017 Total Population 14,749 90,796 279,284
2017 Group Quarters 21 161 9592022 Total Population 15,611 96,753 298,840
2017-2022 Annual Rate 1.14% 1.28% 1.36%2017 Total Daytime Population 10,657 112,641 278,644
Workers 4,574 74,238 157,429Residents 6,083 38,403 121,215
Household Summary
2000 Households 5,146 32,739 96,9402000 Average Household Size 2.90 2.65 2.65
2010 Households 5,205 34,008 103,8402010 Average Household Size 2.67 2.46 2.47
2017 Households 5,500 36,690 112,5292017 Average Household Size 2.68 2.47 2.47
2022 Households 5,801 38,984 120,2612022 Average Household Size 2.69 2.48 2.482017-2022 Annual Rate 1.07% 1.22% 1.34%
2010 Families 3,850 21,914 64,0242010 Average Family Size 3.09 3.01 3.05
2017 Families 4,025 23,321 68,3232017 Average Family Size 3.11 3.04 3.07
2022 Families 4,227 24,662 72,5152022 Average Family Size 3.13 3.05 3.082017-2022 Annual Rate 0.98% 1.12% 1.20%
Housing Unit Summary2000 Housing Units 5,257 34,434 101,795
Owner Occupied Housing Units 80.8% 67.1% 64.4%Renter Occupied Housing Units 17.0% 28.0% 30.8%Vacant Housing Units 2.1% 4.9% 4.8%
2010 Housing Units 5,408 35,906 111,615Owner Occupied Housing Units 72.7% 58.8% 54.9%Renter Occupied Housing Units 23.6% 35.9% 38.1%Vacant Housing Units 3.8% 5.3% 7.0%
2017 Housing Units 5,623 38,205 118,843Owner Occupied Housing Units 70.4% 56.3% 51.9%Renter Occupied Housing Units 27.4% 39.8% 42.8%Vacant Housing Units 2.2% 4.0% 5.3%
2022 Housing Units 5,876 40,324 125,981Owner Occupied Housing Units 71.0% 56.9% 52.1%Renter Occupied Housing Units 27.7% 39.8% 43.3%Vacant Housing Units 1.3% 3.3% 4.5%
Median Household Income2017 $100,045 $75,602 $64,6142022 $103,981 $81,782 $72,325
Median Home Value2017 $334,101 $294,652 $249,0682022 $353,377 $330,425 $286,013
Per Capita Income2017 $46,092 $39,390 $34,6052022 $50,601 $43,807 $38,901
Median Age2010 39.2 35.8 34.52017 40.6 37.3 35.92022 41.8 38.3 36.8
Data Note: Household population includes persons not residing in group quarters. Average Household Size is the household population divided by total households. Persons in families include the householder and persons related to the householder by birth, marriage, or adoption. Per Capita Income represents the income received by all persons aged 15 years and over divided by the total population.Source: U.S. Census Bureau, Census 2010 Summary File 1. Esri forecasts for 2017 and 2022 Esri converted Census 2000 data into 2010 geography.
November 21, 2017
Made with Esri Business Analyst©2017 Esri www.esri.com/ba 800-447-9778 Try it Now! Page 1 of 7

Market ProfileRural Rd & Ray Rd, Chandler Prepared By Business Analyst Desktop-111.928172241 33.3199964450001 Latitude: 33.319996Rings: 1, 3, 5 mile radii Longitude: -111.928172
1 mile 3 miles 5 miles2017 Households by Income
Household Income Base 5,500 36,685 112,524<$15,000 2.3% 5.5% 7.4%$15,000 - $24,999 2.0% 5.4% 6.8%$25,000 - $34,999 6.2% 7.6% 7.9%$35,000 - $49,999 8.5% 12.7% 14.3%$50,000 - $74,999 15.1% 18.4% 20.0%$75,000 - $99,999 15.7% 14.3% 14.6%$100,000 - $149,999 24.2% 19.6% 16.4%$150,000 - $199,999 13.3% 8.9% 6.7%$200,000+ 12.5% 7.6% 5.8%
Average Household Income $122,302 $97,220 $85,5802022 Households by Income
Household Income Base 5,801 38,979 120,256<$15,000 2.3% 5.3% 7.0%$15,000 - $24,999 1.8% 4.8% 6.1%$25,000 - $34,999 5.2% 6.4% 6.7%$35,000 - $49,999 7.2% 10.7% 12.2%$50,000 - $74,999 14.2% 17.8% 19.6%$75,000 - $99,999 16.1% 15.2% 15.7%$100,000 - $149,999 25.4% 21.5% 18.4%$150,000 - $199,999 13.9% 9.8% 7.5%$200,000+ 13.9% 8.6% 6.9%
Average Household Income $134,779 $108,407 $96,3842017 Owner Occupied Housing Units by Value
Total 3,961 21,495 61,684<$50,000 0.6% 0.9% 2.2%$50,000 - $99,999 1.5% 1.6% 2.6%$100,000 - $149,999 1.2% 5.4% 9.0%$150,000 - $199,999 4.8% 12.9% 19.1%$200,000 - $249,999 15.9% 15.6% 17.4%$250,000 - $299,999 12.7% 15.3% 15.3%$300,000 - $399,999 38.9% 25.5% 19.3%$400,000 - $499,999 14.3% 9.9% 6.9%$500,000 - $749,999 6.7% 7.2% 4.9%$750,000 - $999,999 1.6% 3.6% 2.1%$1,000,000 + 1.7% 2.2% 1.2%
Average Home Value $360,009 $345,863 $291,0082022 Owner Occupied Housing Units by Value
Total 4,171 22,917 65,665<$50,000 0.1% 0.2% 1.1%$50,000 - $99,999 0.4% 0.5% 1.0%$100,000 - $149,999 0.5% 2.2% 4.3%$150,000 - $199,999 2.5% 7.9% 13.3%$200,000 - $249,999 11.3% 13.5% 17.3%$250,000 - $299,999 11.9% 16.4% 18.2%$300,000 - $399,999 43.7% 30.7% 24.9%$400,000 - $499,999 17.9% 13.1% 9.6%$500,000 - $749,999 8.2% 9.2% 6.7%$750,000 - $999,999 1.9% 4.1% 2.4%$1,000,000 + 1.7% 2.3% 1.3%
Average Home Value $385,469 $380,868 $328,395
Data Note: Income represents the preceding year, expressed in current dollars. Household income includes wage and salary earnings, interest dividends, net rents, pensions, SSI and welfare payments, child support, and alimony. Source: U.S. Census Bureau, Census 2010 Summary File 1. Esri forecasts for 2017 and 2022 Esri converted Census 2000 data into 2010 geography.
November 21, 2017
Made with Esri Business Analyst©2017 Esri www.esri.com/ba 800-447-9778 Try it Now! Page 2 of 7
Market ProfileRural Rd & Ray Rd, Chandler Prepared By Business Analyst Desktop-111.928172241 33.3199964450001 Latitude: 33.319996Rings: 1, 3, 5 mile radii Longitude: -111.928172
1 mile 3 miles 5 miles2010 Population by Age
Total 13,889 83,729 257,3280 - 4 5.0% 5.9% 6.2%5 - 9 6.3% 6.0% 6.0%10 - 14 8.1% 6.8% 6.5%15 - 24 14.2% 14.7% 15.4%25 - 34 11.2% 15.4% 16.6%35 - 44 13.7% 14.0% 13.9%45 - 54 20.2% 17.3% 15.4%55 - 64 13.7% 12.1% 11.3%65 - 74 4.8% 4.9% 5.1%75 - 84 2.2% 2.1% 2.5%85 + 0.6% 0.8% 1.0%
18 + 75.2% 76.8% 77.2%2017 Population by Age
Total 14,748 90,794 279,2820 - 4 4.6% 5.4% 5.8%5 - 9 5.3% 5.7% 5.8%10 - 14 6.3% 5.9% 5.8%15 - 24 13.0% 13.4% 13.8%25 - 34 13.8% 16.3% 17.5%35 - 44 12.5% 13.6% 13.6%45 - 54 15.6% 14.4% 13.2%55 - 64 17.2% 14.3% 12.7%65 - 74 8.3% 7.6% 7.6%75 - 84 2.5% 2.6% 3.0%85 + 0.9% 0.9% 1.2%
18 + 79.6% 79.3% 79.2%2022 Population by Age
Total 15,612 96,752 298,8390 - 4 4.6% 5.5% 5.8%5 - 9 4.9% 5.4% 5.5%10 - 14 5.6% 5.7% 5.7%15 - 24 10.5% 12.3% 13.0%25 - 34 14.1% 16.2% 17.2%35 - 44 14.5% 14.2% 14.2%45 - 54 13.0% 12.9% 12.1%55 - 64 16.4% 13.8% 12.4%65 - 74 11.5% 9.5% 9.0%75 - 84 3.8% 3.6% 3.9%85 + 1.0% 1.0% 1.2%
18 + 81.3% 80.0% 79.7%2010 Population by Sex
Males 6,810 41,168 127,499Females 7,081 42,561 129,828
2017 Population by SexMales 7,225 44,594 138,439Females 7,524 46,202 140,844
2022 Population by SexMales 7,651 47,333 147,601Females 7,960 49,420 151,239
Source: U.S. Census Bureau, Census 2010 Summary File 1. Esri forecasts for 2017 and 2022 Esri converted Census 2000 data into 2010 geography.
November 21, 2017
Made with Esri Business Analyst©2017 Esri www.esri.com/ba 800-447-9778 Try it Now! Page 3 of 7

Market ProfileRural Rd & Ray Rd, Chandler Prepared By Business Analyst Desktop-111.928172241 33.3199964450001 Latitude: 33.319996Rings: 1, 3, 5 mile radii Longitude: -111.928172
1 mile 3 miles 5 miles2010 Population by Race/Ethnicity
Total 13,891 83,730 257,329White Alone 78.3% 76.2% 73.7%Black Alone 3.1% 5.3% 5.4%American Indian Alone 0.9% 1.8% 3.2%Asian Alone 12.3% 8.9% 6.5%Pacific Islander Alone 0.1% 0.2% 0.3%Some Other Race Alone 2.4% 4.1% 7.1%Two or More Races 2.8% 3.6% 3.8%
Hispanic Origin 10.7% 14.2% 20.0%Diversity Index 49.1 55.3 62.5
2017 Population by Race/EthnicityTotal 14,749 90,795 279,283
White Alone 74.5% 72.4% 70.0%Black Alone 3.6% 6.0% 6.2%American Indian Alone 1.1% 2.1% 3.5%Asian Alone 14.6% 10.5% 7.7%Pacific Islander Alone 0.2% 0.2% 0.3%Some Other Race Alone 2.7% 4.5% 7.7%Two or More Races 3.4% 4.3% 4.5%
Hispanic Origin 11.8% 15.6% 21.6%Diversity Index 54.3 60.3 66.8
2022 Population by Race/EthnicityTotal 15,611 96,754 298,840
White Alone 71.2% 69.3% 67.1%Black Alone 4.0% 6.7% 6.9%American Indian Alone 1.1% 2.2% 3.7%Asian Alone 16.8% 12.1% 8.9%Pacific Islander Alone 0.2% 0.2% 0.3%Some Other Race Alone 2.9% 4.8% 8.2%Two or More Races 3.7% 4.7% 5.0%
Hispanic Origin 12.7% 16.8% 22.9%Diversity Index 58.2 64.0 70.0
2010 Population by Relationship and Household TypeTotal 13,891 83,729 257,327
In Households 99.9% 99.8% 99.7%In Family Households 87.1% 80.9% 78.5%
Householder 27.9% 26.1% 24.9%Spouse 22.3% 19.5% 17.7%Child 32.7% 29.9% 29.4%Other relative 2.6% 3.4% 4.0%Nonrelative 1.6% 2.0% 2.5%
In Nonfamily Households 12.7% 19.0% 21.2%In Group Quarters 0.1% 0.2% 0.3%
Institutionalized Population 0.1% 0.1% 0.1%Noninstitutionalized Population 0.0% 0.1% 0.2%
Data Note: Persons of Hispanic Origin may be of any race. The Diversity Index measures the probability that two people from the same area will be from different race/ethnic groups.Source: U.S. Census Bureau, Census 2010 Summary File 1. Esri forecasts for 2017 and 2022 Esri converted Census 2000 data into 2010 geography.
November 21, 2017
Made with Esri Business Analyst©2017 Esri www.esri.com/ba 800-447-9778 Try it Now! Page 4 of 7

Market ProfileRural Rd & Ray Rd, Chandler Prepared By Business Analyst Desktop-111.928172241 33.3199964450001 Latitude: 33.319996Rings: 1, 3, 5 mile radii Longitude: -111.928172
1 mile 3 miles 5 miles2017 Population 25+ by Educational AttainmentTotal 10,450 63,190 192,269
Less than 9th Grade 1.1% 1.5% 2.5%9th - 12th Grade, No Diploma 1.4% 2.9% 4.6%High School Graduate 12.0% 12.5% 14.8%GED/Alternative Credential 2.2% 2.1% 2.5%Some College, No Degree 18.1% 22.4% 24.2%Associate Degree 9.2% 9.3% 9.5%Bachelor's Degree 31.1% 29.6% 25.7%Graduate/Professional Degree 24.9% 19.7% 16.1%
2017 Population 15+ by Marital StatusTotal 12,368 75,335 230,918
Never Married 32.6% 35.4% 37.8%Married 52.6% 48.4% 45.8%Widowed 2.7% 3.7% 3.8%Divorced 12.1% 12.5% 12.7%
2017 Civilian Population 16+ in Labor Force Civilian Employed 97.1% 96.0% 95.7% Civilian Unemployed (Unemployment Rate) 2.9% 4.0% 4.3%2017 Employed Population 16+ by IndustryTotal 8,827 53,390 161,138 Agriculture/Mining 0.0% 0.1% 0.3% Construction 5.6% 3.7% 4.1% Manufacturing 14.4% 11.4% 10.2% Wholesale Trade 2.1% 2.3% 2.4% Retail Trade 9.3% 10.9% 11.9% Transportation/Utilities 4.1% 4.4% 4.8% Information 1.2% 2.0% 2.2% Finance/Insurance/Real Estate 12.8% 11.3% 10.4% Services 47.3% 50.4% 50.3% Public Administration 3.2% 3.4% 3.3%2017 Employed Population 16+ by OccupationTotal 8,829 53,389 161,141 White Collar 81.9% 76.1% 71.0% Management/Business/Financial 23.8% 21.2% 17.8% Professional 32.3% 28.3% 26.0% Sales 13.0% 11.9% 11.9% Administrative Support 12.8% 14.6% 15.3% Services 8.9% 13.8% 15.8% Blue Collar 9.2% 10.1% 13.2% Farming/Forestry/Fishing 0.0% 0.0% 0.1% Construction/Extraction 2.1% 1.6% 2.5% Installation/Maintenance/Repair 0.4% 1.9% 2.7% Production 3.8% 3.6% 3.9% Transportation/Material Moving 3.0% 2.9% 4.0%2010 Population By Urban/ Rural Status
Total Population 13,891 83,729 257,327Population Inside Urbanized Area 100.0% 100.0% 100.0%Population Inside Urbanized Cluster 0.0% 0.0% 0.0%Rural Population 0.0% 0.0% 0.0%
Source: U.S. Census Bureau, Census 2010 Summary File 1. Esri forecasts for 2017 and 2022 Esri converted Census 2000 data into 2010 geography.
November 21, 2017
Made with Esri Business Analyst©2017 Esri www.esri.com/ba 800-447-9778 Try it Now! Page 5 of 7

Market ProfileRural Rd & Ray Rd, Chandler Prepared By Business Analyst Desktop-111.928172241 33.3199964450001 Latitude: 33.319996Rings: 1, 3, 5 mile radii Longitude: -111.928172
1 mile 3 miles 5 miles2010 Households by Type
Total 5,204 34,008 103,840Households with 1 Person 19.8% 26.6% 27.5%Households with 2+ People 80.2% 73.4% 72.5%
Family Households 74.0% 64.4% 61.7%Husband-wife Families 59.1% 48.0% 43.8%
With Related Children 27.9% 22.0% 19.8%Other Family (No Spouse Present) 14.9% 16.4% 17.9%
Other Family with Male Householder 4.2% 5.1% 5.7%With Related Children 2.6% 3.1% 3.3%
Other Family with Female Householder 10.7% 11.3% 12.2%With Related Children 6.9% 7.2% 7.9%
Nonfamily Households 6.2% 9.0% 10.8%
All Households with Children 37.8% 32.8% 31.4%
Multigenerational Households 2.7% 2.8% 3.4%Unmarried Partner Households 5.3% 7.2% 8.3%
Male-female 4.6% 6.4% 7.5%Same-sex 0.7% 0.8% 0.8%
2010 Households by SizeTotal 5,206 34,008 103,839
1 Person Household 19.8% 26.6% 27.5%2 Person Household 33.7% 34.3% 34.1%3 Person Household 20.1% 17.2% 16.8%4 Person Household 18.2% 14.0% 12.8%5 Person Household 5.7% 5.2% 5.4%6 Person Household 1.7% 1.8% 2.0%7 + Person Household 0.7% 0.8% 1.3%
2010 Households by Tenure and Mortgage StatusTotal 5,205 34,008 103,840
Owner Occupied 75.5% 62.1% 59.1%Owned with a Mortgage/Loan 63.4% 52.6% 49.2%Owned Free and Clear 12.1% 9.5% 9.8%
Renter Occupied 24.5% 37.9% 40.9%2010 Housing Units By Urban/ Rural Status
Total Housing Units 5,408 35,906 111,615Housing Units Inside Urbanized Area 100.0% 100.0% 100.0%Housing Units Inside Urbanized Cluster 0.0% 0.0% 0.0%Rural Housing Units 0.0% 0.0% 0.0%
Data Note: Households with children include any households with people under age 18, related or not. Multigenerational households are families with 3 or more parent-child relationships. Unmarried partner households are usually classified as nonfamily households unless there is another member of the household related to the householder. Multigenerational and unmarried partner households are reported only to the tract level. Esri estimated block group data, which is used to estimate polygons or non-standard geography.Source: U.S. Census Bureau, Census 2010 Summary File 1. Esri forecasts for 2017 and 2022 Esri converted Census 2000 data into 2010 geography.
November 21, 2017
Made with Esri Business Analyst©2017 Esri www.esri.com/ba 800-447-9778 Try it Now! Page 6 of 7

Market ProfileRural Rd & Ray Rd, Chandler Prepared By Business Analyst Desktop-111.928172241 33.3199964450001 Latitude: 33.319996Rings: 1, 3, 5 mile radii Longitude: -111.928172
1 mile 3 miles 5 milesTop 3 Tapestry Segments
1. Soccer Moms (4A) Bright Young Professionals (8C)
Bright Young Professionals (8C)2. Savvy Suburbanites (1D) Young and Restless (11B) Young and Restless (11B)
3. Professional Pride (1B) Soccer Moms (4A) Home Improvement (4B)
2017 Consumer Spending Apparel & Services: Total $ $18,057,914 $97,917,582 $265,916,587
Average Spent $3,283.26 $2,668.78 $2,363.09Spending Potential Index 152 124 109
Education: Total $ $12,952,651 $67,248,376 $178,376,784Average Spent $2,355.03 $1,832.88 $1,585.16Spending Potential Index 162 126 109
Entertainment/Recreation: Total $ $25,533,533 $136,240,428 $369,356,000Average Spent $4,642.46 $3,713.29 $3,282.32Spending Potential Index 149 119 105
Food at Home: Total $ $39,236,610 $219,584,074 $605,144,980Average Spent $7,133.93 $5,984.85 $5,377.68Spending Potential Index 142 119 107
Food Away from Home: Total $ $27,461,177 $151,885,826 $415,028,415Average Spent $4,992.94 $4,139.71 $3,688.19Spending Potential Index 150 124 111
Health Care: Total $ $44,384,624 $233,348,413 $634,670,068Average Spent $8,069.93 $6,360.00 $5,640.06Spending Potential Index 144 114 101
HH Furnishings & Equipment: Total $ $16,194,046 $86,550,273 $234,875,299Average Spent $2,944.37 $2,358.96 $2,087.24Spending Potential Index 151 121 107
Personal Care Products & Services: Total $ $6,604,050 $35,580,833 $96,506,255Average Spent $1,200.74 $969.77 $857.61Spending Potential Index 151 122 108
Shelter: Total $ $132,014,395 $728,213,540 $1,987,609,684Average Spent $24,002.62 $19,847.74 $17,663.09Spending Potential Index 148 122 109
Support Payments/Cash Contributions/Gifts in Kind: Total $ $19,512,495 $101,522,282 $273,419,630Average Spent $3,547.73 $2,767.03 $2,429.77Spending Potential Index 151 118 104
Travel: Total $ $18,057,934 $91,856,716 $243,803,048Average Spent $3,283.26 $2,503.59 $2,166.58Spending Potential Index 158 121 105
Vehicle Maintenance & Repairs: Total $ $8,596,084 $46,670,812 $127,465,075Average Spent $1,562.92 $1,272.03 $1,132.73Spending Potential Index 146 119 106
Data Note: Consumer spending shows the amount spent on a variety of goods and services by households that reside in the area. Expenditures are shown by broad budget categories that are not mutually exclusive. Consumer spending does not equal business revenue. Total and Average Amount Spent Per Household represent annual figures. The Spending Potential Index represents the amount spent in the area relative to a national average of 100.Source: Consumer Spending data are derived from the 2013 and 2014 Consumer Expenditure Surveys, Bureau of Labor Statistics. Esri.Source: U.S. Census Bureau, Census 2010 Summary File 1. Esri forecasts for 2017 and 2022 Esri converted Census 2000 data into 2010 geography.
November 21, 2017
Made with Esri Business Analyst©2017 Esri www.esri.com/ba 800-447-9778 Try it Now! Page 7 of 7


![Detection of Aquatic Invasive Species Using eDNA ... · Early Detection of Aquatic Invasive Species Using eDNA Techlhnology: ... [Medinis Biologi] Gene‐ZTM for detecting eDNA ...](https://static.fdocuments.us/doc/165x107/5c81e61009d3f2f3348d0d63/detection-of-aquatic-invasive-species-using-edna-early-detection-of-aquatic.jpg)