Sherman Way Van Nuys Flyer - LoopNet · 2nd Floor Site Plan Insurance Optometrist Dentist Massage...
10
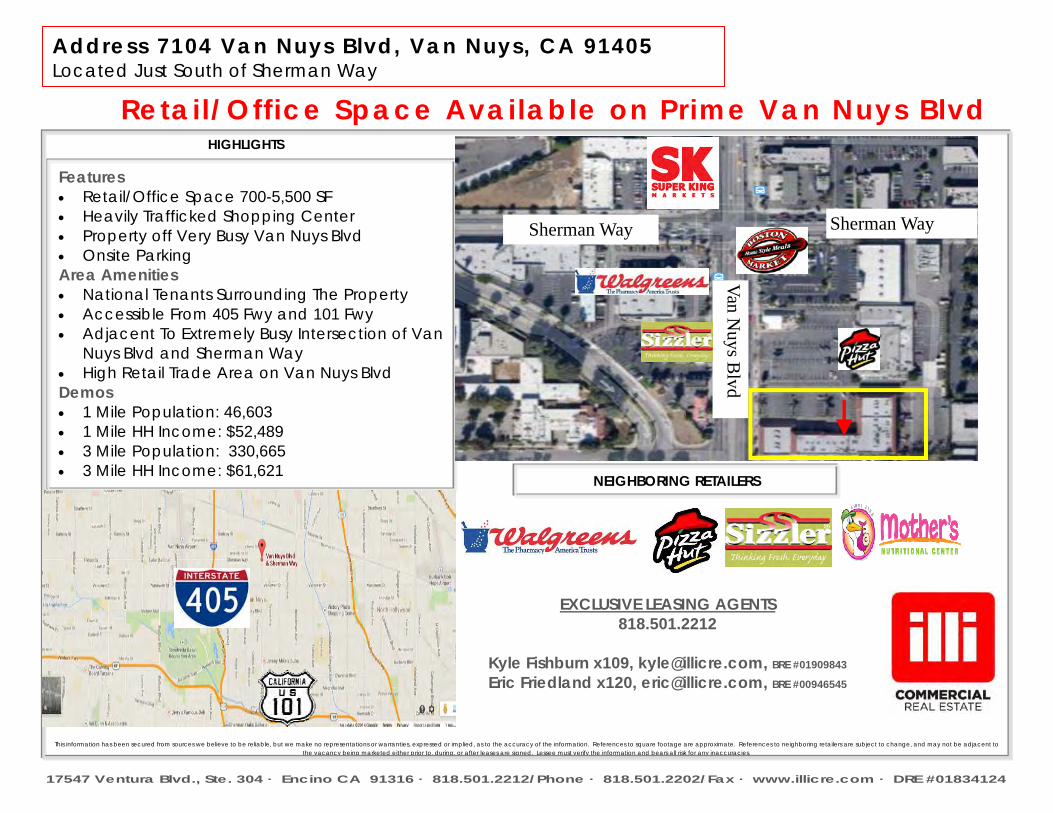
??P Retail/Office Space Available on Prime Van Nuys Blvd HIGHLIGHTS Features Retail/Office Space 700-5,500 SF Heavily Trafficked Shopping Center Property off Very Busy Van Nuys Blvd Onsite Parking Area Amenities National Tenants Surrounding The Property Accessible From 405 Fwy and 101 Fwy Adjacent To Extremely Busy Intersection of Van Nuys Blvd and Sherman Way High Retail Trade Area on Van Nuys Blvd Demos 1 Mile Population: 46,603 1 Mile HH Income: $52,489 3 Mile Population: 330,665 3 Mile HH Income: $61,621 This information has been secured from sources we believe to be reliable, but we make no representations or warranties, expressed or implied, as to the accuracy of the information. References to square footage are approximate. References to neighboring retailers are subject to change, and may not be adjacent to the vacancy being marketed either prior to, during, or after leases are signed. Lessee must verify the information and bears all risk for any inaccuracies. 17547 Ventura Blvd., Ste. 304 · Encino CA 91316 · 818.501.2212/Phone · 818.501.2202/Fax · www.illicre.com · DRE #01834124 NEIGHBORING RETAILERS Address 7104 Van Nuys Blvd, Van Nuys, CA 91405 Located Just South of Sherman Way EXCLUSIVE LEASING AGENTS 818.501.2212 Kyle Fishburn x109, [email protected], BRE #01909843 Eric Friedland x120, [email protected], BRE #00946545 Sherman Way Sherman Way Van Nuys Blvd
-
Upload
vuongtuyen -
Category
Documents
-
view
218 -
download
2
Transcript of Sherman Way Van Nuys Flyer - LoopNet · 2nd Floor Site Plan Insurance Optometrist Dentist Massage...
??PRetail/Off ice Space Available on Prime Van Nuys Blvd HIGHLIGHTS
Features Retail/Office Space 700-5,500 SF Heavily Trafficked Shopping Center Property off Very Busy Van Nuys Blvd Onsite Parking Area Amenities National Tenants Surrounding The Property Accessible From 405 Fwy and 101 Fwy Adjacent To Extremely Busy Intersection of Van
Nuys Blvd and Sherman Way High Retail Trade Area on Van Nuys Blvd Demos 1 Mile Population: 46,603 1 Mile HH Income: $52,489 3 Mile Population: 330,665 3 Mile HH Income: $61,621
This information has been secured from sources we believe to be reliable, but we make no representations or warranties, expressed or implied, as to the accuracy of the information. References to square footage are approximate. References to neighboring retailers are subject to change, and may not be adjacent to the vacancy being marketed either prior to, during, or after leases are signed. Lessee must verify the information and bears all risk for any inaccuracies.
17547 Ventura Blvd., Ste. 304 · Encino CA 91316 · 818.501.2212/Phone · 818.501.2202/Fax · www.illicre.com · DRE #01834124
NEIGHBORING RETAILERS
Address 7104 Van Nuys Blvd, Van Nuys, CA 91405 Located Just South of Sherman Way
EXCLUSIVE LEASING AGENTS 818.501.2212
Kyle Fishburn x109, [email protected], BRE #01909843 Eric Friedland x120, [email protected], BRE #00946545
Sherman Way Sherman Way
Van Nuys B
lvd
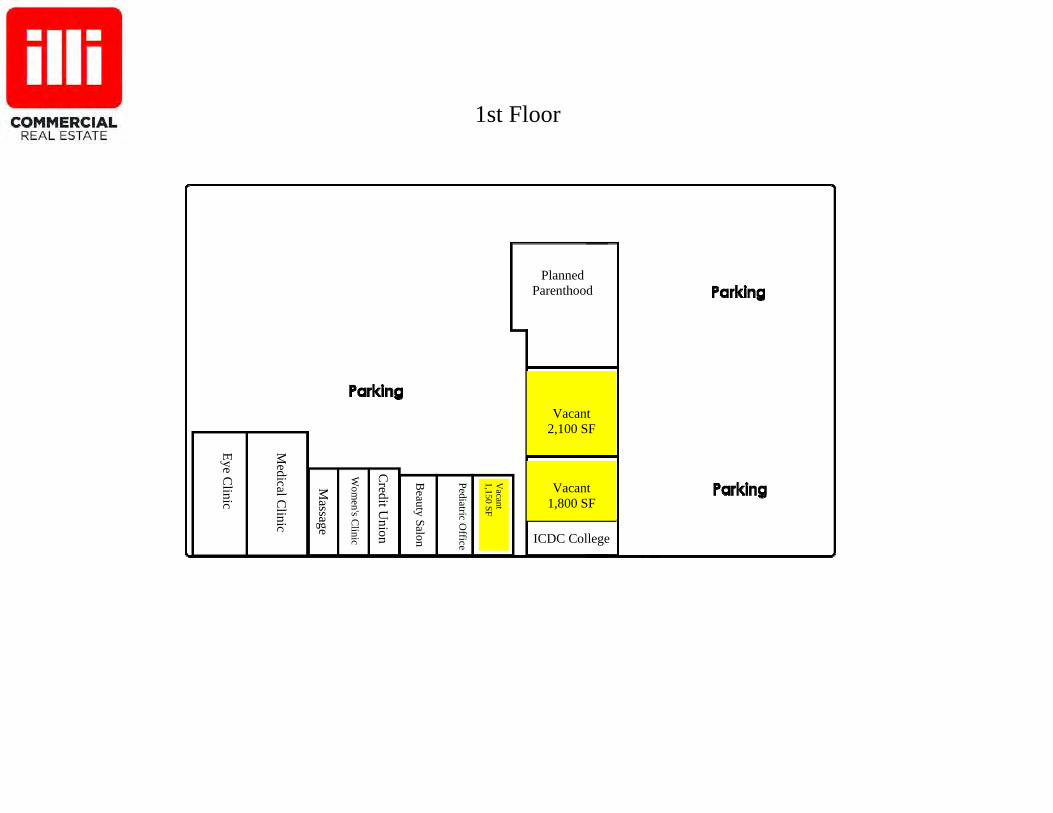
Eye Clinic
Massage
Medical C
linic
Wom
en's Clinic
Vacant 2,100 SF
ICDC College
Vacant
1,800 SF
Credit U
nion
Pediatric Office
Vacant
1,150 SF
Beauty Salon
Planned Parenthood
1st Floor
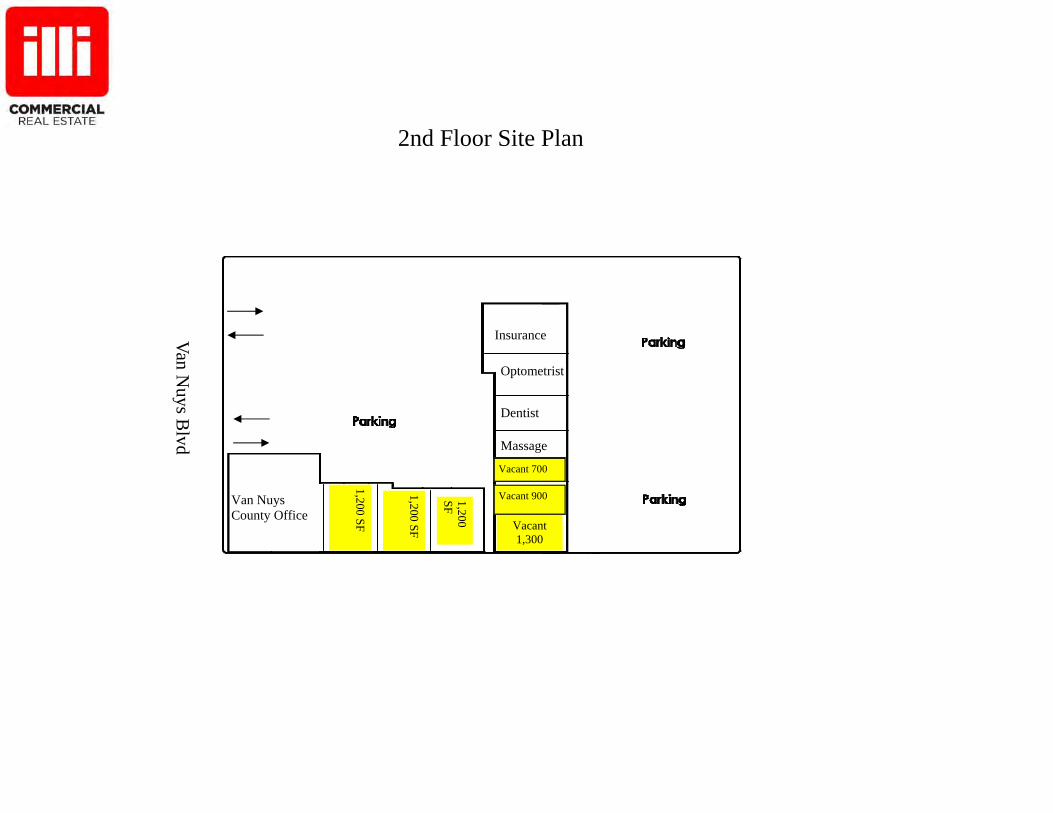
2nd Floor Site Plan
Insurance
Optometrist
Dentist
Massage
Vacant 1,300
Vacant 700
Vacant 900 Van Nuys County Office
1,200 SF
1,200 SF
1,200 SF
Van Nuys B
lvd
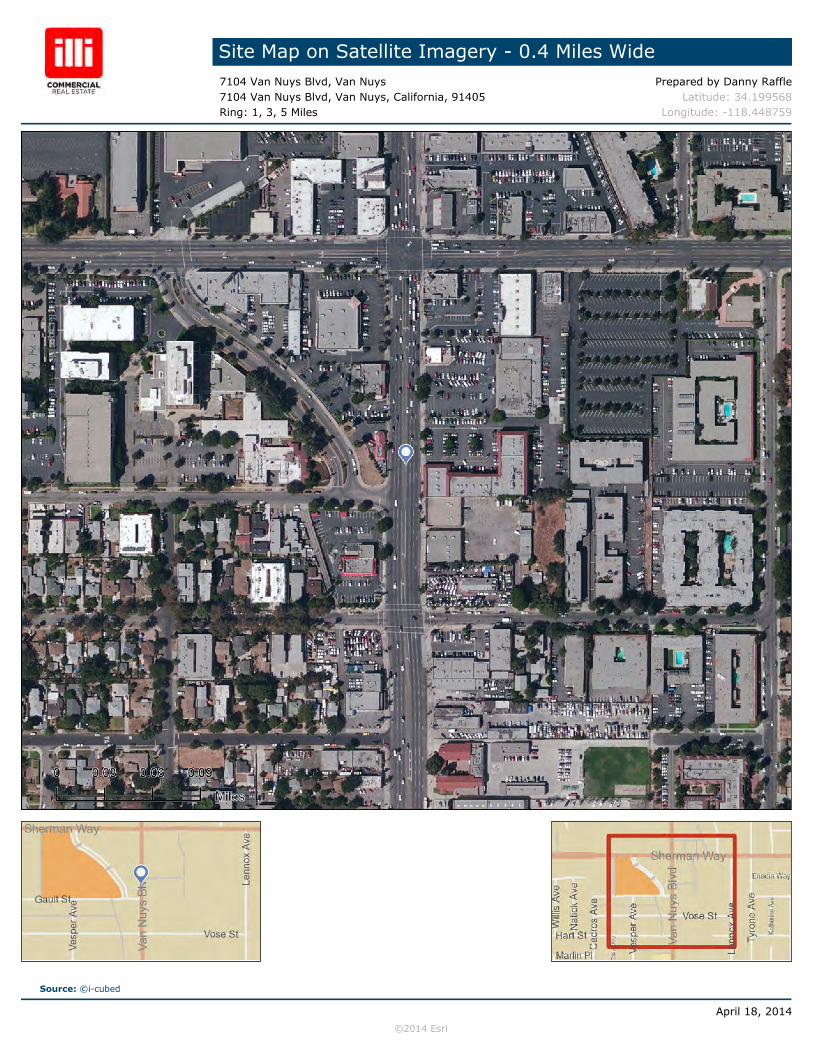
Site Map on Satellite Imagery - 0.4 Miles Wide7104 Van Nuys Blvd, Van Nuys Prepared by Danny Raffle7104 Van Nuys Blvd, Van Nuys, California, 91405 Latitude: 34.199568Ring: 1, 3, 5 Miles Longitude: -118.448759
April 18, 2014
©2014 Esri
Source: ©i-cubed
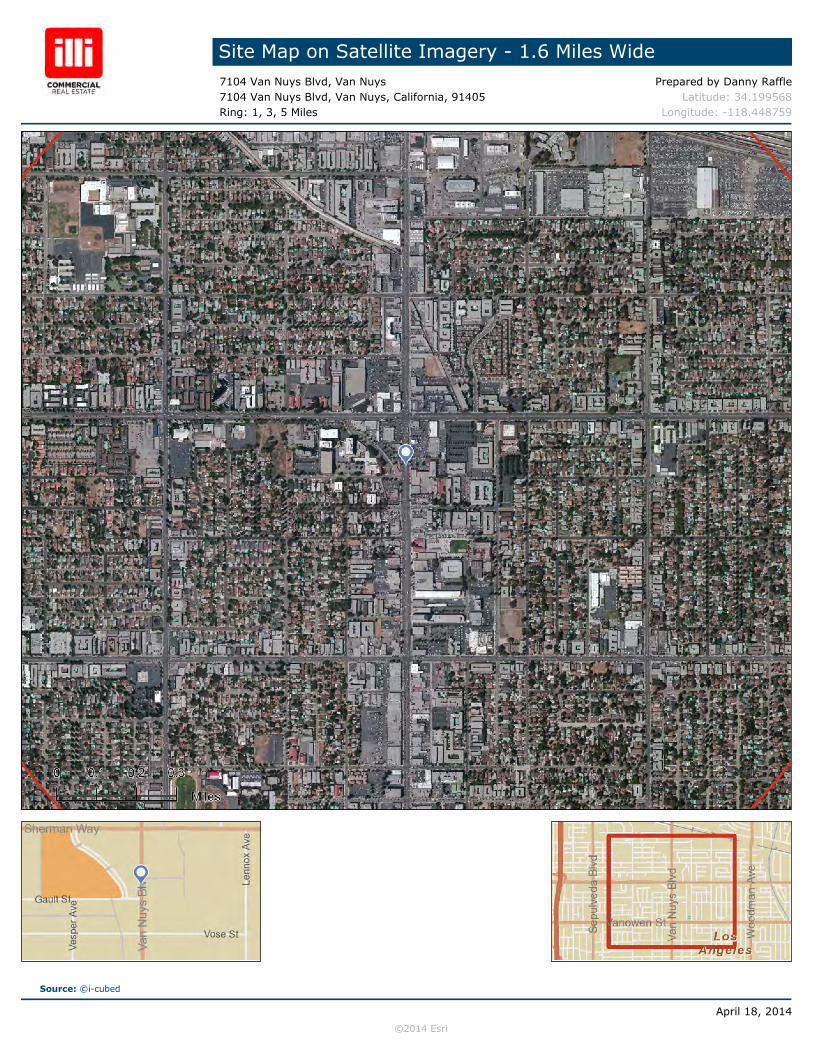
Site Map on Satellite Imagery - 1.6 Miles Wide7104 Van Nuys Blvd, Van Nuys Prepared by Danny Raffle7104 Van Nuys Blvd, Van Nuys, California, 91405 Latitude: 34.199568Ring: 1, 3, 5 Miles Longitude: -118.448759
April 18, 2014
©2014 Esri
Source: ©i-cubed
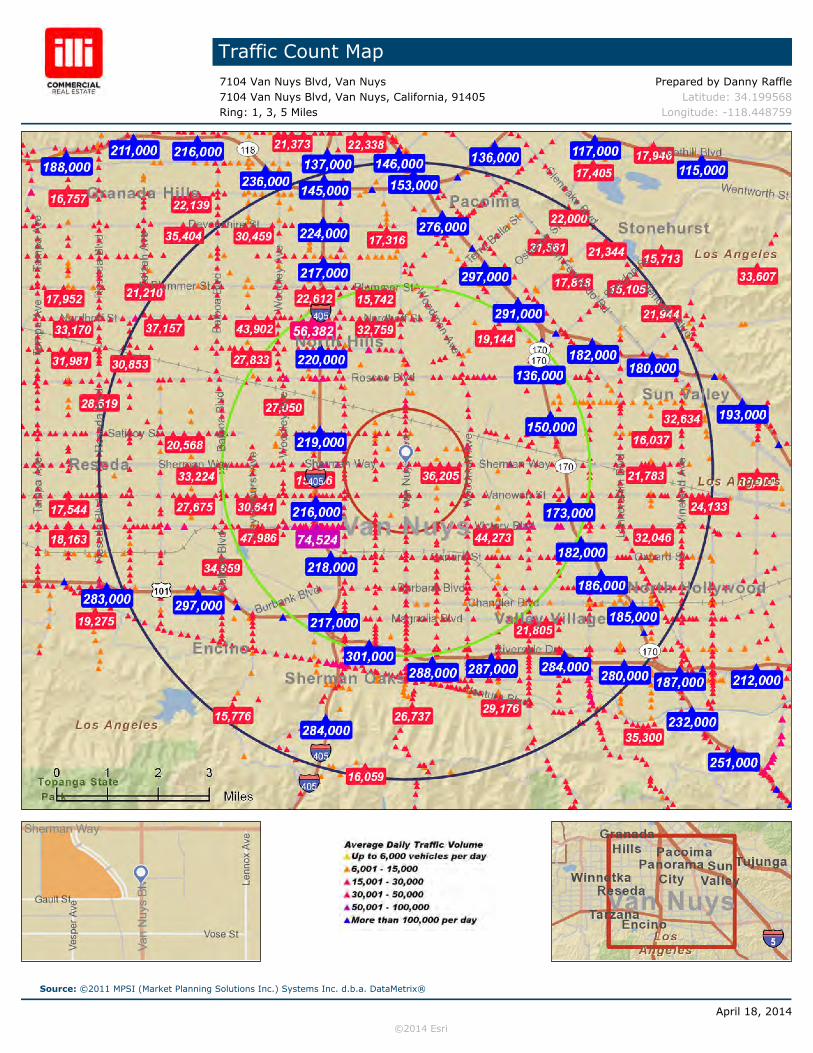
Traffic Count Map7104 Van Nuys Blvd, Van Nuys Prepared by Danny Raffle7104 Van Nuys Blvd, Van Nuys, California, 91405 Latitude: 34.199568Ring: 1, 3, 5 Miles Longitude: -118.448759
April 18, 2014
©2014 Esri
Source: ©2011 MPSI (Market Planning Solutions Inc.) Systems Inc. d.b.a. DataMetrix®
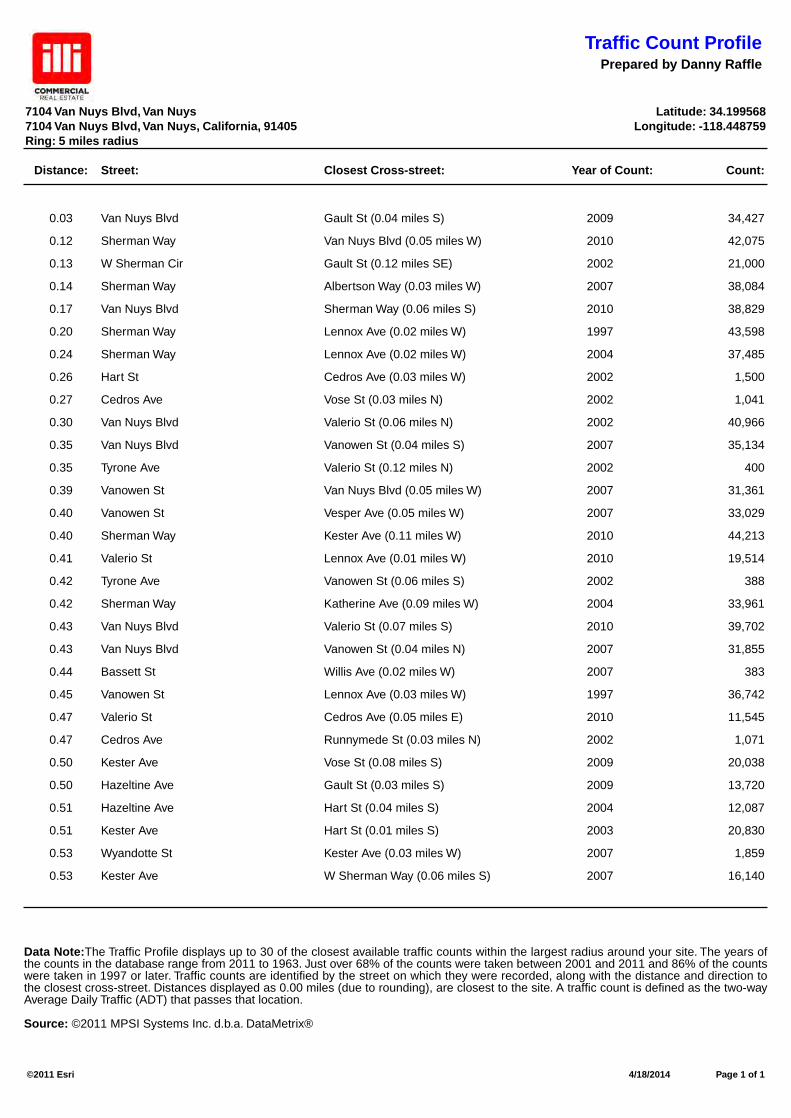
Traffic Count ProfilePrepared by Danny Raffle
©2011 Esri 4/18/2014 Page 1 of 1
7104 Van Nuys Blvd, Van Nuys Latitude: 34.1995687104 Van Nuys Blvd, Van Nuys, California, 91405 Longitude: -118.448759Ring: 5 miles radius
Distance: Street: Closest Cross-street: Year of Count: Count:
0.03 Van Nuys Blvd Gault St (0.04 miles S) 2009 34,427
0.12 Sherman Way Van Nuys Blvd (0.05 miles W) 2010 42,075
0.13 W Sherman Cir Gault St (0.12 miles SE) 2002 21,000
0.14 Sherman Way Albertson Way (0.03 miles W) 2007 38,084
0.17 Van Nuys Blvd Sherman Way (0.06 miles S) 2010 38,829
0.20 Sherman Way Lennox Ave (0.02 miles W) 1997 43,598
0.24 Sherman Way Lennox Ave (0.02 miles W) 2004 37,485
0.26 Hart St Cedros Ave (0.03 miles W) 2002 1,500
0.27 Cedros Ave Vose St (0.03 miles N) 2002 1,041
0.30 Van Nuys Blvd Valerio St (0.06 miles N) 2002 40,966
0.35 Van Nuys Blvd Vanowen St (0.04 miles S) 2007 35,134
0.35 Tyrone Ave Valerio St (0.12 miles N) 2002 400
0.39 Vanowen St Van Nuys Blvd (0.05 miles W) 2007 31,361
0.40 Vanowen St Vesper Ave (0.05 miles W) 2007 33,029
0.40 Sherman Way Kester Ave (0.11 miles W) 2010 44,213
0.41 Valerio St Lennox Ave (0.01 miles W) 2010 19,514
0.42 Tyrone Ave Vanowen St (0.06 miles S) 2002 388
0.42 Sherman Way Katherine Ave (0.09 miles W) 2004 33,961
0.43 Van Nuys Blvd Valerio St (0.07 miles S) 2010 39,702
0.43 Van Nuys Blvd Vanowen St (0.04 miles N) 2007 31,855
0.44 Bassett St Willis Ave (0.02 miles W) 2007 383
0.45 Vanowen St Lennox Ave (0.03 miles W) 1997 36,742
0.47 Valerio St Cedros Ave (0.05 miles E) 2010 11,545
0.47 Cedros Ave Runnymede St (0.03 miles N) 2002 1,071
0.50 Kester Ave Vose St (0.08 miles S) 2009 20,038
0.50 Hazeltine Ave Gault St (0.03 miles S) 2009 13,720
0.51 Hazeltine Ave Hart St (0.04 miles S) 2004 12,087
0.51 Kester Ave Hart St (0.01 miles S) 2003 20,830
0.53 Wyandotte St Kester Ave (0.03 miles W) 2007 1,859
0.53 Kester Ave W Sherman Way (0.06 miles S) 2007 16,140
Data Note:The Traffic Profile displays up to 30 of the closest available traffic counts within the largest radius around your site. The years of the counts in the database range from 2011 to 1963. Just over 68% of the counts were taken between 2001 and 2011 and 86% of the counts were taken in 1997 or later. Traffic counts are identified by the street on which they were recorded, along with the distance and direction to the closest cross-street. Distances displayed as 0.00 miles (due to rounding), are closest to the site. A traffic count is defined as the two-way Average Daily Traffic (ADT) that passes that location.
Source: ©2011 MPSI Systems Inc. d.b.a. DataMetrix®
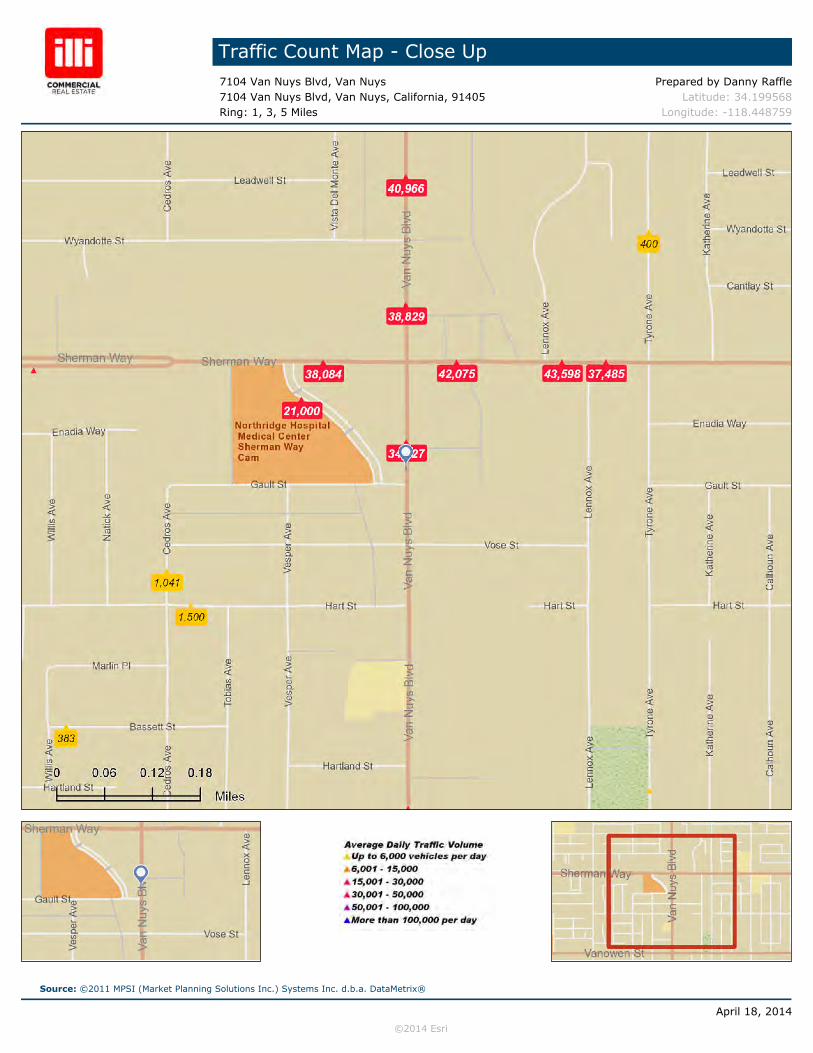
Traffic Count Map - Close Up7104 Van Nuys Blvd, Van Nuys Prepared by Danny Raffle7104 Van Nuys Blvd, Van Nuys, California, 91405 Latitude: 34.199568Ring: 1, 3, 5 Miles Longitude: -118.448759
April 18, 2014
©2014 Esri
Source: ©2011 MPSI (Market Planning Solutions Inc.) Systems Inc. d.b.a. DataMetrix®
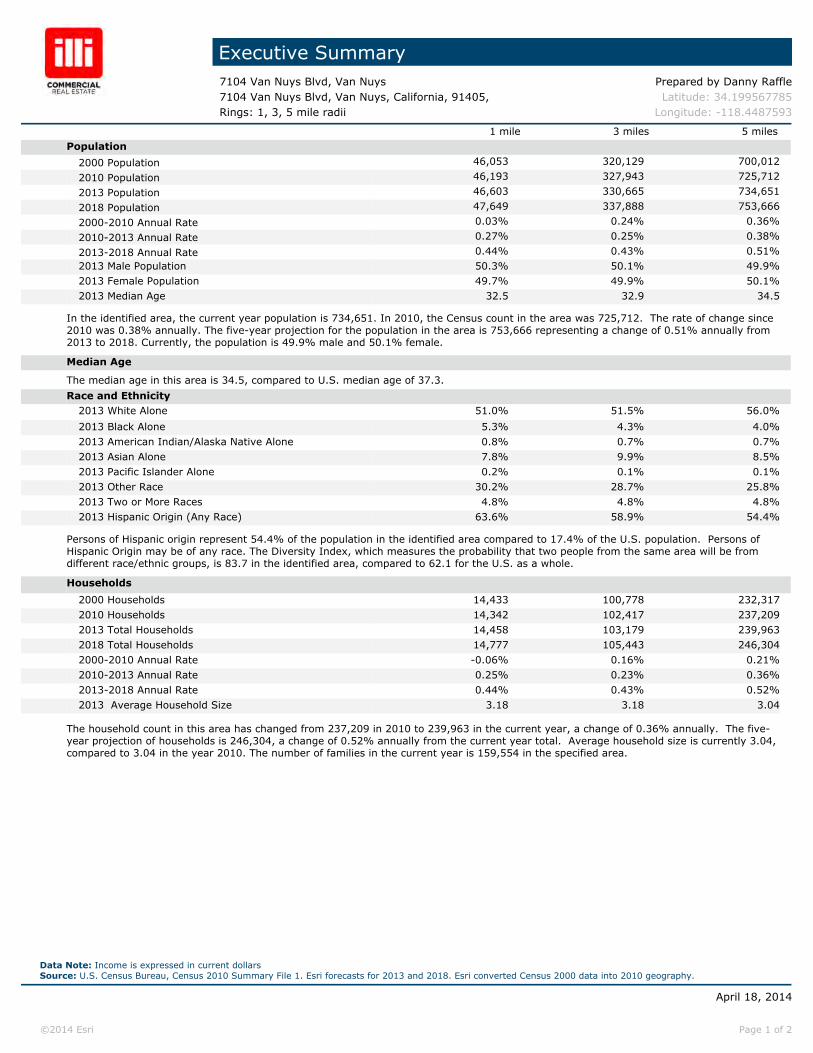
Executive Summary7104 Van Nuys Blvd, Van Nuys Prepared by Danny Raffle7104 Van Nuys Blvd, Van Nuys, California, 91405, Latitude: 34.199567785Rings: 1, 3, 5 mile radii Longitude: -118.4487593
1 mile 3 miles 5 milesPopulation
2000 Population 46,053 320,129 700,012
2010 Population 46,193 327,943 725,712
2013 Population 46,603 330,665 734,651
2018 Population 47,649 337,888 753,666
2000-2010 Annual Rate 0.03% 0.24% 0.36%
2010-2013 Annual Rate 0.27% 0.25% 0.38%
2013-2018 Annual Rate 0.44% 0.43% 0.51%2013 Male Population 50.3% 50.1% 49.9%2013 Female Population 49.7% 49.9% 50.1%2013 Median Age 32.5 32.9 34.5
In the identified area, the current year population is 734,651. In 2010, the Census count in the area was 725,712. The rate of change since2010 was 0.38% annually. The five-year projection for the population in the area is 753,666 representing a change of 0.51% annually from2013 to 2018. Currently, the population is 49.9% male and 50.1% female.
Median Age
The median age in this area is 34.5, compared to U.S. median age of 37.3.
Race and Ethnicity2013 White Alone 51.0% 51.5% 56.0%
2013 Black Alone 5.3% 4.3% 4.0%2013 American Indian/Alaska Native Alone 0.8% 0.7% 0.7%2013 Asian Alone 7.8% 9.9% 8.5%2013 Pacific Islander Alone 0.2% 0.1% 0.1%2013 Other Race 30.2% 28.7% 25.8%2013 Two or More Races 4.8% 4.8% 4.8%2013 Hispanic Origin (Any Race) 63.6% 58.9% 54.4%
Persons of Hispanic origin represent 54.4% of the population in the identified area compared to 17.4% of the U.S. population. Persons ofHispanic Origin may be of any race. The Diversity Index, which measures the probability that two people from the same area will be fromdifferent race/ethnic groups, is 83.7 in the identified area, compared to 62.1 for the U.S. as a whole.
Households
2000 Households 14,433 100,778 232,3172010 Households 14,342 102,417 237,2092013 Total Households 14,458 103,179 239,9632018 Total Households 14,777 105,443 246,3042000-2010 Annual Rate -0.06% 0.16% 0.21%2010-2013 Annual Rate 0.25% 0.23% 0.36%2013-2018 Annual Rate 0.44% 0.43% 0.52%2013 Average Household Size 3.18 3.18 3.04
The household count in this area has changed from 237,209 in 2010 to 239,963 in the current year, a change of 0.36% annually. The five-year projection of households is 246,304, a change of 0.52% annually from the current year total. Average household size is currently 3.04,compared to 3.04 in the year 2010. The number of families in the current year is 159,554 in the specified area.
April 18, 2014
©2014 Esri Page 1 of 2
Data Note: Income is expressed in current dollarsSource: U.S. Census Bureau, Census 2010 Summary File 1. Esri forecasts for 2013 and 2018. Esri converted Census 2000 data into 2010 geography.
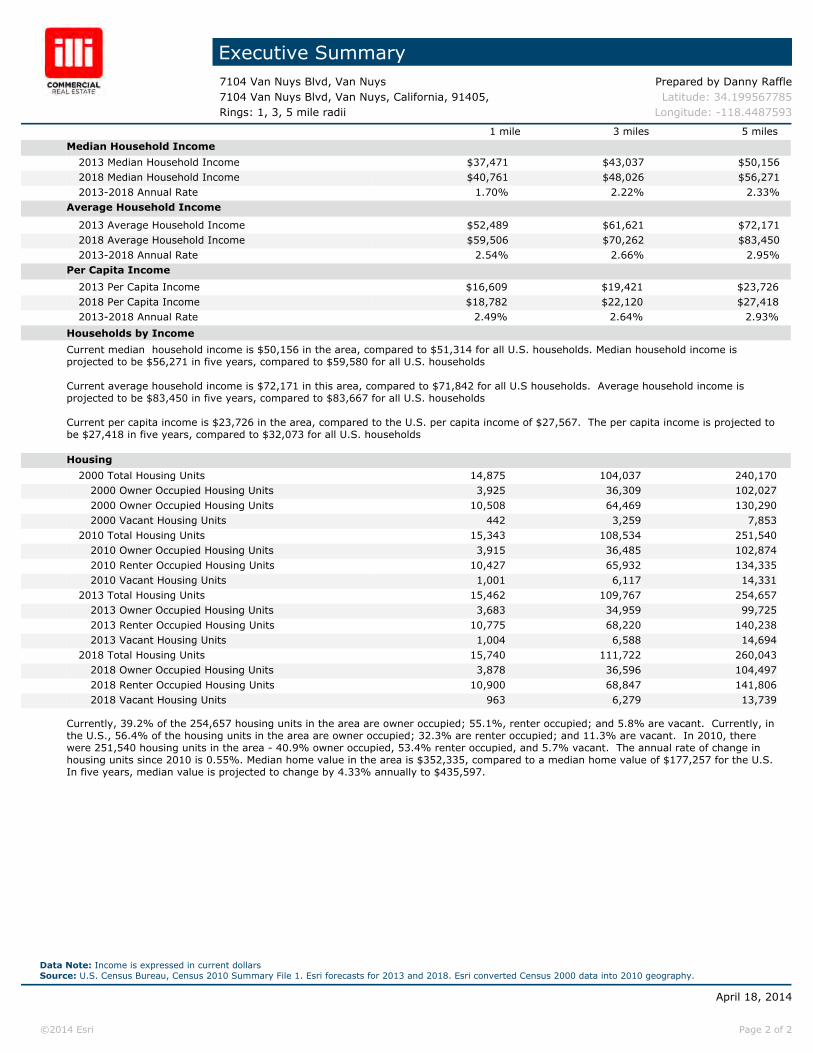
Executive Summary7104 Van Nuys Blvd, Van Nuys Prepared by Danny Raffle7104 Van Nuys Blvd, Van Nuys, California, 91405, Latitude: 34.199567785Rings: 1, 3, 5 mile radii Longitude: -118.4487593
1 mile 3 miles 5 milesMedian Household Income
2013 Median Household Income $37,471 $43,037 $50,1562018 Median Household Income $40,761 $48,026 $56,2712013-2018 Annual Rate 1.70% 2.22% 2.33%
Average Household Income
2013 Average Household Income $52,489 $61,621 $72,1712018 Average Household Income $59,506 $70,262 $83,4502013-2018 Annual Rate 2.54% 2.66% 2.95%
Per Capita Income
2013 Per Capita Income $16,609 $19,421 $23,7262018 Per Capita Income $18,782 $22,120 $27,4182013-2018 Annual Rate 2.49% 2.64% 2.93%
Households by Income
Current median household income is $50,156 in the area, compared to $51,314 for all U.S. households. Median household income isprojected to be $56,271 in five years, compared to $59,580 for all U.S. households
Current average household income is $72,171 in this area, compared to $71,842 for all U.S households. Average household income isprojected to be $83,450 in five years, compared to $83,667 for all U.S. households
Current per capita income is $23,726 in the area, compared to the U.S. per capita income of $27,567. The per capita income is projected tobe $27,418 in five years, compared to $32,073 for all U.S. households Housing
2000 Total Housing Units 14,875 104,037 240,1702000 Owner Occupied Housing Units 3,925 36,309 102,0272000 Owner Occupied Housing Units 10,508 64,469 130,2902000 Vacant Housing Units 442 3,259 7,853
2010 Total Housing Units 15,343 108,534 251,5402010 Owner Occupied Housing Units 3,915 36,485 102,8742010 Renter Occupied Housing Units 10,427 65,932 134,3352010 Vacant Housing Units 1,001 6,117 14,331
2013 Total Housing Units 15,462 109,767 254,6572013 Owner Occupied Housing Units 3,683 34,959 99,7252013 Renter Occupied Housing Units 10,775 68,220 140,2382013 Vacant Housing Units 1,004 6,588 14,694
2018 Total Housing Units 15,740 111,722 260,0432018 Owner Occupied Housing Units 3,878 36,596 104,4972018 Renter Occupied Housing Units 10,900 68,847 141,8062018 Vacant Housing Units 963 6,279 13,739
Currently, 39.2% of the 254,657 housing units in the area are owner occupied; 55.1%, renter occupied; and 5.8% are vacant. Currently, inthe U.S., 56.4% of the housing units in the area are owner occupied; 32.3% are renter occupied; and 11.3% are vacant. In 2010, therewere 251,540 housing units in the area - 40.9% owner occupied, 53.4% renter occupied, and 5.7% vacant. The annual rate of change inhousing units since 2010 is 0.55%. Median home value in the area is $352,335, compared to a median home value of $177,257 for the U.S.In five years, median value is projected to change by 4.33% annually to $435,597.
April 18, 2014
©2014 Esri Page 2 of 2
Data Note: Income is expressed in current dollarsSource: U.S. Census Bureau, Census 2010 Summary File 1. Esri forecasts for 2013 and 2018. Esri converted Census 2000 data into 2010 geography.