SHEAR DATABASE FOR REINFORCED AND PRESTRESSED · PDF fileSHEAR DATABASE FOR REINFORCED AND...
12
VIII International Conference on Fracture Mechanics of Concrete and Concrete Structures FraMCoS-8 J.G.M. Van Mier, G. Ruiz, C. Andrade, R.C. Yu and X.X. Zhang (Eds) 1 SHEAR DATABASE FOR REINFORCED AND PRESTRESSED BEAMS MADE WITH FIBER REINFORCED CONCRETE ESTEFANÍA CUENCA * , PEDRO SERNA * AND GIOVANNI PLIZZARI ** * Universitat Politècnica de València (UPV) Institute of Science and Concrete Technology (ICITECH), Valencia, SPAIN Camí de Vera s/n, 46022 Valencia, Spain e-mail: [email protected]; [email protected]; web page: http://www.icitech.upv.es ** University of Brescia (UNIBS) Department of Civil, Architectural, Environmental and Land Planning Engineering (DICATA) Via Branze, 43, 25123, Brescia, Italy e-mail: [email protected] Key words: Shear behavior, Beams, Fiber Reinforced Concrete, Building Codes Abstract: A total number of 215 structural elements were used to prepare a complete database to analyze the shear behavior and the influence of each parameter on shear out of 363 elements of the experimental database. 148 elements were eliminated for various reasons. Thus, the following items were removed: those with different failure modes to shear, those beams which are not known in some detail, also the beams containing a mixture of more than one fiber type, those for which values of strength are not available and all those elements with ratios a/d smaller than 2.5, where the arching action is dominant [1]. The database is made up of elements from databases of the University of Brescia and of RILEM, in addition to all the shear tests carried out within the Brite/Euram project [2], beams tested by Dupont & Vandewalle [3], other beams [4] and the tests presented in the Ph.D. thesis of Cuenca [5]. The input parameters used were: the shear span-to-depth ratio (a/d); the effective depth (d); the concrete cylinder compressive stress (f c ); the residual flexural tensile strength ( f R3 ) corresponding to a crack mouth opening displacement CMOD=2.5 mm, according to EN 14651 [6]; the longitudinal reinforcement ratio (ρ l ); the average stress acting on the concrete cross-section for an axial force due to prestressing actions (σ c ); the amount of steel fibers (kg/m 3 ) and transverse reinforcement area per unit length (A sα /s). The output value was the safety margin (SM) obtained as V test /V theo (the shear test value divided by the shear theoretical value). The theoretical shear (V theo ) was calculated for each of the beams according to three calculation codes: the Spanish Standard EHE-08 [7], the RILEM approach [8] and the first complete draft of Model Code 2010 [9]. 1 INTRODUCTION After thorough review of the literature on structural elements with shear failure, and after carrying out several experimental programs[5] whose values were compared later with the theoretical values obtained with the three selected Design Codes to calculate shear in elements reinforced with fibers, it was found that it would be useful and also necessary to build a large database of elements failing in shear in order to have a large number of cases to allow a better evaluation of the resisting phenomena and the validity of the building Codes. For this reason, the present paper shows the analysis of that database. The paper will explain how the data were selected and, also, how data were analyzed by separating it into four different clear cases:
Transcript of SHEAR DATABASE FOR REINFORCED AND PRESTRESSED · PDF fileSHEAR DATABASE FOR REINFORCED AND...

VIII International Conference on Fracture Mechanics of Concrete and Concrete Structures
FraMCoS-8
J.G.M. Van Mier, G. Ruiz, C. Andrade, R.C. Yu and X.X. Zhang (Eds)
1
SHEAR DATABASE FOR REINFORCED AND PRESTRESSED BEAMS
MADE WITH FIBER REINFORCED CONCRETE
ESTEFANÍA CUENCA*, PEDRO SERNA
* AND GIOVANNI PLIZZARI
**
* Universitat Politècnica de València (UPV)
Institute of Science and Concrete Technology (ICITECH), Valencia, SPAIN
Camí de Vera s/n, 46022 Valencia, Spain e-mail: [email protected]; [email protected]; web page: http://www.icitech.upv.es
** University of Brescia (UNIBS)
Department of Civil, Architectural, Environmental and Land Planning Engineering (DICATA) Via Branze, 43, 25123, Brescia, Italy
e-mail: [email protected]
Key words: Shear behavior, Beams, Fiber Reinforced Concrete, Building Codes
Abstract: A total number of 215 structural elements were used to prepare a complete database to
analyze the shear behavior and the influence of each parameter on shear out of 363 elements of the
experimental database. 148 elements were eliminated for various reasons. Thus, the following items
were removed: those with different failure modes to shear, those beams which are not known in
some detail, also the beams containing a mixture of more than one fiber type, those for which
values of strength are not available and all those elements with ratios a/d smaller than 2.5, where
the arching action is dominant [1].
The database is made up of elements from databases of the University of Brescia and of RILEM,
in addition to all the shear tests carried out within the Brite/Euram project [2], beams tested by
Dupont & Vandewalle [3], other beams [4] and the tests presented in the Ph.D. thesis of Cuenca [5].
The input parameters used were: the shear span-to-depth ratio (a/d); the effective depth (d); the
concrete cylinder compressive stress (fc); the residual flexural tensile strength (fR3) corresponding to
a crack mouth opening displacement CMOD=2.5 mm, according to EN 14651 [6]; the longitudinal
reinforcement ratio (ρl); the average stress acting on the concrete cross-section for an axial force
due to prestressing actions (σc); the amount of steel fibers (kg/m3) and transverse reinforcement area
per unit length (Asα/s). The output value was the safety margin (SM) obtained as Vtest/Vtheo (the shear
test value divided by the shear theoretical value). The theoretical shear (Vtheo) was calculated for
each of the beams according to three calculation codes: the Spanish Standard EHE-08 [7], the
RILEM approach [8] and the first complete draft of Model Code 2010 [9].
1 INTRODUCTION
After thorough review of the literature on
structural elements with shear failure, and after
carrying out several experimental programs[5]
whose values were compared later with the
theoretical values obtained with the three
selected Design Codes to calculate shear in
elements reinforced with fibers, it was found
that it would be useful and also necessary to
build a large database of elements failing in
shear in order to have a large number of cases
to allow a better evaluation of the resisting
phenomena and the validity of the building
Codes. For this reason, the present paper
shows the analysis of that database.
The paper will explain how the data were
selected and, also, how data were analyzed by
separating it into four different clear cases:

Estefanía Cuenca, Pedro Serna and Giovanni Plizzari
2
Case 1 concrete beams without any shear
reinforcement (neither fibers nor stirrups);
Case 2 beams with only stirrups (no fibers);
Case 3 beams with only fibers (no stirrups);
Case 4 beams with fibers and stirrups.
In each of these four cases the influence of
the following parameters is analyzed: d, a/d,
fcm, fR3, ρ, σc, and amount of fibers and stirrups.
2 DATA SELECTION
A total number of 215 structural elements
were used to prepare a complete database to
analyze the shear behavior and the influence of
each parameter on shear, out of 363 elements
of the experimental database. As it can be
noticed, 148 elements were eliminated for
various reasons. In particular, the following
data were removed:
1. beams with different failure modes in shear;
2. beams which are not known in some detail;
3. beams containing a mixture of more than
one fiber type;
4. beams where are not available any value of
strength;
5. beams with a/d ratios smaller than 2.5, in
which arching action is dominant [10], [11],
[12], [13].
The present database was made by using
data databases of the University of Brescia
(Italy) and of RILEM, in addition to all the
elements tested in shear in the Brite/Euram
project [2], to beams tested by Dupont &
Vandewalle [3], to other beams [4] as well as
beams tested within the PhD thesis of Cuenca
and presented in other papers ([5], [14], [15],
[16], [4], [17], [18], [19], [20]).
The input parameters used were: the shear
span-to-depth ratio (a/d); the effective depth
(d); the concrete cylindrical compressive
strength (fc); the residual flexural tensile
strength (fR3) corresponding to a crack mouth
opening displacement CMOD=2.5mm
(according to the Standard EN 14651 [6]); the
reinforcement ratio for longitudinal
reinforcement (ρl); the average stress acting on
the concrete cross-section for an axial force
due to prestressing actions (σc); the amount of
steel fibers (kg/m3) and transverse
reinforcement area per unit length (Asα/s).
The output value is the safety margin (SM)
obtained as Vtest/Vtheo, ehere Vtheo represents the
shear strength determined according to the
considered structural code.
A large shear database has been obtained,
that covers a great interval of the main
parameters influencing shear. Table 1
summarizes the ranges of the different values
used in this shear database.
The theoretical shear (Vtheo) was calculated
according to three structural Codes: the
Spanish Standard EHE08 [7], the RILEM
approach [8] and the first draft of Model Code
2010 [9]. The shear formulations of these
Codes are summarized in Table 2, on the other
hand, limitations that Design Codes impose
are in Table 3.
Table 1: Range of parameters in the complete database
(N=215 elements)
Parameter Min. Max.
d (mm) 102 1440
a/d 2.50 4.69
fcm (MPa) 17 96.34
fR3 (MPa) 0 10.60
Amount of fibers (kg/m3) 0 240
ρ (%) 0.41 5.82
σc (MPa) 0 12
Asα/s (cm2/m) 0 4.90
EHE-08 [7] formulation considers fibers
contribution separately from concrete, which is
based in EC2 [21] while the contribution of the
fibers is based on RILEM [8]. The MC2010
[9] considers Fiber Reinforced Concrete
(FRC) as a composite material where fibers
represent a distributed reinforcement;
contribution that is modeled as a modifier of
the longitudinal reinforcement ratio throughout
a factor that includes the toughness properties
of FRC [12].

Estefanía Cuenca, Pedro Serna and Giovanni Plizzari
3
Table 2: Current Codes shear formulas
Table 3: Parameters for the determination of the shear
strength and their limitations
Common limitations for all Codes:
ξ = 1+√(200/d)≤ 2.0
ρl= (As+Ap)/(bo·d)≤ 0.02
Particular limitations of each Code:
σck=[(Nk+Pk)/(bo·d)]<0.30·fck ≤ 12Mpa (EHE-08)
σck=[(Nk+Pk)/(bo·d)]<0.2·fck (EC2 and MC2010 for FRC)
kf= 1+n·(hf /bo)·(hf/d) ≤1.5 (EHE08 and RILEM)
n=[(bf-bo)/hf]≤3 and n≤(3·bo/hf) (EHE08 and RILEM)
Vcu, min = [(0.075/γc)·ξ3/2·fcv1/2+ 0.15·σck]·bo·d (EHE-08)
Vcu,min=[0.035·ξ3/2·fcv1/2+ 0.15·σck]·bo·d (EC2 & MC2010 for FRC)
0.5 ≤ cotg θ ≤ 2.0 26.57º ≤ θ ≤ 63.43º (EHE-08)
1 ≤ cotg θ ≤ 2.5 22º ≤ θ ≤ 45º (EC2)
β determination (EHE-08):
β= (2·cotg θ -1) / ( 2·cotg θe -1); if 0.5 ≤ cotg θ < cotg θe
β= (cotg θ - 2) / (cotg θe - 2); if cotg θe ≤ cotg θ ≤ 2.0
Parameters influencing Vcu (MC2010):
θ = 29º + 7000·εx
εx=[MEd/z + VEd + 0.5·NEd – Ap·fp0] / [2·(Es·As + Ep·Ap)]
kv=0.4·1300 / [(1 +1500·εx)·(1000 + 0.7·kdg·z)] if ρw=0
kv=0.4 / (1 +1500·εx) if ρw ≥ 0.08·√fck / fyk
3 CASE 1: BEAMS WITHOUT SHEAR
REINFORCEMENT
Table 4 and Table 5 summarize the ranges of
the different parameters used in this case,
referring to reinforced and prestressed beams,
respectively.
Table 4: Range of parameters in the shear database of
reinforced beams made without shear reinforcement (N=37 elements)
Parameter Min. Max. Average CoV
(%)
d (mm) 197 1440 395.38 65.59
a/d 2.50 4.69 3.19 21.61
fcm (MPa) 20 85.57 36.90 34.50
fR3 (MPa) -- -- -- --
Amount of fibers
(kg/m3)
-- -- -- --
ρ (%) 0.99 3.72 1.76 47.47
σc (MPa) -- -- -- --
Asα/s (cm2/m) -- -- -- --
Table 5: Range of parameters in the shear database of prestressed beams made without shear reinforcement
(N=6 elements)
Parameter Min. Max. Average CoV
(%)
d (mm) 226.47 550 282.16 42.46
a/d 3.27 4.30 380 11.72
fcm (MPa) 43.80 54.20 50.25 9.30
fR3 (MPa) -- -- -- --
Amount of
fibers (kg/m3)
-- -- -- --
ρ (%) 0.41 3.03 1.06 87.28
σc (MPa) 2.87 10.18 4.77 54.24
Asα/s (cm2/m) -- -- -- --
3.1 Influence of the a/d ratio
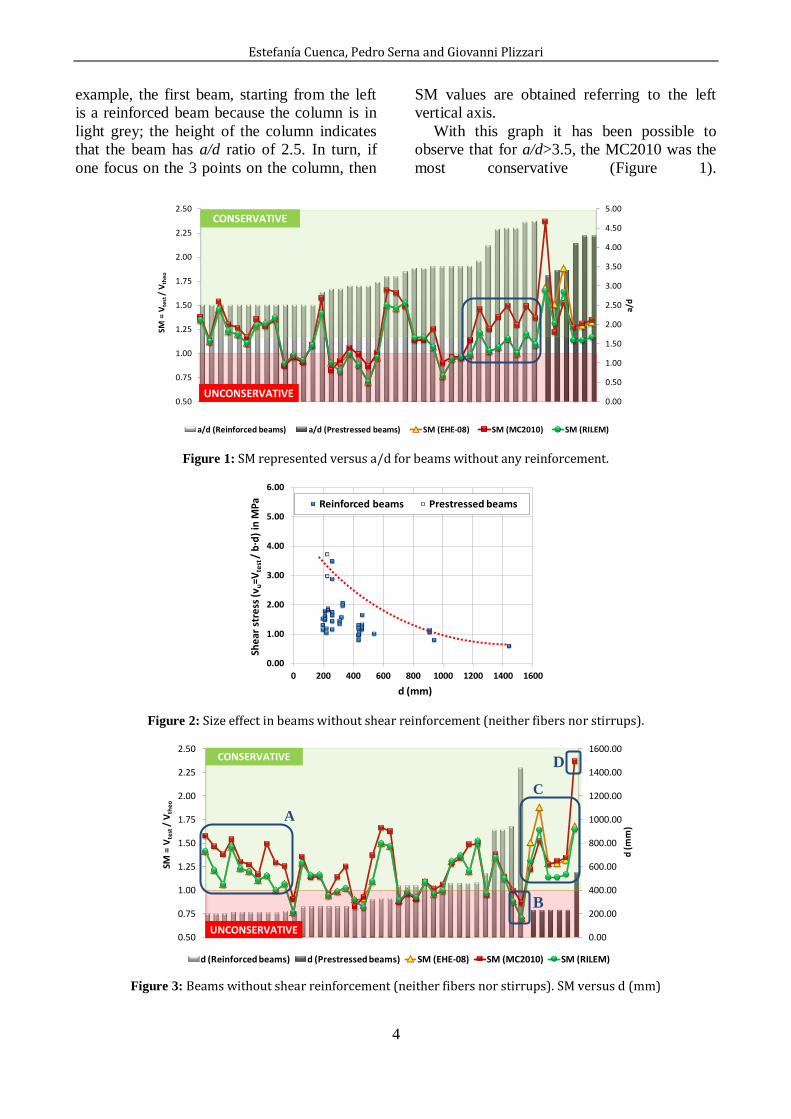
In Figure 1, Safety Margins (SMs) are
represented for each beam of Case 1. Each
column represents one beam of this subset and
on each column there are three points
corresponding to its SM according to Codes
EHE08, MC2010 and RILEM. Beams are
sorted in ascending order according to their
value of a/d (right vertical axis), so that the
height of each column indicates the value of
a/d of each beam (as can be read on the right
vertical axis). On the other hand, SM values of
each beam can be obtained through the left
vertical axis. Also, reinforced beams are
represented by light grey columns (left side of
the graph), while dark grey columns are
prestressed beams (right side of the graph).
Moreover, the upper side of the graph (green
shaded) represents the area in which Codes are
conservative (SM> 1), whereas the lower side
area (red shaded) refers to SM <1. For
Code Theoretical Shear (V) Parameters
Concrete (Vcu) and fiber contribution (Vfu)
to shear resistance
No
TR
With
TR
EH
E-0
8
Vcu =[(C1/γc)·ξ·(100·ρl· fcv)1/3
+ 0.15·σck]·β·bo·d
Vfu =kf·0.7·ξ·0.5·0.33·(fR3k/γc)·bo·d
C1=
0.1
8 ;
β=
1
C1=
0.1
5 ;
β=
(*
)
EC
-2 +
RIL
EM
Vcu =[(C1/γc)·ξ·(100·ρl· fck)1/3
+ 0.15·σck]·β·bo·d
Vfu =kf·0.7·ξ·0.18·(fR4k/γc)·bo·d
β=
0 ;
Vcu
=0
MC
20
10
MC2010 (Without fibers):
Vcu =kv· (√fck /γc)·z·bo (Level III Approximation)
MC2010 (With fibers):
Vcu + Vfu = [(C1/γc)·ξ·(100·ρl· C2)1/3
+0.15·σck]·β·bo·d
C2=(1+7.5·(fFtuk/fctk))·fck
C1=
0.1
8 ;
β=
1
Estefanía Cuenca, Pedro Serna and Giovanni Plizzari
4
example, the first beam, starting from the left
is a reinforced beam because the column is in
light grey; the height of the column indicates
that the beam has a/d ratio of 2.5. In turn, if
one focus on the 3 points on the column, then
SM values are obtained referring to the left
vertical axis.
With this graph it has been possible to
observe that for a/d>3.5, the MC2010 was the
most conservative (Figure 1).
Figure 1: SM represented versus a/d for beams without any reinforcement.
Figure 2: Size effect in beams without shear reinforcement (neither fibers nor stirrups).
Figure 3: Beams without shear reinforcement (neither fibers nor stirrups). SM versus d (mm)
0.00
0.50
1.00
1.50
2.00
2.50
3.00
3.50
4.00
4.50
5.00
0.50
0.75
1.00
1.25
1.50
1.75
2.00
2.25
2.50
a/d
SM =
Vte
st /
Vth
eo
Case 1 (NEITHER FIBERS NOR STIRRUPS). Beams ordered by a/d
a/d (Reinforced beams) a/d (Prestressed beams) SM (EHE-08) SM (MC2010) SM (RILEM)
CONSERVATIVE
UNCONSERVATIVE
CONSERVATIVE
UNCONSERVATIVE
0.00
1.00
2.00
3.00
4.00
5.00
6.00
0 200 400 600 800 1000 1200 1400 1600
She
ar s
tre
ss (
v u=V
test
/ b
·d)
in M
Pa
d (mm)
Reinforced beams Prestressed beams
0.00
200.00
400.00
600.00
800.00
1000.00
1200.00
1400.00
1600.00
0.50
0.75
1.00
1.25
1.50
1.75
2.00
2.25
2.50
d (m
m)
SM =
Vte
st/
Vth
eo
Case 1 (NEITHER FIBERS NOR STIRRUPS). Beams ordered by d
d (Reinforced beams) d (Prestressed beams) SM (EHE-08) SM (MC2010) SM (RILEM)
CONSERVATIVE
UNCONSERVATIVE
A
B
D
C

VIII International Conference on Fracture Mechanics of Concrete and Concrete Structures
FraMCoS-8
J.G.M. Van Mier, G. Ruiz, C. Andrade, R.C. Yu and X.X. Zhang (Eds)
1
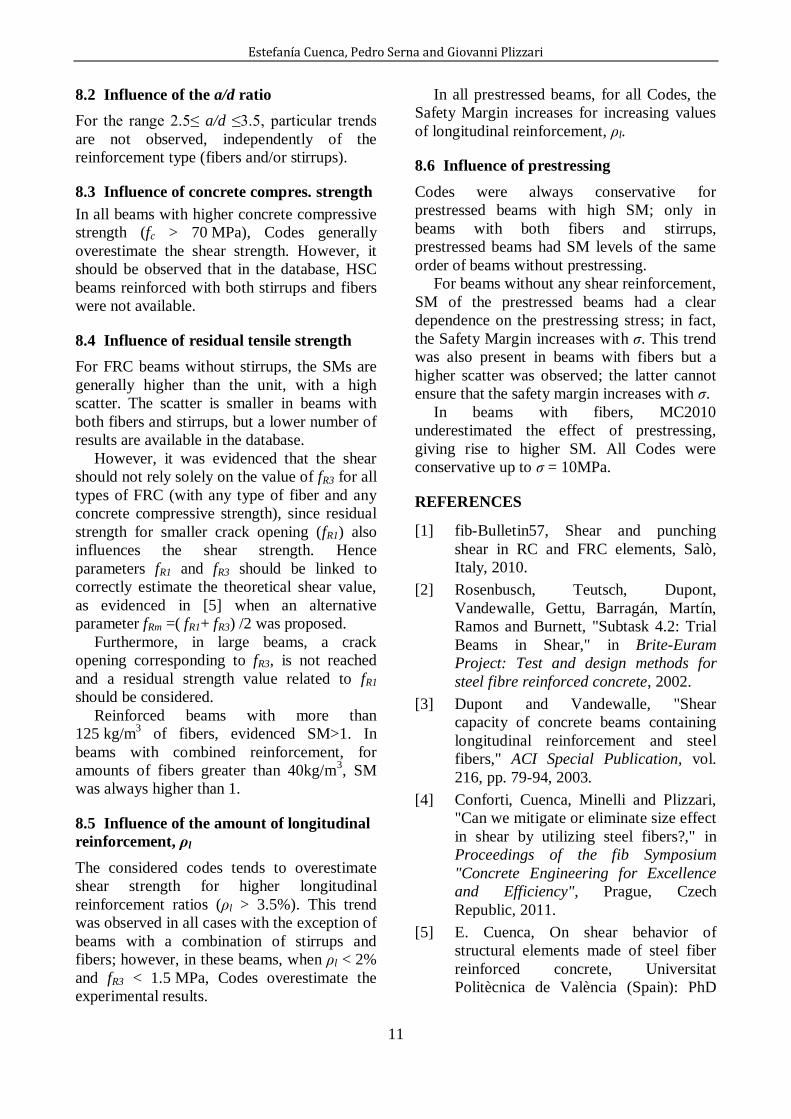
3.2 Influence of effective depth d.Size effect
If experimental shear stress (vu=Vtest/b·d) is
represented versus effective depth (d), a clear
tendency (size effect) is observed, as expected;
in fact, shear stress decreased when effective
depth increase (Figure 2).
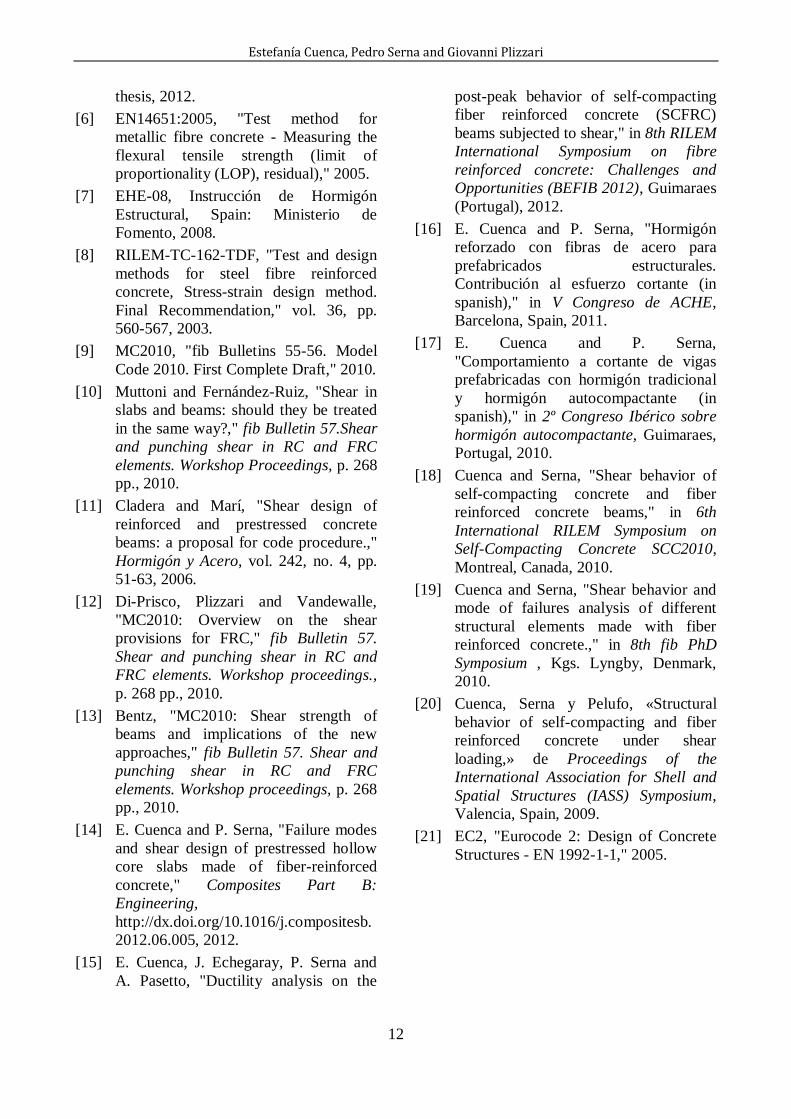
It can be also observed that, when
d > 900mm (specifically d=1440mm in this
case), all Codes are unsafe (Figure 3). On the
other hand, for d < 900mm, all Codes give
similar values.
Figure 3 also shows that all Codes are
conservative for d < 200mm, although
MC2010 underestimates the effect of the
effective depth (d) in this range (see square A,
in Figure 3). Codes are unconservative for
reinforced beams with d > 900mm (see square
B, in Figure 3). Prestressed beams are always
conservative for all Codes (see square C, in
Figure 3). Finally it is noted that, for one of the
prestressed beams, the MC2010 gives higher
SM, it appears that the MC2010
underestimates the effect of prestressing, as
discussed below (see square D, in Figure 3).
3.3 Influence of the amount of longitudinal
reinforcement, ρl
In prestressed beams without any shear
reinforcement, SM increase when increase ρl
for ρl ≤ 2 %. When ρl >>2 %, SM for MC2010
beams increases quickly (Figure 4).
3.4 Influence of the stress due to the
prestressing actions, σc
Prestressed beams are always safe according to
all Codes considered herein (Figure 5).
4 CASE 2: BEAMS WITH STIRRUPS
With respect to the a/d ratio, safety margins
(SM) do not show any trend within the range
studied (2.5 ≤ a/d ≤ 3.5).
In the range (400 < d < 900mm) it is
observed that SM increases with increasing
values of the effective depth (d).
For beams with fc>70MPa, SM are
unconservative; however, since there are two
reinforced beams with fc >70MPa, these values
are not sufficient to ensure this tendency.
Referring to the amount of longitudinal
reinforcement (ρl) and its influence on SM, no
trends are detected; it is only observed an
increasing shear stress with the increase of ρl.
No clear trends are obtained on the
influence of the transverse reinforcement area
(Asα/s) on the shear stress or SM.
5 CASE 3: BEAMS WITH FIBERS
Table 6 and Table 7 summarize the ranges of
the different parameters used in beams only
reinforced with fibers, referring to reinforced
and prestressed beams, respectively.
Table 6: Range of parameters in the shear database of beams reinforced only with fibers (N=102)
Parameter Min. Max. Average CoV
(%)
d (mm) 102 1440 360.80 59.59
a/d 2.50 4.69 3.24 18.60
fcm (MPa) 17.00 96.34 38.86 41.32
fR3 (MPa) 1.22 10.60 3.65 49.24
Amount of
fibers (kg/m3)
15 240 63.31 66.33
ρ (%) 0.99 3.72 2.23 39.80
σc (MPa) -- -- -- --
Asα/s (cm2/m) -- -- -- --
Table 7: Range of parameters in shear database of
prestressed beams with only fibers (N=26)
Parameter Min. Max. Average CoV
(%)
d (mm) 226.47 738.89 440.93 48.79
a/d 2.84 4.40 3.40 11.15
fcm (MPa) 35.90 77.00 55.38 22.78
fR3 (MPa) 2.83 8.61 4.95 39.19
Amount of
fibers (kg/m3)
50 70 55 12.61
ρ (%) 0.41 5.82 2.23 92.52
σc (MPa) 2.87 12.00 7.16 50.05
Asα/s (cm2/m) -- -- -- --

VIII International Conference on Fracture Mechanics of Concrete and Concrete Structures
FraMCoS-8
J.G.M. Van Mier, G. Ruiz, C. Andrade, R.C. Yu and X.X. Zhang (Eds)
1
Figure 4: Beams without shear reinforcement. SM represented versus ρ (%)
Figure 5: SMs represented versus σc (MPa) for beams without shear reinforcement
5.1. Influence of the residual tensile strength
(CMOD=2.5mm), fR3
Reinforced beams with fR3>5 MPa presented
low SM.
Shear stresses increases when fR3 also
increases for both, reinforced and prestressed
beams. It can be observed that the slopes are
different between reinforced and prestressed
beams, due to the effect of prestressing which
also produce higher shear stresses (Figure 6).
Figure 6: Experimental shear stress versus fR3 for beams reinforced only with fibers
0.00
0.50
1.00
1.50
2.00
2.50
3.00
3.50
4.00
0.50
0.75
1.00
1.25
1.50
1.75
2.00
2.25
2.50
ρ(%
)
SM =
Vte
st/
Vth
eo
Case 1 (NEITHER FIBERS NOR STIRRUPS). Beams ordered by ρ
rho (Reinforced beams) rho (Prestressed beams) SM (EHE-08) SM (MC2010) SM (RILEM)
CONSERVATIVE
UNCONSERVATIVE
0.0
1.0
2.0
3.0
4.0
5.0
6.0
7.0
8.0
9.0
10.0
11.0
12.0
0.5
0.8
1.0
1.3
1.5
1.8
2.0
2.3
2.5
σ(M
Pa)
SM
sigma (Prestressed beams) SM (EHE-08) SM (MC2010) SM (RILEM)
CONSERVATIVE
UNCONSERVATIVE
0.00
2.00
4.00
6.00
8.00
10.00
12.00
0.00 2.00 4.00 6.00 8.00 10.00 12.00
She
ar s
tre
ss (
v u)
in M
Pa
fR3 (MPa)
Reinforced beams Prestressed beams

Estefanía Cuenca, Pedro Serna and Giovanni Plizzari
7
5.2. Influence of longitudinal reinforcement
In Figure 7, experimental shear stresses are
plotted versus the longitudinal reinforcement
percentage. As it can be observed, no trend is
detected in reinforced beams while, in
prestressed beams the shear stress increases
with ρl.
Figure 7: Experimental shear stress versus ρl (%) for
beams reinforced only with fibers
In Figure 8, SM of all studied Codes (EHE,
MC2010 and RILEM) are plotted versus ρl for
all beams.
Some reinforced beams (see square A in
Figure 8) show high SMs; the reason is that
these beams have a real value of ρl greater than
2% (the exact value is unknown), but the data
come from elements of the database of other
Authors. Therefore, the calculations are using
a value lower than the actual ρl, resulting in a
lower predicted value.
In RC, when ρl ≥ 3%, SMs for all Codes
reduce (square B in Figure 8), when ρl
increases. In prestressed beams, when ρl
increases, SM also increases; however, when
ρl ≥5%, MC2010 underestimates the effect of
prestressing (square C in Figure 8).
5.3. Influence of prestressing
In general, it is observed that RILEM & EHE
are most balanced for all levels of fc and σc
whereas MC2010 is more conservative for
high levels of fc and σc.
The first prestressed elements correspond to
hollow core slabs (square A in Figure 9). One
beam (dashed line square in Figure 9) has a
clearly lower value of SM than its analogous
beam (square B in Figure 9), this is because
the beam has a flange width (bf =260mm)
much lower than its analogous (bf =400-
600 mm). Therefore, RILEM & EHE codes,
which take into account the contribution of the
flange width in beams reinforced with fibers,
are overestimating the contribution of a flange
which is very small. In beams with flanges of
considerable size (bf > 400mm), MC2010
gives higher SM values than the other two
codes, which means that determines a lower
shear theoretical value since it neglects the
contribution of flanges to shear (flanges factor,
kf, was not applied, Table 2).
5.4. Influence of the amount of fibers
Reinforced and prestressed beams with fibers
are always safe (SM>1) for all Codes,
according to this database, when the amount of
fibers is greater than 125 kg/m3 (Figure 10).
5.5. Codes for beams with only fibers
Table 8 and Table 9 show that, for the beams
reinforced with fibers, MC2010 presents the
greater CoV (%) but, it is the safest Code, with
the highest value of 5th
percentile. Codes are
safer for prestressed beams.
Table 8: Summary of statistics of RC beams with fibers
Reinforced beams
(Beams with fibers)
EHE-08 MC2010 RILEM
Minimum 0.62 0.73 0.59
Maximum 1.87 2.36 1.79
Average 1.17 1.25 1.13
Standard deviation 0.26 0.32 0.26
CoV (%) 22.32 25.81 23.07
5th percentile (%) 0.80 0.84 0.77
95th percentile (%) 1.69 1.87 1.63
6 CASE 4: BEAMS WITH FIBERS AND
STIRRUPS
Table 10 summarizes the ranges of the
different parameters used in beams
transversally reinforced with stirrups and
fibers. Influence on SM due to parameters:
a/d, d, fcm and Asα/s were not detected in this
analysis.
0.00
2.00
4.00
6.00
8.00
10.00
12.00
0.0 0.5 1.0 1.5 2.0 2.5 3.0 3.5 4.0 4.5 5.0 5.5 6.0 6.5
She
ar s
tre
ss (
v u)
in M
Pa
ρ (%)
Reinforced beams Prestressed beams

Estefanía Cuenca, Pedro Serna and Giovanni Plizzari
8
Table 9: Summary of statistics of prestressed beams
only with fibers
Prestressed beams
(Beams with fibers)
EHE-08 MC2010 RILEM
Minimum 0.93 1.05 0.83
Maximum 1.70 2.19 1.73
Average 1.29 1.57 1.20
Standard deviation 0.21 0.32 0.24
CoV (%) 15.92 20.23 20.20
5th percentile (%) 1.04 1.20 0.93
95th percentile (%) 1.64 2.10 1.66
Table 10: Range of parameters in the shear database of
reinforced beams with only fibers (N=19 elements)
Parameter Min. Max. Average CoV
(%)
d (mm) 210 650 293.68 34.65
a/d 3.10 4.50 3.53 10.06
fcm (MPa) 38.00 50.67 45.33 9.91
fR3 (MPa) 1.22 8.54 3.19 56.33
Fibre (kg/m3) 15 60 39.95 42.52
ρ (%) 1.56 3.56 2.99 26.41
σc (MPa) -- -- -- --
Asα/s (cm2/m) 1.40 3.53 2.18 34.50
6.1. Influence of the residual tensile strength
Figure 11 shows the SM of all Codes versus
the residual flexure tensile strength (fR3); it can
be observed that, for reinforced beams, the
most conservative Code is EHE while, for
prestressed beams, the RILEM was the safest;
MC2010 maintained the same SM levels for
reinforced and prestressed beams.
6.2. Influence of the longitud. reinforcement
In Figure 12 it can be observed that reinforced
beams with ρl≤2% and fR3<1.5MPa were all in
the side of unsafety (SM<1). Reinforced
beams with ρl =3.5% had similar levels of SM
for all Codes. The MC2010 was the most
balanced in both: reinforced and prestressed.
Figure 8: Beams transversally reinforced with fibers. SM represented versus ρl (%)
Figure 9: Beams transversally reinforced with fibers. SM represented versus σc and fc (MPa)
0.00
1.00
2.00
3.00
4.00
5.00
6.00
7.00
0.50
0.75
1.00
1.25
1.50
1.75
2.00
2.25
2.50
ρ(%
)
SM =
Vte
st/
Vth
eo
Case 3 (ONLY FIBERS). Beams ordered by ρ
rho (Reinforced beams) rho (Prestressed beams) SM (EHE-08) SM (MC2010) SM (RILEM)
CONSERVATIVE
UNCONSERVATIVE
0.00
2.00
4.00
6.00
8.00
10.00
12.00
14.00
0.50
0.75
1.00
1.25
1.50
1.75
2.00
2.25
2.50
σ(M
Pa)
SM =
Vte
st/
Vth
eo
Case 3 (ONLY FIBERS). Beams ordered by σ
sigma (Prestressed beams) SM (EHE-08)
SM (MC2010) SM (RILEM)
CONSERVATIVE
UNCONSERVATIVE
A
B
C
A
C B

Estefanía Cuenca, Pedro Serna and Giovanni Plizzari
9
Figure 10: Beams transversally reinforced with fibers. SM represented versus fibre content (kg/m3)
Figure 11: Beams transversally reinforced with fibers + stirrups. SM represented versus fR3 (MPa)
Figure 12: Beams transversally reinforced with fibers + stirrups. SM represented versus ρl (%)
6.3. Influence of prestressing
In beams reinforced with fibers and stirrups
there were only two prestressed beams, so they
were not enough to formulate strong
conclusions, but it seemed that, when both
reinforcements were present (fibers and
stirrups), SM for prestressed beams was
higher.
0
50
100
150
200
250
300
0.50
0.75
1.00
1.25
1.50
1.75
2.00
2.25
2.50
kg/m
3o
f fi
ber
s
SM =
Vte
st/
Vth
eo
Case 3 (ONLY FIBERS). Beams ordered by kg/m3 of fibers
kg/m3 (Reinforced beams) kg/m3 (Prestressed beams) SM (EHE-08) SM (MC2010) SM (RILEM)
CONSERVATIVE
UNCONSERVATIVE
0.00
2.00
4.00
6.00
8.00
10.00
12.00
0.50
0.75
1.00
1.25
1.50
1.75
2.00
f R3
(MP
a)
SM =
Vte
st/
Vth
eo
Case 4 (STIRRUPS + FIBERS). Beams ordered by fR3
fr3 (Reinforced beams) fr3 (Prestressed beams) SM (EHE-08) SM (MC2010) SM (RILEM)
CONSERVATIVE
UNCONSERVATIVE
0.00
0.50
1.00
1.50
2.00
2.50
3.00
3.50
4.00
0.50
0.75
1.00
1.25
1.50
1.75
2.00ρ
(%)
SM =
Vte
st/
Vth
eo
Case 4 (STIRRUPS + FIBERS). Beams ordered by ρ
rho (Reinforced beams) rho (Prestressed beams) SM (EHE-08) SM (MC2010) SM (RILEM)
CONSERVATIVE
UNCONSERVATIVE

Estefanía Cuenca, Pedro Serna and Giovanni Plizzari
10
7 SUGGESTIONS FOR DESIGN CODES
After analyzing a large database consisting of
215 structural elements failing in shear, and
determined the expected shear strength
according to three different Design Codes, it
was possible to evidence the role of the simple
parameters and, among these, the ones that
could be better evaluated.
The analyses performed on the database
allowed observing that existing building Codes
can be significantly improved and that every
time new concrete matrices with enhanced
mechanical properties are developed, the
existing Codes may be no longer suitable.
In the present work, some suggestions for
improving existing Codes are made. In
particular:
• codes are not reliable for calculating
shear strength when a/d < 2.5, since the arch
action is very pronounced and shear strength
provided by Codes is markedly conservative.
For proper calculation of these cases, other
methods should be used as the method of struts
and ties.
• The larger the crack width at Ultimate
Limit State (ULS) becomes, the stronger the
size-effect will be. Furthermore, it should be
considered that the size factor is influence by
the FRC toughness [15]. The latter is a
mechanical property that better characterize
the material behavior.
• After analyzing the database, it was
found that, for small elements without stirrups
(eg. d= 200mm), Codes provides conservatives
SMs, and that, for larger elements without
stirrups, Codes overestimates shear strength.
• For small beam depths will interest to
decrease the SM by increasing the theoretical
shear; for that, size effect factor (ξ) must be
increased. In contrast, for great depths, SM
will be increased by reducing the theoretical
shear by diminishing the size effect factor (ξ).
Therefore, the size effect rules proposed by
Codes should be connected accordingly.
• It has been observed that Codes
overestimate the shear strength of beams made
of HSC (fc>70MPa). Therefore, structural
codes should provide rules that better take into
account the shear strength, when fc>70MPa, as
does the EHE when limits the compressive
strength (fc ≤ 60MPa) and the MC2010 for
elements without fibers [(fck)1/2
≤ 8MPa]. In
fact, the Model Code [11] ensures that its
limitation in fck is provided due to the larger
observed variability in shear strength of higher
strength concrete, particularly for members
without stirrups. However, concrete
compressive strength also influences the FRC
toughness.
• Beside fracture parameter fR3,
parameter fR1 should be considered for shear
strength, since it depends also on the smaller
cracks. A parameter that better represents the
shear strength in FRC could be represented by
the average value fRm=(fR1+ fR3)/2 in some
particular cases, as in small beams.
• Codes are highly conservative for
prestressed beams, better and more appropriate
rules for considering the compressive stress in
the beams should be proposed.
8 CONCLUDING REMARKS
After analyzing a shear database consisting of
215 structural elements, it was detected the
influence of each parameter influencing shear.
In the following, Codes will be compared
with the experimental results available in the
considered database, under the assumption that
the partial safety factors are equal to the unit;
therefore, the comparisons will not refer to the
safety because, in this case, this safety factor
have to be considered.
8.1 Influence of effective depth, d
For small effective depths (d~200mm), the
considered Codes were always conservative
for all cases except for beams with only
stirrups.
For larger values of d (≥ 900mm), Codes
overestimate the shear strength of beams
without any shear reinforcement; however, in
beams with stirrups, Codes are conservative.
In beams with only fibers as shear
reinforcement, Codes overestimate the shear
strength experimentally determined in some
experimental sets.
It should be underlined that both stirrups
and fibers mitigate the size effect in shear.
Estefanía Cuenca, Pedro Serna and Giovanni Plizzari
11
8.2 Influence of the a/d ratio
For the range 2.5≤ a/d ≤3.5, particular trends
are not observed, independently of the
reinforcement type (fibers and/or stirrups).
8.3 Influence of concrete compres. strength
In all beams with higher concrete compressive
strength (fc > 70 MPa), Codes generally
overestimate the shear strength. However, it
should be observed that in the database, HSC
beams reinforced with both stirrups and fibers
were not available.
8.4 Influence of residual tensile strength
For FRC beams without stirrups, the SMs are
generally higher than the unit, with a high
scatter. The scatter is smaller in beams with
both fibers and stirrups, but a lower number of
results are available in the database.
However, it was evidenced that the shear
should not rely solely on the value of fR3 for all
types of FRC (with any type of fiber and any
concrete compressive strength), since residual
strength for smaller crack opening (fR1) also
influences the shear strength. Hence
parameters fR1 and fR3 should be linked to
correctly estimate the theoretical shear value,
as evidenced in [5] when an alternative
parameter fRm =( fR1+ fR3) /2 was proposed.
Furthermore, in large beams, a crack
opening corresponding to fR3, is not reached
and a residual strength value related to fR1
should be considered.
Reinforced beams with more than
125 kg/m3 of fibers, evidenced SM>1. In
beams with combined reinforcement, for
amounts of fibers greater than 40kg/m3, SM
was always higher than 1.
8.5 Influence of the amount of longitudinal
reinforcement, ρl
The considered codes tends to overestimate
shear strength for higher longitudinal
reinforcement ratios (ρl > 3.5%). This trend
was observed in all cases with the exception of
beams with a combination of stirrups and
fibers; however, in these beams, when ρl < 2%
and fR3 < 1.5 MPa, Codes overestimate the
experimental results.
In all prestressed beams, for all Codes, the
Safety Margin increases for increasing values
of longitudinal reinforcement, ρl.
8.6 Influence of prestressing
Codes were always conservative for
prestressed beams with high SM; only in
beams with both fibers and stirrups,
prestressed beams had SM levels of the same
order of beams without prestressing.
For beams without any shear reinforcement,
SM of the prestressed beams had a clear
dependence on the prestressing stress; in fact,
the Safety Margin increases with σ. This trend
was also present in beams with fibers but a
higher scatter was observed; the latter cannot
ensure that the safety margin increases with σ.
In beams with fibers, MC2010
underestimated the effect of prestressing,
giving rise to higher SM. All Codes were
conservative up to σ = 10MPa.
REFERENCES
[1] fib-Bulletin57, Shear and punching
shear in RC and FRC elements, Salò,
Italy, 2010.
[2] Rosenbusch, Teutsch, Dupont,
Vandewalle, Gettu, Barragán, Martín,
Ramos and Burnett, "Subtask 4.2: Trial
Beams in Shear," in Brite-Euram
Project: Test and design methods for
steel fibre reinforced concrete, 2002.
[3] Dupont and Vandewalle, "Shear
capacity of concrete beams containing
longitudinal reinforcement and steel
fibers," ACI Special Publication, vol.
216, pp. 79-94, 2003.
[4] Conforti, Cuenca, Minelli and Plizzari,
"Can we mitigate or eliminate size effect
in shear by utilizing steel fibers?," in
Proceedings of the fib Symposium
"Concrete Engineering for Excellence
and Efficiency", Prague, Czech
Republic, 2011.
[5] E. Cuenca, On shear behavior of
structural elements made of steel fiber
reinforced concrete, Universitat
Politècnica de València (Spain): PhD
Estefanía Cuenca, Pedro Serna and Giovanni Plizzari
12
thesis, 2012.
[6] EN14651:2005, "Test method for
metallic fibre concrete - Measuring the
flexural tensile strength (limit of
proportionality (LOP), residual)," 2005.
[7] EHE-08, Instrucción de Hormigón
Estructural, Spain: Ministerio de
Fomento, 2008.
[8] RILEM-TC-162-TDF, "Test and design
methods for steel fibre reinforced
concrete, Stress-strain design method.
Final Recommendation," vol. 36, pp.
560-567, 2003.
[9] MC2010, "fib Bulletins 55-56. Model
Code 2010. First Complete Draft," 2010.
[10] Muttoni and Fernández-Ruiz, "Shear in
slabs and beams: should they be treated
in the same way?," fib Bulletin 57.Shear
and punching shear in RC and FRC
elements. Workshop Proceedings, p. 268
pp., 2010.
[11] Cladera and Marí, "Shear design of
reinforced and prestressed concrete
beams: a proposal for code procedure.,"
Hormigón y Acero, vol. 242, no. 4, pp.
51-63, 2006.
[12] Di-Prisco, Plizzari and Vandewalle,
"MC2010: Overview on the shear
provisions for FRC," fib Bulletin 57.
Shear and punching shear in RC and
FRC elements. Workshop proceedings.,
p. 268 pp., 2010.
[13] Bentz, "MC2010: Shear strength of
beams and implications of the new
approaches," fib Bulletin 57. Shear and
punching shear in RC and FRC
elements. Workshop proceedings, p. 268
pp., 2010.
[14] E. Cuenca and P. Serna, "Failure modes
and shear design of prestressed hollow
core slabs made of fiber-reinforced
concrete," Composites Part B:
Engineering,
http://dx.doi.org/10.1016/j.compositesb.
2012.06.005, 2012.
[15] E. Cuenca, J. Echegaray, P. Serna and
A. Pasetto, "Ductility analysis on the
post-peak behavior of self-compacting
fiber reinforced concrete (SCFRC)
beams subjected to shear," in 8th RILEM
International Symposium on fibre
reinforced concrete: Challenges and
Opportunities (BEFIB 2012), Guimaraes
(Portugal), 2012.
[16] E. Cuenca and P. Serna, "Hormigón
reforzado con fibras de acero para
prefabricados estructurales.
Contribución al esfuerzo cortante (in
spanish)," in V Congreso de ACHE,
Barcelona, Spain, 2011.
[17] E. Cuenca and P. Serna,
"Comportamiento a cortante de vigas
prefabricadas con hormigón tradicional
y hormigón autocompactante (in
spanish)," in 2º Congreso Ibérico sobre
hormigón autocompactante, Guimaraes,
Portugal, 2010.
[18] Cuenca and Serna, "Shear behavior of
self-compacting concrete and fiber
reinforced concrete beams," in 6th
International RILEM Symposium on
Self-Compacting Concrete SCC2010,
Montreal, Canada, 2010.
[19] Cuenca and Serna, "Shear behavior and
mode of failures analysis of different
structural elements made with fiber
reinforced concrete.," in 8th fib PhD
Symposium , Kgs. Lyngby, Denmark,
2010.
[20] Cuenca, Serna y Pelufo, «Structural
behavior of self-compacting and fiber
reinforced concrete under shear
loading,» de Proceedings of the
International Association for Shell and
Spatial Structures (IASS) Symposium,
Valencia, Spain, 2009.
[21] EC2, "Eurocode 2: Design of Concrete
Structures - EN 1992-1-1," 2005.