Shape Optimization of a Steering System Based on · PDF fileShape Optimization of a Steering...
10
2 nd International Conference on Engineering Optimization September 6-9, 2010, Lisbon, Portugal Shape Optimization of a Steering System Based on Fatigue Analysis Katrin Martini 1 and Christoph Tobias 2 1 ZF Lenksysteme GmbH, Schwaebisch Gmuend, Germany, [email protected] 2 Institute of Engineering and Computational Mechanics, University of Stuttgart, Germany, [email protected] Abstract This contribution describes a process of shape optimization based on fatigue analysis in an industrial setting. Essential components of the optimization process are methods for multibody systems, finite element analysis, fatigue analysis and the shape optimization. The workflow of this process uses the tools Simpack, NX Nastran, Virtual.Lab Durability and Tosca Structure. After the process has been explained, a shape optimization is applied to the housing of a steering system. A comparison between a shape optimization based on either static stress analysis or on fatigue analysis is part of the paper as well. Keywords: shape optimization, fatigue analysis, steering system. 1. Introduction It is one goal of product development in the automotive industry to use less material in order to reduce weight and costs of products. Also, the reduction of stresses in components is important, as this can improve the product reliability. All this must be done in a short development period. To achieve this goal virtual product development is becoming more and more important. In the process of virtual product development, shape optimization and fatigue analysis are progressive methods. In computational strength analysis, shape optimization is often used to reduce stresses. In general, the critical region in a structural component differs in terms of strength and fatigue analysis. Therefore, the results of shape optimization with respect to strength improvement differ from those for durability improvement as well. It is the first step of a shape optimization to identify critical locations where high damage values can occur. The geometry of these local regions will be modified within the optimization. The comparison of a shape optimization based on fatigue analysis with conventional optimization based on stress analysis is, for example, shown in [1] for an idealized geometry. The following results illustrate that the process is no longer an academic method useful only for limited test cases, but can also be implemented for large industrial applications. In this contribution the industrial application is the housing of a steering system subject to high stresses, as illustrated in Figure 1. Figure 1: Electric Power Steering System with servo unit on a second pinion [2]. 2. Process of Shape Optimization Based on Fatigue Analysis To implement a shape optimization based on fatigue analysis, different calculation methods must be 1
Transcript of Shape Optimization of a Steering System Based on · PDF fileShape Optimization of a Steering...

2nd International Conference on Engineering Optimization
September 6-9, 2010, Lisbon, Portugal
Shape Optimization of a Steering System Based on Fatigue Analysis
Katrin Martini1 and Christoph Tobias2
1ZF Lenksysteme GmbH, Schwaebisch Gmuend, Germany, [email protected] of Engineering and Computational Mechanics, University of Stuttgart, Germany,
Abstract
This contribution describes a process of shape optimization based on fatigue analysis in an industrialsetting. Essential components of the optimization process are methods for multibody systems, finiteelement analysis, fatigue analysis and the shape optimization. The workflow of this process uses thetools Simpack, NX Nastran, Virtual.Lab Durability and Tosca Structure. After the process has beenexplained, a shape optimization is applied to the housing of a steering system. A comparison betweena shape optimization based on either static stress analysis or on fatigue analysis is part of the paper aswell.Keywords: shape optimization, fatigue analysis, steering system.
1. Introduction
It is one goal of product development in the automotive industry to use less material in order to reduceweight and costs of products. Also, the reduction of stresses in components is important, as this canimprove the product reliability. All this must be done in a short development period. To achieve thisgoal virtual product development is becoming more and more important.
In the process of virtual product development, shape optimization and fatigue analysis are progressivemethods. In computational strength analysis, shape optimization is often used to reduce stresses. Ingeneral, the critical region in a structural component differs in terms of strength and fatigue analysis.Therefore, the results of shape optimization with respect to strength improvement differ from those fordurability improvement as well.
It is the first step of a shape optimization to identify critical locations where high damage values canoccur. The geometry of these local regions will be modified within the optimization.
The comparison of a shape optimization based on fatigue analysis with conventional optimizationbased on stress analysis is, for example, shown in [1] for an idealized geometry. The following resultsillustrate that the process is no longer an academic method useful only for limited test cases, but canalso be implemented for large industrial applications. In this contribution the industrial application isthe housing of a steering system subject to high stresses, as illustrated in Figure 1.
Figure 1: Electric Power Steering System with servo unit on a second pinion [2].
2. Process of Shape Optimization Based on Fatigue Analysis
To implement a shape optimization based on fatigue analysis, different calculation methods must be
1

combined. The elastic multibody system is necessary to simulate the environment of the optimizedcomponent, which is integrated as an elastic body. Secondly, the finite element analysis is used to obtainbasic data for the fatigue analysis. Because the goal of the optimization is to reduce damage in thesystem, the fatigue analysis and the optimization itself are needed as well.
The methods are described in detail in the next sections. First, however, a short description ofthe process is given and illustrated in Figure 2. The basis of the whole process is the CAD-model. Itprovides information about the mechanical system, in this paper the steering system. This consists of,for example, coordinate systems, geometries, masses and mass inertias. This information is necessary tobuild the finite element and the multibody model. The CAD-model is not part of the optimization loop.The finite element analysis calculates the results of the so-called unit load cases for the fatigue analysisσ(x). Furthermore, data for the flexible bodies in the multibody system have to be provided by thefinite element analysis. The flexible bodies are used in the multibody system, where the loads L(t) onthe investigated component are calculated. The loads L(t) and the stresses of the unit load cases σ(x)are the input data for the fatigue analysis. The value x represents all nodes of the finite element mesh.In the fatigue analysis, the data are derived from the superposition of L(t) and σ(x), and the damageD(xk) of the component is calculated in each nodal position xk. This damage D(xk) will be reducedduring the optimization by changing the geometry. This is done by moving the nodes of the finite elementmodel with the value ∆u(xk). With the new finite element mesh, the same sequence starts again. Theresult of the optimization is a modified finite element mesh, which represents the new housing geometry.
Multibody System
Finite Element Analysis
CAD Fatigue Analysis Optimization
Simpack
Pro/Engineer Virtual.Lab Durability Tosca Structure
NX Nastran
L(t)
σ(x)
D(xk)
∆u(xk)
flexible bodies
Figure 2: Process of a shape optimization based on fatigue analysis.
The experience with tools for multibody systems, finite element analyses and fatigue analyses isimportant for the decision to develop a new process for the shape optimization. ’NX Nastran’ is chosenas a tool for the finite element analyses, ’Simpack’ for the multibody system analyses and ’Virtual.LabDurability’ for the fatigue analyses. The optimization and the control of the process are the tasks forthe tool ’Tosca Structure’. General and flexible interfaces have to be created in order to combine thedifferent methods and tools. These interfaces are required for an automated optimization process.
2.1. Finite Element AnalysisWith information from the CAD-System, the finite element model can be built. Based on this model, thecalculations for the flexible bodies for the multibody system and calculations of stresses for the fatigueanalysis can be carried out.
In order to integrate the housing of the steering system into a multibody system, the model’s degreesof freedom must be reduced. The equation of motion for a linear undamped FE system is
Mu+Ku = r . (1)
2

Hereby M is the mass matrix, K is the stiffness matrix, r is the load vector of the system and u thedisplacement vector, see [3]. A model reduction is a transformation with the so-called projection matrix ψinto a system with less degrees of freedom
u = ψ qr . (2)
In equation (2), qr represents the reduced degrees of freedom of the displacements of the reduced model,whose dimension is smaller than the dimension of u. The equation of motion of the reduced model canbe given as
Mqr + Kqr = r (3)
withM = ψ
TMψ ; K = ψ
TKψ ; r = ψ
Trψ . (4)
This derivation and these methods for calculating the matrix ψ are given e.g. in [4], [5] or [6].Further results of the finite element analysis are stresses of the unit load cases σ(x). For every
component of the load vector, one load case has to be calculated. This will be described in section 2.3. Inthis context, the finite element calculation must be linear, so that the stresses for the fatigue analysis maybe used. Some simplifications of the model must be used, in order to simulate the steering system housingas realistically as possible. By solving the finite element equation Ku = r, the displacements of everynode for a static calculation (used for the quasistatic superposition) may be obtained, see [3]. A dynamicanalysis calculates the stresses for the modal superposition. The mass inertias have to be considered andthe equation of motion Mu +Ku = r has to be solved, see [3]. The calculated displacements can betranslated to the stresses as needed.
Both results must be calculated with the same finite element mesh in order to integrate the calculationsin the optimization process. This causes different mesh requirements, because the stress analysis needsa finer mesh than needed for the calculation of the flexible body. The higher calculating time for themodel reduction has to be accepted. To integrate the flexible body into the multibody system, so-calledinterface nodes must be defined. The loads are calculated for these interface nodes. The same nodes arealso used to apply the unit loads for the stress calculation. Multipoint constraints are used to distributethe loads to the bearing faces.
2.2. Elastic Multibody SystemImports for the multibody system are the data from the CAD-model (inertia, masses, and coordinatesystems) and the flexible body. In the multibody system, both the whole steering system and all othercomponents, including the steering housing, are modelled. The steering housing is a flexible body, butother components can also be rigid. The multibody system can simulate different load cases. It calculatesthe loads F (t) on the steering system housing over long periods of time. The loads can either be forcesF (t), torques M(t) or modal coordinates q(t), which are used for the modal superposition, see section2.3. Additional information on modelling elastic multibody systems can be found in [7] and [8].
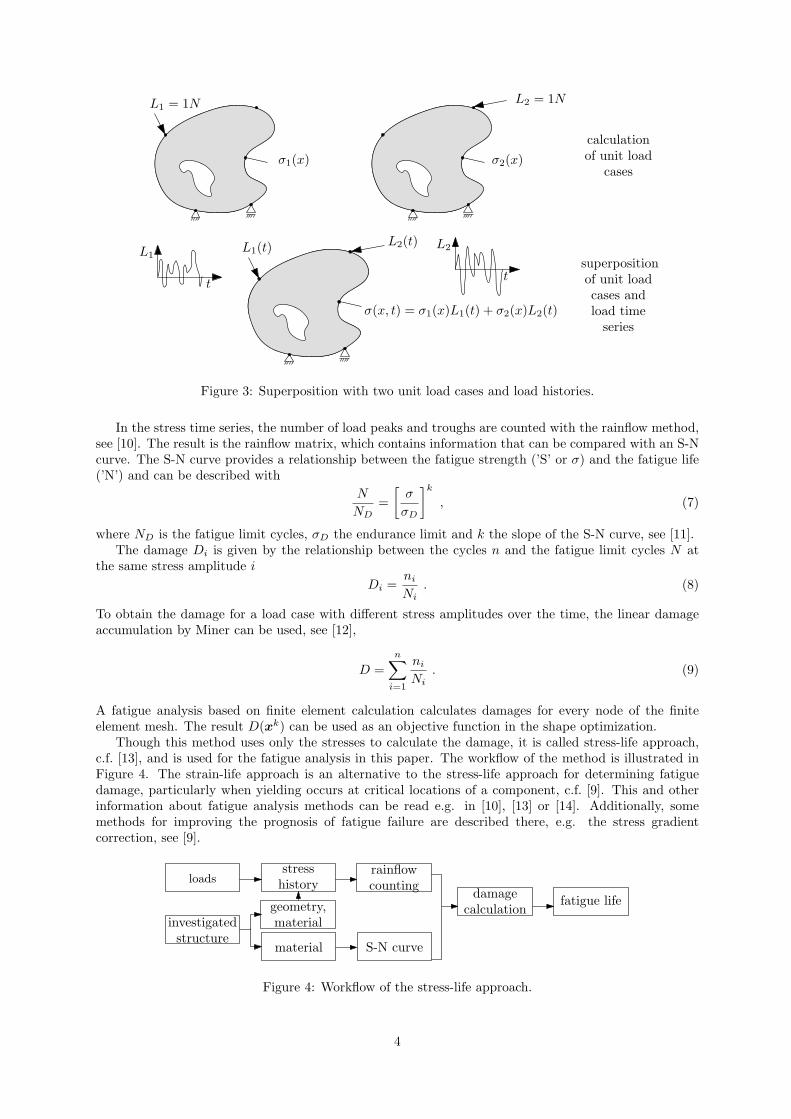
2.3. Fatigue AnalysisAfter simulation of the loads and calculation of the results of the unit load cases, all data is preparedfor the fatigue analysis. The first step of the fatigue analysis is the superposition, as shown in Figure 3,see [9]. The results are the stresses for every node of the finite element mesh over the time span σ(xk, t)
σ(xk, t) =
ns∑
k=1
σk(xk)Lk(t)
L0
k
. (5)
The quasistatic superposition uses stresses calculated with a static finite element analysis and withforces and torques of the multibody system. The variable ns describes the number of unit load cases andL0
k the applied unit load, which is typically 1N .The modal superposition uses stresses calculated with a dynamic finite element analysis and the
modal coordinates q(t) of the multibody system. The modal coordinates describe for every point in timethe contribution of the corresponding mode on the entire deformation. The dynamics of the flexiblecomponent (here: steering housing) are observed with this method. The question as to wheather this isnecessary or not must be answered for every special system and load case. The stress history using nm
modes can be given with
σ(x, t) =
nm∑
k=1
σkqk(t) . (6)
3
calculationof unit load
cases
superpositionof unit loadcases andload time
series
L1 = 1N L2 = 1N
σ1(x) σ2(x)
L1(t)L2(t)
L1
t
L2
t
σ(x, t) = σ1(x)L1(t) + σ2(x)L2(t)
Figure 3: Superposition with two unit load cases and load histories.
In the stress time series, the number of load peaks and troughs are counted with the rainflow method,see [10]. The result is the rainflow matrix, which contains information that can be compared with an S-Ncurve. The S-N curve provides a relationship between the fatigue strength (’S’ or σ) and the fatigue life(’N’) and can be described with
N
ND
=
[
σ
σD
]k
, (7)
where ND is the fatigue limit cycles, σD the endurance limit and k the slope of the S-N curve, see [11].The damage Di is given by the relationship between the cycles n and the fatigue limit cycles N at
the same stress amplitude i
Di =ni
Ni
. (8)
To obtain the damage for a load case with different stress amplitudes over the time, the linear damageaccumulation by Miner can be used, see [12],
D =
n∑
i=1
ni
Ni
. (9)
A fatigue analysis based on finite element calculation calculates damages for every node of the finiteelement mesh. The result D(xk) can be used as an objective function in the shape optimization.
Though this method uses only the stresses to calculate the damage, it is called stress-life approach,c.f. [13], and is used for the fatigue analysis in this paper. The workflow of the method is illustrated inFigure 4. The strain-life approach is an alternative to the stress-life approach for determining fatiguedamage, particularly when yielding occurs at critical locations of a component, c.f. [9]. This and otherinformation about fatigue analysis methods can be read e.g. in [10], [13] or [14]. Additionally, somemethods for improving the prognosis of fatigue failure are described there, e.g. the stress gradientcorrection, see [9].
loads
investigatedstructure
stresshistory
geometry,material
material S-N curve
rainflowcounting
damagecalculation
fatigue life
Figure 4: Workflow of the stress-life approach.
4
2.4. Shape OptimizationCompared to a topology optimization, the geometry variation of a shape optimization is small. It resultsin the optimal shape for a particular location, see [15] or [16]. Therefore, a typical field of applicationis the reduction of local stress peaks in a component. Given that the fatigue analysis becomes moreimportant in analyzing the geometry, it follows that the automated reduction of damages is also needed.To reduce the damage, the homogenization method is used; for details see [17].
Using a shape optimization based on finite element results, the nodal coordinates of the finite elementmesh are the optimization variables. To reduce calculation time, a small location to be optimized shouldbe chosen, see section 3.
The objective function of a shape optimization based on fatigue analysis is the maximum damage inthe design space. To limit the growth of material, a constraint on the volume can be used. The easiestway is a reduction of the damage with the same usage of material. Sometimes it is also possible toreduce the used volume. Other constraints such as a constant displacement between two points, a limitedmaximum stress in the whole structure, or a limitation of the design space, may also be possible.
3. Comparison between Static Stress and Fatigue Analysis
As already mentioned, shape optimization is a method to change a local region in a component. Therefore,the first step of the optimization is to analyse whether critical locations in the component exist, and ifso, where they are. In section 3.1, the analysed load case is defined. The following sections will give theresults of the static stress analysis and the fatigue analysis.
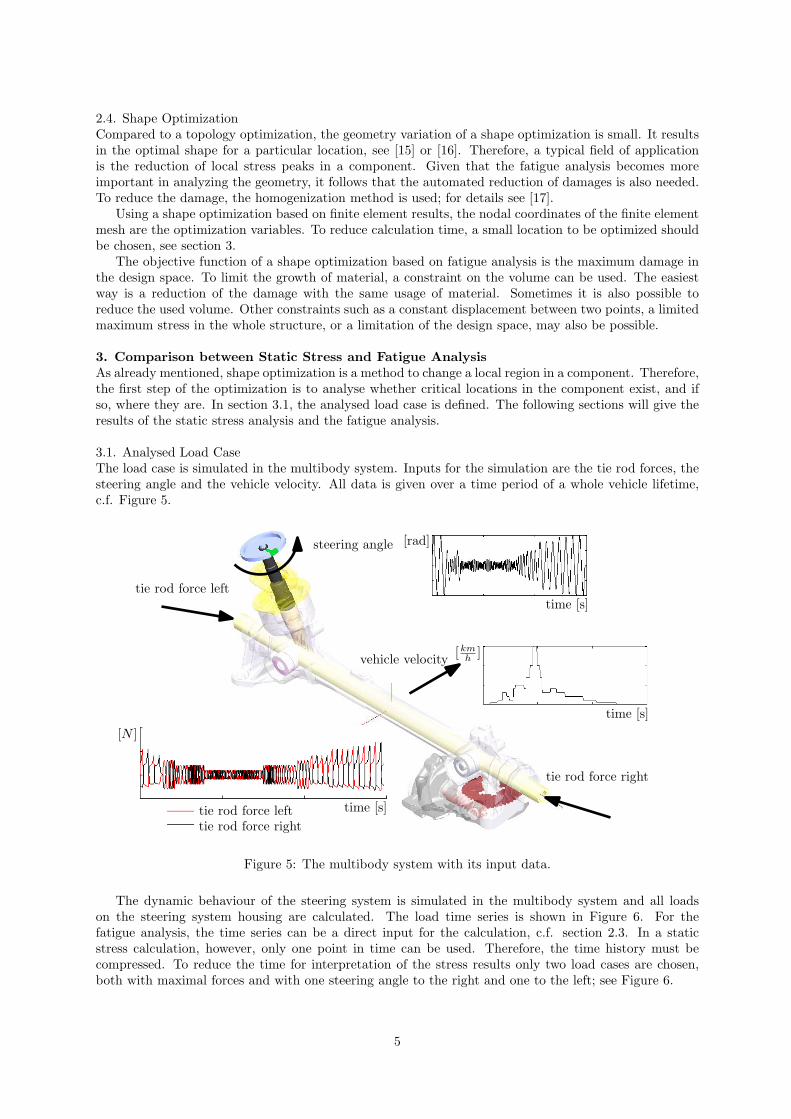
3.1. Analysed Load CaseThe load case is simulated in the multibody system. Inputs for the simulation are the tie rod forces, thesteering angle and the vehicle velocity. All data is given over a time period of a whole vehicle lifetime,c.f. Figure 5.
tie rod force right
tie rod force lefttime [s]
tie rod force lefttie rod force right
time [s]
time [s]
steering angle
vehicle velocity[km
h]
[N ]
[rad]
Figure 5: The multibody system with its input data.
The dynamic behaviour of the steering system is simulated in the multibody system and all loadson the steering system housing are calculated. The load time series is shown in Figure 6. For thefatigue analysis, the time series can be a direct input for the calculation, c.f. section 2.3. In a staticstress calculation, however, only one point in time can be used. Therefore, the time history must becompressed. To reduce the time for interpretation of the stress results only two load cases are chosen,both with maximal forces and with one steering angle to the right and one to the left; see Figure 6.
5

time[s]
loads for static load case 1 loads for static load case 2
loads [N]
Figure 6: 54 Loads from multibody system simulation.
3.2. Static Stress AnalysisThe two load cases described will be calculated separately. Both results must be analyzed, and theresults have to be compared with material data from fatigue tests (S-N curves). Each critical region ofthe two results is analyzed as if it is an alternating load. The material data for cyclic stresses with zeromean stress is derived from fatigue tests. Therefore, the calculated stresses of the static analysis mustbe adapted so that they are comparable with the material data. The post-processing of the calculationis time-consuming, because different load cases must be analyzed. The two selected load cases are theminimum number of tests and are only an approximation of the real loads in the vehicle lifetime. Moreload cases would increase the result quality. Therefore, a comparison with detailed fatigue analyses mustshow, if the static load cases can describe the fatigue life of the history loading sufficiently accurate.
3.3. Fatigue AnalysisFor the fatigue analysis, the whole load time series is taken into account and compressed to one valuefor each node of the finite element mesh. The post-processing of the fatigue analysis is therefore easierand faster. At a more advanced level, parameters and methods may be found to make the results moreaccurate. Different methods for the mean stress, size or surface effects are possible, c.f. [9]. The resultsare very sensitive in conjunction with the parameters, and must be evaluated by means of experiments.The parameters must fit both the load cases used and the geometry.
3.4. Comparison between the two MethodsIn a preliminary investigation, the results of the two analyses were analysed. The results show that thehousing can bear the loads of a vehicle lifetime. As the design benefits from the experience of previousmodels and from improvements made before this calculation, this result was very predictable.
The comparison of both results show different locations with increased values. This is illustrated inFigure 7. The fatigue analysis shows increased damage values at a location near the bearing of the pinion,a feature which was not noticeable when looking at the stress values from the static stress analysis. Thiscan be explained with the low-load cycles of the loading history. The loads for these cycles are low, butthe repetition factors are high, resulting in a higher damage value of the housing at this location, c.f.Figure 6. Fatigue analyses mostly give less increased values, because more effects (e.g. the stress gradientcorrection, see [9]) are considered.
6

TOP
BACK
design spacefor shape op-timization
slightlyincreasedvalues givenby staticstress analy-sis
slightlyincreasedvalues givenby fatigueanalysis
12
3
4
Figure 7: Regions with exemplary slightly increased values.
Although all regions meet the criteria for a vehicle lifetime, region 4 will be optimized with the shapeoptimization. The potential of the optimization process is shown next.
4. Shape Optimization
Based on the analyses discussed, shape optimizations of the critical region 4, c.f. Figure 7, will reducethe increased values. Given that the damage is an important value to evaluate a component, the questionof which optimization can best reduce the damage values will be analyzed.
4.1. Optimization TaskGenerally the optimization task can be given as
f∗ = f(xk,d,∗) = min{
f(xk,d) | xk,d ∈ X}
with X ={
xk,d ∈ R
m | g(xk,d) ≤ 0,h(xk,d) = 0}
. (10)
The function f(xk,d) is the objective function of the optimization and xk,d is the vector of the designvariables. The stars mark the objective function and design variables at the optimum, which is formallya minimum. The range of the design variables is restricted by the functions g(xk,d) and h(xk,d), whichcan be equality and inequality constraints, compare [16].
The design variables xk,d of both optimizations are the coordinates of the finite element nodes. Forthe shape optimization based on static stress analysis, the calculated maximum principal stress σ1(x
k,d)for the design variables is the objective function. The maximum value of all design variables and ofthe load case with the maximum value is minimized. The shape optimization based on fatigue analysisminimizes the maximum damage D(xk,d) of the design variables. A choice of a tensor component or loadcase is not necessary, because the fatigue analysis compresses all data to one relevant damage value foreach node. The optimization restrictions are the same for both optimizations. The displacement ∆u ofthe nodes xk,r are restricted to preserve functional surfaces of the housing. The volume V of the wholehousing is constant. Some nodes of the finite element mesh near to the design variables can move inorder to counter a mesh deformation. The optimization task for the optimization based on static stressanalysis is
f∗ = min{
max(σ1(xk,d)) | xk,d ∈ X
}
with X ={
xk,d ∈ R
m | ∆u(xk,r) = 0, V − Vstart = 0}
. (11)
The optimization task for the optimization based on fatigue analysis is
f∗ = min{
max(D(xk,d)) | xk,d ∈ X}
with X ={
xk,d ∈ R
m | ∆u(xk,r) = 0, V − Vstart = 0}
. (12)
7

4.2. Results of the Shape OptimizationThe result of the shape optimization based on a static stress analysis, as described in section 3.2., isshown in Figure 8. The stresses in the optimized region can be reduced by 1.8% during the first seveniterations.
Iteration 0 Iteration 1 Iteration 2 Iteration 3
Iteration 5Iteration 4 Iteration 6 Iteration 7
Figure 8: Results of the shape optimization based on static stress analysis.
Figure 9 shows the damage reduction during the shape optimization based on fatigue analysis. Thedamage of the design nodes can be reduced by 20%. A stress reduction of 1.8% means a much higherdamage reduction of about 10%. Taken this into account, the optimization of damage reduction isnevertheless better than the optimization of stress reduction. This becomes apparent in Figures 8 and 9.The difference between the plot for iteration 0 (original model) and iteration 7 is higher than in Figure 9,which shows the results for the optimization based on fatigue analysis.
Iteration 0 Iteration 1 Iteration 2 Iteration 3
Iteration 5Iteration 4 Iteration 6 Iteration 7
Figure 9: Results of the shape optimization based on fatigue analysis.
4.3. Convergence ResearchBoth optimizations show a convergence to lower objective functions, as illustrated in Figure 10. Theslight increase of stresses during the last iterations of the optimization based on static stress analysis iscaused by a deformed finite element mesh.
8

0 5 10Iteration
max
. str
ess
[−]
(a) stress reduction
0 5 10Iteration
max
. dam
age
[−]
(b) damage reduction
Figure 10: Reduction of the objective function during shape optimization (scaled values).
The essential comparison criterion for both optimizations is how much the maximum damage, whichis the important value to analyse the housing quality, can be reduced. For the optimization based onstatic stress analysis, the damages for each iteration is calculated with its maximum stresses. Figure 11shows the convergence of both optimizations.
0 5 10Iteration
max
. dam
age
[−]
stress reductiondamage reduction
Figure 11: Development of the maximum damage regarding different objective functions (scaled values).
For the load case introduced in section 3.1, the optimization based on fatigue analysis shows a betterconvergence to lower maximum damage values. It is thus clear that an optimization with damage in theobjective function is highly appropriate to reduce damages in the case of a steering system housing.
5. Conclusion
This contribution introduces a process that realizes a shape optimization based on fatigue analysis. Theprocess integrates the methods of finite element analysis, multibody systems, fatigue analysis and shapeoptimization. The application of optimizing a housing of a steering system shows that the process canbe applied to advanced industrial systems. The optimization is shown for a typical load case, whichrepresents the loads of a vehicle lifetime. Conventional shape optimization based on stress analysis wascompared to an optimization with the new process based on fatigue analysis. The comparison shows thatthe new process is qualified to reduce damage in the case of a steering system housing.
The process based on fatigue analysis has only recently been developed. Therefore, experience mustbe gained in order to improve the optimization results. One challenge will be to reduce deformationsof the finite element mesh, which cause local increased stresses and, therefore, bad optimization results.This phenomenon can also be noticed in the optimizations which have been presented. An importanttopic for further research will be to formulate a specification for the requirements of the mesh quality.
References
[1] Ilzhofer, B.; Haußler, P.; Muller, O.; Albers, A.; Allinger, P.: Shape Optimisation Based onLifetime Prediction Measures. 13th International Conference on Engineering Design - ICED 01:Design Research - Theorie, Methodologies and Product Modelling (Glasgow 2001). Vol. 1 Bury StEdmunds: Professional Engineering Publishing, 2001.
[2] ZF Lenksysteme GmbH, www.zf-lenksysteme.com: ZF Servolectric product brochure, 2010.
9

[3] Bathe, K.J.: Finite-Elemente-Methode (in German). Berlin, Heidelberg: Springer-Verlag, 2002.
[4] Wissmann, J.; Sarnes, K.D.: Finite Elemente in der Strukturmechanik (in German). Berlin,Heidelberg: Springer-Verlag, 2006.
[5] Craig, R.R.; Kurdila, A.J.: Fundamentals of Structural Dynamics, 2nd edition. John Wiley &Sons, 2006.
[6] Craig, R.R.J.; Bampton, M.C.C.: Coupling of Structures for Dynamic Analysis. AIAA Journal,Vol. 6, No. 7, pp. 1313–1319, 1968.
[7] Schiehlen, W.; Eberhard, P.: Technische Dynamik: Modelle fur Regelung und Simulation (inGerman). Wiesbaden: Teubner, 2004.
[8] Tobias, C.; Eberhard, P.: Durability-based Topology Optimization of a Steering System. 8th WorldCongress on Structural and Multidisciplinary Optimization, June 1-5, 2009, Lisbon, Portugal,2009.
[9] LMS Deutschland GmbH: LMS Falancs Theory Manual, 2002.
[10] Haibach, E.: Betriebsfestigkeit (in German). Berlin, Heidelberg: Springer-Verlag, 2006.
[11] Wohler, A.: Uber die Festigkeitsversuche mit Eisen und Stahl (in German). Zeitschrift fur Bauwe-sen, Vol. 20, pp. 74 – 86, 1871.
[12] Miner, M.: Cumulative Damage in Fatigue. Journal of Applied Mechanics, Vol. 12, pp. A159 –A164, 1945.
[13] Naubereit, H.; Weihert, J.: Einfuhrung in die Ermudungsfestigkeit (in German). Munchen, Wien:Carl Hanser Verlag, 1999.
[14] Zahavi, E.; Torbilo, V.: Fatigue Design - Life Expectancy of Machine Parts. CRC Press, 1996.
[15] Bendsoe, M.P.; Sigmund, O.: Topology Optimization - Theory, Methods and Application. Berlin,Heidelberg: Springer-Verlag, 2003.
[16] Schumacher, A.: Optimierung mechanischer Strukturen – Grundlagen und industrielle Anwendun-gen (in German). Berlin, Heidelberg: Springer-Verlag, 2005.
[17] Bendsoe, M.; Kikuchi, N.: Generating Optimal Topologies in Structural Design using a Homoge-nization Method. Computer Methods in Applied Mechanics and Engineering, Vol. 71, pp. 197–224,1988.
10