SGIG
32
SGIG Financed by
-
Upload
macy-wolfe -
Category
Documents
-
view
19 -
download
0
description
HABITAT. Intensive evaluation of the evolution of a protected benthic habitat. Steven Degraer, Vera Van Lancker, Geert Moerkerke, Gert Van Hoey, M. Vincx, J.P. Henriet & P. Jacobs. SGIG. Financed by. Proposed Natura 2000 areas. International importance for waterfowl. Area of interest. - PowerPoint PPT Presentation
Transcript of SGIG

SGIG
Financed by

03/74
05/62
19/6702/74
20/67
05/74
01/8703/87
Baland Bank
Stroom Bank
M iddelkerke Bank
N ieuw poort Bank
R avelingen
Potje
Broers Bank
K le ine R ede
Trapegeer
Den OeverWestdiep
Sm alBank
Noordpasswale
N
1 0 1 5 10 km
2°30'E 2°45 'E 3°00 'E
51°05'N
51°10'N
51°15'N
D u n k e r q u e France
Koksijde
De Panne
N ieuw poort
Belg ium
O ostende
W estern C oasta l Banks
F lem ish Banks
D utchcoast
Belg iancoast
Area of interestArea of interest
Proposed Natura 2000 areas
Special protection area
Site of Community Interest
International importance for waterfowl
e.g. common scoter Melanitta nigra
Food resource: macrobenthos
Importance of benthic habitat

SGIG
Financed by

Bathymetric-morphological map
Sedimentological map
Hydrodynamical map
Macrobenthic map
PRELIMINARY MAPS
Selection subarea
sampling campaign: spatial variation
(macrobenthos, physico-chemical environment)
sampling campaign: temporal variation
(macrobenthos, physico-chemical environment)
HABITAT STRUCTURE MAP
Sampling campaign: test
(macrobenthos, physico-chemical environment)
DEVELOPMENT OF MONITORINGS STRATEGIES AND METHODOLOGIES
TO EVALUATE THE MANAGEMENT PLAN
Schematic presentationSchematic presentationof the HABITAT projectof the HABITAT project
DEVELOPMENT OF QUICK AND LOW-COST EVALUATION TOOLS
HABITAT-model and Macrobenthic Side-Scan Sonar Interpretation

Study areaStudy area
466000 467000 468000 469000 470000 471000 472000 473000 474000 475000
Eastings
5661000
5662000
5663000
5664000
5665000
5666000
5667000
5668000
5669000
5670000
Nor
thin
gs
Potjeswale
W estdiepswale
Broers Bank
TrapegeerSmal Bank
U TM 31 ED 50 co-ord inates
0 1 kmFrench border
Nieuwpoort
-18
-17
-16
-15
-14
-13
-12
-11
-10
-9
-8
-7
-6
-5
-4
-3
-2
-1
0
D epth in m eter (M LLW S)
WESTDIEPSWALE
POTJESWALE
TRAPEGEERBANK
BROERSBANK
SMALBANK

Background informationBackground information
466000 467000 468000 469000 470000 471000 472000 473000 474000 475000
Eastings
5661000
5662000
5663000
5664000
5665000
5666000
5667000
5668000
5669000
5670000
Nor
thin
gs
Potjeswale
W estdiepswale
Broers Bank
U TM 31 ED 50 co-ord inates
Trapegeer
Asym m etric sand dune- o ffshore orientationAsym m etric sand dune- onshore orientation
Sym m etrica l sand dune
C om pound (cat-back)sand dune
Sw ash bar
Bedform s
0 1 km
Smal Bank
Nieuwpoort
French border466000 467000 468000 469000 470000 471000 472000 473000 474000 475000 476000
Eastings
5661000
5662000
5663000
5664000
5665000
5666000
5667000
5668000
Nor
thin
gs
Potje
Westdiep
Broers Bank
Trapegeer
125
177
250
354
500
3
2.5
2
1.5
1
M ean G rain-sizem u - ph i
0 1 km
U TM 31 ED 50 coord inates
466000 467000 468000 469000 470000 471000 472000 473000 474000 475000
5661000
5662000
5663000
5664000
5665000
5666000
5667000
5668000
5669000
5670000
0.18
0.49 0.2
0.52 0.5 0.36
0.55 0.53 0.49 0.4
0.58 0.58 0.55 0.57 0.47
0.57 0.63 0.61 0.59 0.57 0.46
0.56 0.61 0.63 0.66 0.59 0.52
0.56 0.56 0.58 0.65 0.67 0.57 0.54
0.52 0.56 0.66 0.63 0.59
0.52 0.62 0.62
0.56 0.58
0.54
0 1 km
U TM 31, E D 50 coord inates
Hydrodynamical characteristics
M axim um current velocity (m /s)
- sem i-d iurnal tides of m acrotidal range- strongly rectilinear currents
D ata source: BC P m odel 750 m grid resolution (M U M M )465000 466000 467000 468000 469000 470000 471000 472000 473000 474000 475000
Eastings
5661000
5662000
5663000
5664000
5665000
5666000
5667000
5668000
5669000
5670000
No
rth
ing
s
Potje
W estdiep
Broers Bank
U TM 31 ED 50 coord inaten
Trapegeer
Smal Bank
Nieuwpoort
French border0 2 km
'M ytilus edu lis ' com m unity
Lan ice conch ilega com m unity
N ephtys c irrosa com m unity s.l.
Geomorphology Sedimentology
Hydrodynamics Macrobenthos
No spatial extrapolation possible
Detailed investigation necessary


Sampling campaignsSampling campaigns
465000 466000 467000 468000 469000 470000 471000 472000 473000 474000 475000
E astings
5661000
5662000
5663000
5664000
5665000
5666000
5667000
5668000
5669000
5670000
Nor
thin
gs
1
2
3
4
5
6
7
8
9
10
11
12
13
14
15
16
17
18
19
20
21
22
23
24
25
26
27
28
29
30
31
32
33
34
35
36
37
38
39
40
41
42
43
44
45
46
47
48
49
50
51
52
53
54
55
56
57
58
59
60
61
62
63 64
65
66
67
68
69
70
71
72
73
74
75
76
77
78
79
80
81
82
83
84
85 86
87
88
89
90
91
92
93
94
95
96
97
98
99
100
101
102
103
104
105
106
107 108
109
110
111
112
113
114
115
116
117
118
119
120
121
122
123
124
Potje
Westdiep
Broers Bank
UTM 31N pro jection (ED50)
Trapegeer
Smal Bank
Nieuwpoort
French border
0 2 km
Area 1
Area 2
Area 3 Northernarea
Southernarea
Remote sensing tracks
Ground truthing sampling points

Biology (120 stations)
Macrobenthic species composition, density and biomassMacrobenthic community structure
Physico-chemical environment (120 stations)
Pigment content of the water column and sedimentNutrient content of the water column and sedimentGrain-size distributionTemperature, oxygen concentration and salinity
Remote sensing (3/5 of area)
Side-scan sonar recordingsBathymetry (single- and multibeam)
October 1999, March 2000, November 2000
Variables taken into accountVariables taken into accountG
rou
nd
tru
thin
g s
amp
lin
g p
oin
ts
466000 467000 468000 469000 470000 471000 472000 473000 474000 475000
5661000
5662000
5663000
5664000
5665000
5666000
5667000
5668000
149
177
210
250
300
350
500
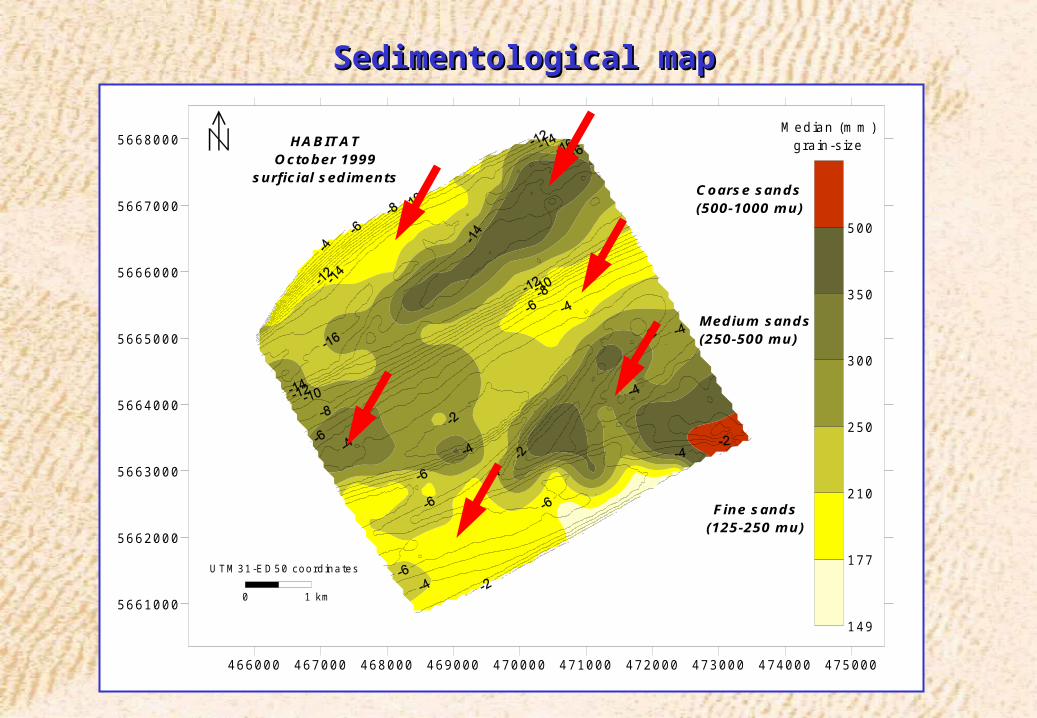
M edian (m m )grain-size
Fine sands(125-250 m u)
M edium sands(250-500 m u)
Coarse sands(500-1000 m u)
U TM 31-ED 50 coord inates
0 1 km
HABITATOctober 1999
surficial sedim ents
Sedimentological mapSedimentological map

Digital terrain model
from multibeam registrations
Bathymetrical settingsBathymetrical settings

Side-scan sonar Side-scan sonar mosaicsmosaics

VHR multiparameter image
on the basis of combined
multibeam – side-scan sonar imagery
3D presentation: side-scan sonar & multibeam3D presentation: side-scan sonar & multibeam

Anthozoa Bivalvia Crustacea Echinodermata
Gastropoda Oligochaeta Polychaeta
Macrobenthos: Macrobenthos: compositioncomposition

Macrobenthos: community structureMacrobenthos: community structure
Abra alba – Mysella bidentatacommunity
Ophelia limacina – Glycera lapidumcommunity
Nephtys cirrosacommunity
Magelona mirabilisspecies association

465000 466000 467000 468000 469000 470000 471000 472000 473000 474000 475000
5661000
5662000
5663000
5664000
5665000
5666000
5667000
5668000
5669000
5670000
F ren ch b o rd e r
N ie u w p o o rt
g ro u p B
g ro u p D
g ro u p A
g ro u p C
L eg en d
Macrobenthos:Macrobenthos: spatial distribution spatial distribution
Abra alba – Mysella bidentatacommunity
Ophelia limacina – Glycera lapidumcommunity
Nephtys cirrosacommunity
Magelona mirabilisspecies association

Habitat structure map


SEDIMENTOLOGY
SIDE-SCAN SONAR
RECORDINGSMACROBENTHOS
Macrobenthichabitat preferences
Sedimentologicalinterpretation
MACROBENTHIC SIDE-SCAN SONAR INTERPRETATION
CONCEPTCONCEPT

Macrobenthic habitat preferences: sedimentologyMacrobenthic habitat preferences: sedimentology
466000 467000 468000 469000 470000 471000 472000 473000 474000 475000
5661000
5662000
5663000
5664000
5665000
5666000
5667000
5668000
U TM 31-E D 50 coord ina tes
0 1 km
149
177
210
250
300
350
500
M edian (µm )grain-s ize
Fine sands(125-250 µm )
M edium sands(250-500 µm )
Coarse sands(500-1000 µm )
Com m unity GroupsM . m irab ilis spec. ass.A . a lba - M . b identa ta com m .N . c irrosa com m .O . lim acina - G . lap idum com m .
Nephtys cirrosacommunity
Abra alba – Mysella bidentatacommunity
Ophelia limacina – Glycera lapidumcommunity
Magelona mirabilisspecies association

Sedimentological interpretation of side-scan sonar recordingsSedimentological interpretation of side-scan sonar recordings
TRAPEGEER POTJE SWALE
(northern branch)
BROERSBANK
-2
-3
-4
-5Depth (m MLLWS)
Fine sands Medium sands
Medium dunes Coarser grainedwave ripples
Medium sands Fine sands with
higher silt-clay %
(higher degree of compaction)
050100150200250300350400450500 m

84 m
Macrobenthic side-scan sonar interpretation:Bioherm structures
-2
-4
-6
-81200 m0
TRAPEGEER POTJE SWALE(northern branch)
Visibility on SSS
Sample showing a very high abundance of Lanice conchilega
200 400 600 800 1000

0
10
20
30
40
50
0 10 - 50 50 - 100 100 -250
250 -500
500 -1000
> 1000
density classes of Lanice conchilega
No
0
5000
10000
15000
20000
tota
l den
sity
No total density
Macrobenthos:Macrobenthos: Lanice conchilegaLanice conchilega

0 200 400 600 800 1000
C um u la tive d istance (m )
- 8
- 7
- 6
- 5
- 4
- 3
De
pth
ML
LW
S (
m)
H A9910.012
H A9910.011
Swale area (Potje) Shoreface
Sid e-scan sonar imager y
d50: 178 musilt-clay: 3.5 %shells: 0 .9 %
d50: 177 musilt-clay: 9.4 %shells: 4 .8 %
Ar ea r epr esentat iv e ofCommunity B
Slope ar ear epr esentat iv e of
Community A
Macrobenthic side-scan sonar interpretation:Sedimentological habitat preferences (1)
Area representative forA. alba – M. bidentata community
Area representative forM. mirabilis
species association

0 200 400 600 800 1000
Cum u la tive d istance (m )
- 7
- 6
- 5
- 4
- 3
- 2
De
pth
ML
LW
S (
m) HA9910.005
HA9910.006
Sandbank area (Trapegeer)characterised by very large dunes
Swale area (Potje)
Sid e-scan sonar imager y
d50: 280 musilt-clay: 2 %shells: 11 % d50: 165 mu
silt-clay: 4.8 %shells: 10 %
Ar ea r epr esentat iv e ofCommunity C to D
Slope ar ear epr esentat iv e of
Community B
Macrobenthic side-scan sonar interpretation:Sedimentological habitat preferences (1)
Area representative forN. cirrosa or O. limacina – G. lapidum
community
Area representative forA. alba – M. bidentata
community
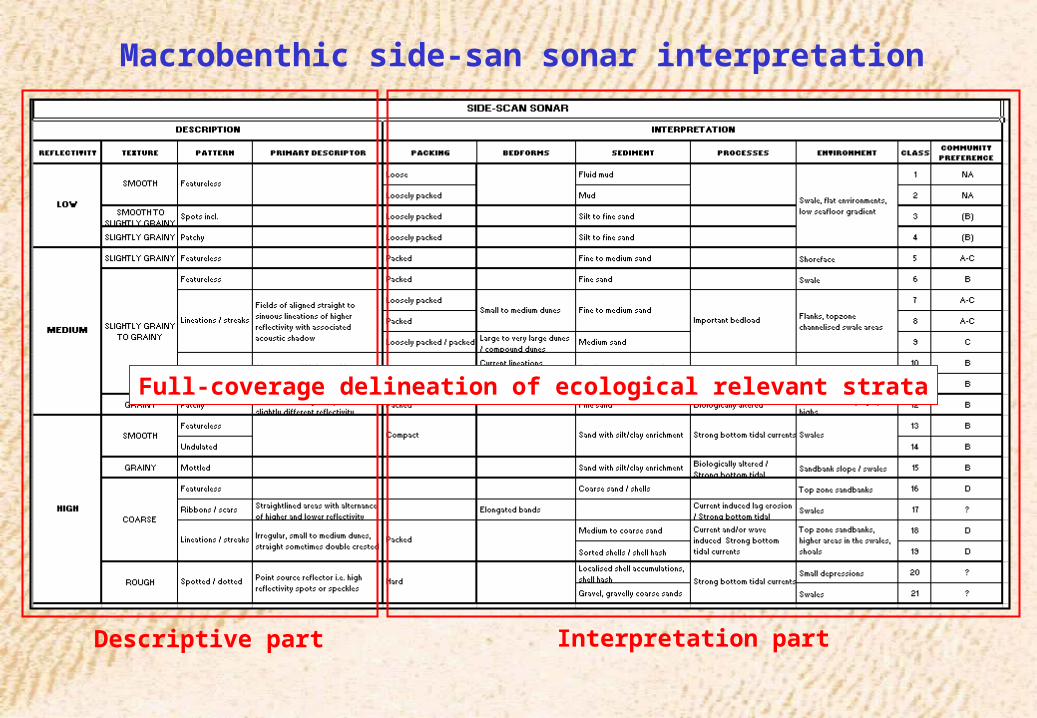
Macrobenthic side-san sonar interpretation
Descriptive part Interpretation part
Full-coverage delineation of ecological relevant strata

HABITAT model
MODELING
Quantified linking of environmental and macrobenthic parameters using
multiple discrimant analysis
Biology
Physical environment
Chemical environment
HABITAT model
CONCEPTCONCEPT
Based on macrobenthic habitat preferences
Quantified linking
Identification of ecological relevant variables


Strategies for future monitoringStrategies for future monitoring
1. Selection of strata, based on remote sensing
end-user and budget-dependent
2. Follow-up of monitoring stations
Macrobenthos
Ecological relevant environmental variables (cf. HABITAT model)
3. Full-coverage monitoring of the benthic environment
e.g. side-scan sonar