serie Analysis of group performance with categorical data ... · Analysis of group performance with...
25
Carmen Herrero, Ildefonso Mendez and Antonio Villar Analysis of group performance with categorical data when agents are heterogeneous: The case of compulsory education in the OECD a d serie WP-AD 2013-08
Transcript of serie Analysis of group performance with categorical data ... · Analysis of group performance with...
Carmen Herrero, Ildefonso Mendez and Antonio Villar
Analysis of group performance with categoricaldata when agents are heterogeneous: The case of compulsory education in the OECDad
serie
WP-AD 2013-08
Los documentos de trabajo del Ivie ofrecen un avance de los resultados de las investigaciones económicas en curso, con objeto de generar un proceso de discusión previo a su remisión a las revistas científicas. Al publicar este documento de trabajo, el Ivie no asume responsabilidad sobre su contenido. Ivie working papers offer in advance the results of economic research under way in order to encourage a discussion process before sending them to scientific journals for their final publication. Ivie’s decision to publish this working paper does not imply any responsibility for its content. La Serie AD es continuadora de la labor iniciada por el Departamento de Fundamentos de Análisis Económico de la Universidad de Alicante en su colección “A DISCUSIÓN” y difunde trabajos de marcado contenido teórico. Esta serie es coordinada por Carmen Herrero. The AD series, coordinated by Carmen Herrero, is a continuation of the work initiated by the Department of Economic Analysis of the Universidad de Alicante in its collection “A DISCUSIÓN”, providing and distributing papers marked by their theoretical content. Todos los documentos de trabajo están disponibles de forma gratuita en la web del Ivie http://www.ivie.es, así como las instrucciones para los autores que desean publicar en nuestras series. Working papers can be downloaded free of charge from the Ivie website http://www.ivie.es, as well as the instructions for authors who are interested in publishing in our series. Versión: noviembre 2013 / Version: November 2013 Edita / Published by: Instituto Valenciano de Investigaciones Económicas, S.A. C/ Guardia Civil, 22 esc. 2 1º - 46020 Valencia (Spain)
3
WP-AD 2013-08
Analysis of group performance with categorical data when agents are heterogeneous:
The case of compulsory education in the OECD
Carmen Herrero, Ildefonso Mendez and Antonio Villar*
Abstract
This paper analyses the evaluation of the relative performance of a set of groups when their outcomes are defined in terms of categorical data and the groups’ members are heterogeneous. This type of problem has been dealt with in Herrero and Villar (2012) for the case of a homogenous population. Here we expand their model controlling for heterogeneity by means of inverse probability weighting techniques. We apply this extended model to the analysis of compulsory education in the OECD countries, using the data in the PISA. We evaluate the relative performance of the different countries out of the distribution of the students’ achievements across the different levels of competence, controlling by the students’ characteristics (explanatory variables regarding schooling and family environment). We find that differences in reading ability across OECD countries would lower by 35% if their endowment of students’ characteristics would be that for the OECD average.
Keywords: Group performance, compulsory education, heterogeneity, categorical data, inverse probability weighting.
JEL classification numbers: I24, C14.
* C. Herrero: University of Alicante, Ivie and IAE. I. Mendez: University of Murcia. A. Villar: Pablo de Olavide University and Ivie. Corresponding author: I. Mendez, University of Murcia, Departamento de Economía Aplicada, Facultad de Economía y Empresa, 30100, Espinardo (Murcia), Spain. Phone: +34 868883732. Fax: +34 868883745. E-mail: [email protected].
We thank the editor and an anonymous referee for their comments and suggestions that led to considerable improvements of the paper. Thanks are also due to Dirk Van de Gaer, X. Ramos, F. Goerlich and the participants in different seminars for helpful comments. This paper was written while the first author was visiting the IAE, under the Salvador de Madariaga project PR2010-0124. This paper is framed within the projects SEJ2007-62656, SEJ-6882/ECON, ECO2010-21706 and PROMETEO 2013/037.
1 Introduction
We consider here an evaluation problem in which we have to compare the rela-tive performance of several groups, out of the distribution of the achievementsof their members in a set of ordered categories. Think for instance of the com-parison of the health situation of di¤erent countries out of the distribution ofthe population in four or �ve health statuses (e.g. from "excellent" to "verybad"). The key elements of the problem are, therefore, the presence of severalgroups, the qualitative nature of the outcome variable, which resolves into agiven set of ordered categories, and the focus on relative performance.This type of problem has been addressed recently by Herrero and Villar
(2012). They start by considering pairwise comparisons between groups in termsof the probability that an agent picked at random in one group belongs to ahigher category than an agent randomly chosen in the other. Then they extendthose comparisons to all groups involved, by taking into account both directand indirect relations. As a result they obtain an evaluation function thatcorresponds to the dominant eigenvector of a matrix that describes all thosecomparisons (see below). This evaluation function is characterized in terms ofsome ethical and operational properties.An implicit assumption in their model is that groups are homogeneous so
that the distribution of the outcome variable is the sole relevant information. Yetone might be interested in evaluating not only the observed outcomes but alsothe extent to which those outcomes re�ect diverse structural characteristics ofthe population that a¤ect the agents�performance. This may well be the casein the example mentioned above (comparing the health situation of di¤erentcountries), regarding the in�uence of aspects such as age or wealth in the �naloutcomes. To deal with this type of evaluation we need a methodology thatpermits making comparisons in terms of a common set of characteristics. Thisis the key point of this paper. More speci�cally, we combine here the originalmodel in Herrero and Villar (2012) with inverse probability weighting (IPW)techniques that permits one controlling for di¤erences in the distribution of thedeterminants of the outcome variable.Using this methodological approach we obtain a covariate-adjusted evalua-
tion that allows isolating the impact of the selected explanatory variables, bycomparing this evaluation with the unadjusted one. In that way we can separatethe part of the observed di¤erences that is explained by the covariates and thepart which cannot be accounted for. The covariate-adjusted eigenvector tells usabout the relative performance of the groups once their conditioning variableshave been equalized. Comparing the covariate-adjusted and the unadjustedevaluations permits one to estimate the impact of the latent variables on therelative performance.The interpretation of the di¤erences between both evaluations depends on
the problem at hand and, in particular, on the choice of the explanatory vari-ables. In this respect our analysis is reminiscent of the "equality of opportunity"literature, as covariate-adjusted values might be interpreted as an expression ofthe di¤erential "e¤ort", whereas the unadjusted values would re�ect the in-
2
4

terplay of both e¤ort and "opportunity".1 Yet, this model does not providea "measure" of equality of opportunity, as our comparison deals with relativeperformance both in the adjusted and unadjusted evaluations.We apply this extended model to the evaluation of compulsory education in
the OECD using the data provided by the Program for International StudentsAssessment (PISA). We evaluate the performance of schoolchildren regardingreading ability, out of the 2009 data set (the last one available). Our evaluationinvolves the estimation of the impact of the students� environment (parentaland school characteristics) on the �nal scores. Comparing the adjusted andunadjusted evaluations allows concluding that the set of explanatory variablesaccounts for 35% of the di¤erences in the relative performance. We also considerhow those di¤erences have evolved in the �rst decade of the 21st Century, bycomparing the results in 2009 and those in 2000. We �nd that di¤erences instudents�reading ability across OECD countries, both adjusted and unadjusted,have substantially decreased during that period, particularly so for EuropeanOECD countries.2
The paper is organised as follows. Section 2 presents the formal modelwhereas Section 3 applies it to the results on reading competence out of thedata in the PISA (2000 and 2009). Section 4 gathers a few �nal comments.
2 The Model
Consider a set of g groups or societies, G = f1; 2; :::; gg; each of which consistsof ni agents, i 2 G: We want to compare the relative performance of thosegroups with respect to a given aspect, when their achievements are given incategorical terms. More precisely, we assume that there is a set of categoricalpositions, H = fh1; :::; hsg; ordered from best to worst, h1 � � � � � hs (healthstatuses, educational levels, age intervals, professional positions, etc.). Eachgroup presents a given distribution of achievements across those categories. Ourgoal is comparing their relative performance, taking into account the role ofthe di¤erences in the structural characteristics that may in�uence the outcomevariable. To do so we divide the evaluation problem into two parts. First,
1Equality of Opportunity (EOp) is one of the most prominent concepts of distributivejustice. The key idea behind this concept is that the concern about inequality should notfocus on the equality of outcomes but rather on the existence of a common playing �eld for allpeople. From this perspective agents�outcomes can be regarded as deriving from two di¤erentsources: e¤ort and opportunity. E¤ort refers to people�s decisions whereas opportunity refersto the agents� external circumstances. A fair society is one in which �nal outcomes do notdepend much on the agents� external circumstances, that is, a society in which all peopleshare similar opportunities. In that society outcome di¤erences are basically determinedby the agents� preferences and e¤ort and not by aspects that are beyond their control andresponsibility (see Arneson, 1989; Cohen, 1989; Roemer, 1993, 1998; Fleurbaey, 2008).
2Here again our analysis is very close to that of equality of opportunity in education. See onthis respect Peragine and Serlenga (2008), Lefranc et al. (2008), Chechi and Peragine (2010),Calo-Blanco and Villar (2010), OECD (2010 b), Villar (2012), Calo-Blanco and García-Pérez(2013).
3
5

we assume that all groups are homogeneous regarding those characteristics, sothat the evaluation only takes into account their relative achievements. Thekey point here is how to make systematic comparisons out of qualitative data.Second, we consider that groups are heterogeneous and provide a method tocontrol for such heterogeneity.
2.1 The evaluation formula when groups are homogeneous
Let G = f1; 2; :::; gg stand for a set of g groups under the assumption thatthey are homogeneous with respect to the aspect under evaluation. Let air;for i = 1; :::; g; r = 1; :::s; be the proportion of people of group i in positionr; and let A stand for the matrix that collects all those values (that is, the ithrow of matrix A describes the distribution of achievements of group i across thedi¤erent categories, in terms of relative frequencies).An evaluation problem, or simply a problem, can be summarized by that
matrix A; under the assumption that the set of groups, G; and the set of cat-egorical positions, H; are given, and that we focus on the relative frequenciesof the agents across the categorical positions, independently on the size of thegroups (a property known as group replication invariance). Our target is tode�ne a suitable evaluation function that enables comparing the relative perfor-mance of the di¤erent groups.Given an evaluation problem A we say that group i dominates group j
when it is more likely that an agent chosen at random from i occupies a higherposition than an agent chosen at random from j. Let pij be the probability thatan agent from group i occupies a higher position than an agent from group j;and let eij = 1�pij�pji (that is, the probability that an individual in i; chosenat random, belongs to the same category that an individual in j; randomlychosen). Note that, those probabilities can be easily computed as follows:
pij = ai1(aj2 + � � � ajs) + ai2(aj3 + � � � ajs) + � � �+ ai;s�1ajseij = ai1aj1 + � � �+ aisajs
In pairwise comparisons, the quotient pij=pji tells us the relative advantageof group i with respect to group j. That is, pij=pji > 1 implies that people in ihave advantage over people in j; and viceversa.3
Remark 1 When the distribution of the population in group i stochasticallydominates that of group j, we have that pij > pji:4
3Lieberson (1976) in a similar vein introduces the Index of Net Di¤erence, ND(i; j) =jpij � pji j to inform about inequalities between two groups. If ND(ij) = 0, then pij = pjithat is, it is equally likely, given an individual chosen at random in any of the two groups thatthe individual in i is at a better position than the individual in j than the other way around.The other extreme case is when ND(i; j) = 1; which happens whenever all individuals in oneof the groups are at better positions than those in the other group. Intermediate positionsprovide with values of ND(i; j) between 0 and 1:
4Lefranc, Pistolesi and Trannoy (2008, 2009) make use of stochastic dominance for incomedistributions to compare equality of opportunity among two di¤erent groups of people.
4
6

Note that, when there are more than two groups, pairwise comparisons onlycover part of the relevant domination relationships. This is so because in thatcase one has to take into account not only direct dominance relations but alsothe indirect ones. That is, the relative position of group i with respect to groupj also depends on how those groups relate to third parties.Herrero and Villar (2012) introduce a summary measure of relative achieve-
ments that can take into account all those relations. They de�ne the relativeadvantage of group i with respect to group j; RAij ; as the ratio between theprobability that i dominates j and the sum of the probabilities that group i bedominated by other groups (a number between 0 and (g � 1)): Formally:
RAij =pijPk 6=i pki
That is, RAij is directly proportional to the probability of i dominating j andinversely proportional to the sum of the probabilities of i being dominated bysome other group. Observe that when there are only two groups, RAij = pij=pji;whereas this value changes in the presence of more groups. A summary measureof the overall advantage of a given group can thus be obtained as a weightedaverage of the relative advantages with respect to all groups. That is,
RAi =Xj 6=i
�jRAij
where �j is the weight attached to group j:It is natural to look for a weighting system consistent with the evaluation
of relative advantages. That is, a weighting system such that �j = RAj . Thatmeans that one has to �nd a vector v =(v1; v2; :::; vg) such that:
vi =Xj 6=i
vjRAij =Xj 6=i
vjpijPk 6=i pki
(1)
Herrero and Villar (2012) show that such a vector always exists, it is strictlypositive and unique (up to normalization), and has an interesting number ofadditional properties. Moreover, that vector v is easy to compute, since itcorresponds to the Perron eigenvector of the following matrix:
Q =
0BBBB@g � 1�
Pi6=1 pi1 p12 � � � p1g
p21 g � 1�P
i6=2 pi2 � � � p2g� � � � � � � � � � � �pg�1;1 pg�1;2 � � � pg�1;gpg1 pg2 � � � g � 1�
Pi6=g pig
1CCCCAThe interpretation of the components of matrix Q is the following. O¤-
diagonal elements (elements in place ij with i 6= j) are simply pij ; that is, theprobability that an individual chosen at random in group i is at a higher positionthan an individual chosen at random in group j: Thus all o¤-diagonal elements
5
7
capture the relative dominance between pairs of groups. As for the elementsin the diagonal, the element jj provides the probability of someone chosen atrandom in group j to be at least in a position as good as (or better than) anyonein any other group.It is easy to check that matrix Q is a Perron matrix all whose columns add
up to (g�1): Therefore, assuming that matrix Q is irreducible, there is a uniqueeigenvector, v >> 0; absorbent, and such that its components add up to g: Thecomponents of such an eigenvector satisfy equation [1], and thus, provide theevaluation we are looking for. Vector v can thus be regarded as a summarymeasure of the relative performance of the di¤erent groups.
2.2 Controlling for heterogeneity
We now show how to combine this model with inverse probability weighting(IPW) techniques that permit one controlling for di¤erences in the distributionof the determinants of the outcomes in the di¤erent groups. We obtain in thisway a covariate-adjusted eigenvector that provides an evaluation of the rela-tive performance once the impact of the di¤erences in the distribution of thecovariates has been cancelled. Comparing covariate-adjusted and unadjustedevaluations tells us about the in�uence of the explanatory variables in the ob-served performance.The IPW estimators are easy to implement, allow for an undetermined
amount of heterogeneity in the estimates, and make no assumption on the dis-tribution of the outcome variable H. Additionally, it has been shown in thetreatment e¤ects literature that the IPW estimators provide consistent and insome cases asymptotically e¢ cient estimates of the parameter of interest un-der fairly standard regularity conditions. Furthermore, Busso et al. (2009)showed that the IPW estimators exhibit the best overall �nite sample perfor-mance among the broad class of treatment e¤ect estimators. This is particularlyrelevant in the current context since estimation samples are of modest size inmany empirical applications.The goal is to ensure the same distribution of the covariates (X) in each
category (h) of each group (r) used to calculate the eigenvector. We �rst chooseone of the C = g � s subsamples in which the total sample is partitioned, labeledcr, as the reference sample, i.e. that whose distribution of covariates is to beused in the remaining C � 1 subsamples. Alternatively, we could use the totalsample for group g or the overall sample for all the groups as the referencesample. Later in this section we analyze how the reference sample a¤ects theoutcome of the evaluation tool and we also provide some insights on how toselect the reference sample.Next, we generate a set of dummy indicator variables Zc that equal one if
an observation belongs to the reference sample and zero if it belongs to sub-sample c, for c 2 C; c 6= cr. We then estimate the conditional probability ofbeing in the reference sample given X, i.e. pc (x) = P (Zc = 1=X = x) for eachobservation in subsample c, for c 2 C; c 6= cr. This variable is known as thepropensity score in the treatment e¤ects literature. The research value of the
6
8
propensity score rests on its power to solve the dimensionality problem, sinceadjusting for between-groups di¤erences on a high dimensional vector of covari-ates can be either di¢ cult or impossible. Rosenbaum and Rubin (1983) showthat the propensity score captures all of the variance on the covariates relevantfor adjusting between-group comparisons, that is, treated (Zc = 1) and con-trol (Zc = 0) units with the same value of the propensity score have the samedistribution of the elements in X.The propensity score can be estimated by means of a simple binary choice
model like a logit or a probit model or by nonparametric methods like powerseries regression. The distribution of the covariates in a particular subsample ischanged for that in the reference sample by simply introducing the appropriateweighting function �c. Formally, let g (X), g (X=Zc = 1) and g (X=Zc = 0) bethe joint density of X in the estimation sample, in the reference subsample andin subsample c, respectively, and observe that by de�nition,
g (X) =g (X=Zc = j)P (Zc = j)
P (Zc = j=X); for j = f0; 1g .
Then, it follows that:
P (Zc = 1=X) (1� P (Zc = 1))(1� P (Zc = 1=X))P (Zc = 1)| {z }
�c
� g (X=Zc = 0) = g (X=Zc = 1) , (2)
where P (Zc = 1) is the proportion of observations from the reference sample inthe estimation sample. This equation suggests a simple three-step method tochange the distribution of X in each subsample for that in the reference sample.First, get an estimate of the propensity score for each observation in the sample.Second, plug the estimated propensity score and the proportion of observationsfrom the reference sample in the estimation sample into the sample analog of �cto obtain an estimate of the weighting function.5 Next, use the estimated �c toweight observations of subsample c and calculate, for each group, the proportionof observations in each category. The covariate-adjusted eigenvector is obtainedby simply applying the evaluation tool due to Herrero and Villar (2012) to thenew percentages.This weighting scheme works by weighting-down (-up) the distribution of
1s of the dummy indicator variable (1� Zc) for observations in subsample cfor those values of the elements of X that are (over-) under-represented amongobservations in the reference sample. The following overlap assumption on thejoint distribution of Z and X is necessary for the estimation problem to be wellde�ned: 0 < P (Zc = 1=X) < 1, for c 2 C. This common support conditionstates that for a given value of X there is some fraction of the estimation samplein the reference sample and in subsample c to be compared. Lack of overlap aswell as estimated propensity scores close to one can lead to imprecise estimatesof �c. To overcome this limitation we follow Crump et al. (2009). They propose
5The weights are normalized so that they add up to one within each subsample.
7
9
a systematic approach to addressing lack of overlap in estimation of averagetreatment e¤ects by characterizing optimal estimation subsamples for whichthe average treatment e¤ect can be estimated most precisely. Remarkably, theoptimal rule depends solely on the propensity score in most cases. We apply theprocedure in Crump et al. (2009) for the treatment e¤ect on the treated, theparameter whose weighting function is that in [2], to each of the comparisonsthat we perform.That could be argued that only the observations of the reference sample that
belong to all the optimal estimation subsamples de�ned according to Crumpet al. (2009) should be used to calculate the covariate-adjusted eigenvector.However, that requirement can only be satis�ed if C is not very large and thesubsamples being compared do not di¤er to a great extent in the distribution ofthe variables in X. Otherwise, the cost in terms of sacri�ced external validitywould be higher than the improvement in internal validity.The choice of the reference sample a¤ects the relative importance of each
category within each group (aij), the probability that an agent from group ioccupies a higher position than an agent from group j (pij), the ratio betweenany two p�s and, thus, the outcome of the evaluation process (vi).6 The moreselected the reference sample, the higher the cost in terms of sacri�ced externalvalidity. That is the case for the lowest and highest pro�ciency levels, partic-ularly so in the latter case for the less developed OECD countries. We use theoverall sample of OECD countries as the reference sample in our application.This way we analyze how the relative scholastic performance of the OECD coun-tries would change if their endowment of environmental variables would be thatfor the OCDE average.7
The covariate adjusted matrix corresponds to the homogenous groups case.That is, the information has been transformed so that it describes the out-comes that would have been obtained if all groups were similar regarding theexplanatory variables. The covariate-adjusted eigenvector, v�; tells us the rela-tive di¤erences in the groups that are not accounted for those variables. And,consequently, the di¤erence between the eigenvector obtained with the origi-nal data and the covariate-adjusted one tells us about the impact of levelingthe environmental variables in the evaluation of the relative performance of thedi¤erent groups.This model is applied in the next Section to evaluate schoolchildren scholastic
performance across 29 OECD countries. We do so by considering the distribu-tion of the students in �ve categories of reading competence (the six determinedby PISA, after merging levels 5 and 6). This leaves us with 145 subsamples tocompare. Moreover, there exists a large heterogeneity in the distribution of thevariables in X both between and within OECD countries. For these reasons,
6Conversely, the ratio between any two ��s is invariant to the selection of the referencesample.
7Our results remain qualitatively largely unchanged when we use particular subsamples asthe reference sample. In general, we �nd that the more selected is the reference subsample, thehigher is the di¤erence that accounting for covariates makes with respect to the unadjustedeigenvector.
8
10

we cannot restrict the reference subsample to those observations satisfying theoptimal selection rule in all the comparisons. The same holds when we restrictthe analysis to the 21 OECD European countries.
3 The evaluation of compulsory education in theOECD through PISA
Compulsory education is probably the most basic instance of social insurance asit guarantees minimal levels of knowledge to all citizens in a given society, whichin turn conditions their opportunities regarding access to the labour market,further education, and the extent of social interactions. Most OECD countrieshave established a ten- to eleven-year period of compulsory education (from 6to 15 or 16 years). It is important to know how e¤ective this education is, howdi¤erent are the educational outcomes both between and within countries, andhow much those di¤erences depend on the countries�observable characteristics.Here we apply the model presented above to evaluate compulsory education
in the OECD countries out of the data provided by the Programme for Inter-national Student Assessment (PISA). This Programme provides the broadestdataset for the evaluation of schoolchildren performance and the characteris-tics of their schooling and family environments. It is a triennial worldwide testof 15-year-old schoolchildren�s scholastic performance, the implementation ofwhich is coordinated by the OECD. PISA surveys started in 2000 with the aimof evaluating the students�ability, about the end of compulsory education, inthree di¤erent domains: reading, mathematics and science.Every period of assessment specialises in one particular category, but it also
tests the other two main areas studied. The 2009 report has focused on readingability, which is a key determinant of individuals� learning capacity and con-ditions their participation in social life. �Levels of reading literacy are morereliable predictors of economic and social wellbeing than is the quantity of ed-ucation as measured by years at school or in post-school education. . . It is thequality of learning outcomes, not the length of schooling, that makes the di¤er-ence.�(OECD (2010a), p. 32).We focus on the data in PISA 2009 to analyze the di¤erent performance
of educational systems regarding schoolchildren�s reading ability across OECDcountries.8 The focus of our analysis is threefold. First, we investigate therelative performance of OECD countries in 2009 comparing the distributionof mean score tests and their relative performance, as measured by the corre-sponding (unadjusted) eigenvector. Second, we estimate the students�relativeachievements once their external circumstances have been equalized, using twodi¤erent sets of explanatory variables. And third, we provide a rapid overviewof the changes experienced in 2009 with respect to 2000. Given this purpose, we
8One of the assets of the PISA report is that it provides a uni�ed scoring system to evaluatethe performance of 15-year-old students in very di¤erent countries. The units of those scoresare set with respect to the values obtained in the 2000 wave of the report, by taking a valueof 500 for the average of the OECD Member States with a standard deviation of 100.
9
11

can only consider 29 out of the 34 OECD countries, since Estonia, the SlovakRepublic, Slovenia and Turkey did not participate in the 2000 wave and Japanparticipated but did not inform on the educational level of the students�parents.
3.1 Comparing the relative performance of OECD educa-tional systems in 2009
The PISA report provides a classi�cation of the students in six di¤erent levelsof reading competence, from Level 1 (the lowest level) to Level 6 (the highestone). Those levels are de�ned in terms of the capacity of the students to mastercertain cognitive processes and operationalized in terms of ranges of the scoresobtained by the students (see Figure 1.2.12 in OECD (2010a) for details). Table1 summarizes the scoring intervals that parameterize those levels of competence.
Insert Table 1 here
We combine levels 5 and 6 of reading competence into a unique upper levelsince the share of students in the sixth level is quite low in most countries andit does not allow us to obtain accurate estimates of the propensity score for thestudents in that level.9 The reduction in the number of levels of reading compe-tence leaves almost unchanged the unadjusted eigenvectors but it substantiallyincreases the stability of the covariate-adjusted eigenvectors as we increase thenumber of covariates used to estimate the propensity score. The distributionof students within the �ve levels of reading competence in 2009 is presented inTable 2.
Insert Table 2 here
In order to compare the performance of educational systems out of the dis-tribution of outcomes in Table 2 we rely on the model of Section 2. Now groupsare OECD countries, members are the 15-year old students within each coun-try, and categories correspond to the �ve levels of reading competence. Table3 below presents the eigenvector for the year 2009 and compares those valueswith the mean scores of the PISA tests.10 We present both unadjusted andcovariate-adjusted eigenvectors (indeed we present two di¤erent covariate ad-justed vectors, to be explained below). The eigenvectors have been normalizedso that the sum of its components equals the number of components. Thatis, values above one indicate that the country performs over the mean, whilecomponents below one are to be interpreted as performing below the mean.
9Less than 1% of the students have a reading competence of level 6 in 26 out of the 29OECD countries.10Test results are not presented in PISA as point estimates. Rather, PISA reports stu-
dent performance through �ve plausible values that can be de�ned as random values fromthe posterior distribution of an student�s performance (see OECD (2009) for details). Asindicated in OECD (2009), we perform our statistical analysis independently on each of the�ve plausible values. The �nal eigenvector is the average of the eigenvectors obtained foreach of the �ve plausible values. Anyway, the resulting eigenvectors are almost identical tothose obtained using the average of the �ve plausible values as the summary measure of thestudents�performance.
10
12
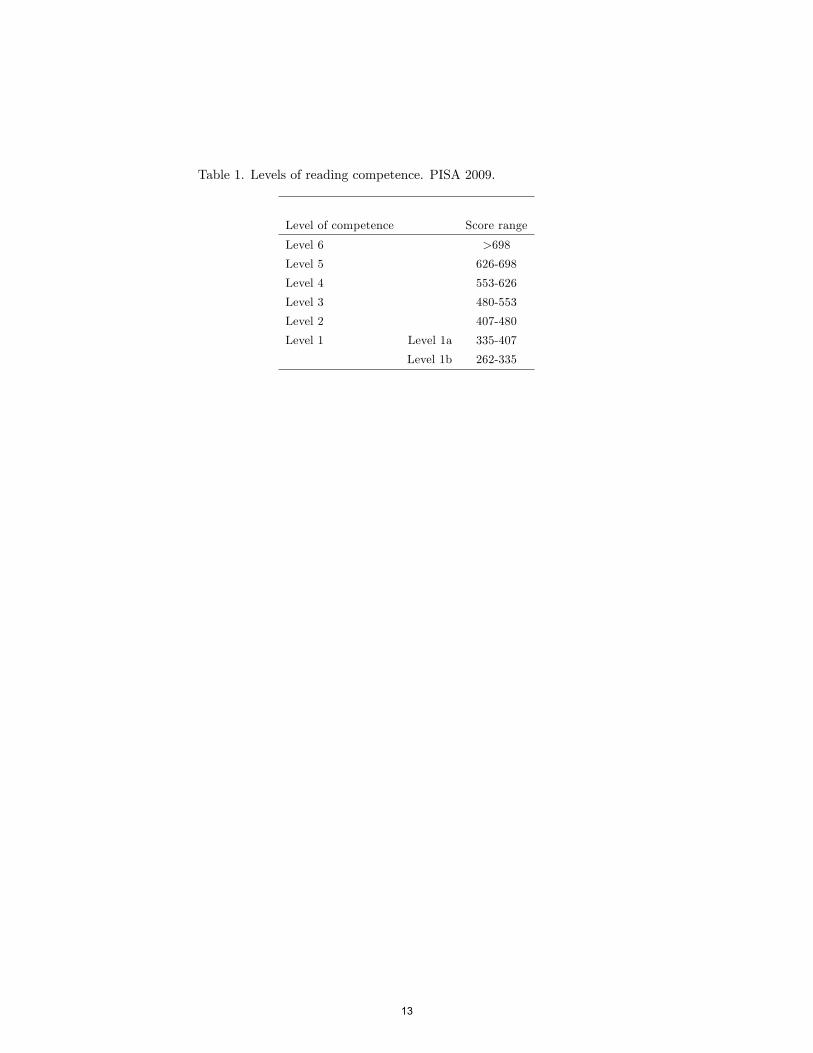
Table 1. Levels of reading competence. PISA 2009.
Level of competence Score range
Level 6 >698
Level 5 626-698
Level 4 553-626
Level 3 480-553
Level 2 407-480
Level 1 Level 1a 335-407
Level 1b 262-335
19
13
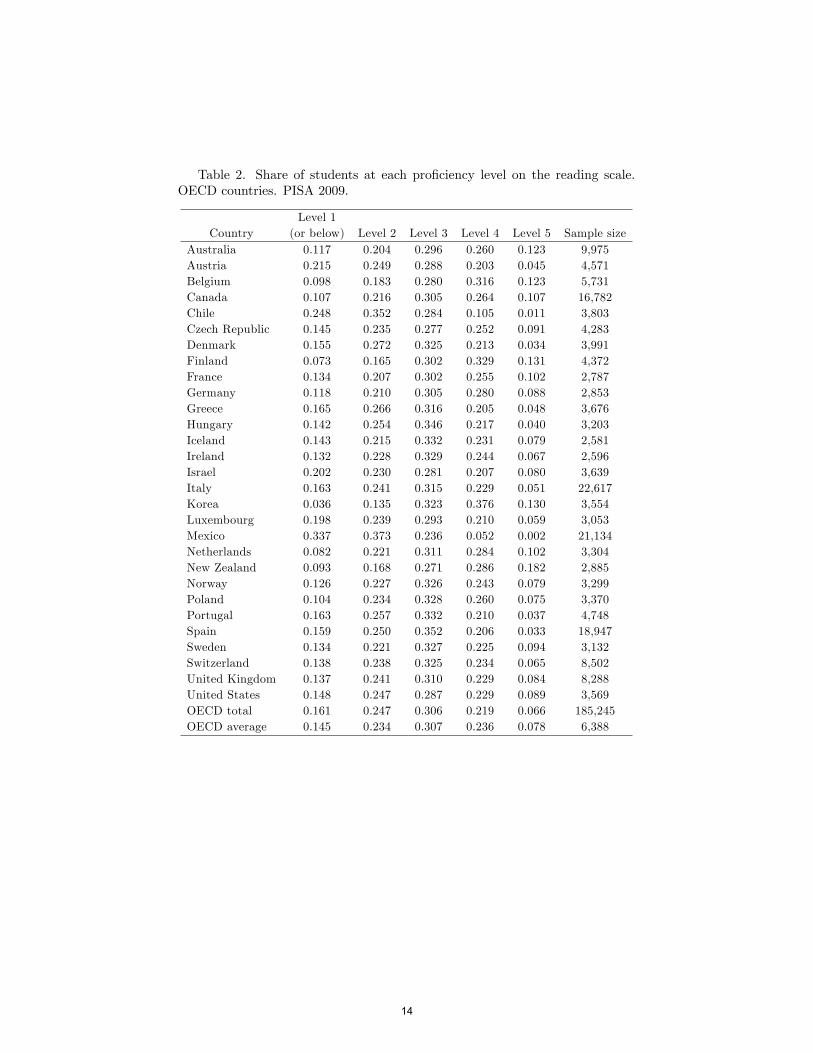
Table 2. Share of students at each pro�ciency level on the reading scale.OECD countries. PISA 2009.
Level 1Country (or below) Level 2 Level 3 Level 4 Level 5 Sample size
Australia 0.117 0.204 0.296 0.260 0.123 9,975Austria 0.215 0.249 0.288 0.203 0.045 4,571Belgium 0.098 0.183 0.280 0.316 0.123 5,731Canada 0.107 0.216 0.305 0.264 0.107 16,782Chile 0.248 0.352 0.284 0.105 0.011 3,803Czech Republic 0.145 0.235 0.277 0.252 0.091 4,283Denmark 0.155 0.272 0.325 0.213 0.034 3,991Finland 0.073 0.165 0.302 0.329 0.131 4,372France 0.134 0.207 0.302 0.255 0.102 2,787Germany 0.118 0.210 0.305 0.280 0.088 2,853Greece 0.165 0.266 0.316 0.205 0.048 3,676Hungary 0.142 0.254 0.346 0.217 0.040 3,203Iceland 0.143 0.215 0.332 0.231 0.079 2,581Ireland 0.132 0.228 0.329 0.244 0.067 2,596Israel 0.202 0.230 0.281 0.207 0.080 3,639Italy 0.163 0.241 0.315 0.229 0.051 22,617Korea 0.036 0.135 0.323 0.376 0.130 3,554Luxembourg 0.198 0.239 0.293 0.210 0.059 3,053Mexico 0.337 0.373 0.236 0.052 0.002 21,134Netherlands 0.082 0.221 0.311 0.284 0.102 3,304New Zealand 0.093 0.168 0.271 0.286 0.182 2,885Norway 0.126 0.227 0.326 0.243 0.079 3,299Poland 0.104 0.234 0.328 0.260 0.075 3,370Portugal 0.163 0.257 0.332 0.210 0.037 4,748Spain 0.159 0.250 0.352 0.206 0.033 18,947Sweden 0.134 0.221 0.327 0.225 0.094 3,132Switzerland 0.138 0.238 0.325 0.234 0.065 8,502United Kingdom 0.137 0.241 0.310 0.229 0.084 8,288United States 0.148 0.247 0.287 0.229 0.089 3,569OECD total 0.161 0.247 0.306 0.219 0.066 185,245OECD average 0.145 0.234 0.307 0.236 0.078 6,388
20
14

Equivalently, the mean scores of the PISA tests have been normalized by set-ting its average equal to one.
Insert Table 3 here
The unadjusted eigenvectors and the mean scores of the PISA tests yieldsimilar results in terms of ranking but rather di¤erent pictures in terms of cross-country di¤erences, with the distribution of mean score values being far moreconcentrated around the mean than that of eigenvector components. Indeed,while the Kendall�s rank order correlation coe¢ cient between the two evaluationmeasures is 0.92, the coe¢ cient of variation of the eigenvector components iseight times that of the mean scores.The normalized mean score underestimates the relative advantage of the
countries that perform best at reading according to the eigenvector and overes-timates the relative position of the countries that perform worst. For example,the normalized mean score of Korea, New Zeland, Finland and Belgium, thefour countries at the top of the distribution according to the eigenvector, are46%, 37%, 31% and 26% lower than the corresponding eigenvector components,respectively. Conversely, the mean scores of Greece, Austria, Chile and Mexico,the four countries at the bottom of the distribution according to the eigenvector,are 3, 2.2, 1.4 and 1.3 times larger than the corresponding eigenvector compo-nents, respectively. The di¤erence between the two evaluation methods is ofmodest size for the countries that perform close to the mean.
3.2 Accounting for di¤erences in characteristics
We now move to the covariate-adjusted eigenvectors in column (1). These wereobtained by using the set of students�external factors that is common to boththe 2000 and the 2009 reports in the estimation of the propensity score.11 Inthis speci�cation we control for children�s sex and for the employment statusand the educational level of their parents by means of a set of dummy indicatorvariables that inform on whether the father or the mother are employed andwhether their highest educational level is the secondary or the tertiary levelas de�ned in the International Standard Classi�cation of Education (ISCED).We also control for whether at least one of the parents was born in a countrydi¤erent from their current country of residence and for whether there are atleast one hundred books at home or not.Regarding their schooling environment, we control for the share of the school
total funding for a typical school year that comes from the government, whetherthe assessments of students are used to make judgments about teachers�e¤ec-tiveness or not and whether the principal, the department head or the teachershave the main responsibility for hiring teachers or not.12 All these familiar and
11The propensity scores are estimated using binary logit models. The reference subsampleis the average of the OECD, and for the �rst pro�ciency level.12The relevance of government funding is preferred to the indicator of whether the school
is public or private because of the large number of missing values in the latter variable in the2000 report.
11
15
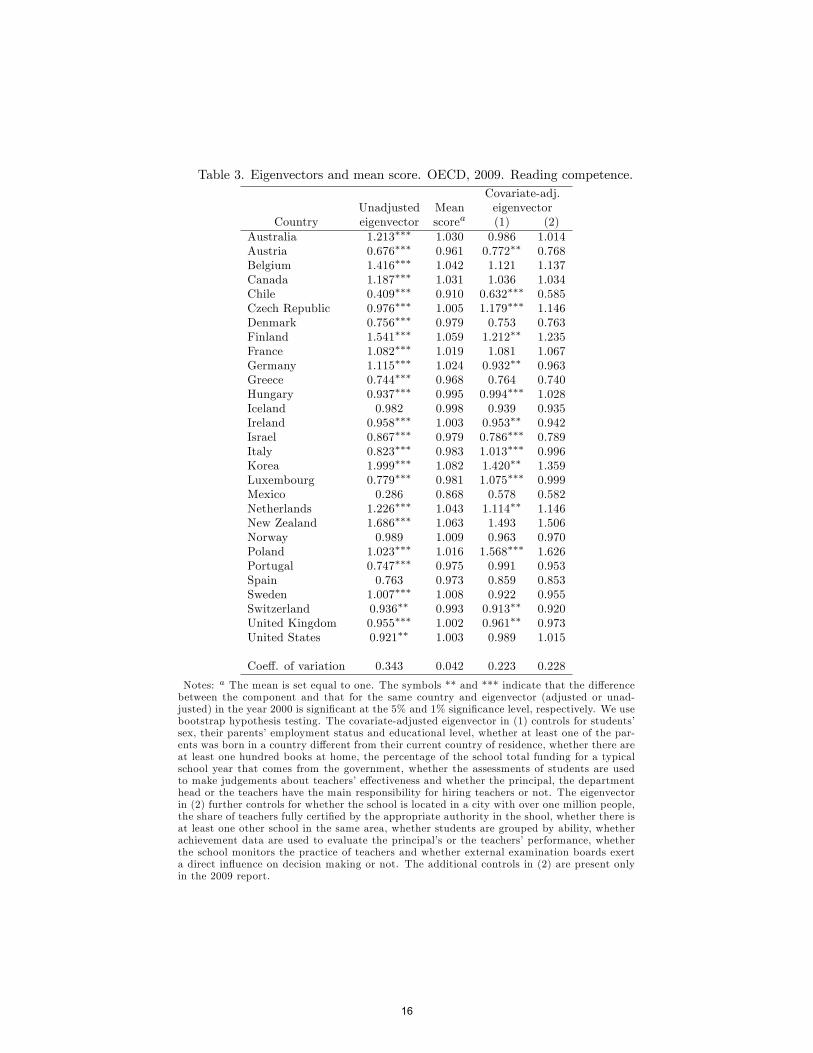
Table 3. Eigenvectors and mean score. OECD, 2009. Reading competence.Covariate-adj.
Unadjusted Mean eigenvectorCountry eigenvector scorea (1) (2)
Australia 1.213��� 1.030 0.986 1.014Austria 0.676��� 0.961 0.772�� 0.768Belgium 1.416��� 1.042 1.121 1.137Canada 1.187��� 1.031 1.036 1.034Chile 0.409��� 0.910 0.632��� 0.585Czech Republic 0.976��� 1.005 1.179��� 1.146Denmark 0.756��� 0.979 0.753 0.763Finland 1.541��� 1.059 1.212�� 1.235France 1.082��� 1.019 1.081 1.067Germany 1.115��� 1.024 0.932�� 0.963Greece 0.744��� 0.968 0.764 0.740Hungary 0.937��� 0.995 0.994��� 1.028Iceland 0.982 0.998 0.939 0.935Ireland 0.958��� 1.003 0.953�� 0.942Israel 0.867��� 0.979 0.786��� 0.789Italy 0.823��� 0.983 1.013��� 0.996Korea 1.999��� 1.082 1.420�� 1.359Luxembourg 0.779��� 0.981 1.075��� 0.999Mexico 0.286 0.868 0.578 0.582Netherlands 1.226��� 1.043 1.114�� 1.146New Zealand 1.686��� 1.063 1.493 1.506Norway 0.989 1.009 0.963 0.970Poland 1.023��� 1.016 1.568��� 1.626Portugal 0.747��� 0.975 0.991 0.953Spain 0.763 0.973 0.859 0.853Sweden 1.007��� 1.008 0.922 0.955Switzerland 0.936�� 0.993 0.913�� 0.920United Kingdom 0.955��� 1.002 0.961�� 0.973United States 0.921�� 1.003 0.989 1.015
Coe¤. of variation 0.343 0.042 0.223 0.228
Notes: a The mean is set equal to one. The symbols ** and *** indicate that the di¤erencebetween the component and that for the same country and eigenvector (adjusted or unad-justed) in the year 2000 is signi�cant at the 5% and 1% signi�cance level, respectively. We usebootstrap hypothesis testing. The covariate-adjusted eigenvector in (1) controls for students�sex, their parents�employment status and educational level, whether at least one of the par-ents was born in a country di¤erent from their current country of residence, whether there areat least one hundred books at home, the percentage of the school total funding for a typicalschool year that comes from the government, whether the assessments of students are usedto make judgements about teachers�e¤ectiveness and whether the principal, the departmenthead or the teachers have the main responsibility for hiring teachers or not. The eigenvectorin (2) further controls for whether the school is located in a city with over one million people,the share of teachers fully certi�ed by the appropriate authority in the shool, whether there isat least one other school in the same area, whether students are grouped by ability, whetherachievement data are used to evaluate the principal�s or the teachers�performance, whetherthe school monitors the practice of teachers and whether external examination boards exerta direct in�uence on decision making or not. The additional controls in (2) are present onlyin the 2009 report.
21
16
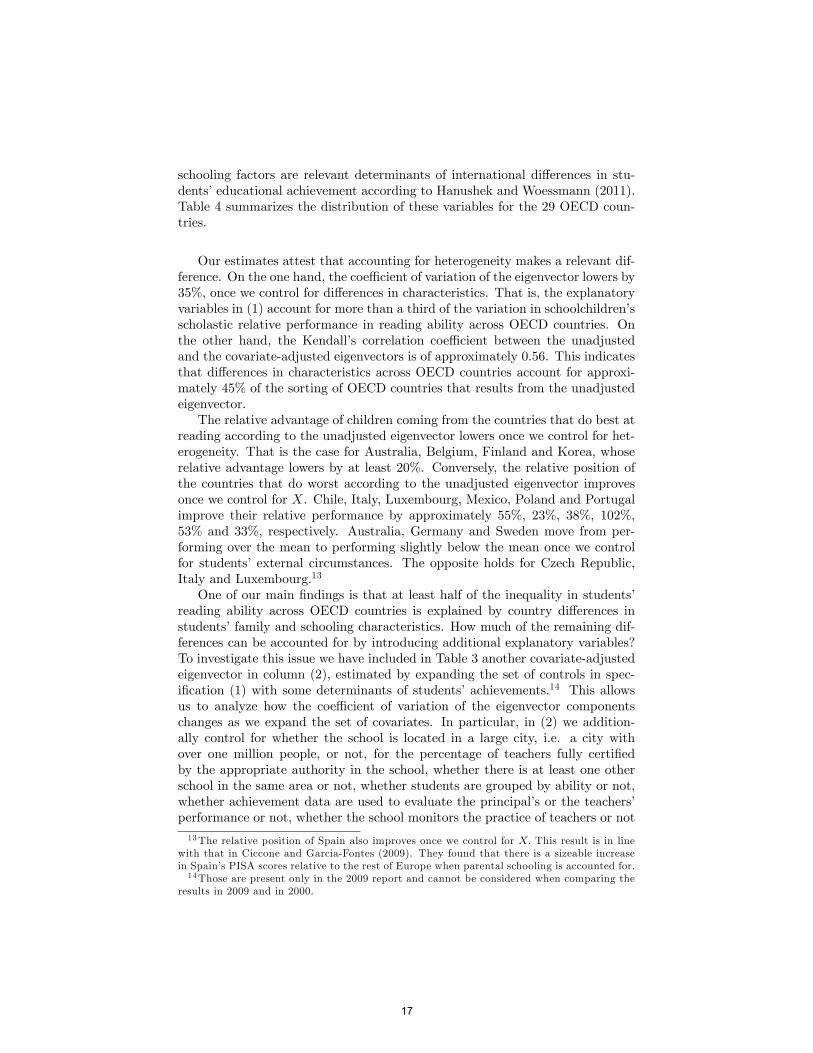
schooling factors are relevant determinants of international di¤erences in stu-dents�educational achievement according to Hanushek and Woessmann (2011).Table 4 summarizes the distribution of these variables for the 29 OECD coun-tries.
Insert Table 4 here
Our estimates attest that accounting for heterogeneity makes a relevant dif-ference. On the one hand, the coe¢ cient of variation of the eigenvector lowers by35%, once we control for di¤erences in characteristics. That is, the explanatoryvariables in (1) account for more than a third of the variation in schoolchildren�sscholastic relative performance in reading ability across OECD countries. Onthe other hand, the Kendall�s correlation coe¢ cient between the unadjustedand the covariate-adjusted eigenvectors is of approximately 0.56. This indicatesthat di¤erences in characteristics across OECD countries account for approxi-mately 45% of the sorting of OECD countries that results from the unadjustedeigenvector.The relative advantage of children coming from the countries that do best at
reading according to the unadjusted eigenvector lowers once we control for het-erogeneity. That is the case for Australia, Belgium, Finland and Korea, whoserelative advantage lowers by at least 20%. Conversely, the relative position ofthe countries that do worst according to the unadjusted eigenvector improvesonce we control for X. Chile, Italy, Luxembourg, Mexico, Poland and Portugalimprove their relative performance by approximately 55%, 23%, 38%, 102%,53% and 33%, respectively. Australia, Germany and Sweden move from per-forming over the mean to performing slightly below the mean once we controlfor students�external circumstances. The opposite holds for Czech Republic,Italy and Luxembourg.13
One of our main �ndings is that at least half of the inequality in students�reading ability across OECD countries is explained by country di¤erences instudents�family and schooling characteristics. How much of the remaining dif-ferences can be accounted for by introducing additional explanatory variables?To investigate this issue we have included in Table 3 another covariate-adjustedeigenvector in column (2), estimated by expanding the set of controls in spec-i�cation (1) with some determinants of students�achievements.14 This allowsus to analyze how the coe¢ cient of variation of the eigenvector componentschanges as we expand the set of covariates. In particular, in (2) we addition-ally control for whether the school is located in a large city, i.e. a city withover one million people, or not, for the percentage of teachers fully certi�edby the appropriate authority in the school, whether there is at least one otherschool in the same area or not, whether students are grouped by ability or not,whether achievement data are used to evaluate the principal�s or the teachers�performance or not, whether the school monitors the practice of teachers or not13The relative position of Spain also improves once we control for X: This result is in line
with that in Ciccone and Garcia-Fontes (2009). They found that there is a sizeable increasein Spain�s PISA scores relative to the rest of Europe when parental schooling is accounted for.14Those are present only in the 2009 report and cannot be considered when comparing the
results in 2009 and in 2000.
12
17
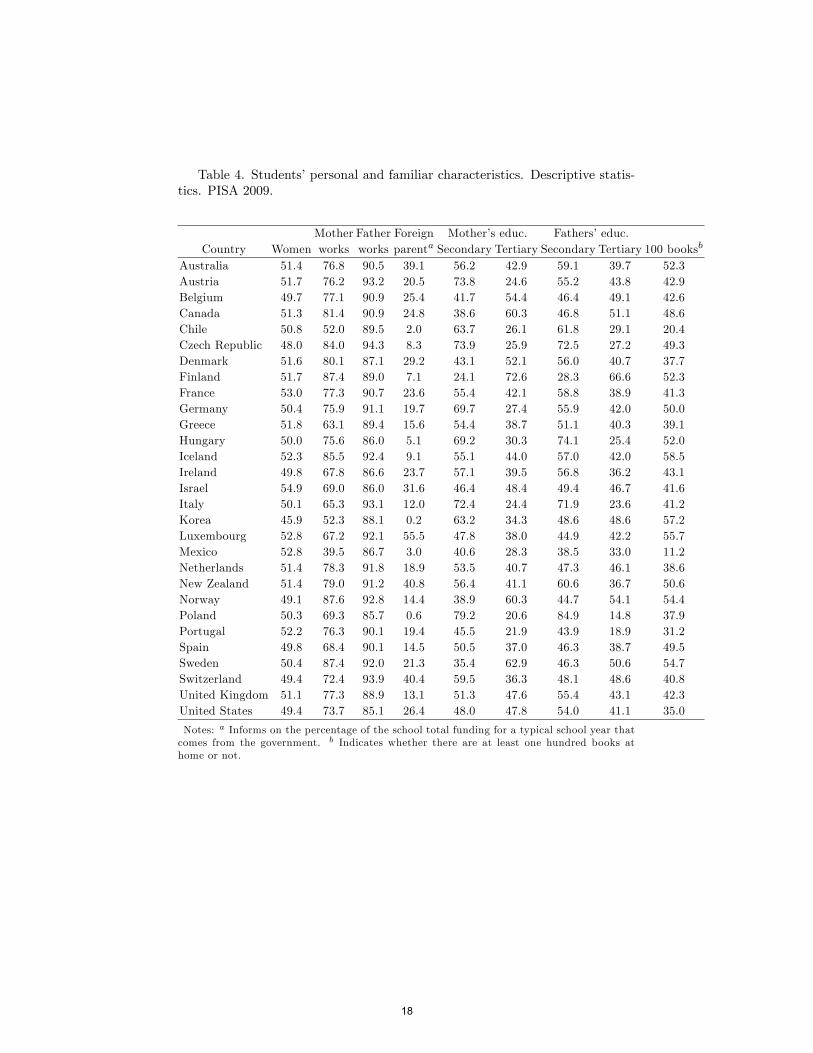
Table 4. Students�personal and familiar characteristics. Descriptive statis-tics. PISA 2009.
Mother Father Foreign Mother�s educ. Fathers�educ.Country Women works works parenta Secondary Tertiary Secondary Tertiary 100 booksb
Australia 51.4 76.8 90.5 39.1 56.2 42.9 59.1 39.7 52.3Austria 51.7 76.2 93.2 20.5 73.8 24.6 55.2 43.8 42.9Belgium 49.7 77.1 90.9 25.4 41.7 54.4 46.4 49.1 42.6Canada 51.3 81.4 90.9 24.8 38.6 60.3 46.8 51.1 48.6Chile 50.8 52.0 89.5 2.0 63.7 26.1 61.8 29.1 20.4Czech Republic 48.0 84.0 94.3 8.3 73.9 25.9 72.5 27.2 49.3Denmark 51.6 80.1 87.1 29.2 43.1 52.1 56.0 40.7 37.7Finland 51.7 87.4 89.0 7.1 24.1 72.6 28.3 66.6 52.3France 53.0 77.3 90.7 23.6 55.4 42.1 58.8 38.9 41.3Germany 50.4 75.9 91.1 19.7 69.7 27.4 55.9 42.0 50.0Greece 51.8 63.1 89.4 15.6 54.4 38.7 51.1 40.3 39.1Hungary 50.0 75.6 86.0 5.1 69.2 30.3 74.1 25.4 52.0Iceland 52.3 85.5 92.4 9.1 55.1 44.0 57.0 42.0 58.5Ireland 49.8 67.8 86.6 23.7 57.1 39.5 56.8 36.2 43.1Israel 54.9 69.0 86.0 31.6 46.4 48.4 49.4 46.7 41.6Italy 50.1 65.3 93.1 12.0 72.4 24.4 71.9 23.6 41.2Korea 45.9 52.3 88.1 0.2 63.2 34.3 48.6 48.6 57.2Luxembourg 52.8 67.2 92.1 55.5 47.8 38.0 44.9 42.2 55.7Mexico 52.8 39.5 86.7 3.0 40.6 28.3 38.5 33.0 11.2Netherlands 51.4 78.3 91.8 18.9 53.5 40.7 47.3 46.1 38.6New Zealand 51.4 79.0 91.2 40.8 56.4 41.1 60.6 36.7 50.6Norway 49.1 87.6 92.8 14.4 38.9 60.3 44.7 54.1 54.4Poland 50.3 69.3 85.7 0.6 79.2 20.6 84.9 14.8 37.9Portugal 52.2 76.3 90.1 19.4 45.5 21.9 43.9 18.9 31.2Spain 49.8 68.4 90.1 14.5 50.5 37.0 46.3 38.7 49.5Sweden 50.4 87.4 92.0 21.3 35.4 62.9 46.3 50.6 54.7Switzerland 49.4 72.4 93.9 40.4 59.5 36.3 48.1 48.6 40.8United Kingdom 51.1 77.3 88.9 13.1 51.3 47.6 55.4 43.1 42.3United States 49.4 73.7 85.1 26.4 48.0 47.8 54.0 41.1 35.0
Notes: a Informs on the percentage of the school total funding for a typical school year thatcomes from the government. b Indicates whether there are at least one hundred books athome or not.
22
18
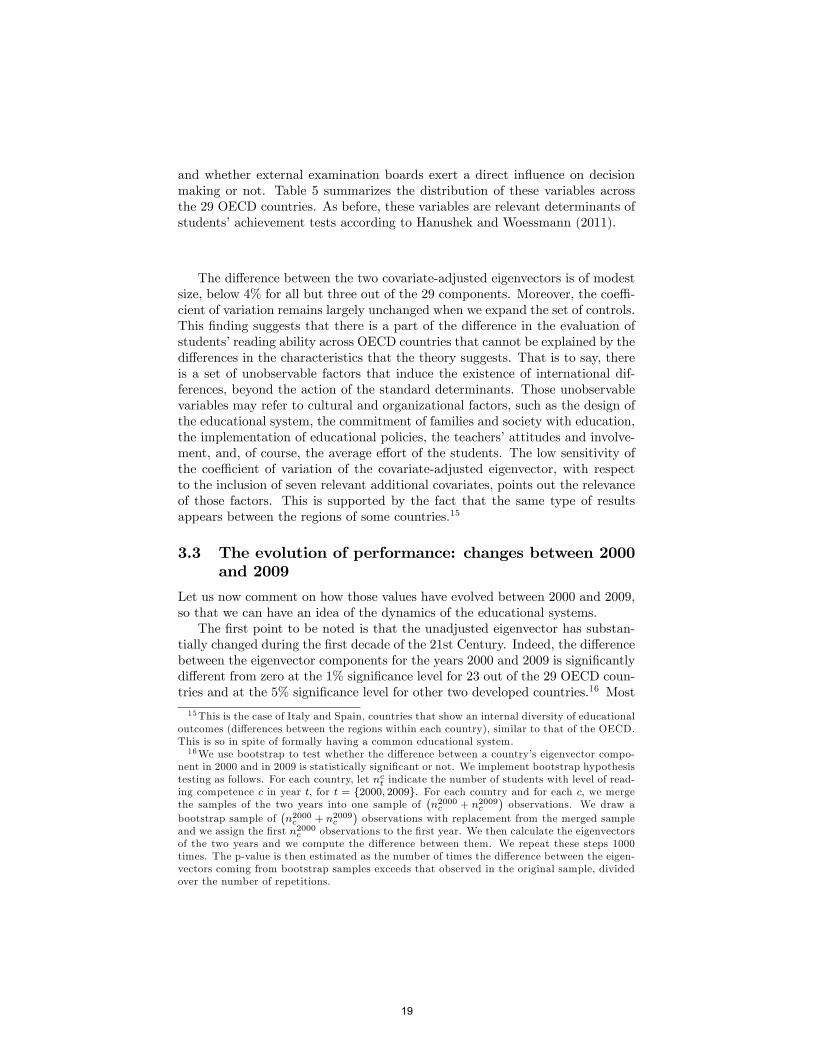
and whether external examination boards exert a direct in�uence on decisionmaking or not. Table 5 summarizes the distribution of these variables acrossthe 29 OECD countries. As before, these variables are relevant determinants ofstudents�achievement tests according to Hanushek and Woessmann (2011).
Insert Table 5 here
The di¤erence between the two covariate-adjusted eigenvectors is of modestsize, below 4% for all but three out of the 29 components. Moreover, the coe¢ -cient of variation remains largely unchanged when we expand the set of controls.This �nding suggests that there is a part of the di¤erence in the evaluation ofstudents�reading ability across OECD countries that cannot be explained by thedi¤erences in the characteristics that the theory suggests. That is to say, thereis a set of unobservable factors that induce the existence of international dif-ferences, beyond the action of the standard determinants. Those unobservablevariables may refer to cultural and organizational factors, such as the design ofthe educational system, the commitment of families and society with education,the implementation of educational policies, the teachers�attitudes and involve-ment, and, of course, the average e¤ort of the students. The low sensitivity ofthe coe¢ cient of variation of the covariate-adjusted eigenvector, with respectto the inclusion of seven relevant additional covariates, points out the relevanceof those factors. This is supported by the fact that the same type of resultsappears between the regions of some countries.15
3.3 The evolution of performance: changes between 2000and 2009
Let us now comment on how those values have evolved between 2000 and 2009,so that we can have an idea of the dynamics of the educational systems.The �rst point to be noted is that the unadjusted eigenvector has substan-
tially changed during the �rst decade of the 21st Century. Indeed, the di¤erencebetween the eigenvector components for the years 2000 and 2009 is signi�cantlydi¤erent from zero at the 1% signi�cance level for 23 out of the 29 OECD coun-tries and at the 5% signi�cance level for other two developed countries.16 Most
15This is the case of Italy and Spain, countries that show an internal diversity of educationaloutcomes (di¤erences between the regions within each country), similar to that of the OECD.This is so in spite of formally having a common educational system.16We use bootstrap to test whether the di¤erence between a country�s eigenvector compo-
nent in 2000 and in 2009 is statistically signi�cant or not. We implement bootstrap hypothesistesting as follows. For each country, let nct indicate the number of students with level of read-ing competence c in year t, for t = f2000; 2009g. For each country and for each c, we mergethe samples of the two years into one sample of
�n2000c + n2009c
�observations. We draw a
bootstrap sample of�n2000c + n2009c
�observations with replacement from the merged sample
and we assign the �rst n2000c observations to the �rst year. We then calculate the eigenvectorsof the two years and we compute the di¤erence between them. We repeat these steps 1000times. The p-value is then estimated as the number of times the di¤erence between the eigen-vectors coming from bootstrap samples exceeds that observed in the original sample, dividedover the number of repetitions.
13
19
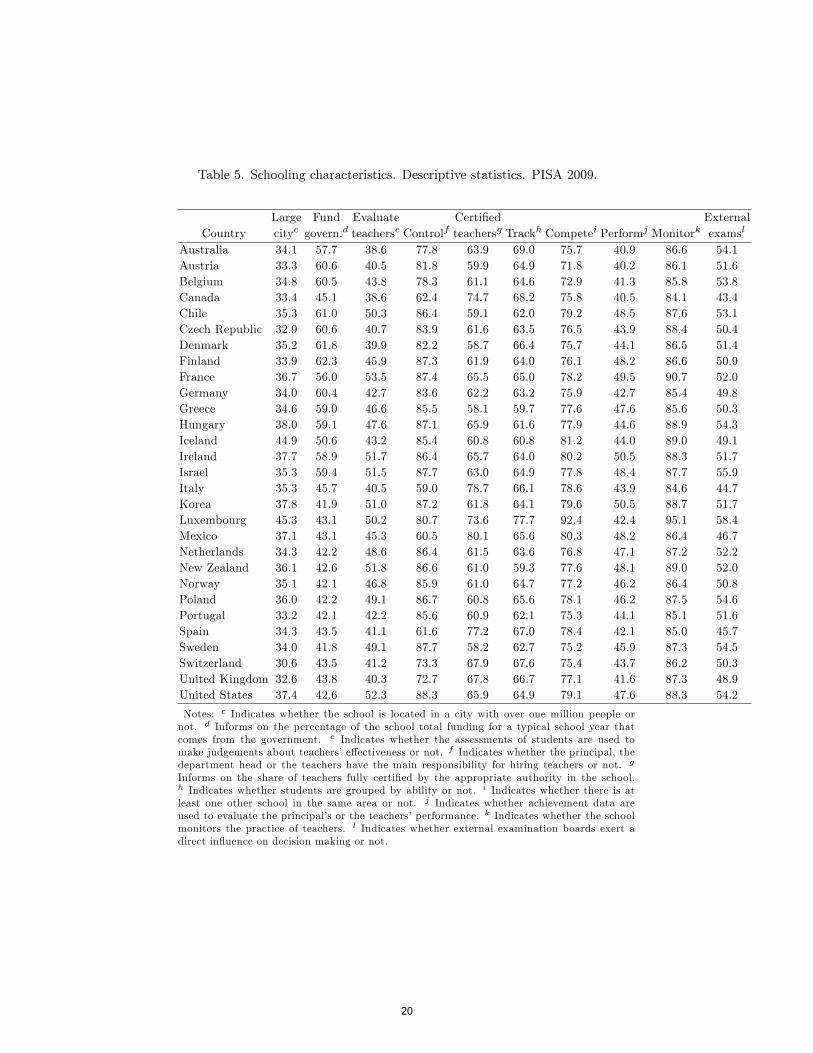
Table 5. Schooling characteristics. Descriptive statistics. PISA 2009.
Large Fund Evaluate Certi�ed ExternalCountry cityc govern.d teacherse Controlf teachersg Trackh Competei Performj Monitork examsl
Australia 34.1 57.7 38.6 77.8 63.9 69.0 75.7 40.9 86.6 54.1Austria 33.3 60.6 40.5 81.8 59.9 64.9 71.8 40.2 86.1 51.6Belgium 34.8 60.5 43.8 78.3 61.1 64.6 72.9 41.3 85.8 53.8Canada 33.4 45.1 38.6 62.4 74.7 68.2 75.8 40.5 84.1 43.4Chile 35.3 61.0 50.3 86.4 59.1 62.0 79.2 48.5 87.6 53.1Czech Republic 32.9 60.6 40.7 83.9 61.6 63.5 76.5 43.9 88.4 50.4Denmark 35.2 61.8 39.9 82.2 58.7 66.4 75.7 44.1 86.5 51.4Finland 33.9 62.3 45.9 87.3 61.9 64.0 76.1 48.2 86.6 50.9France 36.7 56.0 53.5 87.4 65.5 65.0 78.2 49.5 90.7 52.0Germany 34.0 60.4 42.7 83.6 62.2 63.2 75.9 42.7 85.4 49.8Greece 34.6 59.0 46.6 85.5 58.1 59.7 77.6 47.6 85.6 50.3Hungary 38.0 59.1 47.6 87.1 65.9 61.6 77.9 44.6 88.9 54.3Iceland 44.9 50.6 43.2 85.4 60.8 60.8 81.2 44.0 89.0 49.1Ireland 37.7 58.9 51.7 86.4 65.7 64.0 80.2 50.5 88.3 51.7Israel 35.3 59.4 51.5 87.7 63.0 64.9 77.8 48.4 87.7 55.9Italy 35.3 45.7 40.5 59.0 78.7 66.1 78.6 43.9 84.6 44.7Korea 37.8 41.9 51.0 87.2 61.8 64.1 79.6 50.5 88.7 51.7Luxembourg 45.3 43.1 50.2 80.7 73.6 77.7 92.4 42.4 95.1 58.4Mexico 37.1 43.1 45.3 60.5 80.1 65.6 80.3 48.2 86.4 46.7Netherlands 34.3 42.2 48.6 86.4 61.5 63.6 76.8 47.1 87.2 52.2New Zealand 36.1 42.6 51.8 86.6 61.0 59.3 77.6 48.1 89.0 52.0Norway 35.1 42.1 46.8 85.9 61.0 64.7 77.2 46.2 86.4 50.8Poland 36.0 42.2 49.1 86.7 60.8 65.6 78.1 46.2 87.5 54.6Portugal 33.2 42.1 42.2 85.6 60.9 62.1 75.3 44.1 85.1 51.6Spain 34.3 43.5 41.1 61.6 77.2 67.0 78.4 42.1 85.0 45.7Sweden 34.0 41.8 49.1 87.7 58.2 62.7 75.2 45.9 87.3 54.5Switzerland 30.6 43.5 41.2 73.3 67.9 67.6 75.4 43.7 86.2 50.3United Kingdom 32.6 43.8 40.3 72.7 67.8 66.7 77.1 41.6 87.3 48.9United States 37.4 42.6 52.3 88.3 65.9 64.9 79.1 47.6 88.3 54.2
Notes: c Indicates whether the school is located in a city with over one million people ornot. d Informs on the percentage of the school total funding for a typical school year thatcomes from the government. e Indicates whether the assessments of students are used tomake judgements about teachers�e¤ectiveness or not. f Indicates whether the principal, thedepartment head or the teachers have the main responsibility for hiring teachers or not. g
Informs on the share of teachers fully certi�ed by the appropriate authority in the school.h Indicates whether students are grouped by ability or not. i Indicates whether there is atleast one other school in the same area or not. j Indicates whether achievement data areused to evaluate the principal�s or the teachers�performance. k Indicates whether the schoolmonitors the practice of teachers. l Indicates whether external examination boards exert adirect in�uence on decision making or not.
23
20
of the countries that performed over the mean in the year 2000 lowered theirrelative advantage in students� reading ability during the period of analysis,with the reduction being largest for the Netherlands (36%), Ireland (34%), theUnited Kingdom (31%) and Finland (22%). Belgium, Korea and New Zealandare the exception to the latter rule. They all performed over the mean in 2000but they improved their relative advantage from 2000 to 2009. The improve-ment is particularly relevant for Korea (59%), that moves from the 9th positionin the 2000 ranking to the �rst position in 2009. We also �nd that 13 out ofthe 16 countries that performed below the mean in 2000 lowered their relativedisadvantage during the �rst decade of the 21th Century. The improvementis particularly relevant for Luxembourg (83%), Chile (77%) and Poland (72%).Indeed, the latter country moves to performing over the mean in the year 2009.As a result of these changes, the coe¢ cient of variation of the unadjusted
eigenvector lowered by 17.7% from 2000 to 2009, attesting that inequality instudents�reading ability across OECD countries lowered during the �rst decadeof the 21th Century. Additionally, the Kendall�s correlation between the un-adjusted eigenvectors in 2000 and in 2009 is 0.58, indicating that the orderingof countries in terms of relative performance in reading competence has sub-stantially changed from 2000 to 2009. The relative position of 15 out of the 29OECD countries analyzed is no more than three positions further in 2009 than itwas in 2000. Conversely, that di¤erential amounts to at least eight positions forseven countries. While Denmark, the United Kingdom, Austria and Ireland lose8, 10, 10 and 11 positions, respectively, Germany, Korea and Poland improvetheir relative position in 7, 8 and 16 positions, respectively.The relationship between the covariate-adjusted eigenvector and the unad-
justed one in 2000 is pretty much the same as in 2009, so that we shall notrepeat the analysis here. More interesting is to analyze the di¤erence betweenthe covariate-adjusted eigenvector components for the years 2000 and 2009. We�nd that it is signi�cantly di¤erent from zero at conventional signi�cance levelsfor 15 out of the 29 OECD countries. In particular, Poland, Luxembourg andChile stand out among the countries that signi�cantly improve their relativeposition since they increase their component by 117%, 72% and 61%, respec-tively. The former two countries move from performing below the mean in thebase year to a component larger than one in 2009. Conversely, Finland, oneof the best-performing countries both in the unadjusted and in the covariate-adjusted measures of inequality in both years, lowers its relative advantage onceaccounting for di¤erences in characteristics by almost 35% from 2000 to 2009.As a result, the Kendall�s correlation between the 2000 and the 2009 covariate-adjusted eigenvectors is of only 0.24. Additionally, the coe¢ cient of variationof the covariate-adjusted eigenvector (1) lowers by approximately 35% betweenthe years 2000 and 2009.Our results remain almost unchanged when we restrict the analysis to the
21 European OECD countries in Table 2. In particular, we �nd that students�external factors account for slightly more than one half of the di¤erences in rela-tive performance in 2009 and that di¤erences across European OECD countriesin students�reading ability, both adjusted and unadjusted, have decreased from
14
21
2000 to 2009 more than they have done in the OECD.17
4 Final Remarks
We have presented here a model that combines the one developed in Herrero andVillar (2012), that permits evaluating group performance with categorical data,with inverse probability weighting (IPW) techniques that control for di¤erencesin the distribution of the determinants of the outcome variable. We obtain in thisway a covariate-adjusted eigenvector that, when compared with the unadjustedone, allows us to estimate the impact of the di¤erence in characteristics overthe relative performance.We have applied this methodology to the evaluation of compulsory education
in the OECD through PISA 2000 and 2009. We �nd that di¤erences in readingability across OECD countries would lower by more than one third if theirendowment of schooling and family characteristics would be that for the OECDaverage. We have also found that the di¤erences in students� reading abilityacross OECD countries substantially lowered during the �rst decade of the 21thCentury.There are two related questions that come to mind when considering this
particular application. First, why making an evaluation out of categorical data(the distribution of students across the di¤erent levels of competence) when wehave all cardinal information that might be required? The reason is that ratherthan relying on summary statistics (e.g. means and inequality measures) as it isthe case in most of the cardinal approaches, we are able to deal with discretizedversions of the whole distributions in a relatively simple way and so to extractmore information. Second, why to use just �ve levels of competence rather thanricher distribution pro�les (e.g. using percentiles)? The answer here is twofold.On the one hand, a small number of levels permits a richer set of covariates.On the other hand, in this particular case, those levels are given externally sothat there is less arbitrariness in deciding the clusters by the analysts.
17These estimates are available upon request to the authors.
15
22
5 References
Arneson, R.J., 1989. Equality and equality of opportunity for welfare. Philo-sophical Studies 56, 77-93.Busso, M., DiNardo, J., McCrary, J., 2009. New Evidence on the Finite
Sample Properties of Propensity Score Matching and Reweighting Estimators.IZA Discussion Paper 3998.Calo-Blanco, A., Villar, A., 2010. Quality of Education and Equality of
Opportunity in Spain. Lessons from PISA, Fundación BBVA, working paper6-2010.Calo-Blanco, A. García-Pérez, J.I., 2013. On the Welfare Loss Caused by In-
equality of Opportunity. Journal of Economic Inequality. DOI: 10.1007/s10888-013-9247-6.Checchi, D., Peragine, V., 2010. Inequality of opportunity in Italy. Journal
of Economic Inequality 8, 429-450.Ciccone, A., Garcia-Fontes, W., 2009. The quality of the Catalan and Span-
ish education systems: A perspective from PISA. IESE Research Papers D/810,IESE Business School.Cohen, G.A., 1989. On the currency of egalitarian justice. Ethics, 99(4),
906-944.Crump, R.K., Hotz, V.J., Imbens, G.W., Mitnik, O.A., 2009. Dealing with
limited overlap in estimation of average treatment e¤ects. Biometrika 96(1),187-199.Echenique, F., Fryer, R.G., 2005. On the measurement of segregation. Work-
ing Paper 11258, NBER.Fleurbaey, M., 2008. Fairness, responsibility and welfare. Oxford University
Press, Oxford.Hanushek, E.A., Woessmann, L., 2011. The Economics of International Dif-
ferences in Educational Achievement. In E.A. Hanushek, S. Machin, L. Woess-mann (eds.), Handbook of the Economics of Education, Vol. 3, pp. 89-200,Amsterdam: North Holland.Herrero, C., Villar, A., 2012. On the comparison of group performance with
categorical data. Working Paper AD 2012-17, Ivie.Lefranc, A., Pistolesi, N., Trannoy, A., 2008. Inequality of opportunities vs.
inequality of outcomes: Are western societies all alike?. Review of Income andWealth 54, 513-546.Lefranc, A., Pistolesi, N., Trannoy, A., 2009. Equality of opportunity and
luck: de�nitions and testable conditions, with an application to income inFrance. Journal of Public Economics 93, 1189-1207.Lieberson, S. 1976. Rank-Sum comparisons between Groups. Sociological
Methodology 7, 276-291.OECD, 2009. PISA Data Analysis Manual: SPSS. Second Edition. OECD,
Paris.OECD, 2010a. PISA 2009 Results: What Students Know and Can Do.
Student Performance in Reading, Mathematics and Science (Volume I). OECD,
17
23
Paris.OECD, 2010b. PISA 2009 Results: Overcoming Social Background. Equity
in learning opportunities and outcomes (Volume II). OECD, Paris.Peragine, V., Serlenga, L., 2008. Higher education and equality of opportu-
nity in Italy. Research on Economic Inequality 16, 67-97.Roemer, J.E., 1993. A pragmatic theory of responsibility for the egalitarian
planner. Philosophy and Public A¤airs 22(2), 146-166.Roemer, J.E., 1998. Equality of opportunity. Harvard Univeristy Press,
New York.Rosenbaum, P., Rubin, D.B.,1983. The Central Role of the Propensity Score
in Observational Studies for Causal E¤ects. Biometrika 70, 41-55.Villar, A., 2012. The Educational Development Index. Working Paper Econ
no 1206, Pablo de Olavide University.
18
24
IvieGuardia Civil, 22 - Esc. 2, 1º
46020 Valencia - SpainPhone: +34 963 190 050Fax: +34 963 190 055
Website: www.ivie.esE-mail: [email protected]
adserie