
September 2002 Arlington, Virginia
45
1 2002 CLRS Intermediate Track III September 2002 Arlington, Virginia
-
Upload
kelly-bryant -
Category
Documents
-
view
22 -
download
0
description
Intermediate Track III. September 2002 Arlington, Virginia. Introduction. The Ideal Situation - PowerPoint PPT Presentation
Transcript of September 2002 Arlington, Virginia
12002 CLRS
Intermediate Track III
September 2002Arlington, Virginia
22002 CLRS
Introduction
The Ideal Situation
Loss reserve data should contain a long, stable history of homogeneous claim experience, where
no significant operations changes materially affect either the mix of business or the handling of claims, and there should be a sufficient number of claims to
produce credible loss patterns.
32002 CLRS
IntroductionThe Reality
Virtually all elements of “The Ideal” are periodically violated:1. The Mix Changes2. Claim Handling Changes3. Case Reserves are Strengthened/Weakened4. Other Factors
Changes in Deductibles, Limits, SIRs Changes in Reinsurance Tort Reform, other law changes New Sources of Loss Changes in the Economy
42002 CLRS
Introduction
This Session Will Discuss
The potential impact of mix changes
Changes in claim closing patterns
Changes in case reserve adequacy
What Else?
52002 CLRS
CHANGEIN
MIX
62002 CLRS
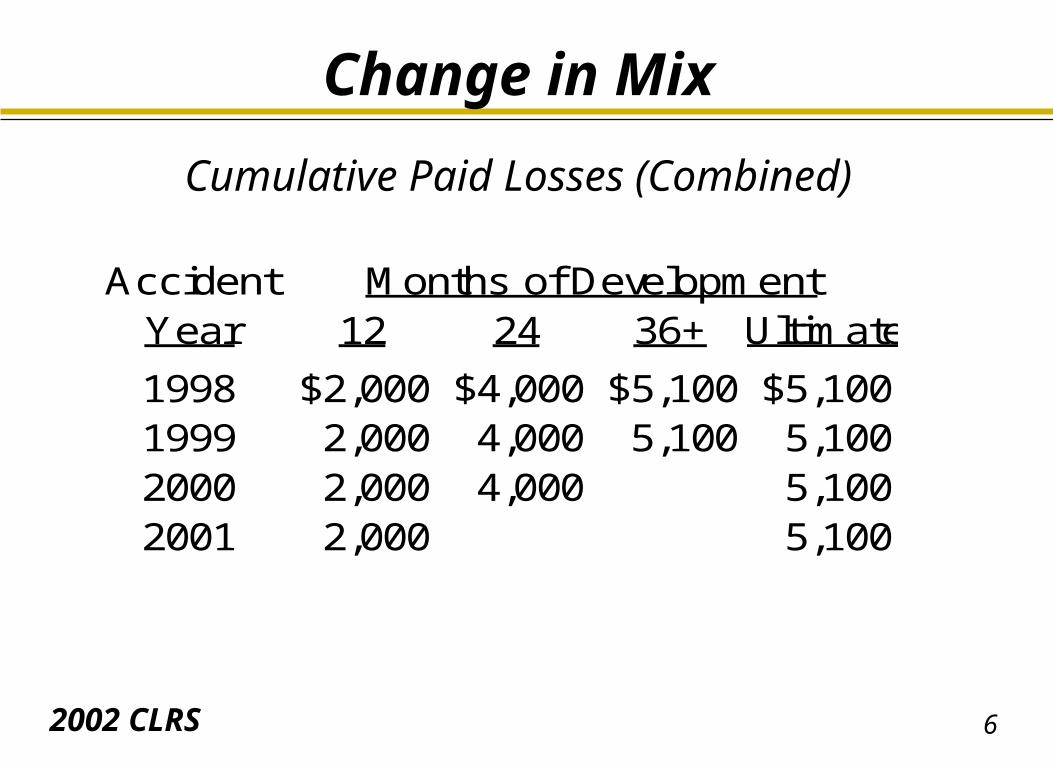
Change in Mix
Cumulative Paid Losses (Combined)
Accident Months of DevelopmentYear 12 24 36+ Ultimate
1998 $2,000 $4,000 $5,100 $5,1001999 2,000 4,000 5,100 5,1002000 2,000 4,000 5,1002001 2,000 5,100
72002 CLRS
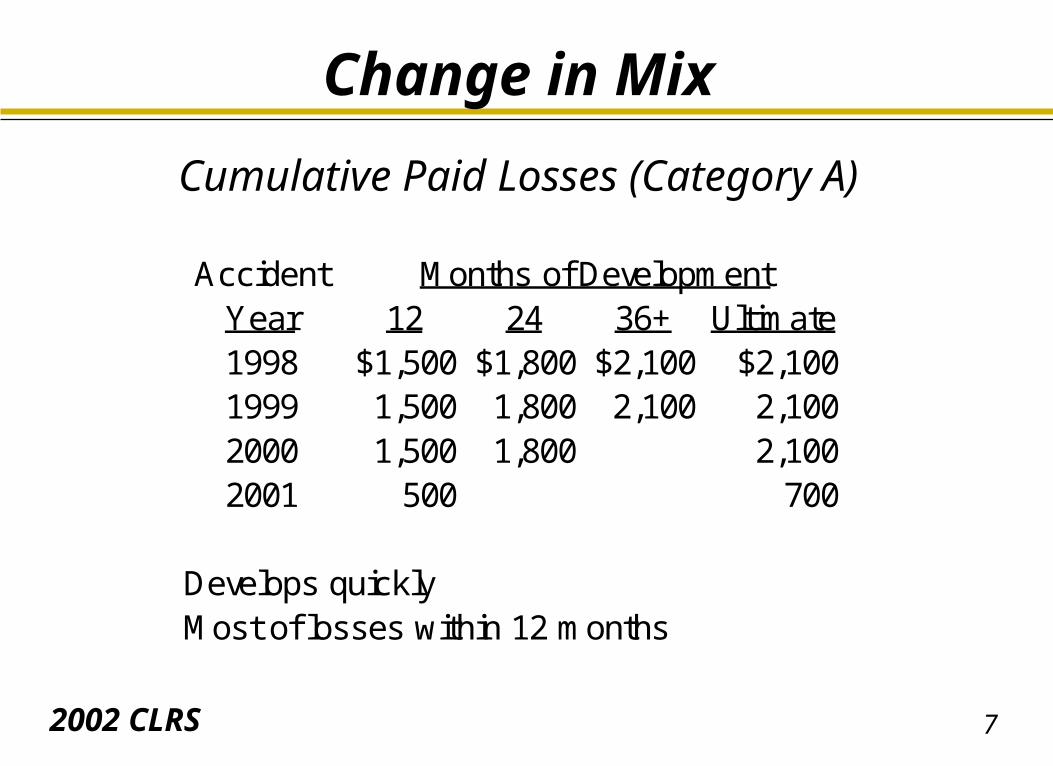
Change in Mix
Cumulative Paid Losses (Category A)
Accident Months of DevelopmentYear 12 24 36+ Ultimate1998 $1,500 $1,800 $2,100 $2,1001999 1,500 1,800 2,100 2,1002000 1,500 1,800 2,1002001 500 700
Develops quicklyMost of losses within 12 months
82002 CLRS
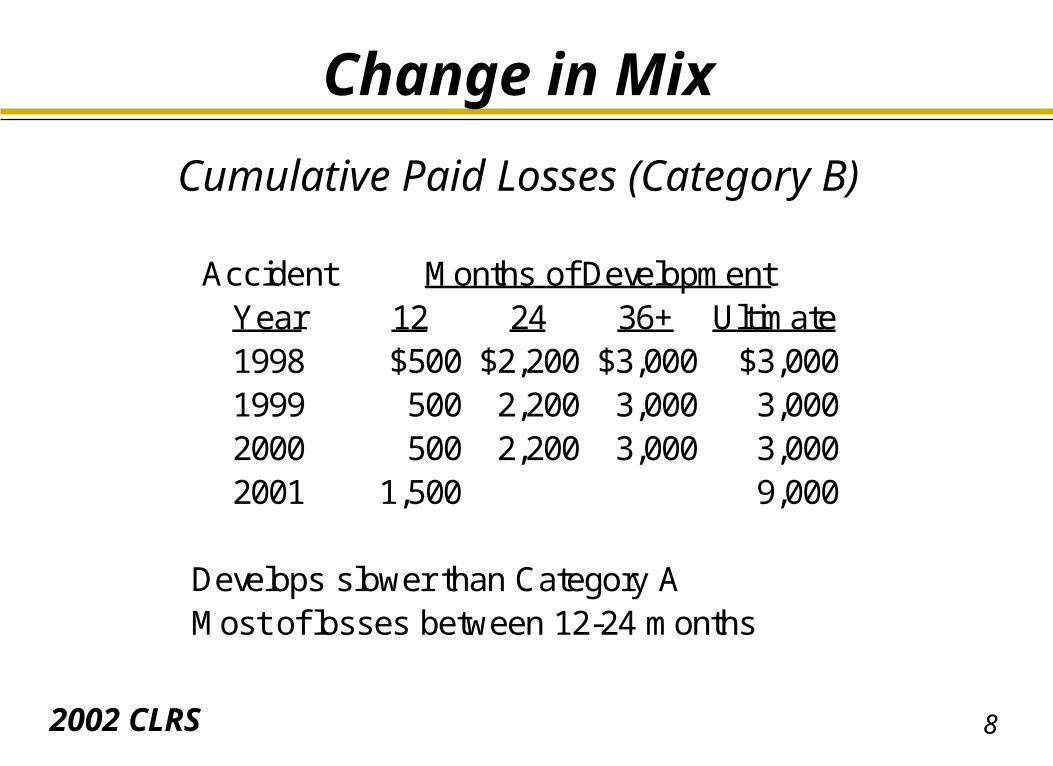
Change in Mix
Cumulative Paid Losses (Category B)
Accident Months of DevelopmentYear 12 24 36+ Ultimate1998 $500 $2,200 $3,000 $3,0001999 500 2,200 3,000 3,0002000 500 2,200 3,000 3,0002001 1,500 9,000
Develops slower than Category AMost of losses between 12-24 months
92002 CLRS
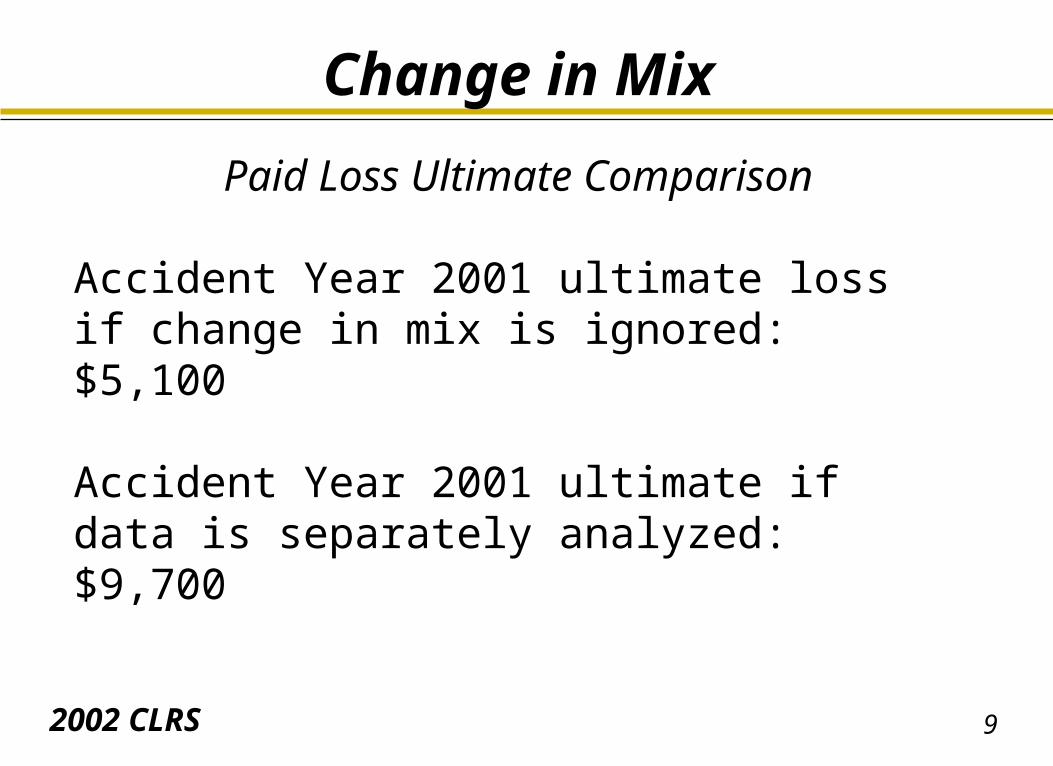
Change in Mix
Paid Loss Ultimate Comparison
Accident Year 2001 ultimate loss if change in mix is ignored: $5,100
Accident Year 2001 ultimate if data is separately analyzed: $9,700
102002 CLRS
Change in Mix
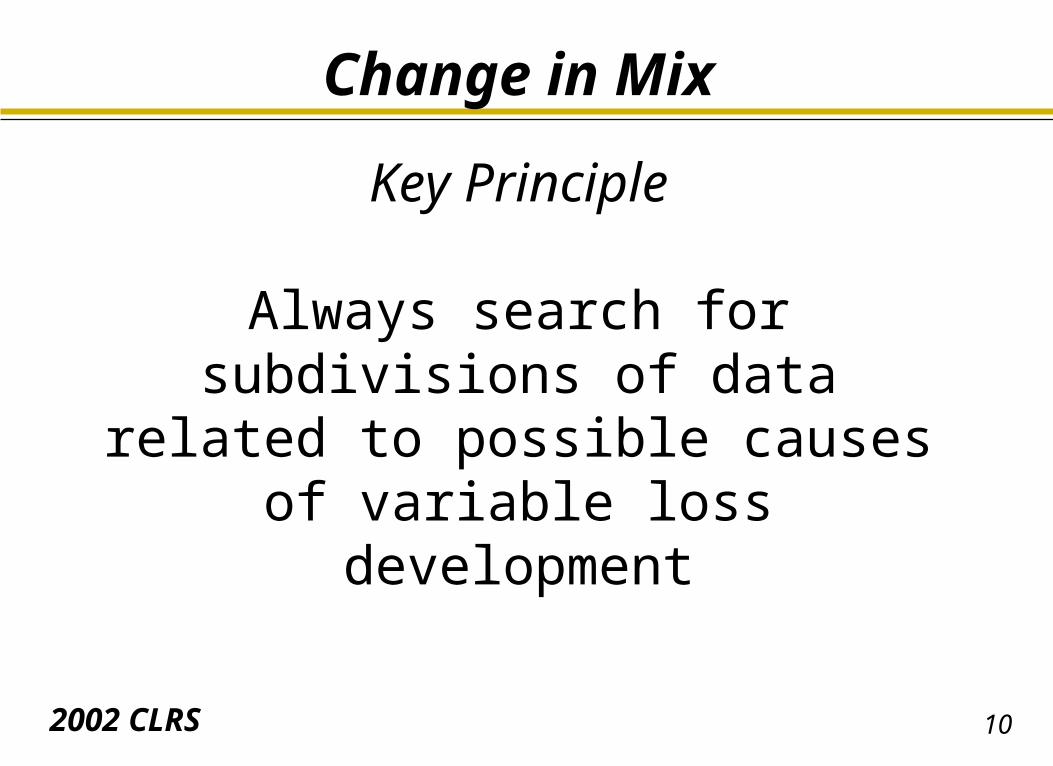
Key Principle
Always search for subdivisions of data related to possible causes of variable loss development
112002 CLRS
Change in Mix
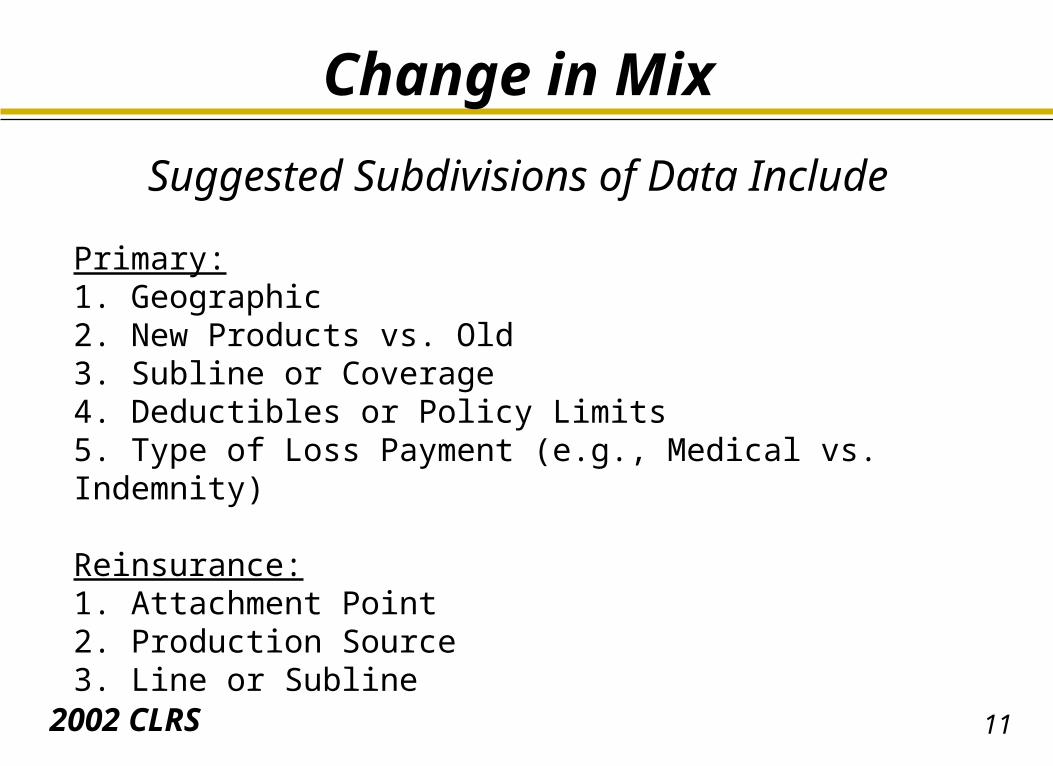
Suggested Subdivisions of Data Include
Primary:1. Geographic2. New Products vs. Old3. Subline or Coverage4. Deductibles or Policy Limits5. Type of Loss Payment (e.g., Medical vs. Indemnity)
Reinsurance:1. Attachment Point2. Production Source3. Line or Subline
122002 CLRS
Change in Mix
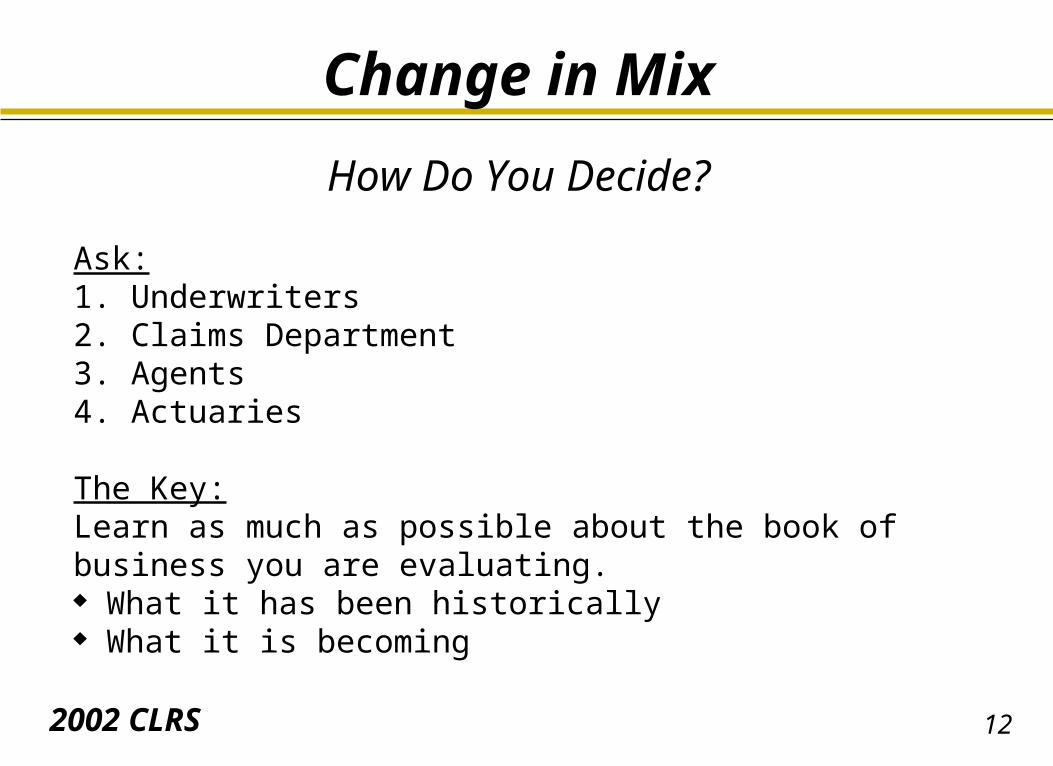
How Do You Decide?
Ask:1. Underwriters2. Claims Department3. Agents4. Actuaries
The Key:Learn as much as possible about the book of business you are evaluating. What it has been historically What it is becoming
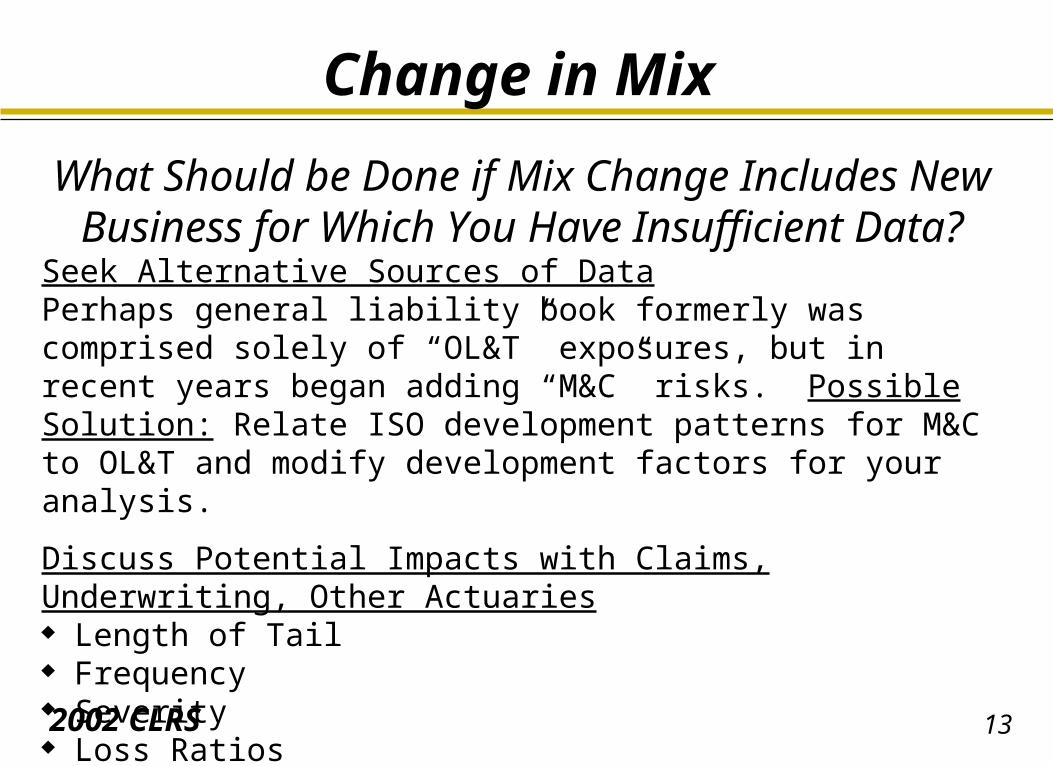
132002 CLRS
Change in Mix
What Should be Done if Mix Change Includes New Business for Which You Have Insufficient Data?
Seek Alternative Sources of DataPerhaps general liability book formerly was comprised solely of “OL&T” exposures, but in recent years began adding “M&C” risks. Possible Solution: Relate ISO development patterns for M&C to OL&T and modify development factors for your analysis.
Discuss Potential Impacts with Claims, Underwriting, Other Actuaries Length of Tail Frequency Severity Loss Ratios
142002 CLRS
CLAIMCLOSING
PATTERNS
152002 CLRS
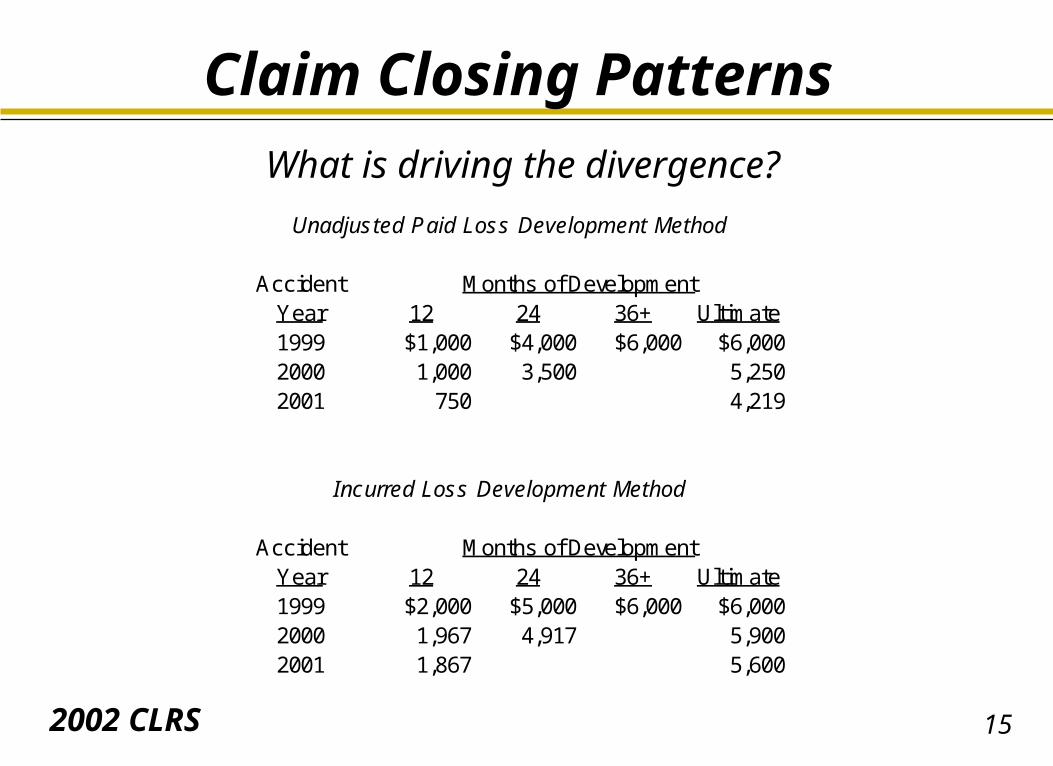
Claim Closing PatternsWhat is driving the divergence?
Unadjusted Paid Loss Development Method
Accident Months of DevelopmentYear 12 24 36+ Ultimate1999 $1,000 $4,000 $6,000 $6,0002000 1,000 3,500 5,2502001 750 4,219
Incurred Loss Development Method
Accident Months of DevelopmentYear 12 24 36+ Ultimate1999 $2,000 $5,000 $6,000 $6,0002000 1,967 4,917 5,9002001 1,867 5,600
162002 CLRS
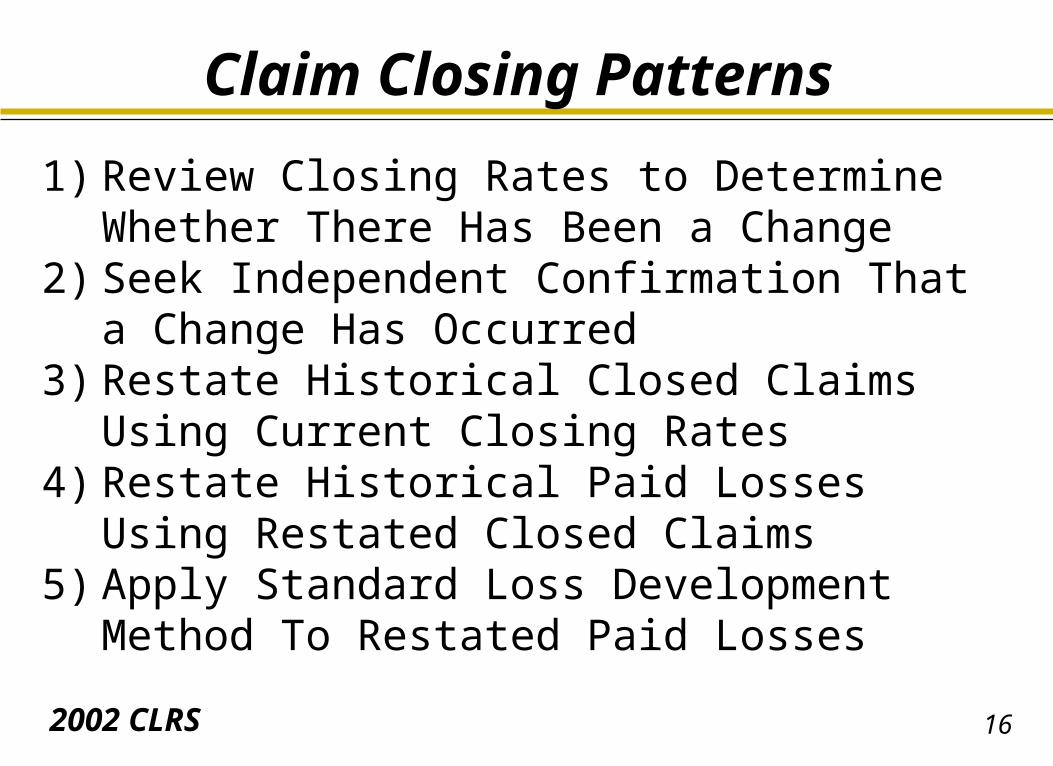
Claim Closing Patterns
1) Review Closing Rates to Determine Whether There Has Been a Change
2) Seek Independent Confirmation That a Change Has Occurred
3) Restate Historical Closed Claims Using Current Closing Rates
4) Restate Historical Paid Losses Using Restated Closed Claims
5) Apply Standard Loss Development Method To Restated Paid Losses

172002 CLRS
Claim Closing Patterns
Data Needed Paid Loss Development Triangle (slide 15) Reported Claims Development Triangle Projected Ultimate Claims Closed Claims Development Triangle
182002 CLRS
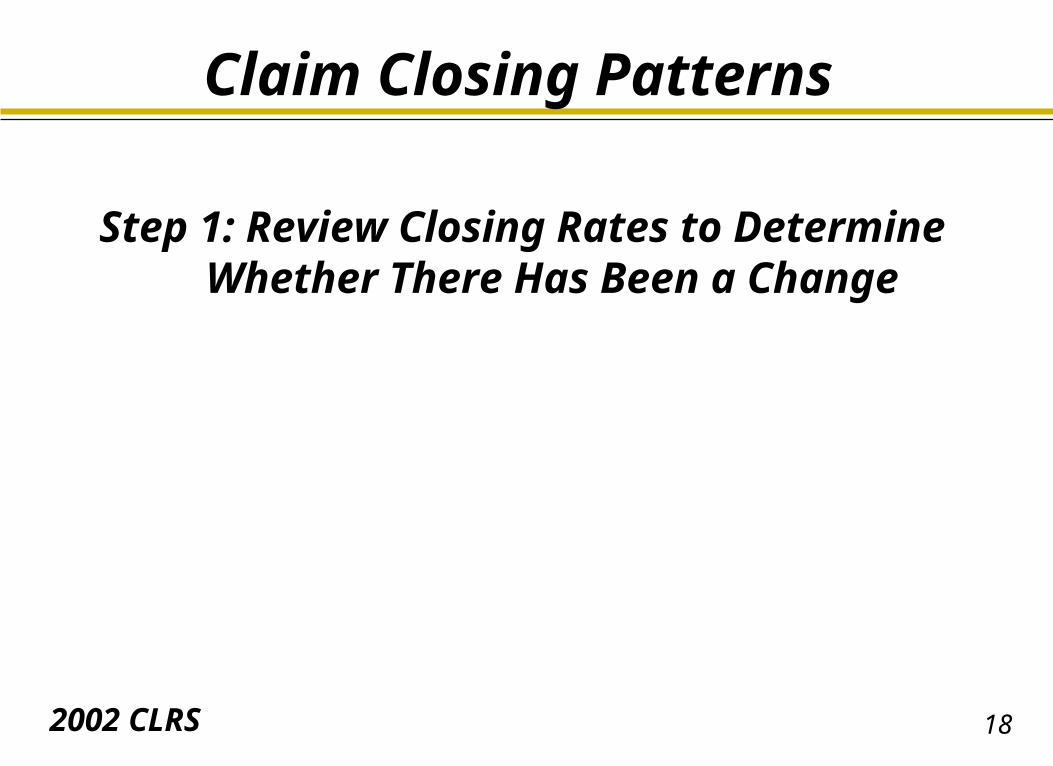
Claim Closing Patterns
Step 1: Review Closing Rates to Determine Whether There Has Been
a Change
192002 CLRS
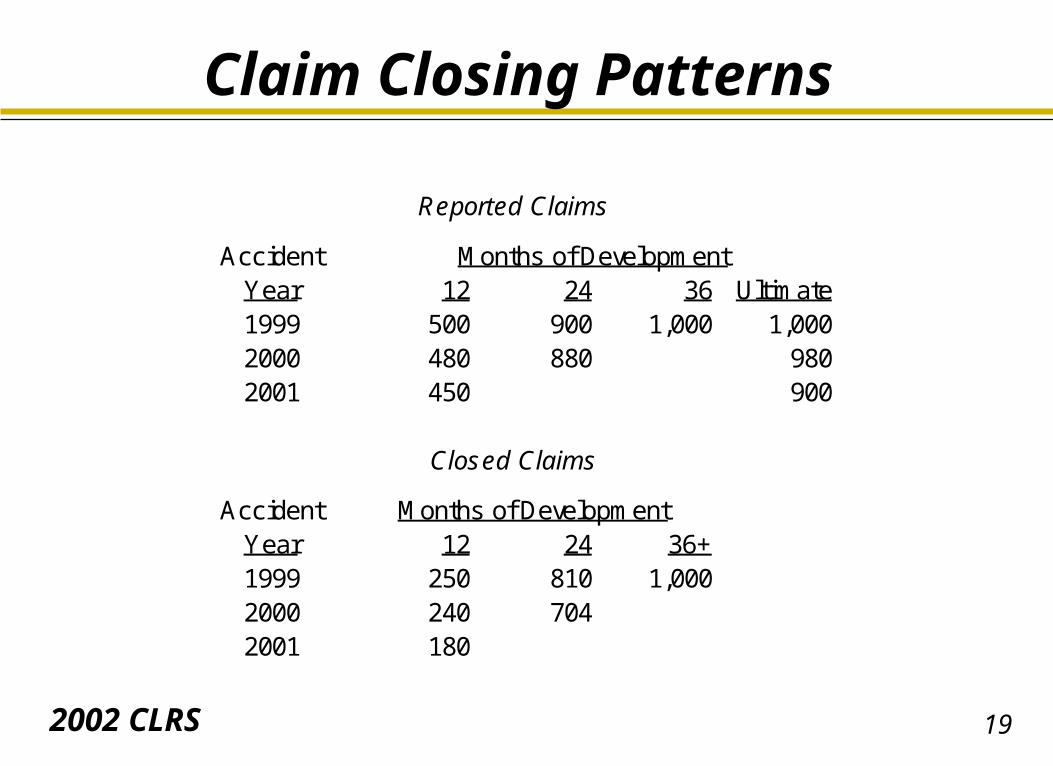
Claim Closing Patterns
Reported Claims
Accident Months of DevelopmentYear 12 24 36 Ultimate1999 500 900 1,000 1,0002000 480 880 9802001 450 900
Closed Claims
Accident Months of Development Year 12 24 36+1999 250 810 1,0002000 240 7042001 180
202002 CLRS
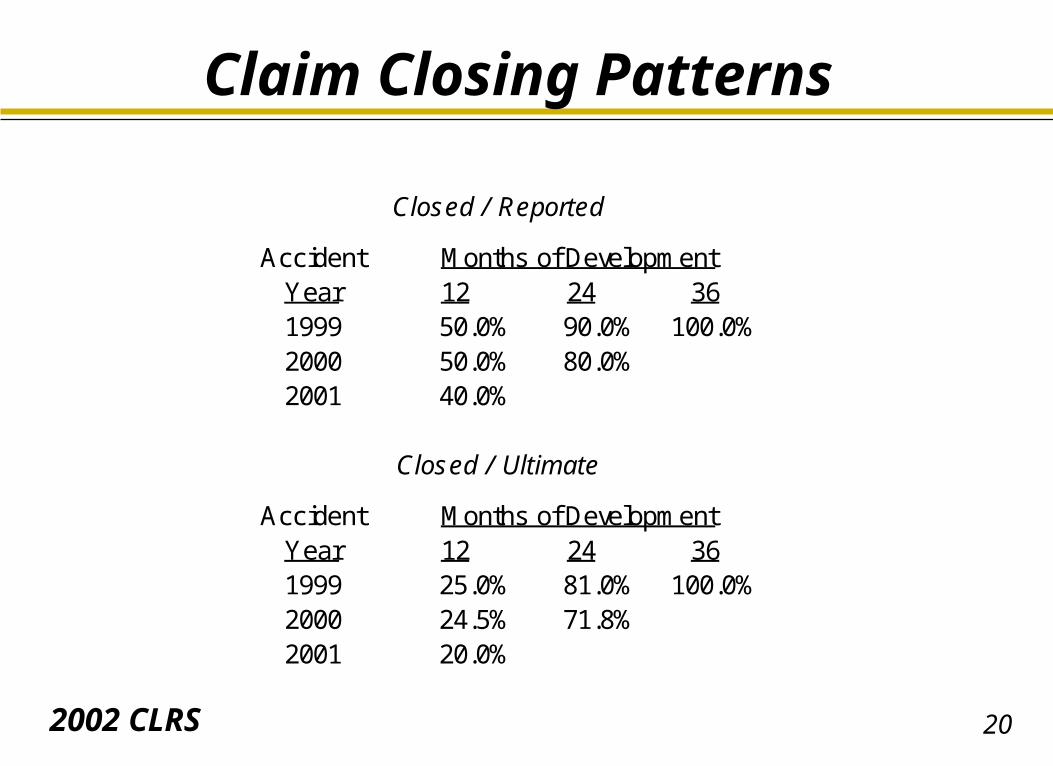
Claim Closing Patterns
Closed / Reported
Accident Months of DevelopmentYear 12 24 361999 50.0% 90.0% 100.0%2000 50.0% 80.0%2001 40.0%
Closed / Ultimate
Accident Months of DevelopmentYear 12 24 361999 25.0% 81.0% 100.0%2000 24.5% 71.8%2001 20.0%
212002 CLRS
Claim Closing Patterns
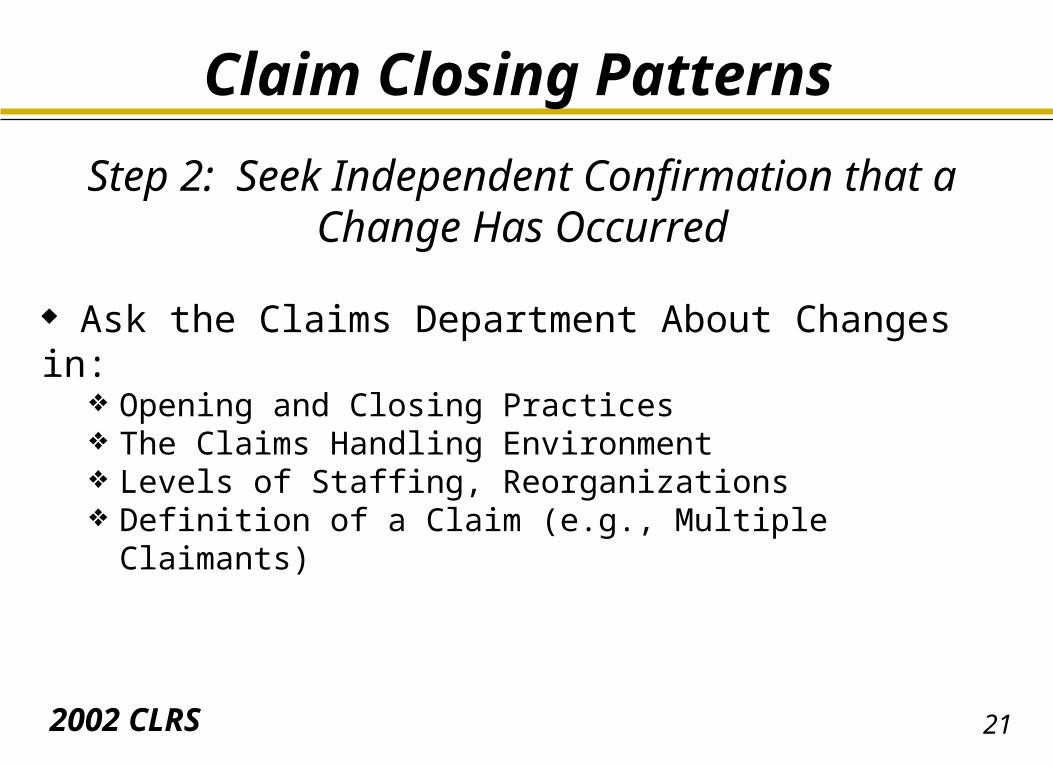
Step 2: Seek Independent Confirmation that a Change Has Occurred
Ask the Claims Department About Changes in: Opening and Closing Practices The Claims Handling Environment Levels of Staffing, Reorganizations Definition of a Claim (e.g., Multiple Claimants)
222002 CLRS
Claim Closing Patterns
Step 3: Restate Historical Closed Claims Using Current Closing Rates
232002 CLRS
Claim Closing Patterns
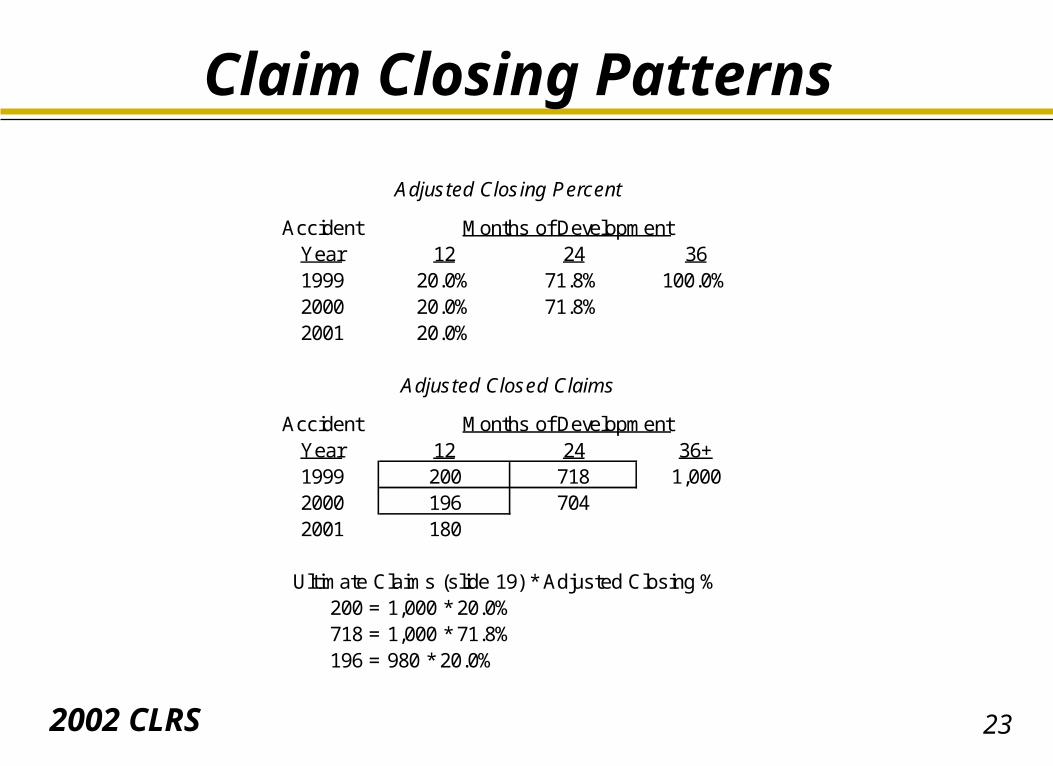
Adjusted Closing Percent
Accident Months of DevelopmentYear 12 24 361999 20.0% 71.8% 100.0%2000 20.0% 71.8%2001 20.0%
Adjusted Closed Claims
Accident Months of DevelopmentYear 12 24 36+1999 200 718 1,0002000 196 7042001 180
Ultimate Claims (slide 19) * Adjusted Closing % 200 = 1,000 * 20.0% 718 = 1,000 * 71.8% 196 = 980 * 20.0%
242002 CLRS
Claim Closing Patterns
Step 4: Restate Historical Paid Losses Using Restated Closed Claims
252002 CLRS
Claim Closing Patterns
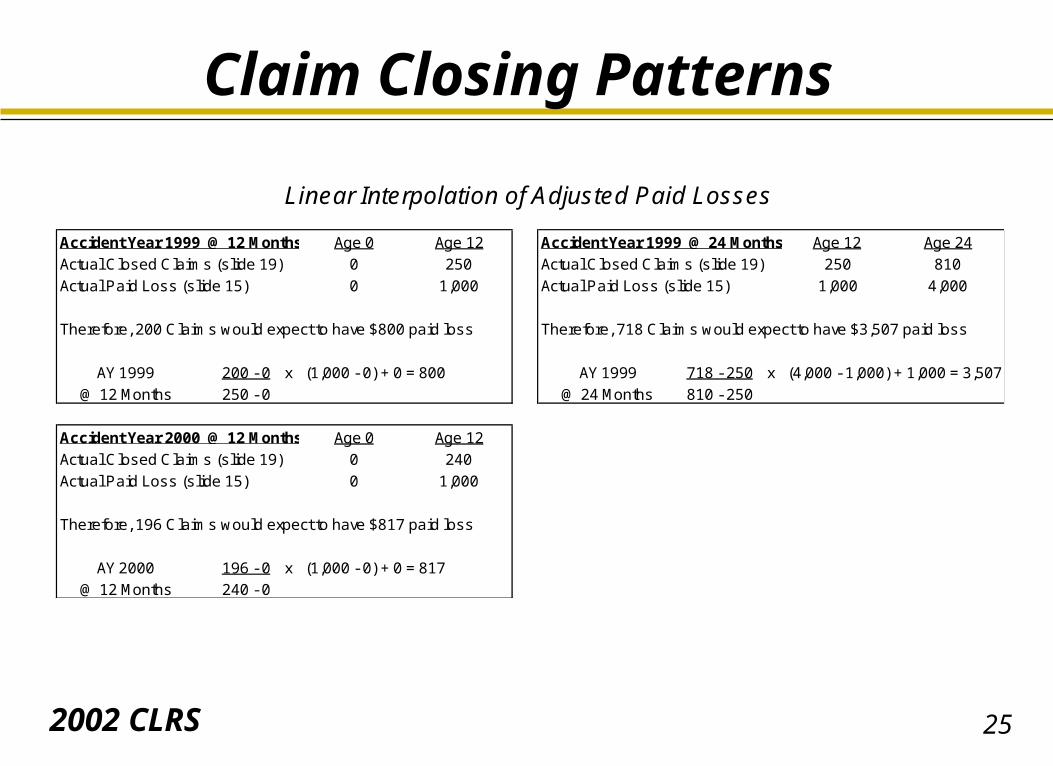
Linear Interpolation of Adjusted Paid Losses
Accident Year 1999 @ 12 Months Age 0 Age 12 Accident Year 1999 @ 24 Months Age 12 Age 24
Actual Closed Claims (slide 19) 0 250 Actual Closed Claims (slide 19) 250 810
Actual Paid Loss (slide 15) 0 1,000 Actual Paid Loss (slide 15) 1,000 4,000
Therefore, 200 Claims would expect to have $800 paid loss Therefore, 718 Claims would expect to have $3,507 paid loss
AY 1999 200 - 0 x (1,000 - 0) + 0 = 800 AY 1999 718 - 250 x (4,000 - 1,000) + 1,000 = 3,507
@ 12 Months 250 - 0 @ 24 Months 810 - 250
Accident Year 2000 @ 12 Months Age 0 Age 12
Actual Closed Claims (slide 19) 0 240
Actual Paid Loss (slide 15) 0 1,000
Therefore, 196 Claims would expect to have $817 paid loss
AY 2000 196 - 0 x (1,000 - 0) + 0 = 817
@ 12 Months 240 - 0
262002 CLRS
Claim Closing Patterns
Step 5: Apply Standard Loss Development Method to Restated
Paid Losses
272002 CLRS
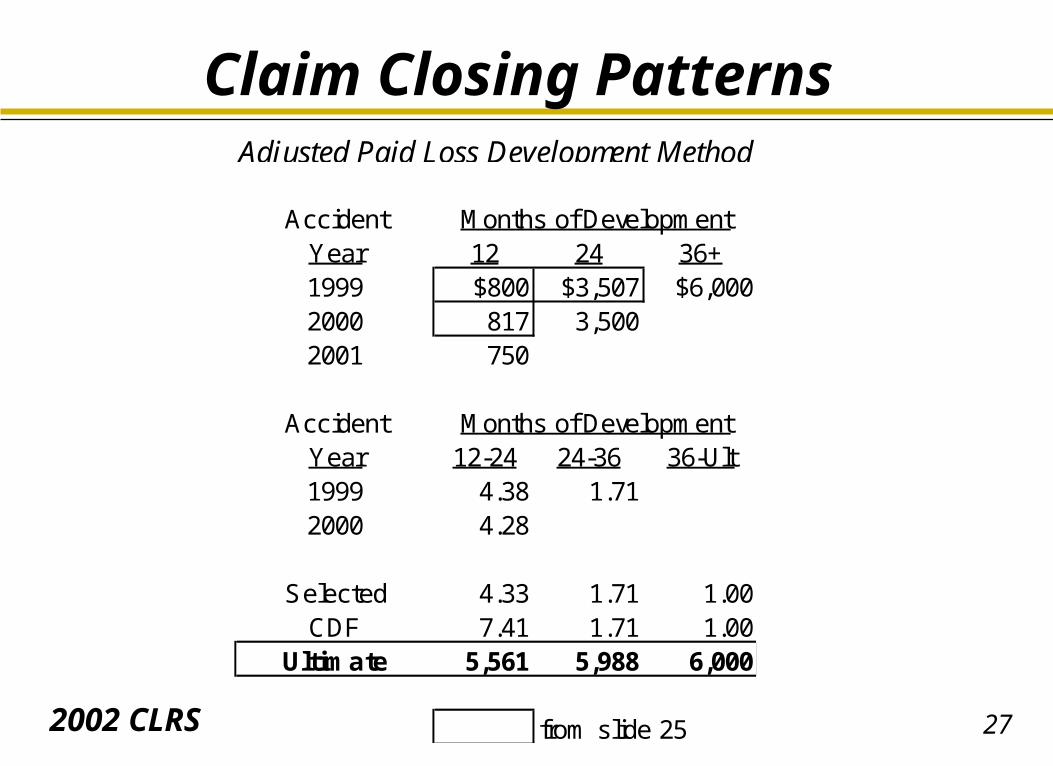
Claim Closing PatternsAdjusted Paid Loss Development Method
Accident Months of DevelopmentYear 12 24 36+1999 $800 $3,507 $6,0002000 817 3,5002001 750
Accident Months of DevelopmentYear 12-24 24-36 36-Ult1999 4.38 1.712000 4.28
Selected 4.33 1.71 1.00CDF 7.41 1.71 1.00
Ultimate 5,561 5,988 6,000
from slide 25
282002 CLRS
Claim Closing Patterns
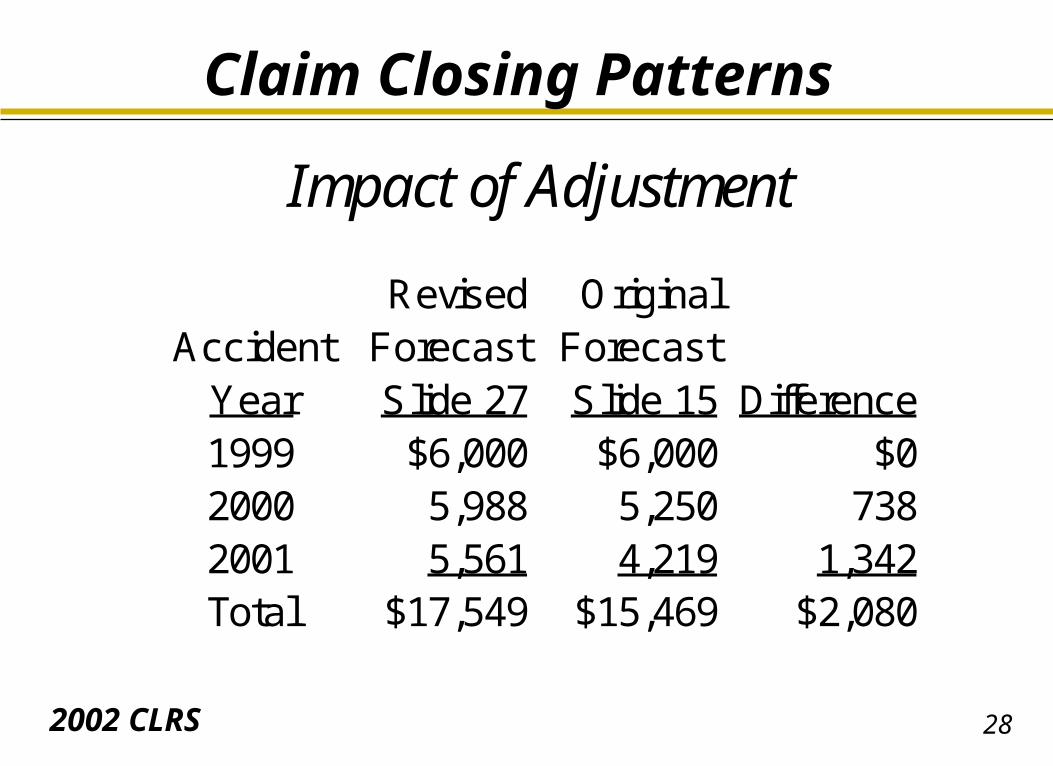
Impact of Adjustment
Revised OriginalAccident Forecast Forecast
Year Slide 27 Slide 15 Difference1999 $6,000 $6,000 $02000 5,988 5,250 7382001 5,561 4,219 1,342Total $17,549 $15,469 $2,080
292002 CLRS
CASERESERVE
ADEQUACY
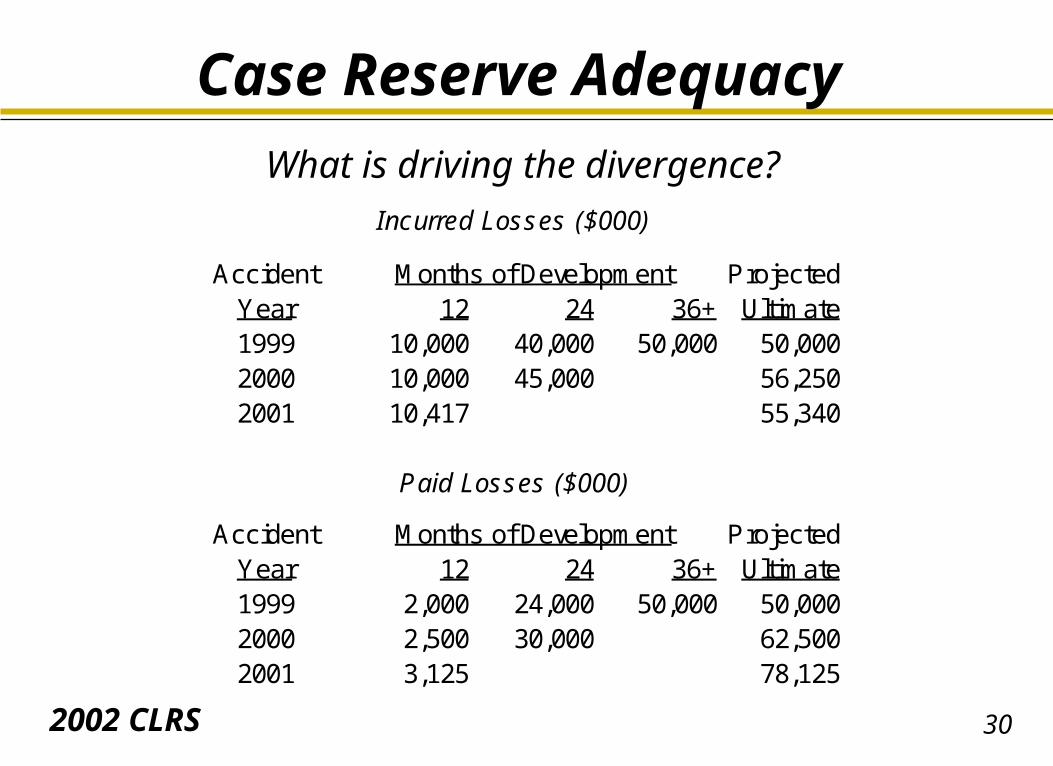
302002 CLRS
Case Reserve AdequacyWhat is driving the divergence?
Incurred Losses ($000)
Accident Months of Development ProjectedYear 12 24 36+ Ultimate1999 10,000 40,000 50,000 50,0002000 10,000 45,000 56,2502001 10,417 55,340
Paid Losses ($000)
Accident Months of Development ProjectedYear 12 24 36+ Ultimate1999 2,000 24,000 50,000 50,0002000 2,500 30,000 62,5002001 3,125 78,125
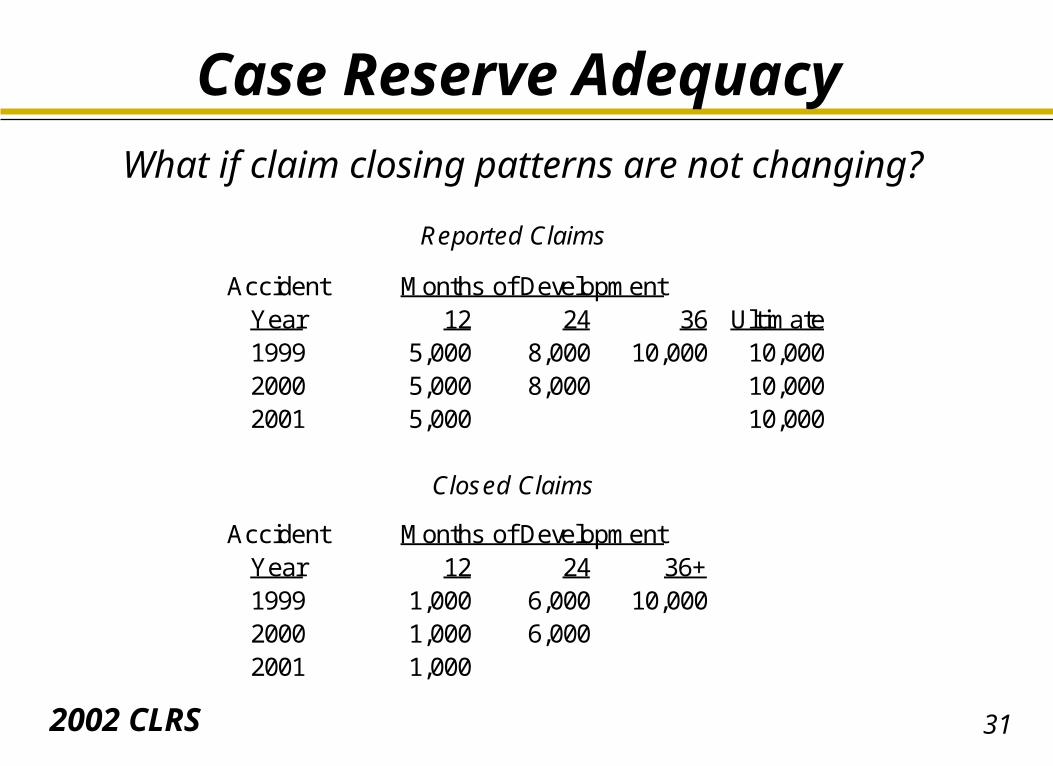
312002 CLRS
Case Reserve AdequacyWhat if claim closing patterns are not changing?
Reported Claims
Accident Months of Development Year 12 24 36 Ultimate1999 5,000 8,000 10,000 10,0002000 5,000 8,000 10,0002001 5,000 10,000
Closed Claims
Accident Months of Development Year 12 24 36+1999 1,000 6,000 10,0002000 1,000 6,0002001 1,000
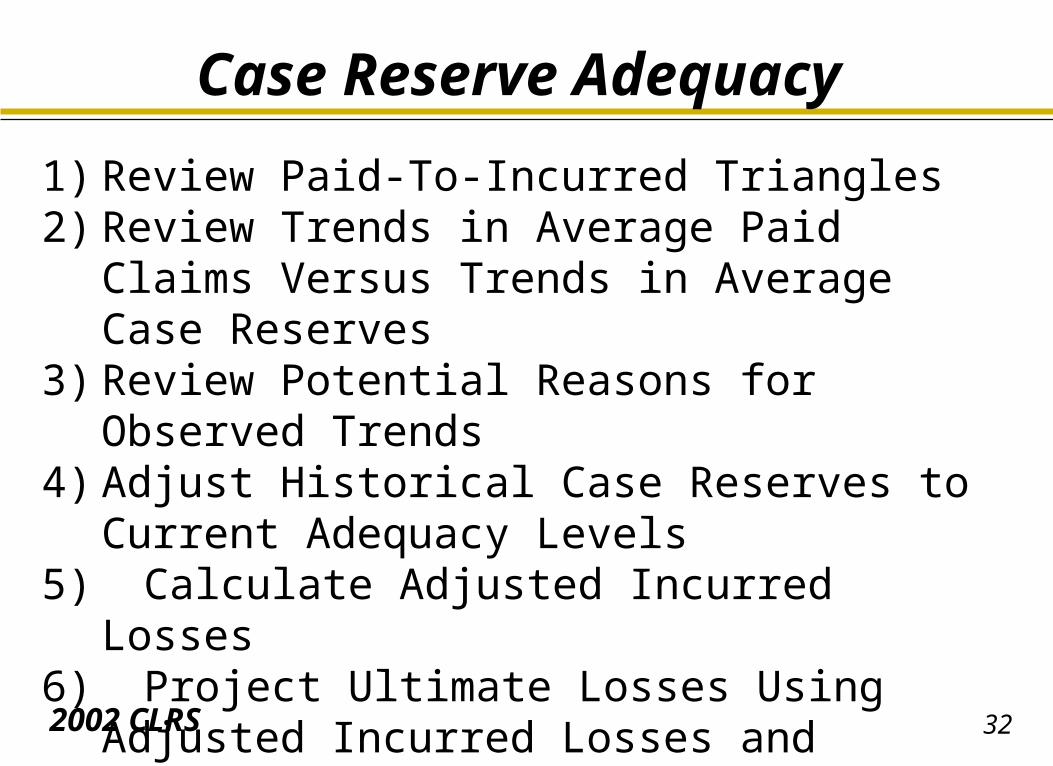
322002 CLRS
Case Reserve Adequacy
1) Review Paid-To-Incurred Triangles2) Review Trends in Average Paid Claims
Versus Trends in Average Case Reserves3) Review Potential Reasons for Observed
Trends4) Adjust Historical Case Reserves to
Current Adequacy Levels5) Calculate Adjusted Incurred Losses6) Project Ultimate Losses Using Adjusted
Incurred Losses and Standard Loss Development
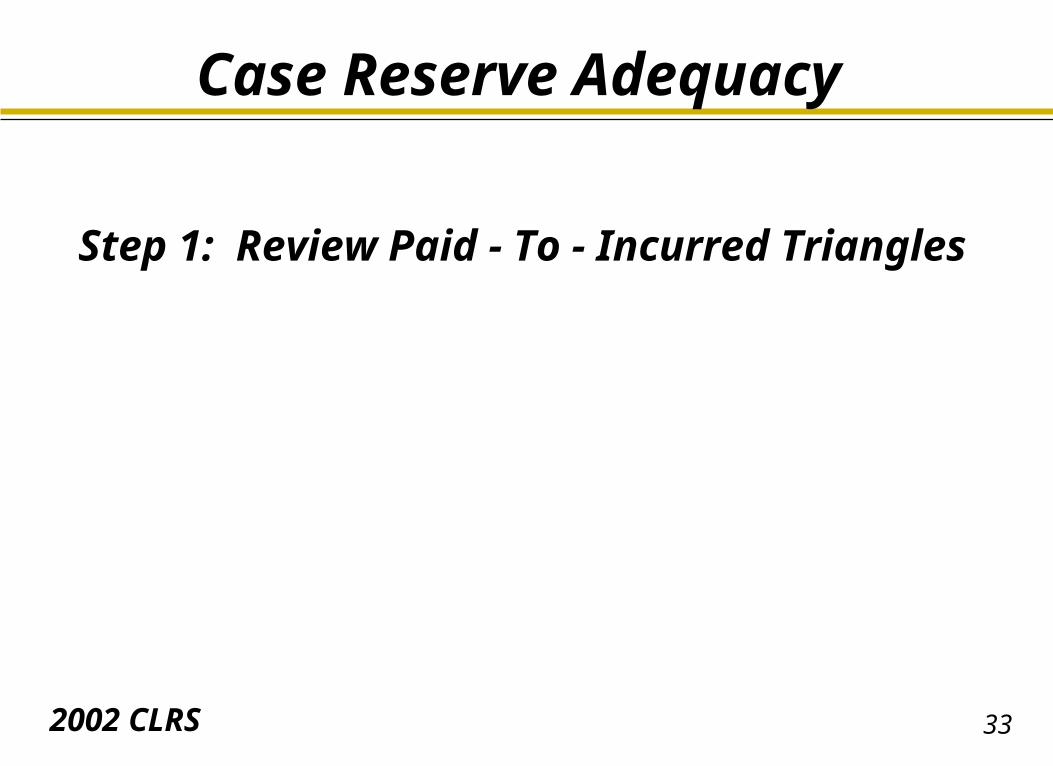
332002 CLRS
Case Reserve Adequacy
Step 1: Review Paid - To - Incurred Triangles
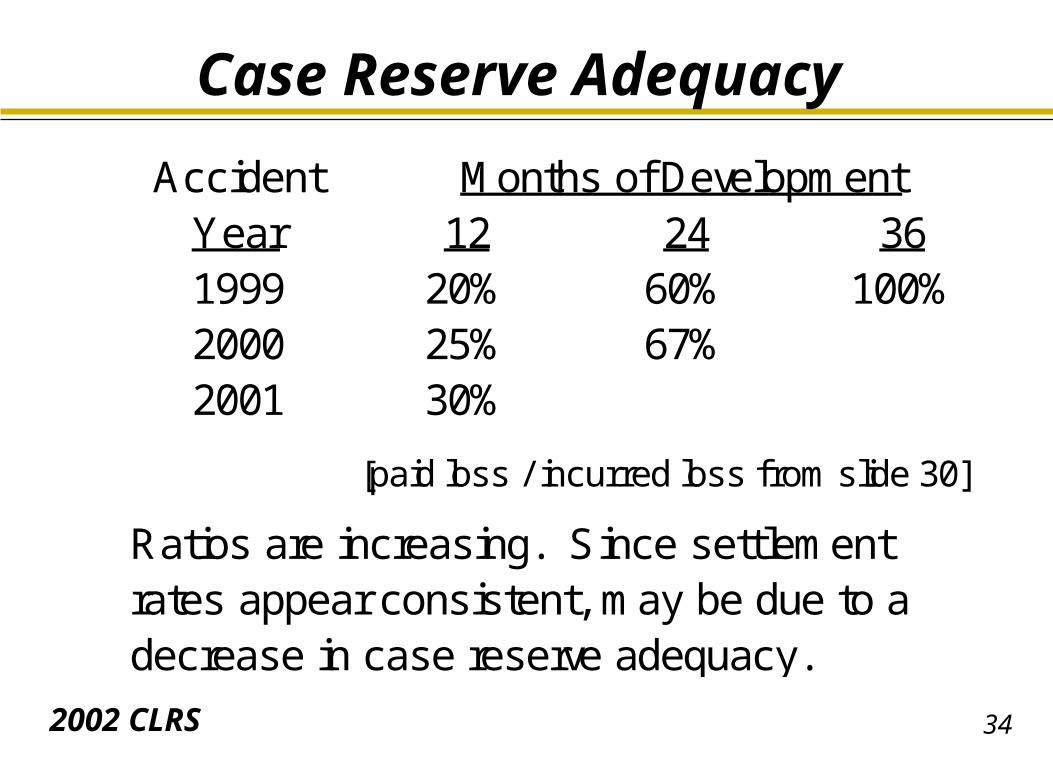
342002 CLRS
Case Reserve Adequacy
Accident Months of DevelopmentYear 12 24 361999 20% 60% 100%2000 25% 67%2001 30%
[paid loss / incurred loss from slide 30]
Ratios are increasing. Since settlementrates appear consistent, may be due to adecrease in case reserve adequacy.
352002 CLRS
Case Reserve Adequacy
Step 2: Review Trends in Average Paid Claims Versus Trends in Average
Case Reserves
362002 CLRS
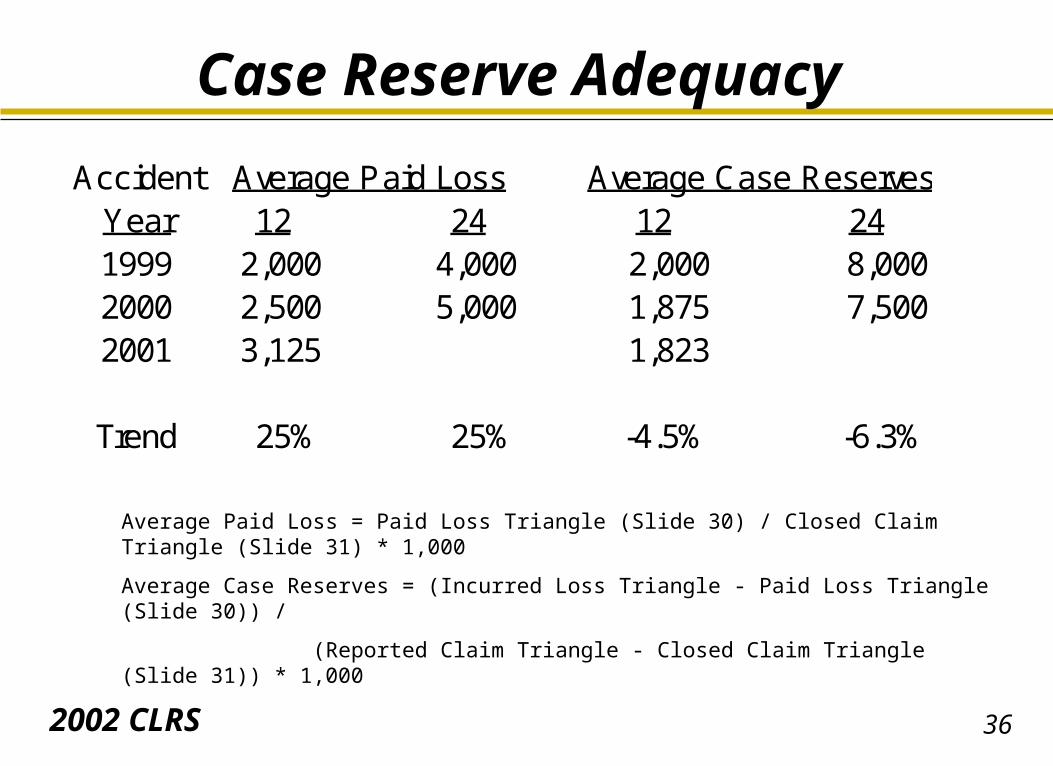
Case Reserve Adequacy
Accident Average Paid Loss Average Case ReservesYear 12 24 12 241999 2,000 4,000 2,000 8,0002000 2,500 5,000 1,875 7,5002001 3,125 1,823
Trend 25% 25% -4.5% -6.3%
Average Paid Loss = Paid Loss Triangle (Slide 30) / Closed Claim Triangle (Slide 31) * 1,000
Average Case Reserves = (Incurred Loss Triangle - Paid Loss Triangle (Slide 30)) /
(Reported Claim Triangle - Closed Claim Triangle (Slide 31)) * 1,000
372002 CLRS
Case Reserve Adequacy
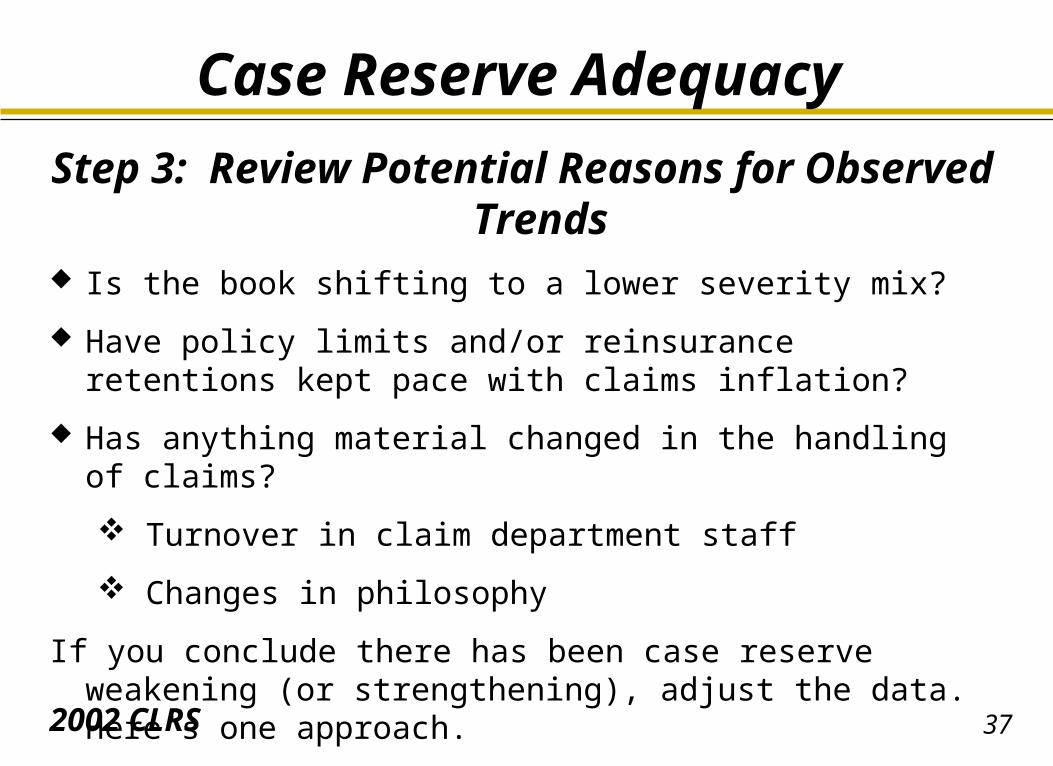
Step 3: Review Potential Reasons for Observed Trends
Is the book shifting to a lower severity mix?
Have policy limits and/or reinsurance retentions kept pace with claims inflation?
Has anything material changed in the handling of claims?
Turnover in claim department staff
Changes in philosophy
If you conclude there has been case reserve weakening (or strengthening), adjust the data. Here’s one approach.
382002 CLRS
Case Reserve Adequacy
Step 4: Adjust Historical Case Reserves to Current Adequacy Levels
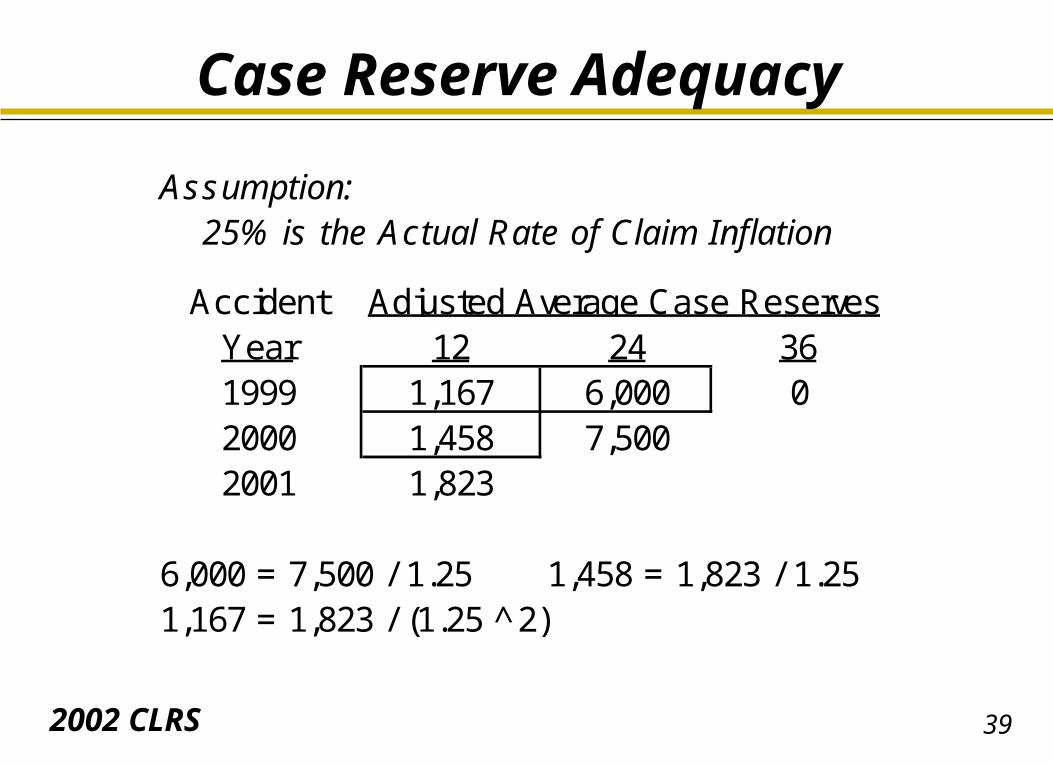
392002 CLRS
Case Reserve Adequacy
Assumption: 25% is the Actual Rate of Claim Inflation
Accident Adjusted Average Case ReservesYear 12 24 361999 1,167 6,000 02000 1,458 7,5002001 1,823
6,000 = 7,500 / 1.25 1,458 = 1,823 / 1.251,167 = 1,823 / (1.25 ̂2)
402002 CLRS
Case Reserve Adequacy
Step 5: Calculate Adjusted Incurred Losses
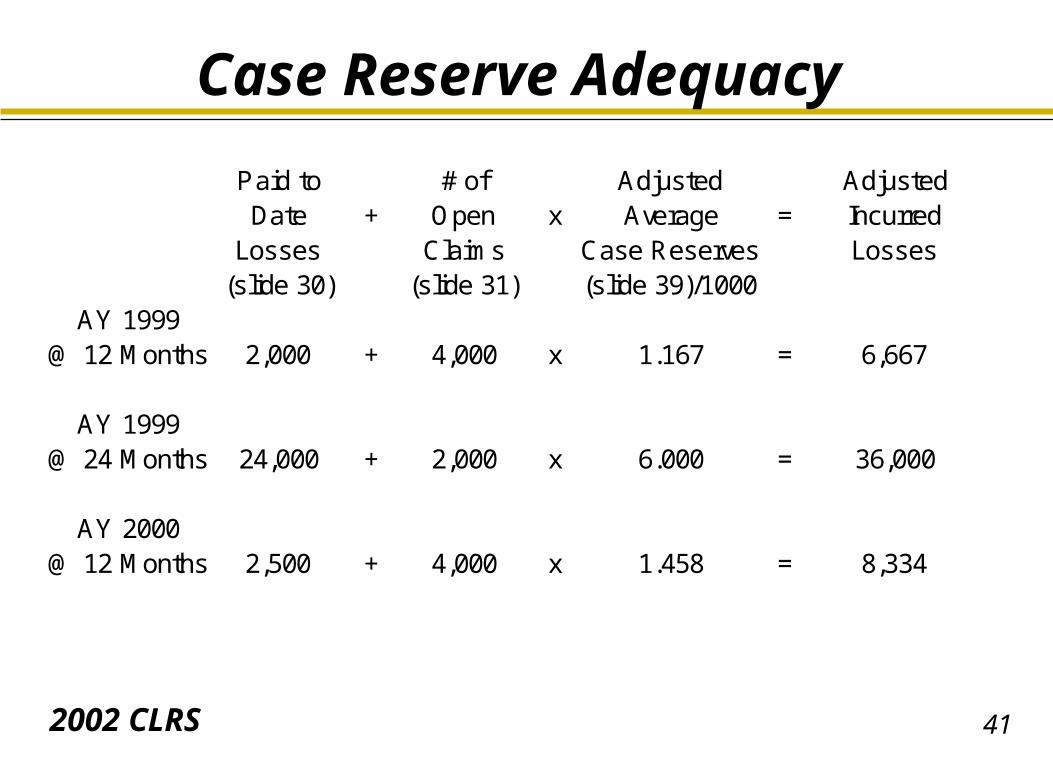
412002 CLRS
Case Reserve Adequacy
Paid to # of Adjusted AdjustedDate + Open x Average = Incurred
Losses Claims Case Reserves Losses(slide 30) (slide 31) (slide 39)/1000
AY 1999@ 12 Months 2,000 + 4,000 x 1.167 = 6,667
AY 1999@ 24 Months 24,000 + 2,000 x 6.000 = 36,000
AY 2000@ 12 Months 2,500 + 4,000 x 1.458 = 8,334
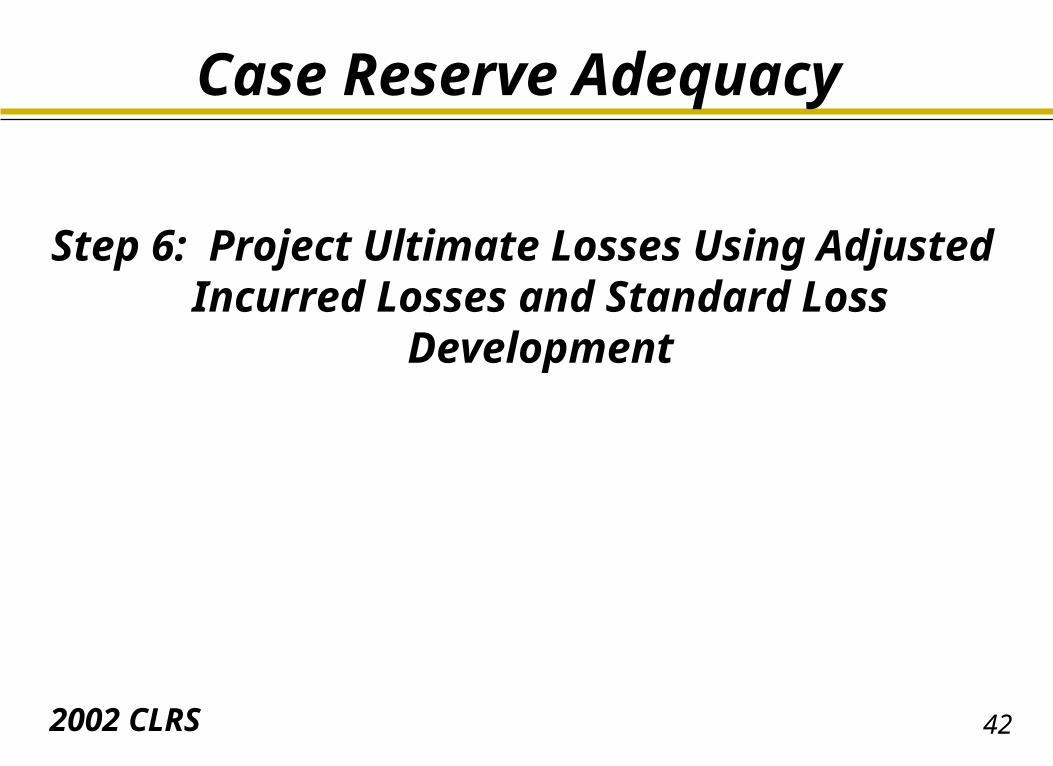
422002 CLRS
Case Reserve Adequacy
Step 6: Project Ultimate Losses Using Adjusted Incurred Losses and Standard Loss Development
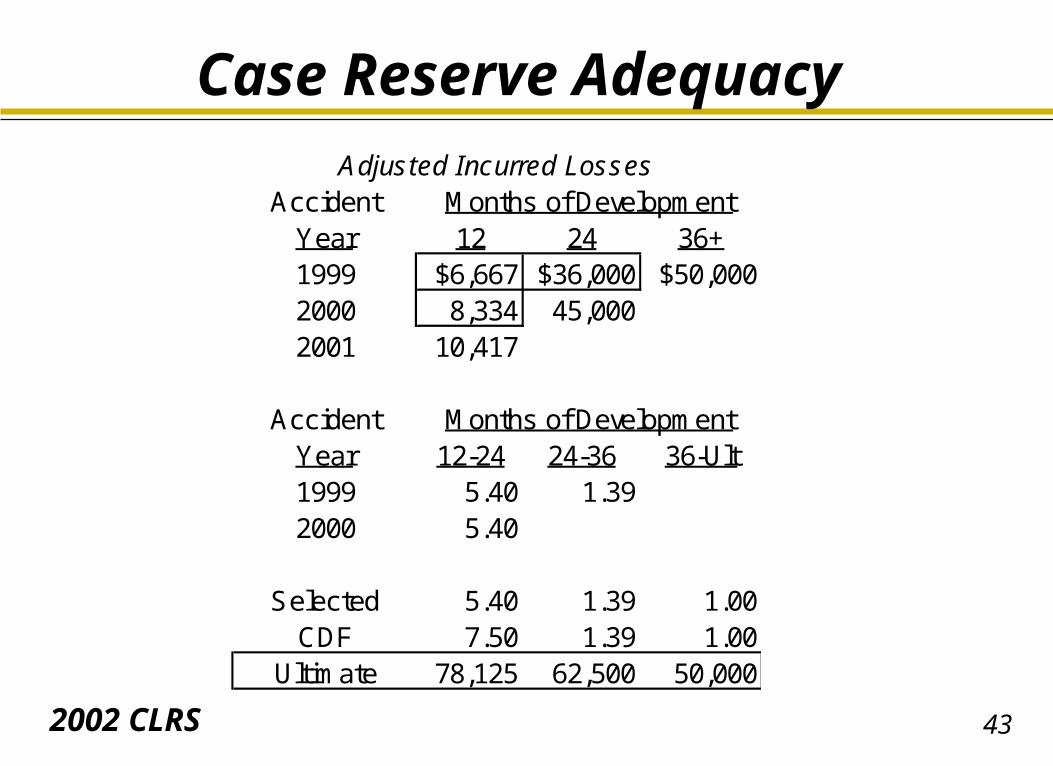
432002 CLRS
Case Reserve AdequacyAdjusted Incurred Losses
Accident Months of DevelopmentYear 12 24 36+1999 $6,667 $36,000 $50,0002000 8,334 45,0002001 10,417
Accident Months of DevelopmentYear 12-24 24-36 36-Ult1999 5.40 1.392000 5.40
Selected 5.40 1.39 1.00CDF 7.50 1.39 1.00
Ultimate 78,125 62,500 50,000
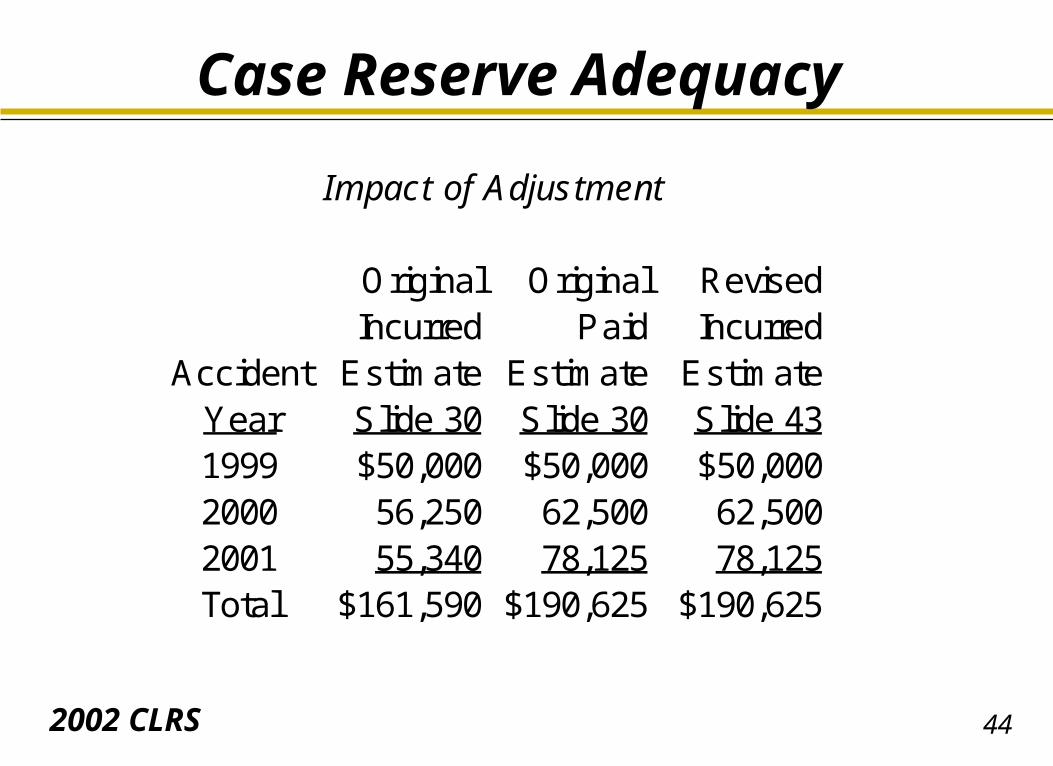
442002 CLRS
Case Reserve Adequacy
Impact of Adjustment
Original Original RevisedIncurred Paid Incurred
Accident Estimate Estimate EstimateYear Slide 30 Slide 30 Slide 431999 $50,000 $50,000 $50,0002000 56,250 62,500 62,5002001 55,340 78,125 78,125Total $161,590 $190,625 $190,625
452002 CLRS
What Else?
Deductibles/Limits/SIRs change Reinsurance Arrangements Change Tort Reform New Sources of Loss Changes in the Economy