Separation of Tc from U and Development of Metallic Tc ...
273
UNLV Theses, Dissertations, Professional Papers, and Capstones 5-1-2013 Separation of Tc from U and Development of Metallic Tc Waste Separation of Tc from U and Development of Metallic Tc Waste Forms Forms Edward Mausolf University of Nevada, Las Vegas Follow this and additional works at: https://digitalscholarship.unlv.edu/thesesdissertations Part of the Analytical Chemistry Commons, Oil, Gas, and Energy Commons, and the Radiochemistry Commons Repository Citation Repository Citation Mausolf, Edward, "Separation of Tc from U and Development of Metallic Tc Waste Forms" (2013). UNLV Theses, Dissertations, Professional Papers, and Capstones. 1860. http://dx.doi.org/10.34917/4478279 This Dissertation is protected by copyright and/or related rights. It has been brought to you by Digital Scholarship@UNLV with permission from the rights-holder(s). You are free to use this Dissertation in any way that is permitted by the copyright and related rights legislation that applies to your use. For other uses you need to obtain permission from the rights-holder(s) directly, unless additional rights are indicated by a Creative Commons license in the record and/or on the work itself. This Dissertation has been accepted for inclusion in UNLV Theses, Dissertations, Professional Papers, and Capstones by an authorized administrator of Digital Scholarship@UNLV. For more information, please contact [email protected].
Transcript of Separation of Tc from U and Development of Metallic Tc ...

UNLV Theses, Dissertations, Professional Papers, and Capstones
5-1-2013
Separation of Tc from U and Development of Metallic Tc Waste Separation of Tc from U and Development of Metallic Tc Waste
Forms Forms
Edward Mausolf University of Nevada, Las Vegas
Follow this and additional works at: https://digitalscholarship.unlv.edu/thesesdissertations
Part of the Analytical Chemistry Commons, Oil, Gas, and Energy Commons, and the Radiochemistry
Commons
Repository Citation Repository Citation Mausolf, Edward, "Separation of Tc from U and Development of Metallic Tc Waste Forms" (2013). UNLV Theses, Dissertations, Professional Papers, and Capstones. 1860. http://dx.doi.org/10.34917/4478279
This Dissertation is protected by copyright and/or related rights. It has been brought to you by Digital Scholarship@UNLV with permission from the rights-holder(s). You are free to use this Dissertation in any way that is permitted by the copyright and related rights legislation that applies to your use. For other uses you need to obtain permission from the rights-holder(s) directly, unless additional rights are indicated by a Creative Commons license in the record and/or on the work itself. This Dissertation has been accepted for inclusion in UNLV Theses, Dissertations, Professional Papers, and Capstones by an authorized administrator of Digital Scholarship@UNLV. For more information, please contact [email protected].

SEPARATION OF TC FROM U AND DEVELOPMENT
OF METALLIC TC WASTE FORMS
By
Edward John Mausolf
Bachelor of Arts in Chemistry
University of Nevada, Las Vegas
2007
A dissertation submitted in partial fulfillment
of the requirements for the
Doctor of Philosophy in Radiochemistry
Department of Chemistry
College of Sciences
The Graduate College
University of Nevada, Las Vegas
May 2013

ii
THE GRADUATE COLLEGE
We recommend the dissertation prepared under our supervision by
Edward John Mausolf
entitled
Separation of Tc from U and Development of Metallic Tc Waste Forms
be accepted in partial fulfillment of the requirements for the degree of
Doctor of Philosophy in Radiochemistry Department of Chemistry
Kenneth Czerwinski, Ph.D., Committee Chair
Frederic Poineau, Ph.D., Committee Member
Alfred Sattelberger, Ph.D., Committee Member
Jacimaria Batista, Ph.D., Graduate College Representative
Thomas Piechota, Ph.D., Interim Vice President for Research &
Dean of the Graduate College
May 2013

iii
ABSTRACT
Separation of Tc from U and Development of
Metallic Tc Waste Forms
By
Edward John Mausolf
Dr. Kenneth Czerwinski, Advisory Committee Chair
Professor of Chemistry
Chair of the Department of Radiochemistry
University of Nevada, Las Vegas
The isotope Technetium-99 (99
Tc) is a major fission product of the nuclear
industry. In the last decade, approximately 20 tons of 99
Tc have been produced by the US
nuclear industry. Due to its long half-life (t1/2 = 214,000 yr), beta radiotoxicity, and high
mobility as pertechnetate [TcO4]-, Tc represents long-term concern to the biosphere.
Various options have been considered to manage 99
Tc. One of them is its separation from
spent fuel, conversion to the metal and incorporation into a metallic waste form for long-
term disposal. After dissolution of spent fuel in nitric acid and extraction of U and Tc in
organic media, previously developed methods can be used to separate Tc from U, convert
the separate Tc stream to the metal and reuse the uranium component of the fuel. A
variety of metallic waste forms, ranging from pure Tc metal to ternary Tc alloys
combined with stainless steel (SS) and Zr are proposed. The goal of this work was to
examine three major questions: What is the optimal method to separate Tc from U? After

iv
separation, what is the most efficient method to convert the Tc stream to Tc metal?
Finally, what is the corrosion behavior of Tc metal, Tc-SS alloys and Tc-Zr-SS alloys in
0.01M NaCl? The goal is to predict the long term behavior of Tc metallic waste in a
hypothetical storage environment.
In this work, three methods have been used to separate Tc from U: anionic
exchange resin, liquid-liquid extraction and precipitation. Of the three methods studied,
anionic exchange resins is the most selective. After separation of Tc from U, three
different methods were studied to convert the Tc stream to the metal: thermal treatment
under hydrogen atmosphere, electrochemical and chemical reduction of pertechnetate in
aqueous media. The thermal treatment of the Tc stream under hydrogen atmosphere is the
preferred method to produce Tc metal. After Tc metal is isolated, it will be incorporated
into a metal host phase. Three different waste forms were produced for corrosion studies
in this work: Pure Tc metal, SS(Tc 2 wt%)Zr and SS(Tc 1.34 wt%) alloys. Corrosion rate
measurements indicate that both SS(Tc 2 wt%)Zr and SS(Tc 1.34 wt%) alloys corrode
more slowly than metallic Tc in the solutions tested.

v
Background
Technetium waste forms are generated from reprocessing used nuclear fuel.
Research related to the separation of Tc and the production and characterization of Tc
waste forms under geological storage conditions by evaluating their respective corrosion
rates is the focus of this document. As of June 2012 there are 437 nuclear reactors in
operation worldwide that have an electrical generating capacity of 371,762 MWe [1].
These reactors consume an excess of 6400 tons of enriched U that is obtained >35000
tons of natural U. In these reactors, fission of both 235
U and 239
Pu leads to fission-
products (e.g., Tc, I, Cs), higher actinides (e.g., Pu, Np) and activation products (e.g.,
60Co). After fission, U and Pu represent approximately 97% of the mass of the spent fuel
[2]. In the context of these nuclear activities, three major policies have been considered
for handling the spent fuel and its components (Figure 1).
Once through cycle: the fuel elements are stored in temporary facilities with the
intention to finally deposit them in underground vaults.
Modified open cycle: limited or no separations as the reactor operates through a
breed and burn series.
Closed fuel cycle: The spent fuel is reprocessed/recycled in order to recover
valuable elements (mainly U and Pu). In this cycle, the waste is planned to be placed in a
repository.
Reprocessing U and Pu can significantly reduce the volume of material to be
disposed of as high level radioactive waste (HLW). In full reprocessing, Pu and U, minor

vi
actinides, and fission products can be isolated from the U/Pu streams which ultimately
reduce the radiotoxicity of these materials/wastes [3].

vii
Figure 1. Various fuel cycle options: Once- through (left), modified open cycle (center)
and closed (right) [4].

viii
At the present time, full reprocessing is employed in France, Russia, Japan1 and
England with PUREX (Plutonium Uranium Redox EXtraction) [5]. In the PUREX
process, spent fuel is dissolved in concentrated nitric acid (HNO3) and U and Pu are co-
extracted by tributyl phosphate (30 vol % TBP) in kerosene/dodecane. This process
leaves the bulk of the non-volatile fission products in the aqueous phase [6]. One of the
main fission products, 99
Tc (~6% from 235
U, t1/2 = 2.13∙105 years, β
-max = 293 keV), can be
co-extracted with U and Pu after Tc dissolution in nitric acid. The presence of Tc in the
U/Pu stream complicates the recycling of these elements because of the need of
secondary separations.
Currently in the US the PUREX process is not envisaged due to government
regulation stating that pure streams of Pu cannot be generated for commercial use. In this
regard, a variation of the PUREX process called UREX (Uranium EXtraction), had been
proposed, but is no longer considered. In the UREX process, the U from spent
commercial light water reactor fuel is extracted and the Pu is left in a high-level waste
stream with other minor actinides and fission products [Error! Bookmark not defined.].
he UREX process is comprised of five solvent-extraction segments. These suite of
extractions, are meant to effectively achieve:
Separation and recovery of Tc and U (UREX segment)
Recovery of Cs and Sr
Recovery of Pu and Np
1 As the year 2012, reprocessing activities in Japan have been
significantly modified after the Fukushima accident in 2011. Stop of
all nuclear power plant units is planned for the mid 2030’s -JAEA.

ix
Recovery of Am, Cm, and rare-earth fission products
Separation of Am and Cm from rare-earth fission products [7]
For the first step (UREX segment), requirements were that U recovery must be
greater than 90%, levels of >99% are achievable. If not used as fuel replacement, U
purity should allow for its direct disposal as low level radioactive waste. Technetium
recovery from the liquid phase must be greater than 95%, levels of > 97% are achievable.
Technetium may be transmutated to ruthenium if isolated to these levels. For
transmutation, less than 16 ppm of fissile actinides per gram of Tc must be present. In
the UREX segment, anion exchange resins are used to separate U from Tc [8]. This
process was completed as a general trial, and it was tested in the closed end-to-end
(CETE) demonstration at Oak Ridge National Laboratory (ORNL) in 2008. In this
demonstration, a feed containing U and Tc in 0.01 M HNO3 was used, Tc was sorbed on
Reillex HP/Q anion exchange resins as pertechnetate, [TcO4]-, and eluted with significant
quantities of 1 M NH4OH.
After separation, Tc is planned to be incorporated into a durable waste form for
storage. Various waste forms have been proposed, ranging from metallic alloys (stainless
steel (SS) or zircaloy from fuel cladding), to oxides and glass [9]. The work presented in
this document deals with the separation of U from Tc, the conversion of the Tc stream to
the metal and the evaluation of the corrosion behavior of metallic Tc in aqueous media.
The corrosion behavior of the recovered product is compared to a proposed Tc alloy
waste form.
This document is constituted of the six chapters. Chapter 1 is a bibliographic study
on the fundamentals and applied chemistry of Tc. In this chapter, the chemistry of Tc in

x
the nuclear fuel cycle is presented. Chapter 2 outlines the experimental techniques and
methods used in this work including a brief discussion related to electrochemical
corrosion. This includes preparation of compounds and characterization by spectroscopy,
microscopy and X-ray diffraction. A new method used to thermally convert pertechnetate
to Tc metal is also presented. The separation and electrochemical methods used in
chapter 3 and 5 are also provided. In Chapter 3, the separation of Tc from U is performed
by 3 different methods: anion exchange chromatography, liquid-liquid extraction, and
precipitation. The various methods are compared and subsequently discussed. Finally, a
demonstration of the separation of U from Tc is performed under the UREX conditions.
In Chapter 4, the Tc products obtained from the three examined separation methods are
converted to metallic Tc. Thermal treatment, chemical and electrochemical reduction are
examined for metal formation. The products are characterized and yields are reported. A
discussion on the advantage of each method is presented. Chapter 5 is related to the
study of the corrosion behavior of metallic Tc and Tc stainless steel alloys in aqueous
media. Corrosion is studied by electrochemical techniques. The corrosion products are
studied in solution and at the surface of the electrode whereupon a corrosion mechanism
of Tc in aqueous media is proposed. In Chapter 6 conclusion and future works are
presented. The document is finalized by discussing a simplified liquid fuel cycle
incorporating the overreaching goals of the document.

xi
Table of Contents
ABSTRACT ........................................................................................................................ ii
Background ......................................................................................................................... v
List of Tables .................................................................................................................. xvii
List of Figures ................................................................................................................... xx
Chapter 1 ............................................................................................................................. 1
1.1 Solution phase and oxidation states ......................................................................... 1
1.1.1 Solid state chemistry .................................................................................................. 3
1.1.2 Pertechnetate salts ...................................................................................................... 3
1.1.3 Technetium dioxide ................................................................................................... 5
1.1.4 Metallic Technetium .................................................................................................. 5
1.2. Solution chemistry in aqueous non-complexing media ............................................... 7
1.3 Technetium in spent fuel .............................................................................................. 9
1.3.1 Separation of Technetium from Uranium ................................................................ 12
1.3.2 Production of Technetium Metal ............................................................................. 12
1.4 Technetium Waste Forms ........................................................................................... 13
1.5 Corrosion................................................................................................................ 14
1.5.1 Passivity ............................................................................................................. 14
1.5.2 Open Circuit Potential ........................................................................................ 15
1.5.3 Tafel Plot ............................................................................................................ 18
1.5.4 Linear Polarization Resistance ........................................................................... 20
1.5.5 Bulk electrolysis ................................................................................................. 24
1.6 Conclusion .................................................................................................................. 24
Chapter 2 ........................................................................................................................... 26

xii
2.1 Preparation of Technetium compounds used in this work. .................................... 26
2.1.1 Preparation of solid NH4TcO4 ............................................................................ 26
2.1.2 Preparation of (NH4)2TcCl6 ................................................................................ 27
2.1.3 Preparation of TcO2. ........................................................................................... 27
2.1.4 Preparation of Technetium Metal ....................................................................... 27
2.2 Spectroscopic techniques ....................................................................................... 27
2.2.1 UV-visible Spectroscopy.................................................................................... 28
2.2.2 X-ray Absorption Fine Structure Spectroscopy ................................................. 30
2.3 Scanning Electron Microscopy and Energy Dispersive X-ray Spectroscopy ........ 31
2.4 Diffraction techniques ............................................................................................ 31
2.4.1 Powder X-ray Diffraction................................................................................... 31
2.4.2 Single Crystal X-ray Diffraction ........................................................................ 32
2.5 Liquid scintillation counting. ................................................................................. 32
2.5.1 Preparation of Uranium and Technetium standards for LS counting ...................... 32
2.6 Methods.................................................................................................................. 37
2.6.1 Anionic exchange resin ...................................................................................... 37
2.6.1.1 Preparation of the resin for column studies .......................................................... 37
2.6.2 Liquid –liquid Extraction ................................................................................... 39
2.6.3 Thermal treatment by steam reforming .............................................................. 44
2.6.4 Construction of an electrode .............................................................................. 47
2.6.5 Electrochemical set-up ....................................................................................... 54
2.6.5.1 Experimental procedure for corrosion studies ...................................................... 56
Chapter 3 ........................................................................................................................... 59
3.1 Anionic exchange resin methods ................................................................................ 59

xiii
3.1.1 Sorption of [TcO4]- on Eichrom Aliquot 336 WBEC .............................................. 59
3.1.2 Elution of Tc from the resin ............................................................................... 63
3.1.2.1. Elution with 1 M NH4OH .................................................................................... 63
3.1.2.2 Elution with 1 M HNO3 – Static Experiment ..................................................... 68
3.1.2.3 Dynamic column study....................................................................................... 72
3.1.2.4 Elution with SnCl2/Thiourea in 0.01 M HCl ...................................................... 75
3.1.3 Decomposition of ammonium nitrate ................................................................. 79
3.1.3.1 – Degradation of ammonium nitrate in the presence of sucrose ........................... 80
3.1.3.2 Degradation of NH4NO3 with triethanol amine ................................................. 84
3.1.4 Demonstration of the Uranium/Technetium separation ..................................... 88
3.1.5 Summary on anion exchange resins method ...................................................... 91
3.2 Liquid-liquid extraction methods ........................................................................... 91
3.2.1 Individual Extractions ........................................................................................ 92
3.2.1.1 - Influence of Ascorbic Acid concentration in 0.01 M HNO3 .............................. 93
3.2.1.2 Influence of nitric acid concentration in 0.25 M ascorbic acid............................ 97
3.2.1.3 Distribution factor for Uranium and Technetium in the UREX conditions ........ 101
3.3 Precipitation methods........................................................................................... 104
3.3.1 Precipitation using the tetrabutylammonium cation. ............................................. 104
3.3.2 Precipitation using the 1,2,4,6-Tetraphenyl pyridinium cation ............................. 106
3.3.2.1 Preparation .......................................................................................................... 106
3.3.2.2 Structural Characterization ................................................................................. 106
3.3.2.3 Solubility of TPPy[TcO4] in aqueous media ...................................................... 107
3.3.2.4 Summary ............................................................................................................. 112
3.3.3 Precipitation using the hexamine cobalt cation ..................................................... 114

xiv
3.3.3.1 Preparation .......................................................................................................... 114
3.3.3.2 Structural Characterization ................................................................................. 115
3.3.3.3 Solubility of [Co(NH3)6][TcO4]3 in aqueous media ............................................ 118
3.3.3.4 Summary ............................................................................................................. 118
3.4 Recommendation on Separation Techniques ....................................................... 118
Chapter 4 ......................................................................................................................... 120
4.1 Thermal methods ...................................................................................................... 120
4.1.1 Decomposition of TBA[TcO4] ......................................................................... 120
4.1.2 Decomposition of TPPy[TcO4] .............................................................................. 122
4.1.3 Decomposition of Co(NH3)6[TcO4]3 ...................................................................... 122
4.1.4. Decomposition of the Tc stream obtained after the UREX Demonstration ......... 128
4.1.5 Decomposition of the Tc stream after treatment with ascorbic acid ..................... 130
4.1.6 Decomposition of the Tc stream after elution with SnCl2/0.01M HCl .................. 132
4.2 Electrochemical Methods.......................................................................................... 134
4.2.1 Electrodepositon of Tc metal on a gold electrode ............................................ 134
4.2.1.1 Experimental ....................................................................................................... 134
4.2.1.2 Electrodeposition Yield ...................................................................................... 135
4.2.1.3 Characterization of the electrodeposit by powder XRD .................................. 137
4.2.1.4 Characterization of the electrodeposit by XAFS Spectroscopy .......................... 141
4.2.1.5 Characterization of the electrodeposit by scanning electron microscopy ........... 146
4.2.1.6 Elemental Dispersive X-ray Spectroscopy ......................................................... 148
4.2.1.7 Speciation of Tc in solution after electrodeposition ........................................... 150
4.2.2 Electrodeposition of Tc on Copper Cathode .................................................... 152
4.2.2.1 Experimental .................................................................................................... 152

xv
4.2.2.2 Results .............................................................................................................. 152
4.3 Chemical Methods .................................................................................................... 154
4.3.1 Borohydride reduction of [TcO4]- in acetic acid .............................................. 155
4.3.1.1 Experimental ....................................................................................................... 155
4.3.1.2 UV-visible Spectroscopy .................................................................................... 156
4.3.1.3 Microscopic Analysis of Tc(VII) Reduction Production with BH4- in the presence
of Acetic Acid ................................................................................................................. 158
4.3.1.4 EXAFS analysis of Tc(VII) Reduction Product by BH4- in the presence of Acetic
Acid ................................................................................................................................. 160
4.3.1.5 XANES analysis of sample A ............................................................................. 165
4.3.2 Reduction of TcCl62-
by Zn in 12 M HCl ......................................................... 169
4.3.2.1 Experimental ....................................................................................................... 169
4.3.2.2 XRD of solid B ................................................................................................... 170
4.3.2.3 XAFS analysis of precipitate A .......................................................................... 172
4.4 Summary ................................................................................................................... 177
Chapter 5 ......................................................................................................................... 178
5.1 Preparation of Tc metal and alloys for corrosion studies ......................................... 181
5.1.1 Techniques ............................................................................................................. 183
5.2 Corrosion of Tc Metal ............................................................................................... 183
5.2.1 Chemical Dissolution of Tc metal in HCl and HNO3 ............................................ 184
5.2.2 Corrosion behavior of Tc metal in the pH range 1 to 13 ....................................... 188
5.2.3 Limited Electrochemical Impedence Spectroscopy ............................................... 194
5.2.4 Corrosion Behavior of Tc metal in Aqueous Chloride Media ............................... 198
5.2.4.1 Aqueous Chloride Media .................................................................................... 198
5.2.4.2 Aqueous Chloride – Acidic and Basic Media ..................................................... 205

xvi
5.4 Summary ................................................................................................................... 214
Chapter 6 ......................................................................................................................... 216
References ....................................................................................................................... 231
Curriculum Vitae …………………………………………………………..…….…….239

xvii
List of Tables
Table 1.1
Tc oxidation states and the corresponding species where
TBA stands for tetrabutyl ammonium 2
Table 1.2 Definition of terms for equations 3 through 13 23
Table 2.1
Structural parameters obtained by adjustment of the k3 -
EXAFS spectra of the product obtained after reduction of
pertechnetate with ascorbic acid. [Tc = 0.01 M], [Asc =
0.25 M], Adjustment between k = [3.5 - 12] Å-1. ∆E0 =
10 eV. S02 =0.9 42
Table 3.1
Loading capacity of Tc, as the element, on Eichrom
WBEC anion exchange resins 61
Table 3.2
Maximum elution percentage of Tc from Reillex HP/Q
resins with HNO3 under batch conditions. 70
Table 3.3
Results of the elution of pertechnetate from large bead
WBEC anion exchange resins using 1 M NH4OH and 1
M HNO3. 74
Table 3.4
Elution results of Tc(VII) elution with SnCl2 in the
presence of thiourea and 0.01 M HCl. 78
Table 3.5
Extraction solution conditions of ammonium
pertechnetate in the presence of various concentrations of
ascorbic acid. Estimated distribution value (D) for the
individual separations. Error associated with the
measurements are less than 1%. 94
Table 3.6
Extraction solution conditions of uranyl nitrate in the
presence of various concentration of ascorbic acid.
Distribution coefficient (D) is also reported. Error
associated with the measurements are less than 1%. 96
Table 3.7
Conditions and estimated distribution ratio of Tc in the
presence of ascorbic acid (0.25 M) and various
concentrations of nitric acid. 98
Table 3.8
Conditions and estimated distribution ratio of U in the
presence of ascorbic acid (0.25 M) and various
concentrations of nitric acid. 100

xviii
Table 3.9
Conditions and activity distribution of U and Tc into 30%
TBP/dodecane. The percent of the original activity in the
mother solution was determined in the aqueous and
organic after the extraction. A majority of the activity
present in the solution is derived from Tc. Without the
presence of ascorbic acid, significant quantities of Tc
accompany the extraction of U. 102
Table 3.10
Tc concentration obstained after 60 days in the solution
at pH 2.22, 6.91, and 9.80. Estimated Ksp values of
TPPy[TcO4] are reported. 111
Table 4.1
Lattice parameters of resultiong Tc deposits on gold from
electrodeposition in 1 M H2SO4 at 1.0 A/cm2. 138
Table 4.2
Structural parameters obtained after adjustmebnt of the
EXAFS spectra of the Tc product obtained after
electrodeposition on a gold electrode from a 1 M H2SO4
solution contained 10 mg of Tc. Current density = 1
A/cm2. Electrodeposition time = 500 seconds. 145
Table 4.3
Structural parameter obtained by adjustment of the k3-
EXAFS spectra of sample A. Adjustment between k = [3,
12.5] Å-1. ∆E0 = 4.99 eV. 164
Table 4.4
Tc K edge (eV) vs. NH4[TcO4] for: TcO2, TcO2.H2O,
Sample A, (n-Bu4N)Tc2Cl8 and Tc metal. 168
Table 4.5
Debye-Waller Factor of TcO2, Tc metal and (n-
Bu4N)2Tc2Cl8. 173
Table 4.6
Structural parameters obtained by adjustment of the k3 -
EXAFS spectra of the product. Adjustment between k =
[3.5 - 12] Å-1. ∆E0 = 9 eV. S02 =0.9. 175
Table 5.1
Generalized composition of austenitic stainless steel
(SS316). 179
Table 5.2
Surface area (cm2) and elemental composition (weight
%) of electrodes used for corrosion measurements. 182
Table 5.3
Release rate (in mols.cm-2
.hr-1
) of soluble Tc species in
HCl and HNO3 solutions. 187
Table 5.4
Corrosion rate (A/cm2) and reported OCP (V vs. NHE) of
Tc metal as a function of pH recorded at OCP and
reported as the instantaneous corrosion rate without Tafel
branching coefficient interpretation. 192

xix
Table 5.5
Solutions used for polarization measurements on Tc
metal electrode. 199
Table 5.6
Corrosion Rate (C.R.) of Tc metal in NaCl solution in
non-deaerated solutions A and B recorded at OCP –
Instantaneous corrosion rateand C/D/E recorded at
+0.0712, +0.0589, and +0.114 V vs. Saturated Ag/AgCl
where Tafel constants intersect. Solution labels
correspond to Figure 5.9. 203
Table 5.7
Instantaneous corrosion rate (C.R.) and OCP vs. NHE of
Tc metal as a function of pH correlated to Figure 5.10 in
A) acidic brine (0.01M NaCl + 10-4
M H2SO4) and B)
basic brine (0.01M NaCl + 10-4
M NaOH). Table
corresponds to Figure 5.11. 208
Table 5.8
Corrosion rates of Tc metal, SS (Tc 1.34 wt%) and SS
(Tc 2 wt%) Zr in non-deaerated pH 5.5 containing 0.01M
NaCl. Values were calculated where the anodic and
cathodic branches intersect adapted from Figure 5.12
used to calculate the life-time of each material exposed to
the same solution. 212
Table 6.1
Raw values used to estimate the linear lifetime of each
material incorporating 2000 kg of Tc metal into the waste
form. 222
Table 6.2
Generalized assumptions of corrosion of Tc metal, SS(Tc
2 wt%)Zr, and SS(Tc 1.34 wt%) used to estimate the
lifetime of each material. 224
Table 6.3
The estimation of the lifetime of each material, Tc metal,
SS(Tc 2 wt%)Zr, and SS(Tc 1.34 wt%). 227

xx
List of Figures
Figure 1 Various fuel cycle options v
Figure 1.1
Ball and stick representation of the [TcO4]- anion, Tc
atoms (black), O atoms (red) 4
Figure 1.2
View of a portion of the structure of Tc dioxide. Tc
(gray) O (red). 6
Figure 1.3 Eh-pH diagram of Tc in non-complexing aqueous media. 8
Figure 1.4 Flowsheet diagram for the UREX process 11
Figure 1.5 OCP curve of a Tc metal electrode in 1 M HNO3 . 17
Figure 1.6
Example of a polarization curve anodically polarized
beyond OCP (A) plotted with the Tafel interpretation (B)
as log(i) vs. potential (V) with the ingrowth of a passive
region in the polarization curve shape (C). 19
Figure 2.1
UV-Visible spectra of [TcO4]- in H2O and [TcCl6]
2- in 6
M HCl. 29
Figure 2.2
Tc calibration curve in water used to correlate
concentration of 99
Tc in solution by LS counting in
extraction, electrodeposition and column studies. 34
Figure 2.3
U calibration curve in water from 0 g/L to 100 g/L (0 M
to 0.42M) were used to correlate concentration of 238
U in
solution by LS counting in extraction studies. 36
Figure 2.4
Experimental set-up used for separation by anionic
exchange resin (A) feed solution 100 g/L U and 133
mg/L Tc, 150 mL and 0.01M HNO3, B) by a peristaltic
pump flow rate, 4 mL per minute C) column containing
the anion exchange resin. 38
Figure 2.5
UV-visible spectra of the Tc-Asc complex in 1M HNO3
(top) and in 1M NH4OH (bottom). 40
Figure 2.6
XANES spectra of the product obtained after reduction of
pertechnetate with ascorbic acid in DI H2O. [Tc = 0.01
M], [Asc = 0.25 M]. 41
Figure 2.7
Experimental k3- EXAFS spectra (top) and Fourier
transform of k3- EXAFS spectra (bottom) of the product
obtained after reduction of pertechnetate with ascorbic
acid. [Tc=0.01 M], [Asc = 0.25 M]. Adjustment between
k = [3.5 - 12] Å-1
. Experimental (black solid lines) and
Experimental fit (dashed lines). 43

xxi
Figure 2.8
Experimental set up used for steam reforming of Tc
compounds. 45
Figure 2.9
Left: Tc metal obtained after thermal treatment at 700 °C
for 4 hours under dry Ar/H2 . Right: Tc metal obtained
after steam reforming of NH4TcO4 at 800 °C for 4 hours. 46
Figure 2.10
Pressed pellet (A), arc-melting of pellet (B), and resulting
bead (C). 48
Figure 2.11
A) Cylinder obtained after sectioning the arc-melted
pellet. B) Square material (red lines) obtained after
sectioning the cylinder. C) Two pins obtained after
sectioning the square material. 50
Figure 2.12
Pins mounted into a non conducting wire with protective
sleeve 51
Figure 2.13 Tc metallic bead mounted in a small Teflon cylinder. 53
Figure 2.14
A) Potentiostat controlled by a computer; B)
electrochemical cell, C) reference electrode (RE), Pt foil
counter electrode (CE) and Tc metal working electrode
(WE). 55
Figure 2.15
Tafel plot interpretation from anodic (red, A) and
cathodic (black, DA) polarization of a Tc stainless steel
alloys in deaerated and non deaerated acidic brine
solutions after a 4 hour OCP measurement . Evaluated
data: ECORR = 336.1 mV, ICORR: =100 µA, ßc = 136.0
mV, ßa = 122.4 mV. 58
Figure 3.1
Left: View of the cotton bag used for the static
experiment. Right: Loading capacity curve of Eichrom
WBEC resins and experimental setup. Large resin
capacity curve in black and small resin is presented in
red. 62
Figure 3.2
Loading and elution profiles of UREX-type solutions
(HNO3 = 0.01 M, Tc = 1.34E-3 M, U = 0.42 M) on small
Bead Eichrom WBEC resins for runs 1, 4 and 10. 66
Figure 3.3
FWHM of the Eichrom U/Tc elution profile for elution
peaks 1, 2, 3, and 4. 67
Figure 3.4
Elution of [TcO4]- (%) as a function of HNO3
concentration on Reillex HP anion exchange resins. 71
Figure 3.5
Elution profile of Tc from UREX-type solutions on large
bead WBEC anion exchange resins using 1 M NH4OH
and 1 M HNO3. 75

xxii
Figure 3.6
Elution profile of Tc on Eichrom WBEC anion exchange
resins with SnCl2, thiourea and 0.01 M HCl. 77
Figure 3.7
Calibration curve of a solution containing sucrose,
nitrate, or both as mass excess from the test solutions. 82
Figure 3.8
Top: Representation of ammonium nitrate degradation
(%) as a function of the reaction time (A = 20 seconds, B
= 3 minutes, C = 4 minutes, D = 5 minutes) in the
presence of sucrose at 350 °C. Bottom: resulting
solutions, diluted to 10 mL after contact in the glass
scintillation vial. 83
Figure 3.9
Solid obtained after distillation of the [ReO4]- solution
containing 1 M NH4OH and triethanol amine under air at
250 °C after 30 minutes of treatment. 87
Figure 3.10
Loading, washing and eluting profile of [TcO4]- with 1 M
NH4OH on small bead Eichrom WBEC anion exchange
resins. 90
Figure 3.11
Distribution coefficient of U as a function of HNO3
concentration. Asc = 0.25 M 103
Figure 3.12
Ball and stick representation of TPPy[TcO4], showing the
pertechnetate anion and the TPPy cation. Hydrogen
atoms are omitted for clarity. Tc atoms (black), oxygen
atoms (red), C atoms (grey) and N atom (blue). 109
Figure 3.13
Concentration of [TcO4]- as a function of time obtained
after suspension of TPPy[TcO4] in solution at pH 2.22,
6.91 and 9.81. 110
Figure 3.14
Variation of Log [TcO4]- as a function of the R/Z for the
A[TcO4] salts, A= TMA (tetramethyl), TEA (tetraethyl),
TBA (tetrabutyl-ammonium) and TPPy. Values for
TMA, TBA and TEA are taken from literature [22]. 113
Figure 3.15
Solid obtained after precipitation of [TcO4]- with
[Co(NH3)6]3+
. 116
Figure 3.16
Ball and stick representation of the [Co(NH3)6][TcO4]3
showing the pertechnetate anion and the [Co(NH3)6]3+
cation. Hydrogen atoms are omitted for clarity. Tc atoms
(black), oxygen atoms (red), Co atoms (grey) and N
atoms (blue). 117

xxiii
Figure 4.1
XRD powder pattern, of the product obtained after
treatment of TBA[TcO4] at 750 °C under wet Ar for 8
hours. 121
Figure 4.2
Thermal treatment of [Co(NH4)6][TcO4]3 under Ar/H2
atmosphere at 750 ˚C (left) before treatment and (right)
after thermal treatment at 750 °C for 1 hour. 123
Figure 4.3
XRD powder pattern of product obtained after
decomposition of [Co(NH4)6][TcO4]3 precipitate at 750
°C for 1 hour under H2 atmosphere. 125
Figure 4.4
SEM image C (x1000), C and D (x50) of the sample
obtained after thermal treatment of [Co(NH4)6][TcO4]3
under Ar/H2 gas at 750 ⁰C for 1 hour. 127
Figure 4.5
Tc metal product obtained during treatment removed
from the furnace after 15 minutes of steam reformation
treatment. Tc metal (right) obtained after 90 minutes of
treatment at 800 ˚C of the Tc stream obtained after
UREX demonstration (Chapter 3). 129
Figure 4.6
XRD powder pattern of the product obstained after
treatment at 750 °C for 4 hours under wet Ar atmosphere
of a Tc ascorbic acid sample 131
Figure 4.7
Product obtained after treatment of the Tc-Sn pellet
following treatment at 1700 ˚C for 4 hours under Ar. 133
Figure 4.8
Electrodeposited Tc metal (0.167 mg) onto a gold
electrode (surface = 0.25 cm2) as a function of the
electro-deposition time. Experimental conditions: 10 mL
of 1 M H2SO4 containing 2 mg of Tc. Current density = 1
A/cm2. 136
Figure 4.9
XRD powder pattern of the deposit obtained after 500
second electro-deposition on a gold electrode. Top:
deposit from the solution containing 10 mg Tc. Bottom:
from the solution containing 2 mg Tc. 140
Figure 4.10
XANES spectra of Tc metal, TcO2, NH4[TcO4] and the
Tc product obtained after electrodeposition on a gold
electrode from a 1 M H2SO4 solution containing 10 mg of
Tc. Current density = 1 A/cm2. Electrodeposition time =
500 s. 142

xxiv
Figure 4.11
Fitted Experimental k3- EXAFS spectra (top) and Fourier
transform of k3- EXAFS spectra (bottom) of the Tc
product obtained after electrodeposition on a gold
electrode from a 1 M H2SO4 solution containing 10 mg of
Tc. Current density = 1 A/cm2. Electrodeposition time =
500 s. Adjustment between k = [2, 11] Å-1
144
Figure 4.12
SEM image for the Tc products obtained after
electrodeposition of Tc from 1 M H2SO4 (A) Deposit
time, 100 seconds, from solution containing 2 mg Tc,
magnification x2700. (B) Deposit time 500 seconds from
solution containing Tc 10 mg, magnification x700. (C)
Deposit time 500 seconds from solution containing Tc 10
mg, magnification x400. (D) Deposit time 100 seconds
from solution containing Tc 2 mg, magnification x3500. 147
Figure 4.13
EDS spectra of the Tc electrodeposits on gold electrodes
from 1 M H2SO4. A) Tc 2 mg, deposit time 100 seconds ,
B) Tc 10 mg, deposit time 100 s, C) Tc 2 mg, deposit
time 500 s D) Tc 10 mg, time 500 seconds. 149
Figure 4.14
UV-visible spectra of the brown solution after
electrodeposition of Tc on a gold electrode. 151
Figure 4.15
SEM image of Tc electrodeposits on copper electrode
from in 0.32 M H2SO4 solution containing 10 mg of Tc.
Left: magnification = x 450; Right: magnification = x
1300. 153
Figure 4.16
UV-Visible spectra of the solution: A) before reduction,
B) after the borohydride reduction of pertechnetate in
acetic acid, C) after dissolution of sample A in 12 M
HCl. 157
Figure 4.17
SEM image (x35, left and x6500 right) micrograph of the
reduction product obtained from the reaction between
NH4TcO4 and NaBH4 in acetic acid. 159
Figure 4.18
Fourier transform between k = [3, 12.5] Å-1
of k3-
EXAFS spectra of Tc metal, sample A, TcO2 and
NH4TcO4. 161
Figure 4.19
Fitted Experimental k3- EXAFS spectra (bottom) and
Fourier transform of k3- EXAFS spectra (top) of sample
A. Adjustment between k = [3, 12.5] Å-1
163

xxv
Figure 4.20
Normalized Tc-K edge spectra of: A) Tc metal, B)
Sample (Tc(VII) reduction product using BH4- in the
presence of acetic acid C) TcO2 and D) NH4TcO4 166
Figure 4.21
Powder XRD patter of the heat treated solid. The second
solid was obtained after thermal treatment (800 °C, 1
hour, Ar) of the initial precipiate from the Zn reduction
product of TcCl62-
in 12 M HCl. 171
Figure 4.22
Experimental k3- EXAFS spectra (left ) and Fourier
transform of k3- EXAFS spectra (right) of the precipitate
A, obtained from the Zn reduction of TcCl62-
in 12M
HCl. Adjustment between k = [3.5 - 12] Å-1
176
Figure 5.1
Potential (V vs. Sat. Ag/AgCl) of a Tc metal electrode as
a function of time in aerated 1M HCl and 1M HNO3. 185
Figure 5.2
Anodic polarization curves of Tc metal in sulfuric acid
(0.1 M, 1 mM, 10 mM and 0.1 mM) and sodium
hydroxide (0.1 M and 0.1 mM). 190
Figure 5.3
Eh-pH diagram of Tc in non-complexing media and
corrosion potential (V vs. NHE) of Tc metal determined
[this work] in : A) pH 1 , b) pH 2, , C) pH 3, D) pH 4,
E) pH 10 and F) pH 13. Acid solutions are in sulfruic
acid and basic solutions are in sodium hydroxide. 191
Figure 5.4
. Solid line: Corrosion rate of Tc metal (mA/cm2 ) as a
function of the pH [this work] Dashed line: Solubility of
TcO2 (mol.L-1
) as a function of the pH 193
Figure 5.5
EIS (Nyquist plot, left and Impedence Ω•cm2 vs. Hz,
right) of Tc metal in pH 10 NaOH. The circuit model
used for fitting is shown in the top left (Rs = solution
resistance, R1 = charge transfer resistance, CPE1 =
double layer capacitance, R2 = oxide resistance, CPE2 =
oxide capacitance. 195
Figure 5.6
Left bottom and left top: Electrochemical impedance
spectra of Tc metal in HNO3 (pH 4) non-deaerated.
Bottom right: linear polarization and Tafel plot
representing voltage ramp through potentials in the stable
region of Tc metal (triangle, -0.100 V), Tc oxide, (square
0.150 V) and pertechnetate (circle, 0.270 V). Top right:
Eh-pH diagram of Tc with stable regions of Tc metal,
TcO2 and [TcO4]-. 197

xxvi
Figure 5.7
Polarization potential in chloride media for Tc metal
exposed to various concentrations of chloride: A) 1 M
NaCl, B) 0.1 M NaCl, C) 0.01 M NaCl, D) 0.001 M
NaCl, and E) 0.0001 M NaCl. 201
Figure 5.8
Corrosion rate (A/cm2) of Tc metal in aqeous chloride
media. A) 1 M NaCl, B) 0.1 M NaCl, C) 0.01M NaCl, D)
0.001 M NaCl, and E) 0.0001 M NaCl. Corrosion points
are connected with straight lines for ease of reading the
figure. 202
Figure 5.9
Eh-pH diagram of Tc in non-complexing media. Value
of open circuit potential [this work] for a Tc electrode in
aqueous media: A) 1 M NaCl, B) 0.1 M NaCl, C) 0.01M
NaCl, D) 0.001 M NaCl, and E) 0.0001 M NaCl. 204
Figure 5.10
Anodic polarization curves in A) acidic brine, B) basic
brine, C) 10-4
M H2SO4 and D) 10-4
NaOH. 206
Figure 5.11
Eh-pH diagram of Tc in non-complexing media. The
value of open circuit potential [this work] for a Tc
electrode in A) acidic and B) basic brine media. 207
Figure 5.12
Polarization curves of Tc metal (top), SS (Tc 2 wt%) Zr)
(center), and SS (Tc 1.34 wt%) (bottom) in non-deaerated
solutions containing 0.01 M NaCl. 211
Figure 5.13
Eh-pH diagram of Tc in non-complexing media. Value of
open circuit potential [this work] for A) Tc metal, B)
SSTc(1.34 wt%) and C) 2 wt% Tc in SS/Zr (85:15) in
0.01M NaCl. 213
Figure 6.1
Relative volume of the three metallic Tc waste forms
needed to store 2000 kg of metallic Tc. A) Tc metal
0.174 m3, B) SS (Tc 2 wt%) Zr 12.73 m
3 and C) SS (Tc
1.34 wt%) 18.5 m3. 220
Figure 6.2
Life time based on a linear corrosion rate in 0.01 M NaCl
for metallic Tc waste forms containing 2000 kg of Tc
metal.. A) Tc metal, B) SS (Tc 2 wt%) Zr and C) SS (Tc
1.34 wt%). 229

1
Chapter 1
Technetium Background
1.1 Solution phase and oxidation states
Technetium is a Group VII second row transition metal and it exhibits the
electronic structure [Kr]4d65s
1 in the ground state. Its chemistry is close to that of Re and
has a rich and complex chemistry. Nine oxidations states from -1 to +7 [10] (Table 1.1)
have been reported in which lower valent oxidation states of Tc (i.e., Tc+3
, Tc+2
) have
high tendencies to form metal-metal bonds [11].

2
Oxidations
states
Compound Oxidations
state
Compound
-1 [Tc(CO)5]- +4 TcO2
0 [Tc2(CO)10] +5 (TBA)TcOCl4
+1 [Tc(CO)5Cl] +6 (TBA)TcNCl4
+2 TcCl2 +7 [NH4]TcO4
+3 (TBA)2[Tc2Cl8]
Table 1.1. Tc oxidation states and the corresponding species where TBA stands for
tetrabutyl ammonium.

3
1.1.1 Solid state chemistry
The thermodynamically stable oxidation states of Tc are 0, +4, and +7. These
oxidation states can be found in the form of Tc metal, TcO2 and pertechnetate salts.
Preparation and properties of those compounds are presented below.
1.1.2 Pertechnetate salts
The most common pertechnetate salt is ammonium pertechnetate (NH4TcO4).
The compound, which should be white, often containes a black impurity. It is purified
after treatment with an ammonia/hydrogen peroxide solution followed by evaporation to
dryness [12]. Ammonium pertechnetate may also be obtained via neutralization of
pertechnetic acid (HTcO4) with ammonium hydroxide (NH4OH). Ammonium
pertechnetate is highly soluble in water (~80 mg/mL) and under inert atmosphere it
decomposes to TcO2 above 350 °C. The compound NH4[TcO4] crystallizes in the
tetragonal I41/a space group with lattice parameters of a = 5.775(2), c = 13.252(5) Å
[13,14]. In ammonium pertechnetate, the [TcO4]- anion (Figure 1.1) exhibits the
tetrahedral geometry with a Tc=O bond distance of 1.702Å.

4
Figure 1.1. Ball and stick representation of the [TcO4]- anion, Tc atoms (black), O atoms
(red).

5
1.1.3 Technetium dioxide
Technetium dioxide (Figure 1.2) is best prepared by thermal decomposition of
NH4[TcO4] under inert atmosphere at 350 °C to 750 °C for several hours [15] and occurs
by:
OHNTcOTcONH 22244 422
Technetium dioxide crystallizes in the monoclinic space group P21/c with lattice
parameters of a = 5.6891(1), b = 4.7546(1), and c = 5.5195(1) Å [9] and is very insoluble
in neutral aqueous media [98].
1.1.4 Metallic Technetium
Technetium is a bright silvery grey metal, it melts at 2167 °C and boils at 4627
°C. Technetium metal crystallizes in the hexagonal space group P63/mmc (a/b = 2.743(1)
and c = 4.400(1) Å) [16,17]. Technetium metal can be prepared by thermal
decomposition of TcO2 in the temperature range 500 °C to 1000 °C under Ar/H2
atmosphere [18,19,20]. Some methods involve the production of hydrogen in situ by the
water-gas-shift reaction of carbon and water at elevated temperatures from 600 °C to 800
˚C under an inert atmosphere by steam reforming. The thermal decomposition of TcO2
under inert hydrogen occurs according to:
OHTcgHTcO 222 2)(2

6
Figure 1.2. View of a portion of the structure of Tc dioxide. Tc (gray) O (red).

7
The reduction of MO4- (M = Tc, Re) to the metal in aqueous media and methanol
via borohydride (BH4-) has been reported [21,22,23,24]. In this previous work the
oxidation state of the Tc product was determined by cerium titration but no structural
characterization was reported. Similarly, it was mentioned in literature that the zinc
reduction of [TcCl6]2-
in 12 M HCl leads to Tc metal but no characterization had been
performed. In the present work, the borohydride and zinc reduction of [TcO4]- and
[TcCl6]2-
have been reinvestigated and the reduction products characterized. Results and
further discussion are presented in chapter 3. Subsequently, the electrochemical
preparation of Tc metal is presented in chapter 4.
1.2. Solution chemistry in aqueous non-complexing media
In aqueous solution the stable thermodynamic oxidation state of Tc are 0, +4 and
+7. The Eh-pH diagram [25] (Figure 1.3) indicates that under oxidizing conditions the
chemistry of Tc is dominated by [TcO4]-. Under reducing conditions, tetravalent
technetium and metallic technetium are the predominant species.

8
Figure 1.3. Eh-pH diagram of Tc in non-complexing aqueous media.

9
1.3 Technetium in spent fuel
Technetium is a high yield fission product (~6% of 99
Tc from 235
U). In spent fuel,
Tc is present as a metallic inclusion or found as metallic alloys called the white-
inclusions which contain various undissolved solids (i.e., UDS). Within the UDS exists
the ɛ-phase which contains high concentrations of Mo, Ru, Tc, Pd and Rh metal. For fuel
burned at 51 MWd/MT is estimated that 26% of the Tc produced from 235
U fission is
contained in the UDS where the remaining 74% exists in the form of non-corrosion
resistant metallic Tc inclusions.
The Tc metallic inclusion and the ɛ-phase have the ability to form individual
phases within the fuel matrix after actinide burn-up [26,27,28]. The US Department of
Energy (DOE) had previously proposed methods to extract Tc in an initial U EXtraction
(UREX) process, a suite of aqueous-based solvent extraction processes that separate
spent fuel into actinide materials for recycle and fission product components for the
preparation of disposable waste forms (Figure 1.4). In the first step of the UREX process
the spent fuel is dissolved in boiling concentrated nitric acid. During dissolution, the
[TcO4]- anion is produced from oxidation of the pure metallic Tc inclusion, while Tc
metal present in the ɛ-phases does not readily oxidize. After dissolution, U and Tc are
extracted into an organic phase consisting of 30% tri-butyl phosphate (TBP) diluted in
kerosene or dodecane. Those elements are extracted as: UO2(NO3)2∙2TBP,
UO2(TcO4)(NO3)∙2TBP and HTcO4∙3TBP [29,30,31]. Technetium and U are then back
extracted into 0.01 M HNO3. After the back extraction, Tc is separated from U and
converted into a disposable waste form [32,33]. The final Tc waste form has been

10
proposed to be metallic Tc or an alloy of Tc with stainless steel (SS), zirconium (Zr), or
both SS/Zr from cladding hulls [34,35].
These Tc metallic waste forms will dissolve or corrode when exposed to oxidizing
environments and will release the highly mobile [TcO4]-. The near field Tc concentration
will be dependent upon the solubility and corrosion rates of the waste forms. In this
context, the corrosion behavior of Tc metal and Tc alloys are studied and presented in
Chapter 5. Further considerations on U/Tc separation, conversion of the Tc stream to the
metal, and development of Tc waste forms are presented below.

11
Figure 1.4. Flowsheet diagram for the UREX process

12
1.3.1 Separation of Technetium from Uranium
The difference in charge between the [TcO4]- and [UO2]
2+ species allows
separation by anion exchange, liquid-liquid extraction, or selective precipitation. The
aqueous concentration of U in UREX is 100 g/L (0.42 M U) while Tc is 133 mg/L
(1.34E-3 M Tc). Separation of each produces pure streams of Tc and U. After Tc has
been separated from U, the Tc stream can be converted into pertechnetate salts and
ultimately to the metal for future incorporation into a suitable host phase.
1.3.2 Production of Technetium Metal
The thermal conversion of the aqueous Tc stream to metallic Tc represents a route
for potential Tc volatilization. This can result in material loss and potential radiological
contamination. It would simplify reprocessing activities if Tc could be recovered from
the eluent as the metal through reduction in solution.
Detailed studies have been reported concerning the electrochemical production of
metallic Tc. These early works performed reductions in aqueous media and described the
electrochemical preparation of Tc metal and/or Tc+4
oxides using Hg, stainless steel, Fe,
Au, and Cu electrodes [36]. In many cases, without significant acidification in aqueous
solutions, Tc oxides are the preferential reduction product. The recovery of Tc metal by
electrolysis has yet to be suitably characterized. There have been various studies that
define the conditions, electrode material, mechanism of reduction, and recovery of Tc
metal from pertechnetate solutions. Despite these wide ranging studies, significant
knowledge gaps on the use of these methods to recover Tc for application in the nuclear
fuel cycle exists. In an industrial setting, high temperature thermal conversion methods
are proposed to convert the recovered Tc product.

13
1.4 Technetium Waste Forms
Following its conversion to the metal, Tc is incorporated into a waste form. In
order to minimize the release of Tc in the near-field environment waste forms need to be
corrosion resistant. In addition to metallic species, oxide, glass, and ceramic waste forms
are under investigation. Various percentages of Tc are proposed to be loaded into the
final waste form in which Tc loading percent relative to the alloying material will directly
dictate its mobility, corrosion rate, and release rate into this defined environment.
Potential metallic waste forms that incorporate Tc include stainless steel and zirconium
alloys, Tc-Ru alloys, mimicked ε-phases containing Tc-Ru-Rh-Pd-Mo [37,38,39,40] and
alloys that contain an excess of Fe. The stability of these metallic waste forms has not
previously been investigated by electrochemical methods [41,42,43,44,45,46,47,48,49].
Electrochemical methods have been used widely to evaluate the corrosion
behavior of many traditional alloys and metals such as Zr and SS. These techniques can
provide corrosion potentials, dissolution rates and a corrosion mechanism benchmark of
metallic alloys containing Tc. These waste forms have been compared to metallic Tc
corrosion in potential repository aqueous solutions. Electrochemical techniques can
provide significant insight into how the metal may interact in a repository over geological
time periods under environmental conditions as related to corrosion. Electrochemical
studies used to deposit and measure Tc, or its alloys’ corrosion rates, may be used to
model and explain how Tc behaves in repositories at time periods that extend beyond its
half-life of 2.14·105 years. In the present work, the electrochemistry of Tc has been
investigated in order to synthesize Tc metal for waste form development from aqueous

14
solution and understand corrosion mechanisms for the prediction of the electrochemical
behavior of Tc and its waste forms in repository conditions for predictive models.
1.5 Corrosion
Corrosion is defined as the gradual wearing away or alteration of a metallic phase
by a chemical or electrochemical oxidizing process. Corrosion is caused by a flow of
electricity from one metal to another metal. Corrosion may also be driven by the same
material to itself through a self-oxidation-reduction process where conditions would
permit the flow of electricity from one region of the material to another (i.e, galvanic
coupling). In order for corrosion to occur, a moist conductor or electrolyte must be
present for the flow of this electrical current to proceed. The rate at which this current
flows defines the rate at which corrosion occurs. Metals degrade by actively (1) and
passively (2) dissolving. In the active state, metal ions will directly become dissolved
into solution according to:
M M2+
(aq) + 2e- (1)
Because of passivity, as the material is further polarized, the interaction of
water/hydroxide/dissolved oxygen or other dissolved species will begin to form layers
impregnated with oxygen according to:
M + H2O M-O + 2H+(aq) + 2e
- (2)
The mechanism of passivity is subsequently defined.
1.5.1 Passivity
Passivity is a decrease of corrosion due to formation of protective films. The
formation of passive films can be qualitatively evaluated and defined in various ways. A
metal active in the electromotive force series, or an alloy composed of such metals, is

15
considered passive when its electrochemical behavior becomes that of an appreciably less
active or noble metal. A metal or alloy is passive if it substantially resists corrosion in an
environment where thermodynamically there is a large free energy decrease associated
with its passage from the metallic state to appropriate corrosion products.
Passivation can occur through the exposure to oxygen, being heated in an oxidizing
environment, exposure to oxidizing solutions, and anodic polarization where the major
components of passive alloys are metals [50]. In general, a metal normally passive in air
can often passivate another metal if the two form a solid solution alloy over an adequate
range of composition. Multi-phase alloys can be passive but only if the galvanic couple
between electrically conducting phases are of the same order of magnitude.
1.5.2 Open Circuit Potential
In open circuit potential (OCP), the potential of the metal is measured in solution
against a known reference and values are reported as potential as a function of the time (E
vs. t). Potential-time curves do not provide quantitative data on corrosion rates. An
example of Tc metal exposed to nitric acid is presented in Figure 1.5. Evaluating the
OCP is used to determine whether a metal is actively or passively corroding or
dissolving. It is used to determine the corrosion potential (ECORR) of a metal where
potentials more positive than this OCP value would then represent values where
corrosion would increase the dissolution rate of the material.
The value of the potential determined by OCP corresponds to ECORR at the
specific time it is measured and may never come to equilibrium. If steady state is
achieved, the true corrosion potential may be determined for a stable system. During
evaluation of the OCP, no current is applied to the metal surface in solution. Changes in

16
OCP may occur following polarization leading to the ingrowth or indication of a passive
film at the surface. Due to surface re-polishing preceding polarization, the recorded OCP
and changes are possibly due to the presence of varying surface properties. In the
example (Figure 1.5), Tc metal exposed to aerated 1 M HNO3 will actively dissolve in
the presence of dissolved oxygen. At the surface, there is a rapid rise to steady state from
+500 mV to +570 mV indicating that the surface has become more noble and is actively
dissolving through some intermediate species. Open circuit potential is used to study
corrosion equilibrium behavior for Tc metal and Tc alloys in Chapter 5.

17
Figure 1.5. OCP curve of a Tc metal electrode in 1 M HNO3 .

18
1.5.3 Tafel Plot
The Tafel region of a polarization curve is represented in Figure 1.6. The Stern
Geary equation (3)
)(3.2 ca
ca
E
II corr
(3)
predicts that for E>ECORR the anodic reaction dominates. Linear regression on this portion
of the curve can be made using the least square method at which time the Tafel constant
ßa (anodic rate of reaction) is reported. Similarly, the ßc (cathodic rate of reaction)
constant which governs the cathodic branch of the overall corrosion mechanism can be
determined by similar methods in a deaerated solution when polarized anodically through
the cathodic branch at more reducing potentials. In order for these rates to be valid,
resistance polarization values should be fit to the Stern Geary equation for the potential
(E) in volts sufficiently close to ECORR. As the potential approaches ECORR for current I =
0, the slope of the Stern Geary [51] equation is reported as the polarization resistance
value and is reported as RP in Ohms (Ω). A general diagram of a polarization curve
(Figure 1.6) shows three major regions, OCP (A), the Tafel region and slopes of the curve
(B), and a pronounced passive region where corrosion is inhibited (C).
19
Figure 1.6. Example of a polarization curve anodically polarized beyond OCP (A) plotted
with the Tafel interpretation (B) as log(i) vs. potential (V) with the ingrowth of a passive
region in the polarization curve shape (C).

20
1.5.4 Linear Polarization Resistance
Linear polarization resistance (LPR) measurements are used to estimate the
corrosion rate of a metal as a function of potential based on the Stearn Geary equation (3)
[52]. Applying this equation, an instantaneous corrosion rate of the bulk modulus can
then be estimated using equation 3 which is valid when there is a linear relationship
between I and E, usually over a narrow range up to 50 mV for any E. If the terms for
βa and βc are known from the Tafel plot, and E is known, equation 3 can be reduced to
equation 4 by combining the known terms into K:
KIRateCorrosion (4)
Linear polarization is designed to determine a polarization resistance (Rp) value of
a material and ICORR through potential steps around the corrosion potential, ECORR. The Rp
(equation 5) is defined as the slope of the potential-current density curve at the free
corrosion potential:
0 dEasdI
dERP (5)
The resistance polarization value (Ω·cm-2
) over an exposed surface area of a
material is determined by fitting the region around the corrosion potential to a linear fit
within the evaluated anodic and cathodic regions. In order to find corrosion rates with
respective corrosion coefficients, a Tafel plot must be corrected to a mass-loss test where
fitting Tafel plots and determining RP values are based on the modified Stern Geary
equation (6) [53]:

21
c
EE
a
EE
corr
corrcorr
IEI 1010)(
(6)
In equation 6, I(E) is the total current at a specific potential (E). The ECORR is the
OCP of the cell. The terms βa and βc are the Tafel constants for the anodic and cathodic
reactions and are defined as positive numbers, evaluated as the Tafel slope reported in
mV, calculated from LPR measurements. Change in ICORR is the corrosion current
corresponding to the anodic and cathodic current at E = ECORR where the total current I
(at ECORR) is the result in the difference of the anodic and cathodic current exchange rates
being summed to zero. Alpha values () are also referred to as the symmetry value of the
corrosion mechanisms as described in equation 7:
)(
)(exp)(
)1(exp0 corrcorrcorr EE
RT
FnEE
RT
Fnii
(7)
When E is sufficiently close to ECORR, it is possible to simplify the Stern and
Geary equation to:
10ln)(ca
cacorrcorr EEII
(8)
If the potential (E) is expressed as a function of current (I) in equation 9, when E ECORR
for I 0, the slope of this equation is termed the polarization resistance:
corr
cacorr
ca EI
IE
10ln
(9)

22
The Stern Geary equation predicts that for E > ECORR the anodic reaction predominates
and for E < ECORR the cathodic reaction predominates:
a
EcorrE
corrII
10 for E > Ecorr (10)
c
EcorrE
corrII
10 for E < Ecorr (11)
When the log[I] versus E representation of the polarization curves is plotted, two linear
regions are observed for E > ECORR and E < ECORR:
]log[]log[ corrcorr I
a
EEI
for E > Ecorr (12)
]log[]log[ corrcorr I
c
EEI
for E < Ecorr (13)
The corrosion rate, can be expressed as (i.e. A/cm2) or mass loss reported in
millimeter dimensional loss per years (i.e. mm/yr). The average density of the bulk
material must be known and the number of electrons lost to the soluble form of the metal
corroding is required to accurately estimate the life-time of the exposed metal. The
definition of terms for the equations are provided in Table 1.2

23
Term Definition
ICORR Corrosion Current (Amps)
I0 Measured current (Amps)
ECORR Corrosion Potential (V)
I Current (Amps)
E Potential (V)
βc Slope of the cathodic Tafel branch (V)
βa Slope of the anodic Tafel branch (V)
A/cm2 Current Density
Table 1.2 Definition of terms for equations 3 through 13

24
1.5.5 Bulk electrolysis
During a bulk electrolysis experiment a constant potential is applied to the
working electrode and the current is monitored as a function of time. The solution phase
can then be evaluated at the end of the experiment for the presence of corrosion or
deposition products. Bulk electrolysis can be used to monitor long-term degradation of
the surface of a material and rates of deposition. The technique is completed in a 3-
electrode system, under stirring so that ion diffusion does not limit ion transport to the
surface of the electrode.
1.6 Conclusion
Technetium is generated in high quantities in the nuclear fuel cycle and must be
managed. Its separation is vital to developing waste forms. The method used to separate
Tc from U, followed by its conversion to a metal phase will be the driving factors that
limit how future waste forms are produced. It is imperative to predict the long-term
behavior of metal packages containing Tc in storage conditions. Therefore, linking U/Tc
separations with metallic Tc recovery, in order to produce Tc containing waste forms,
followed by characterization of each stream/product, a study on the electrochemical
behavior of Tc alloys is the goal of this research outlined in this dissertation. The
research will focus on:
i) Separation of Tc from U using anion exchange resins, liquid – liquid
extraction and precipitation techniques
ii) Thermal, chemical and electrochemical synthesis of Tc metal

25
iii) Development of metallic Tc waste forms (i.e., Tc metal and Tc stainless steel
alloys) and investigation of the electrochemical behavior of these waste forms
in aqueous media

26
Chapter 2
Experimental Techniques and Methods
This chapter presents the methods and techniques used in this work. In the first
section, preparation of Tc compounds and the characterization techniques used
throughout the document are presented. In the second section, methods used to separate
Tc from U in solution by anion exchange, the preparation of electrodes for corrosion
measurements, thermal treatment methods, and corrosion techniques are presented.
2.1 Preparation of Technetium compounds used in this work.
The following sections provide experimental detail related to the preparation of
various Tc compounds relevant to this document.
2.1.1 Preparation of solid NH4TcO4
Prior to use, the NH4TcO4 (black-impure) was purified by dissolution into a dilute
NH4OH/H2O2 aqueous solution followed by evaporation to dryness under flowing Ar gas
for 24 hours in a centrifuge tube. The black compound (100 mg) was suspended in DI
H2O (15 ml) in a flask. Concentrated NH4OH (0.2 mL), and 30 % hydrogen peroxide
(0.05 mL) were added to the suspension and warmed to 100 ˚C. During warming, color
change from a clear-brown, to pink/purple and then colorless is observed. The colorless
solution was evaporated to dryness using a Rotovap and the white solid, NH4TcO4 (90
mg), was obtained (yield = 90 %). The NH4TcO4 produced by this method was used to
prepare the solutions for anion exchange, liquid-liquid extraction and precipitation
experiments (Chapter 3) electrodeposition, and chemical synthesis of Tc metal (Chapters
4).

27
2.1.2 Preparation of (NH4)2TcCl6
Ammonium pertechnetate (1001 mg) and ammonium chloride (350 mg) were
suspended in 50 mL of 12 M HCl then heated to 90 ˚C under magnetic stirring for 4
hours. A color change of the solution from clear to a yellow was observed. The UV-
visible spectra of the yellow solution exhibits absorption bands at 238, 305 and 340 nm
which are characteristic of the [TcCl6]2-
anion [54]. During warming a large fraction of
the generated (NH4)2TcCl6 precipitates. After cooling to room temperature the
supernatant was removed with a glass pipette. The resulting (NH4)2TcCl6 (mass = 1730
mg) was obtained in a yield of 89%.
2.1.3 Preparation of TcO2.
Crystalline TcO2 is prepared by thermal decomposition of NH4TcO4 at 700 °C
under an Ar atmosphere for 2 hours. The compound is air stable and can be kept for years
without change. Typical yields are 90% (100 mg of NH4TcO4 yields approximately 65
mg TcO2). Losses of Tc can be attributed to volatilization of Tc2O7 which occurs due to
the presence of oxygen in the tube, splattering or mechanical loss during transfer from the
quartz boat.
2.1.4 Preparation of Technetium Metal
Technetium metal was prepared by the decomposition of NH4TcO4 under 5%
H2/Ar for 90 minutes at 800 °C produced in a quartz boat in 50 to 100 mg batches with
yields in excess of 95%. Technetium metal obtained by this method was used for the
preparation of Tc-containing electrodes, alloys, and was used as references samples for
EXAFS studies discussed in Chapter 4 and 5.
2.2 Spectroscopic techniques

28
2.2.1 UV-visible Spectroscopy
UV-visible spectroscopy measurements were performed at room temperature in a
1 cm quartz cell on a Cary 6000i double beam spectrometer. Concentration of NH4TcO4
solution was successfully quantified by this method to produce stock Liquid Scintillation
(LS) counting calibration standards. This technique was mainly used in Chapter 3 and 4
to evaluate speciation of Tc during the borohydride reduction of [TcO4]-, the zinc
reduction of [TcCl6]2-
and electrodeposition of Tc metal in sulfuric acid. In solution, the
spectra of [TcO4]- anion exhibits band at 244 nm and 288 nm (ε = 5690 and 2170 and M
-
1 cm
-1), respectively. The spectra of the [TcCl6]
2- anion exhibits bands at 305 and 340 nm
(ε = 6500 and 10 000 M-1
cm-1
), respectively (Figure 2.1).

29
Figure 2.1. UV-Visible spectra of [TcO4]- in H2O and [TcCl6]
2- in 6 M HCl.

30
2.2.2 X-ray Absorption Fine Structure Spectroscopy
X-ray Absorption Fine Structure Spectroscopy (XAFS) measurements were
performed at the Advanced Photon Source (APS) at the BESSRC-CAT 12 BM station at
Argonne National Laboratory (ANL). For solids, samples and references compounds
were diluted by approximately 1 wt% Tc in boron nitride or directly taped to the
aluminum sample holders with Kapton. Solution phases consisted of 100 l of sample
injected into a liquid holder at Tc concentrations of no less than 1E-3 M Tc. All
compounds are placed in Teflon sample holders and the X-ray beam directly interacts
with the solid or solution. Standards of NH4[TcO4], (NH4)2TcCl6, TcO2 and Tc metal
were used as references samples. The XAFS spectra were recorded at the Tc-K edge
(21,044 eV) in fluorescence mode at room temperature using a 13 element germanium
detector. A double crystal of Si [111] was used as a monochromator for the X-ray source
and its energy was calibrated using molybdenum foil (Mo K edge = 20000 eV).
For each sample, several spectra were recorded in the k range (k = [0;16] Å-1
) and
averaged. Background contribution was removed using Athena [55] software and data
analysis was performed using WinXAS [56]. For the fitting procedure, amplitude and
phase shift functions were calculated by Feff8.2 [57]. Input files were generated by
Atoms [58] using crystallographic structures of Tc compounds (i.e., Tc metal, TcO2,
NH4TcO4) [59]. The uncertainty determined by EXAFS is ±20% on the coordination
number and ±1 % Å on the atomic distances (R). This technique was used to determine
the structure and oxidation state of the reduction product of [TcO4]- with ascorbic acid in
H2O (this chapter), the electrodeposition products of Tc on a gold substrate in 1M H2SO4

31
(chapter 4), the reduction product of [TcO4]- with NaBH4 in acetic acid/NaOH and the
reduction product of [TcCl6]2-
by Zn in 12 M HCl (chapter 4).
2.3 Scanning Electron Microscopy and Energy Dispersive X-ray Spectroscopy
Scanning Electron Microscopy (SEM) measurements were performed using a
JEOL-5610 scanning electron microscope equipped with secondary electron and
backscattered electron detectors. This SEM instrument performs energy dispersive X-ray
spectroscopy (EDS) measurements which provide insight into the elemental composition
of alloys, metals, and electrochemical deposits. Metallic samples (Chapter 3 and Chapter
4) were directly imaged, whereas non-conducting materials were carbon coated then
mounted onto carbon or aluminum tape for semi-quantitative elemental analysis and
imaging.
2.4 Diffraction techniques
2.4.1 Powder X-ray Diffraction
Powder X-ray diffraction (XRD) powder measurements were performed using a
Philips Panalytical X’Pert Pro equipped with Cu-Kα target with Ni filter and an X’elerator
multiple Si-strip solid-state detector. The XRD patterns were quantified by Rietveld
analysis using the Topas 3.0 and/or 4.0 software [60] and refined using appropriate
crystal structures from referenced literature data. Samples were mounted on a Si [1 1 1]
disc appropriate for diffraction and XRD patterns were recorded from 2θ = 5˚ to 120˚.
Electrodeposited samples were mounted onto the sample holders and held in place with
clay. The XRD measurements were completed by direct methods on thermally treated Tc
samples from resulting U/Tc separations, electrodeposited Tc metal, and pertechnetate
salt precipitates (Chapters 2 through 4).

32
2.4.2 Single Crystal X-ray Diffraction
The Single Crystal X-ray Diffraction (SC-XRD) measurements were performed
on a Bruker Apex II system equipped with an Oxford nitrogen cryostream operating at
150 K. Crystals were mounted under paratone on a glass fiber. Data processing was
performed using the Apex II suite, and an absorption correction performed with
SADABS. Structure solution and refinement were carried out using SHELX97.
Structures were solved with SIR2004 [61] within the WINGX program suite [62].
Following structure solution, the model was refined against F2 using SHELXTL [63]. SC-
XRD measurements were completed to determine the structure of two new pertechnetate
salts: TPPy[TcO4] (TPPy = 1,2,4,6-tetraphenylpyridinium) and the [Co(NH4)6][TcO4]3
(Chapter 4).
2.5 Liquid scintillation counting.
Liquid scintillation (LS) counting was performed using a Packard 250 Liquid
Scintillation Counter (Perkin-Elmer). Samples were compared against a calibration
standard (Figure 2.2 and 2.3) over the energy range of 50 eV – 350 eV. This energy
range was used to suppress U signals from mixed U/Tc samples. Sample volumes were
either 10 µL or 100 µL and were added to 10 mL of ULTIMA GOLD ABTM
(Packard)
scintillation cocktail. Calibration solutions were prepared to quantify the total
concentration of both Tc and U in aqueous solution (see chapter 3 and chapter 4).
2.5.1 Preparation of Uranium and Technetium standards for LS counting
Pertechnetate solutions ([Tc] = 0.012 M, verified by UV-visible spectroscopy)
were used to prepare a series of calibrated solutions (Figure 2.2)made in HCl, HNO3 and

33
H2SO4 and DI H2O. The Tc concentration of the standard solutions was prepared in the
range of 1 E-7 M to 1.12 E-2 M Tc.

34
Figure 2.2. Tc calibration curve in water used to correlate concentration of 99
Tc in
solution by LS counting in extraction, electrodeposition and column studies.

35
Uranium solutions in the concentration range of 0 to 0.42 M (0 – 100 g/L), were
prepared by dissolution of uranyl dinitrate hexahydrate (UO2(NO3)2·6H2O) in 0.01M
HNO3 and DI H2O. This calibration (Figure 2.3) was used for determination of U
concentrations in solution for anion exchange separations and liquid-liquid extraction
studies in the presence of ascorbic acid presented in Chapter 3.

36
Figure 2.3. U calibration curve in water from 0 g/L to 100 g/L (0 M to 0.42M) were used
to correlate concentration of 238
U in solution by LS counting in extraction studies.

37
2.6 Methods
2.6.1 Anionic exchange resin
Anion exchange was employed to separate [TcO4]- from [UO2]
2+ in 0.01 M nitric
acid. The anion exchange method exploits the difference in charge between the [UO2]2+
and [TcO4]- species. In the separation, pertechnetate is sorbed while uranyl does not
interact with the resin. After sorption, Tc can be eluted with NH4OH. Eichrom WBEC
resin was used in studies. . The resin consists of Aliquot 336 in conjunction with a
central nitrogen used to form a quaternary ammonium salt [N(C8-C10)4]+
. Aliquot 336 is a
mixture of C8 and C10 (octyl and capryl) chains. The extractant represents 40 wt%
loading of the resin. In this work the Eichrom WBEC resin has been extensively tested
for the separation of Tc from U (chapter 3). The loading capacities, reusability and
elution behavior of the resins are studied. This resin was used for the separation of Tc
from U under UREX-type conditions, [HNO3] = 0.01M, [U] = 100 g/L, and [Tc] = 133
mg/L at flow rates of 4 mL/minute from stock solutions ranging from 100 to 500 mL
(Figure 2.4).
2.6.1.1 Preparation of the resin for column studies
Prior to anion exchange experiments, resins need to be pre-equilibrated. This is
completed by combing up to 1 gram of material with 10 mL of 0.01 M HNO3 for 24
hours in a centrifuge tube on an orbital shaker. The aqueous phase is removed and an
equivalent volume of DI H2O is placed in contact with the resin as a rinse then repeated
to remove excess nitrate. Following the rinse, the resin is appropriate for use. This
treatment was completed on all anion exchange resins prior use.

38
Figure 2.4. Experimental set-up used for separation by anionic exchange resin (A) feed
solution 100 g/L U and 133 mg/L Tc, 150 mL and 0.01M HNO3, B) by a peristaltic pump
flow rate, 4 mL per minute C) column containing the anion exchange resin.
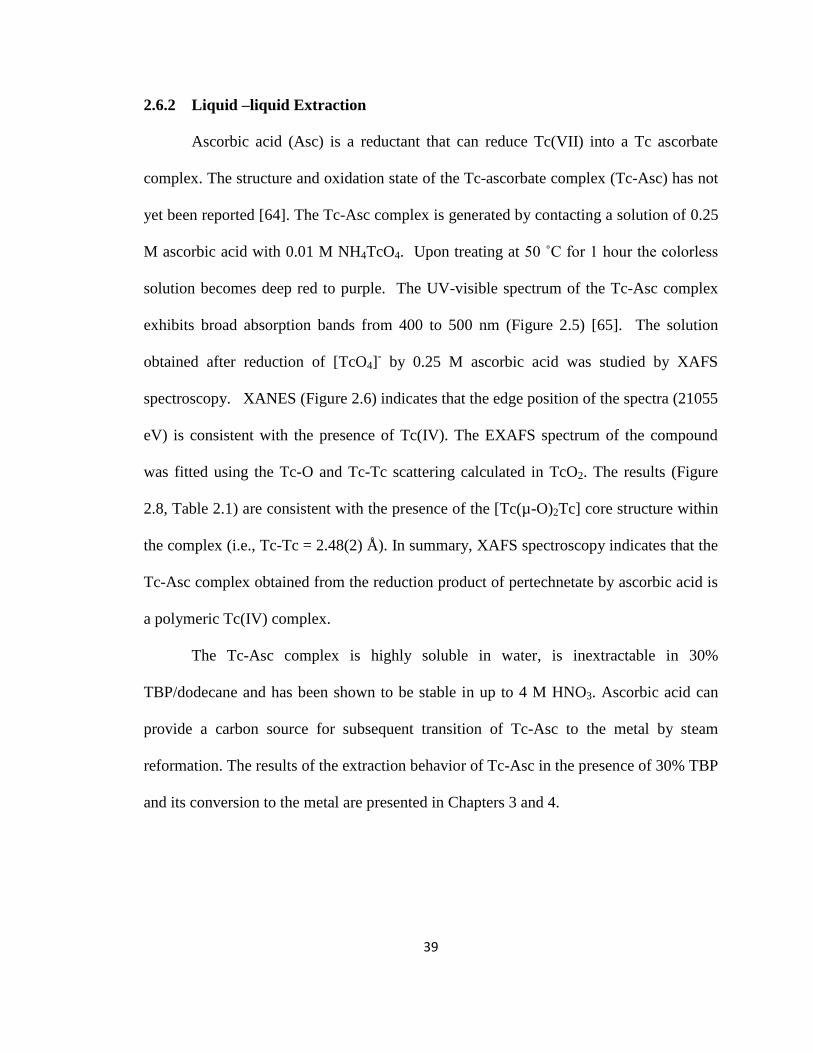
39
2.6.2 Liquid –liquid Extraction
Ascorbic acid (Asc) is a reductant that can reduce Tc(VII) into a Tc ascorbate
complex. The structure and oxidation state of the Tc-ascorbate complex (Tc-Asc) has not
yet been reported [64]. The Tc-Asc complex is generated by contacting a solution of 0.25
M ascorbic acid with 0.01 M NH4TcO4. Upon treating at 50 ˚C for 1 hour the colorless
solution becomes deep red to purple. The UV-visible spectrum of the Tc-Asc complex
exhibits broad absorption bands from 400 to 500 nm (Figure 2.5) [65]. The solution
obtained after reduction of [TcO4]- by 0.25 M ascorbic acid was studied by XAFS
spectroscopy. XANES (Figure 2.6) indicates that the edge position of the spectra (21055
eV) is consistent with the presence of Tc(IV). The EXAFS spectrum of the compound
was fitted using the Tc-O and Tc-Tc scattering calculated in TcO2. The results (Figure
2.8, Table 2.1) are consistent with the presence of the [Tc(µ-O)2Tc] core structure within
the complex (i.e., Tc-Tc = 2.48(2) Å). In summary, XAFS spectroscopy indicates that the
Tc-Asc complex obtained from the reduction product of pertechnetate by ascorbic acid is
a polymeric Tc(IV) complex.
The Tc-Asc complex is highly soluble in water, is inextractable in 30%
TBP/dodecane and has been shown to be stable in up to 4 M HNO3. Ascorbic acid can
provide a carbon source for subsequent transition of Tc-Asc to the metal by steam
reformation. The results of the extraction behavior of Tc-Asc in the presence of 30% TBP
and its conversion to the metal are presented in Chapters 3 and 4.

40
.
Figure 2.5. UV-visible spectra of the Tc-Asc complex in 1M HNO3 (top) and in 1M
NH4OH (bottom).

41
Figure 2.6. XANES spectra of the product obtained after reduction of pertechnetate with
ascorbic acid in DI H2O. [Tc = 0.01 M], [Asc = 0.25 M].
0
1.3
21 21.02 21.04 21.06 21.08 21.1 21.12
Energy (keV)
Ab
sorb
an
ce

42
Scattering C.N R (Å) χ2 (Å
2)
Tc-O 4.9 2.04(2) 0.006
Tc-Tc 0.8 2.48(2) 0.004
Table 2.1. Structural parameters obtained by adjustment of the k3 -EXAFS spectra of the
product obtained after reduction of pertechnetate with ascorbic acid. [Tc = 0.01 M], [Asc
= 0.25 M], Adjustment between k = [3.5 - 12] Å-1
. ∆E0 = 10 eV. S02 =0.9.

43
Figure 2.7. Experimental k3- EXAFS spectra (top) and Fourier transform of k
3- EXAFS
spectra (bottom) of the product obtained after reduction of pertechnetate with ascorbic
acid. [Tc=0.01 M], [Asc = 0.25 M]. Adjustment between k = [3.5 - 12] Å-1
. Experimental
(black solid lines) and Experimental fit (dashed lines).
-12
0
12
3.5 5.5 7.5 9.5 11.5
k [Å-1
]
k3.c
(k)
0
0.08
0 1 2 3 4 5
R + (Å)
FT
Mag.

44
2.6.3 Thermal treatment by steam reforming
Steam reforming is a commonly used as a method to produce in-situ hydrogen
(H2) and carbon monoxide (CO) by the steel and oil and gas industry [66]. The gas (i.e.,
CO, CO2, and H2) is produced after combustion of carbon containing compounds (coke,
methane, ethanol, charcoal, etc.) treated on super-heated steam. This technique was used
in Chapter 3 for the conversion of Tc oxides and pertechnetate salts to the metal.
In the experimental set-up (Figure 2.8), hydrogen is produced by bubbling dry Ar
through a water trap whereupon a saturated vapor containing H2O(g) and Ar is generated
and passed over a source of carbon at elevated temperature. Further down-stream the Tc
compound is allowed to contact the gaseous stream H2(g), CO(g), CO2(g), Ar whereupon
the metal is formed. Treatment of NH4TcO4 with dry Ar/H2 produces Tc metal particles
in size from 25 micron to 100 micron (Figure 2.9) while treatment of NH4TcO4 by steam
reforming (800 °C) yields particle sizes above the 100 micron range (Figure 2.9). Powder
XRD measurements indicate that the metal produce by steam reforming exhibits the Tc
hexagonal crystallographic structure.

45
Figure 2.8. Experimental set up used for steam reforming of Tc compounds.

46
Figure 2.9. Left: Tc metal obtained after thermal treatment at 700 °C for 4 hours under
dry Ar/H2 . Right: Tc metal obtained after steam reforming of NH4TcO4 at 800 °C for 4
hours.

47
2.6.4 Construction of an electrode
The construction of Tc metallic electrodes used to study the behavior of Tc metal
and Tc alloys (Chapter 5) are described. A Tc metallic phase is initially prepared then
embedded in resin epoxy and mounted to a wire with a non-conducting sleeve or is
directly incorporated into a Teflon cylinder. The steps involved in the preparation of
electrodes are presented.
Step 1. Preparation of the Tc metal phase.
Cylindrical pellets (Figure 2.10.A) of the desired metallic phase are made by
pressing a prepared metallic powder in a die using a hydraulic press operated by hand.
The diameter and the mass of the pellets range from 3 mm (20 to 100 mg), 5 mm (100 to
500 mg,) to 13 mm (>500 mg). Pellets that contain metals with high melting points (i.e.,
Tc, Ru, Re) are arc melted (Figure 2.10.B and 2.10.C). After arc-melting, pellets are
annealed in a furnace under Ar atmosphere for a desired period of time over a range of
temperatures to influence phase formation. Pellets that contain metals with low melting
point metals (i.e., stainless steel, Cr) can be melted in a tube furnace after treatment at
high temperature (Tmax = 1750 °C) under inert atmosphere.

48
Figure 2.10. Pressed pellet (A), arc-melting of pellet (B), and resulting bead (C).

49
Step 2 – Sectioning of prepared sample. Following annealing, the resulting material is
sectioned with a diamond blade (Figure 2.11.A). The initial sectioning produces a thin
cylinder (Figure 2.11.B) which is further sectioned to generate thin pins (Figure 2.14.C).
The resulting pins are then embedded in resin/epoxy housed electrodes.

50
Figure 2.11. A) Cylinder obtained after sectioning the arc-melted pellet. B) Square
material (red lines) obtained after sectioning the cylinder. C) Two pins obtained after
sectioning the square material.

51
Figure 2.12. Pins mounted into a non conducting wire with protective sleeve

52
Step 3 – Mounting the electrode. The pin obtained after sectioning the arc melted
pellets is electrically contacted to a wire using silver solder (Figure 2.12.A). After
soldering, the conductivity between the pin and the wire system is verified using an Ohm-
meter. The pin connected to the wire is placed in a 2 mL vial and filled with epoxy/resin
(Figure 2.12.B). After the resin has hardened, the electrode is polished and is suitable for
corrosion experiments. If the samples obtained after arc melting are small (mass ~100
mg), the materials can be directly mounted without sectioning to the wire after contact
with silver epoxy resin. This resin will mechanically maintain the sample while providing
an electrical contact between the wire and sample. The metallic phase-wire system is then
inserted in a Teflon cylinder (Figure 2.13).

53
Figure 2.13. Tc metallic bead mounted in a small Teflon cylinder.

54
2.6.5 Electrochemical set-up
The experimental setup used in these studies is constituted by 3 electrodes, an
electrochemical cell and a potentiostat controlled by a computer (Figure 2.14). In this
setup, the potential is measured between the reference (RE) and working electrode (WE)
while the current is measured between the counter (CE) and working electrode. The
reference electrode used was a double junction saturated KCl, Ag/AgCl (Thermo, E =
+0.203 V vs. NHE) with alumina frit and the CE is a foil of platinum metal (1 cm2) with
a minimum surface area larger than the WE. In solution, the CE and WE electrodes are
separated by 1 cm.

55
Figure 2.14. A) Potentiostat controlled by a computer; B) electrochemical cell, C)
reference electrode (RE), Pt foil counter electrode (CE) and Tc metal working electrode
(WE).

56
The electrochemical cell (V = 10 to 50 mL) is equipped with a gas inlet for
atmosphere control. The electrodes are connected to a computer controlled (Dell,
Windows XP) potentiostat (Biologic SP-210, EC-Labs V9.99). The potentiostat allows
various electrochemical techniques to be used for corrosion testing and long-term
monitoring (Chapter 5). The electrochemical techniques used in this study are open
circuit potential, various polarization measurements (Tafel plot) and bulk electrolysis.
2.6.5.1 Experimental procedure for corrosion studies
Polarization measurements evaluate material instantaneous corrosion rates.
Polarization experiments have three steps.
Step-1 Preparation of the electrode.
The surface of the working electrode is polished in the following order:
1) Grinding to expose a rough finish of the material tested
2) Polishing the surface with 9, 3 then 1 micron alumina grit for approximately 30
seconds or until a mirror finish is achieved.
3) Rinsing of the electrode with 18 MΩ·cm DI H2O to remove trace alumina followed
with methanol. After polishing, the electrode surface area is measured using an optical
microscope and placed in solution for polarization.
Step-2. Polarization of the electrode in solution.
Prior to polarization measurements, OCP measurements are performed over a 4
hour period. During this time, the potential is recorded every 5 to 60 seconds. Following
the OCP measurement the corrosion potential value is recorded and the working electrode
is polarized cathodically with respect to this value by -30 mV then is swept anodically

57
from ECORR by +300 mV. Data are associated with the variation of potential as function
of time and the variation of current as function of potential.
Step-3 Interpretation of data.
After polarization, the Tafel plot is determined by converting the value I from
Amperes (A) to log[I] plotted against potential (E, in Volts versus Ag/AgCl). From the
Tafel plot, the corrosion current (ICORR) in Amperes (A) is provided by the potentiostat.
The current is divided by the surface area of the electrode and reported as current density.
This value is compared against ECORR as determined from the OCP. From the linear
regression of the same Tafel plot βa and βc slopes are estimated and can be used in the
Stern Geary equation. The ICORR can be determined from this interpretation. These
constants can be used to estimate corrosion rate in millimeters per years. An example of
an experimental Tafel plot on a new stainless steel alloy containing Tc is presented
(Figure 2.15).

58
Figure 2.15. Tafel plot interpretation from anodic (red, A) and cathodic (black, DA)
polarization of a Tc stainless steel alloys in deaerated and non deaerated acidic brine
solutions after a 4 hour OCP measurement . Evaluated data: ECORR = 336.1 mV, ICORR:
=100 µA, ßc = 136.0 mV, ßa = 122.4 mV.

59
Chapter 3
Separation of Technetium from UraniumThis chapter summarizes the work on
the separation of Tc from U in 0.01 M nitric acid by anionic exchange, liquid-liquid
extraction, and precipitation methods. For anion exchange resins, loading capacity,
reusability, sorption/elution of [TcO4]- has been studied, followed by a UREX
demonstration of the U/Tc separation. For the liquid–liquid extraction, a new method
using ascorbic acid is developed. In this method, ascorbic acid is contacted with U and Tc
solutions, where U is extracted in the organic phase while Tc remains in the aqueous
phase. Finally, in the precipitation method section, the pertechnetate anion is precipitated
as insoluble salts using tetraphenylpyridium and hexaminecobalt cations. The structure
and properties of these pertechnetate salts are reported.
3.1 Anionic exchange resin methods
This section discusses sorption of Tc on anion exchange resins, elution of [TcO4]-,
the ammonium nitrate processing issues and demonstration of a full scale U/Tc
separation. At the end of this section, recommendations are made for effective separation
of U from Tc using anionic exchange resins. In subsection 1, the loading capacity of the
resin is studied. In subsection 2, the elution of Tc from anion exchange resins using 1 M
NH4OH, 1 M HNO3 and Sn/thiourea is studied. In sub-section 3, sucrose and triethanol
amine are used to denitrify the eluted Tc stream while recovering the eluent. In
subsection 4, a demonstration of the U/Tc separation on a 500 mL scale followed by the
degradation of ammonium nitrate is performed.
3.1.1 Sorption of [TcO4]- on Eichrom Aliquot 336 WBEC

60
This study examined the loading capacity of [TcO4]- on Eichrom WBEC resin
with 40% mass loading Aliquot 336 (see chapter 2). Two resins with 50 to100 microns
and 50 to 250 microns bead sizes were provided by Eichrom Technologies. The Tc
solutions used in this experiment were prepared by dissolution of ammonium
pertechnetate in DI H2O and monitored by LS counting.
Experimental
Each resin was pre-equilibrated with 0.01 M HNO3 for 24 hours in a centrifuge
tube placed on an orbital shaker. After pre-equilibrating, the resins were weighed,
collected, and placed into a pre-weighted cotton bag (Figure 3.1). After pre-equilibration,
the cotton bags that contained the resin were rinsed and placed in contact with an aqueous
solution of pertechnetate (20 mL). The Tc concentration was determined by LS counting
from 10 µL samples collected at various times (0, 1, 2, 3, 5, 7, 10, 15, 20, 30, 40, 50, 60,
130, and 710 minutes). For the experiment using the larger bead resin, the pertechnetate
solution contained 12.7 mg Tc as the metal while 11.2 mg was used for the small resin
study.
Results
The Tc concentration in solution as a function of time (Figure 3.1) indicates that
the rate of sorption of Tc by the two resins are similar (i.e., ~ 3 mg/minutes). Both resins
sorb Tc at similar rates when tested on a dynamic column. This indicates that pore size
considerations should not be the only criteria in determining what type of resin to use in a
scale-up experiment. The loading capacity of each resin determined at 710 minutes were
found to be 218.5 mg of Tc per gram of resin for the larger resins (50 to 250 µm) and
186.1 mg of Tc per gram of resin for the smaller resins (50 to 100 µm) (Table 3.1).

61
Sample Resin Mass (g) Cotton Mass(g) Capacity (mg Tc/g resin)
Large Resin (50 - 250 µm) 0.0502 0.5253 218.5Small Resin (50 - 100 µm) 0.0481 0.5253 186.1Blank 0.0000 0.4499 1.9
Table 3.1. Loading capacity of Tc, as the element, on Eichrom WBEC anion exchange
resins.

62
Figure 3.1. Left: View of the cotton bag used for the static experiment. Right: Loading
capacity curve of Eichrom WBEC resins and experimental setup. Large resin capacity
curve in black and small resin is presented in red.

63
Following loading capacity studies, the question of durability was raised in regard
to the long-term reuse of these resins for multiple U/Tc separations. Because resins are
subjected to very acidic or basic conditions, in pre-treatment or during stripping/elution
processes, the reuse of these resins was evaluated.
3.1.2 Elution of Tc from the resin
Requirement for the anionic exchange resin method is that the eluent should be
able to be recycled to some degree and the eluted Tc should be able to be recovered in
solid form suitable for conversion to the metal prior to incorporation into a metal waste
form. In this study, ammonium hydroxide, nitric acid and SnCl2/thiourea in 0.01 M HCl
were examined.
3.1.2.1. Elution with 1 M NH4OH
In the reusability study, ammonium hydroxide (1 M NH4OH) is used as the eluent
for Tc. Its elution properties are further compared to HNO3 and SnCl2/Thiourea in 0.01
M HCl. Ammonium hydroxide is a hard base that has been shown to competitively
exchange both nitrate and pertechnetate from Eichrom WBEC exchange resins and was
used in the CETE demonstration (Chapter 3) to elute pertechnetate from an anion
exchange resin Reillex HP/Q. When NH4OH is used as the eluent, the elution of [TcO4]-
is accompanied by significant quantities of nitrate. A solid product after drying the Tc
stream would contain excess ammonium nitrate in addition to ammonium pertechnetate.
Experimental
A 5 cm length and 1 cm diameter column was loaded with 1.00 g of Eichrom
WBEC small bead resin and pre-equilibrated with 50 mL of 2 M HNO3. A total of 10
runs were completed. Four of the runs (1, 4, 7, and the 10th
elution) were performed

64
using UREX solutions (150 mL, [HNO3] = 0.01 M, [Tc] = 1.34E-3 M, [U] = 0.42 M).
Runs 2, 3, 5, 6, 8, and 9 passed only DI H2O, nitric acid, and 1 M NH4OH through the
column without loading new Tc or contacting U on the resin.
The Tc was eluted using 150 mL of 1 M NH4OH then rinsed with 50 mL of DI
H2O. After rinsing, the cycle was repeated. A 50 mL sample of 2 M HNO3 was pumped
through the column followed by 50 mL of DI H2O then 150 mL of 1 M NH4OH. Each re-
equilibration, rinsing, and eluting phase was evaluated for the presence of Tc by
removing 10 µL of sample from the eluted product for LS counting. The flow rate of the
solutions through the column was 4 mL/minutes over a total test volume of
approximately 3500 mL. The test was completed in series without significant breaks in
time between runs with 875 minutes of continuous operation.
Results
The loading and eluting profiles on the WBEC Eichrom small bead resin for runs
1 through 4 are presented in Figure 3.2. Visually, the color of the resin changes from
yellow to white when treated with 1 M NH4OH then 2 M HNO3. This may indicate that
the properties of the resin change over time. For each run, the Tc recovery yield, Tc
breakthrough, Tc recovery after a determined bed-volume exchange, and Tc elution peak
broadening was determined. These results indicate that the breakthrough quantity of Tc
is nearly consistent throughout the runs, with the exception of elution peak #3.
Tc breakthroughs are 9.07%, 8.22%, 19.22%, and 7.80% for elution peak 1
through elution peak 4, respectively. After the initial elution peak 1, all Tc elutes from
the column using a minimum of 14 mL of 1 M NH4OH. Elution peak heights decrease
up to elution peak 3, whereas elution peak 4 showed similar peak height to peak 1, but

65
still remained broad throughout the tail end of the elution profile. The full-width-half-
maximum (FWHM) of the elution profiles are presented in Figure 3.3. Analysis of the
curve indicates that the real change in durability within ten column pass-through trials is
in the amount of ammonium hydroxide needed remove all Tc.
In summary, the small bead Eichrom WBEC anion exchange resins have a high
degree of reusability, are resistant to damage by continual contact with 1 M NH4OH and
remains selective for [TcO4]- after multiple trials. These resins have breakthrough values
of less than 10% for Tc which can be mitigated by increasing the amount of resin in the
column. This is shown later in the 500 mL UREX demonstration. An alternative method
to capture the loss of Tc can be achieved using a guard column.

66
Figure 3.2. Loading and elution profiles of UREX-type solutions (HNO3 = 0.01 M, Tc =
1.34E-3 M, U = 0.42 M) on small Bead Eichrom WBEC resins for runs 1, 4 and 10.
Elution of Tc, Flow Rate 4 ml/min, 1M NH4OH
Volume (ml)
238 240 242 244 246 248 250 252 254
log
(mg
Tc
) de
tec
tab
le
0.01
0.1
1
10
Activity Run #1
Activity Run #4
Activity Run #10

67
Figure 3.3. FWHM of the Eichrom U/Tc elution profile for elution peaks 1, 2, 3, and 4.

68
3.1.2.2 Elution with 1 M HNO3 – Static Experiment
Nitric acid is used to pre-equilibrate Eichrom WBEC and Reillex HP/Q resins
prior to sorption of pertechnetate. Nitric acid has been shown to competitively exchange
pertechnetate from Eichrom WBEC and Reillex HP resins. In this section, results
obtained using nitric acid as the eluent for Tc in static and dynamic experiments are
presented. For the dynamic column experiment, the loading and eluting profile of each
individual separation is presented and compared to ammonium hydroxide.
Experimental
Various concentrations of Tc were sorbed to Reillex HP/Q resins to determine the
total percentage removal of pertechnetate from the resin as a function of nitric acid
concentration. Six samples (100 mg each) of Reillex HP/Q anion exchange resins were
pre-equilibrated with 10 mL of 0.01 M HNO3 for 24 hours prior to use. After pre-
equilibration, the resin was rinsed with 10 mL of DI H2O then contacted with 10 mL of a
solution containing 1.90 x 10⁻⁴
M [TcO4]- for 24 hours. This solution was removed then
evaluated by LS counting. In each scenario LS counting determined that the free quantity
of Tc was below detection limits which resulted in a high removal of Tc from the
solution. This resin was then contacted with 10 mL of varying concentrations of nitric
acid and monitored over various periods of time up to 24 hours.
Results
The batch study results are presented in Table 3.2 and Figure 3.4. A maximum
elution of 67% of Tc is observed for 4 M HNO3. The loading capacity study with
Eichrom WBEC resins have a rate of uptake for pertechnetate which is very high
initially, but tails off as the capacity of the resin is approached. Upon contacting the

69
resin, nitrate begins to exchange with pertechnetate immediately. As acid concentrations
are increased, the nitrate competition increase as the same quantity of Tc competes with
more nitrate for the same number of sorption sites.

70
[HNO3] Tc Elution %
0.0 0%
0.5 12%
1.0 22%
2.0 40%
3.0 54%
4.0 67%
Table 3.2. Maximum elution percentage of Tc from Reillex HP/Q resins with HNO3
under batch conditions.

71
Figure 3.4 –Elution of [TcO4]- (%) as a function of HNO3 concentration on Reillex HP
anion exchange resins.

72
3.1.2.3 Dynamic column study
A dynamic column study was completed to evaluate the difference between the
elution behavior from the large bead Eichrom WBEC using 1 M HNO3 and 1 M NH4OH.
Experimental
A 5 cm x 1 cm column was loaded with 1 gram of resin pre-equilibrated with 2 M
HNO3 and a 50 mL DI H2O rinse before use. The column was connected to a peristaltic
pump at a flow rate of 4 mL/minute. The feed solution consisted of 150 mL of a solution
containing 1.34E-3 M Tc and 100 g/L U. After sorption, [TcO4]- was eluted with 1 M
NH4OH and 1 M HNO3. The break-through of Tc was determined and compared to the
one of the small bead Eichrom WBEC anion exchange resins.
Results
Figure 3.5 shows breakthrough quantity of Tc is similar for each resin, about 10
% of the Tc. The 1 M NH4OH was able to exchange Tc more competitively than 1 M
HNO3. The total volume required to elute all the Tc from the resin with 1 M NH4OH was
7.30 mL, whereas 17.45 mL was required with 1 M HNO3 (Table 3.3).

73
Figure 3.5. Elution profile of Tc from UREX-type solutions on large bead WBEC anion
exchange resins using 1 M NH4OH and 1 M HNO3.

74
Table 3.3. Results of the elution of pertechnetate from large bead WBEC anion exchange
resins using 1 M NH4OH and 1 M HNO3.
Eluent Resin Type Breakthrough % Breakthrough Elution Elution Vol (mL)
1M NH4OH Eichrom WBEC Large 10.30% 2.05 17.70 7.30
1M HNO3 Eichrom WBEC Large 10.70% 2.13 17.60 17.45
mg Tc Eluted

75
This study indicates that 1 M NH4OH is a more efficient eluent than 1 M HNO3.
The volume difference is approximately 10 mL. On scale up this would require less
material to complete the separation. Though nitric acid can be recovered by distillation,
the pertechnetic acid (HTcO4) formed is volatile. When heated distillation is completed
at temperatures above 90 ˚C, the recovery of HNO3/Tc eluent would be complicated due
to degradation of the nitrate anion to NOx species. It appears that neutralization of nitric
acid eluent with ammonium hydroxide would be necessary for recovery of Tc if other
techniques are not deemed suitable.
In summary, the use of ammonium hydroxide instead of nitric acid to elute Tc has
more advantages that will permit the minimization of the formation of ammonium nitrate
and the solution phase can be evaporated without volatilizing Tc.
3.1.2.4 Elution with SnCl2/Thiourea in 0.01 M HCl
Previous studies have shown that in the presence of Sn(II) and thiourea (tu),
pertechnetate is reduced to a cationic Tc(III) species, [Tc(tu)6]3+
. It is expected that the
reaction of [TcO4]- sorbed on resin and Sn/tu will produce [Tc(tu)6]
3+ thus Tc will be
eluted. Elution with SnCl2/thiourea in 0.01 M HCl will bypass the use of ammonium
hydroxide and nitric acid and the resulting stream would contain no ammonium salts that
can be problematic for processing on the back-end of Tc metal conversion. Thermal
treatment of the stream under hydrogen atmosphere may produce a Tc-tin alloy, but
controlling the composition would be difficult to achieve by this method.
Experimental
Pertechnetate (6.224 mg Tc, as metal) was sorbed on small bead Eichrom WBEC
resin pretreated for 24 hours with 0.01 M HNO3. Technetium was eluted with 0.01 M

76
HCl and excess SnCl2/Thiourea under gravity flow from a 5 cm x 1 cm column. A molar
ratio of 1:10 Tc to Sn and 1:10 thiourea was used to reduce Tc(VII) to Tc(III)-thiourea
complexes. The ability for Tc to be exchanged and recovered from this type of separation
was investigated. The results are presented below.
Results
A bright orange complex indicative of the formation of [Tc(III)(tu)6]3+
is observed
during the elution of Tc from the anion exchange resin. The eluted Tc product from
column exchange studies was collected and the activity in the resulting solution was
quantified by LS counting. The elution profile (Figure 3.6) indicates that nearly 14 to 32
times the amount of this eluent is required to remove an equivalent amount of Tc using
ammonium hydroxide or nitric acid using the same resin. Therefore, if this method to
elute Tc and form the complex is used to recover Tc from the resin, a significant quantity
of eluent would be required. This method is not recommended to recover Tc from anion
exchange resins. The conversion of the recovered product by steam reformation is
presented in Chapter 4.

77
0
0.2
0.4
0.6
0.8
1
0 50 100 150 200 250 300
mg
Tc
elu
ted
Total Volume (mL)
Figure 3.6. Elution profile of Tc on Eichrom WBEC anion exchange resins with SnCl2,
thiourea and 0.01 M HCl.

78
Resin Resin Mass Tc (g) Breakthrough % Elution % Lost %
Reichrom WBEC 1 6.244 1.50% 97.50% 1.00%
Table 3.4. Elution results of Tc(VII) elution with SnCl2 in the presence of thiourea and
0.01 M HCl.

79
3.1.3 Decomposition of ammonium nitrate
Due to its explosive nature, with decomposition occurring at 210 ˚C, the presence
of NH4NO3 in the Tc stream is expected to be problematic at high concentrations. After
elution of [TcO4]- with NH4OH, high quantities of ammonium nitrate can be found in the
elution stream. From the CETE demonstration significant quantities of ammonium nitrate
(1:152 g/g Tc:NH4NO3) may accompany the pertechnetate stream. Using HNO3 as an
eluent will require the neutralization of the stream with NH4OH to prevent volatilization
of Tc. Both processes will produce significant quantities of ammonium nitrate.
Precipitation was used to isolate the Tc recovered from the CETE demonstration by
isolating the pertechnetate from nitrate by precipitating the [TcO4]- as TBA[TcO4] using
excess TBA[OH].
In industrial scale separations, the precipitation method would generate large
quantities of TBA[TcO4]. Therefore, in effort to bypass the precicpiration step while
destroying ammonium nitrate by treating the eluted stream during conversion to the metal
has been considered. One method is the thermal decomposition of ammonium nitrate in
the presence of an organic substrate. Two organic compounds were considered: sucrose
(C12H22O11) and triethanol amine (NH15C6O3). The decomposition of ammonium nitrate
with an organic would ideally produce H2O, CO2 and N2 gas. The degradation process of
ammonium nitrate by sucrose is proposed in equation 14:
22211221234 24591224 NOHCOOHCNONH (14)

80
3.1.3.1 – Degradation of ammonium nitrate in the presence of sucrose
Experimental
A NH4NO3 sucrose molar ratio of 17:1 was examined. This ratio represents
significant excess total carbon from sucrose required for this reaction to approach
completion while simultaneously leaving a Tc reducing carbon source capable of being
steam reformed. A 500 µL sample containing sucrose and ammonium nitrate (320 mg
NH4NO3 per mL) were injected into glass scintillation vials and heated to 350 ˚C for up
to 5 minutes. After completion the total amount of nitrate was evaluated by density and
Ion Chromatography (IC). Each vial that generated removable carbon residue was
leached with DI H2O prior to evaluating total concentration of soluble ions. From the
leach, an aliquot was removed and passed through a 0.45 micron filter. The total amount
of nitrate and sucrose remaining in the solid was evaluated from the leach (Figure 3.7).
Density and IC measurements were first evaluated on the stock ammonium nitrate to
quantify the level of hydration on the material prior to degradation. The amount of water
was quantitatively determined to be hydrated at a mass ratio of 85 wt% NH4NO3 to 15
wt% H2O. The density method was also employed on solutions after thermal degradation.
Nitrate concentrations at trace levels were correlated and evaluated by IC using 1000
ppm nitrate standards (Scientific Analytical Solutions) generated by serial dilution to
generate the calibration standard.
Results
Soluble forms of sucrose and nitrate were found to exist at reaction times of less
than 3 minutes. For reaction time of 3 minutes or lower, these solids products were
present as caramelized sugars (soluble) while for reaction times of 4 minutes (or greater)

81
the solids products were present as an insoluble powder (carbon) (Figure 3.8). Sucrose
can be used to remove ammonium nitrate after 5 minutes at 350 °C which leaves a
recoverable carbon residue suitable for steam reformation.

82
Figure 3.7. Calibration curve of a solution containing sucrose, nitrate, or both as mass
excess from the test solutions.

83
Figure 3.8. Top: Representation of ammonium nitrate degradation (%) as a function of
the reaction time (A = 20 seconds, B = 3 minutes, C = 4 minutes, D = 5 minutes) in the
presence of sucrose at 350 °C. Bottom: resulting solutions, diluted to 10 mL after contact
in the glass scintillation vial.

84
For removing ammonium nitrate from a solid sample containing mixed samples
of NH4NO3 and NH4TcO4, the solid would be dissolved in a water/sucrose solution, the
solution placed in a quartz boat and thermally treated. The degradation should be
completed at a lower temperature prior to metal-oxide conversion. To mitigate this,
evaporation of the solution phase should occur slowly at 90 to 100 °C, and then slowly
ramped to 210 °C. If the carbon form that is degraded is not appropriate then slowly
exceed 210 °C until carbonization is complete. Nevertheless, the recovery of Tc metal
using sucrose is hindered for the following reasons:
Temperatures in excess of 350 ˚C are required to efficiently drive sucrose
degradation to a manageable carbon form.
After reaction, the volume of the sucrose solid product is larger than its
initial volume. An expansion of nearly 40x its initial volume has been observed.
Losses of metal ions due to this expansion can be expected under some conditions
when the carbon is removed during steam reformation.
The use of sucrose in the eluent stream may also be problematic as it can
clog columns during and after operation. In this context, the sucrose will need to
be added to the concentrated Tc solution after the separation has been completed.
Due to the uncontrolled expansion of sucrose using triethanol amine as the carbon
source was investigated.
3.1.3.2 Degradation of NH4NO3 with triethanol amine
Triethanol amine was selected for a similar study on the denitrification of
solutions containing ammonium nitrate. Initial studies have shown that when triethanol
amine thermally degrades its volume does not expand like sucrose. An experimental

85
setup similar to the sucrose experiment was used. The solution for this experiment
contained ammonium hydroxide, ammonium perrhenate and ammonium nitrate. The
ability to recover Re from the study was evaluated while removing nitrate on the front
end of the experiment.
Experimental
A 150 mL solution containing 1 M NH4OH, excess (10:1 NO3-:Re) NH4NO3, and 133
mg/L Re, and a 10:1 molar excess triethanol amine to ammonium nitrate, was placed in a
250 mL round bottom flask equipped with a condenser. The solution was distilled at a
constant temperature (98 to 100 °C) until all of the water in the first vessel was removed.
Following distillation, the temperature rapidly increased to 250 °C, which is above
NH4NO3 decomposition temperature (210 °C). After the experiment, two separated
phases were recovered:
1. The distillate which contained water, ammonium hydroxide and any other carry
over products which could have been distilled such as ammonium nitrate and
volatile Re.
2. The solid component which contained trace water, the degraded product of
triethanol amine, non-volatilized Re, and potentially remaining ammonium
nitrate.
Results
After completion of the experiment, the pH of the distillate indicated that
ammonium hydroxide was present in the recovered solution at 0.25 M as determined by
titration with 0.1 M HNO3. Analysis of the distillate showed the absence of [ReO4]- and
[NO3]- in solution.

86
The 500 mg solid (Figure 3.9) phase was ground, contacted with DI H2O (5 mL)
and the resulting solution filtered through a 0.45 micron filter. The filtered solution was
analyzed by IC and results indicated that the quantity of nitrate remaining was within the
signal background. The carbon residue containing a majority of the Re was placed in a
quartz boat and converted to Re metal by steam reformation at 700 °C for several hours.
Recovery of Re metal was quantitative (>99%) from the test sample.

87
Figure 3.9. Solid obtained after distillation of the [ReO4]- solution containing 1 M
NH4OH and triethanol amine under air at 250 °C after 30 minutes of treatment.

88
In summary, a solution containing ammonium nitrate, ammonium hydroxide and
Re can be denitrified by thermal treatment in the presence of triethanolamine at 250 °C.
The ammonium hydroxide can be removed with no measured loss of the metal.
3.1.4 Demonstration of the Uranium/Technetium separation
Experimental
A 500 mL UREX solution comprised of 0.01 M HNO3, 66.7 mg Tc as the metal
(ammonium pertechnetate), 50 g U as the metal (uranyl nitrate hexahydrate) was used.
The Tc separation was achieved using a 10 cm column loaded with 10.0038 g of the
small Eichrom WBEC anion exchange resin which was pre-equilibrated in 100 mL of
0.01 M HNO3 for 24 hours prior to use. The UREX solution was fed at 4 mL/minute
through the anion exchange resin using a peristaltic pump. The primary elution solution
was 150 mL of 1 M NH4OH. The Tc recovered for thermal conversion was combined
with excess triethanol amine and the results of the treatment are presented in subsequent
sections.
Results
After separation, no Tc was observed by LS counting in the U stream. The U
stream was treated with concentrated ammonium hydroxide until the solution exceeded
pH 10 and a yellow U solid precipitated. The resulting solid was filtered and washed
with DI H2O prior to being dried overnight for 24 hours at 150 °C in a glass dish covered
with aluminum foil. The recovered crystalline solid containing U was then transferred to
a large alumina crucible and heated under normal atmosphere at 1100 °C for 24 hours to
produce U3O8. The total U recovered was evaluated by mass, demonstrating a yield of

89
98.8 % of U. Losses of material were found in the alumina crucible during thermal
treatment.
The Tc stream was collected from the column elution and combined. All of the Tc
on the column was eluted within the first 15 mL. Concentrations of Tc were quantified by
LS counting and compared against standards of Tc in water and ammonium hydroxide.
With a resin mass of 10.0038g and a loading of Aliquot 336 onto the backbone at 40
wt%, assuming the lowest molecular weight of the amine to be 353 g/mol,
(N[(CH2)7CH3]3), 66.7 mg of Tc, as the metal, is equivalent to 0.6 mmol of metal ion.
The excess sites not exchanged for Tc is equivalent to approximately 10.7 x 10⁻³
mol
NO3-. This valued was used to represent the excess quantity of nitrate in the solution that
was eluted with Tc.
After elution, the solution of pertechnetate was combined with 1.6 g of triethanol
amine. This was directly added to the solution containing the eluted Tc with 1 M
NH4OH. The solution containing triethanol amine, NH4OH, [TcO4]-, and [NO3]
- was
evaporated to approximately 3 mL, placed in a quartz boat then segregated for conversion
to Tc metal by steam reformation in a tube furnace. Details on the synthesis and
characterization of Tc metal recovered from this process are presented in Chapter 3.

90
Figure 3.10. Loading, washing and eluting profile of [TcO4]- with 1 M NH4OH on small
bead Eichrom WBEC anion exchange resins.

91
3.1.5 Summary on anion exchange resins method
The Eichrom WBEC anion exchange resins have been shown to selectively
separate Tc from U in solutions using a feed rate of 4 mL/min in a column with a 1 cm
diameter with little to no observable breakthrough of Tc when excess resin is used. The
loading capacity of Tc for each resin has been evaluated and shown to be independent of
the bead-size. Though this has been observed in static tests, the gains in increasing resin
size were not observed in an active dynamic column. Elution studies have shown that
ammonium hydroxide, nitric acid, and Sn(II)/thiourea elute Tc from the resin.
Ammonium hydroxide elutes Tc with the greatest efficiency while simultaneously
leaving the resin in a physical state suitable for multiple reuses. When NH4OH is used as
an eluent, the problematic ammonium nitrate accompanies the elution of Tc. In order to
remove NH4NO3 from the eluting steam triethanol amine has been successfully used.
Triethanol amine was shown to destroy nitrate in a controlled manner at 250 °C while
allowing the recovery of ammonium hydroxide for reuse without causing significant loss
of Re and Tc in separation trials.
3.2 Liquid-liquid extraction methods
The neutral and polymeric nature of the Tc-Asc complex makes it less extractable
in TBP than the pertechnetate anion. The Tc-Asc extraction behavior in TBP/HNO3 and
its formation in HCl were previously reported [67,68]. Ascorbic acid can potentially be
used for the separation of U from Tc in liquid-liquid extraction systems. The following
section describes the liquid extraction behavior of Tc and U from nitric acid/ ascorbic

92
acid solutions in contact with 30% TBP/dodecane. It is composed of the following
subsections:
1) The individual extraction of Tc and U from a nitric acid (0.01 M)/ascorbic acid
(0 to 1.5 M) solution series into TBP/dodecane,
2) The individual extraction of Tc and U from a nitric acid (0.01 M – 4.33
M)/ascorbic acid (0.25 M) solution series into TBP/dodecane and finally
3) The extraction behavior of U and Tc under UREX conditions in the presence of
pseudo-optimized conditions.
3.2.1 Individual Extractions
The extraction of U and Tc into 30% TBP/dodecane from nitric acid (0.01 to 6.00
M) and D,L-ascorbic acid (0 to 1.68 M) solutions were examined. Solutions were
prepared which contained only uranyl nitrate, ammonium pertechnetate, or a combination
of both species. The effect of concentration of both acids on the extraction behavior of U
and Tc were investigated and distribution coefficients were estimated. Distribution
coefficient is defined as the ratio of the concentration of one species in the organic phase
relative to the concentration of the same species in the aqueous phase. The equation used
to determine distribution coefficients is provided in equation 15:
(15)
Solutions were vortexed for 30 seconds, contained 1 mL of the aqueous phase in
which each were contacted with equal volume organic solution, and phase separation was
induced by centrifugation at 2500 rpm for 15 seconds. Following extraction, phases were

93
immediately separated. The concentration of each species was determined by LS
counting.
3.2.1.1 - Influence of Ascorbic Acid concentration in 0.01 M HNO3
Extraction of Tc
The extraction of the Tc ascorbate complex decreases with increasing ascorbic
acid concentration due to complete reduction and stabilization of an inextractble Tc(IV)-
Asc complex. This suggests that in 0.01 M nitric acid, some degree of separation of U
from Tc could be achieved using ascorbic acid.

94
Table 3.5. Extraction solution conditions of ammonium pertechnetate in the presence of
various concentrations of ascorbic acid. Estimated distribution value (D) for the
individual separations. Error associated with the measurements are less than 1%.
Vol (mL) [Asc] molar [HNO3] [U] molar [Tc] molar D-value
1 0.25 0.01 0 1.34E-03 0.048
1 0.5 0.01 0 1.34E-03 0.056
1 0.75 0.01 0 1.34E-03 0.028
1 1 0.01 0 1.34E-03 0.027

95
Extraction of U
Though ascorbic acid is a complexing reducing acid, the reduction or
complexation of U(VI) into an inextractable form into TBP has not been observed. In
fact, the extraction of U(VI) in 30% TBP/dodecane slightly increases with the ascorbic
acid concentration in the aqueous media. Though this effect is observed in the system
studied, unfortunately, at 0.01 M nitric acid, the solubility limit of ascorbic acid in
solution is exceeded. Limits on the concentration of ascorbic acid in the extraction
should t be 0.84 M.

96
Table 3.6. Extraction solution conditions of uranyl nitrate in the presence of various
concentrations of ascorbic acid. Distribution coefficient (D) is also reported. Error
associated with the measurements are less than 1%.
Vol (mL) [Asc] molar [HNO3] [U] molar [Tc] molar D-value
1 0.42 0.01 0.42 0 0.484
1 0.84 0.01 0.42 0 0.445
1 1.26 0.01 0.42 0 0.656
1 1.68 0.01 0.42 0 0.718

97
3.2.1.2 Influence of nitric acid concentration in 0.25 M ascorbic acid
Extraction of Technetium
In an effort to examine the extraction behavior of the Tc-Asc complex in the
presence of increasing concentrations of nitric acid, [TcO4]- was placed in contact with
solutions of 0.25 M ascorbic acid and acidified with various concentrations of nitric acid
(Table 3.7). This concentration of ascorbic acid was chosen to mitigate solubility limits
previously observed while still providing significant excess of the reductant/complexant
required to suppress Tc extraction at low acid levels.

98
Table 3.7. Conditions and estimated distribution ratio of Tc in the presence of ascorbic
acid (0.25M) and various concentrations of nitric acid.
[Tc] [HNO3] [Asc] D-Value SF Estimated U/Tc
1.34E-03 0 0.25 0.0002 1399.5
1.34E-03 0.940 0.25 0.6558 5.1
1.34E-03 1.773 0.25 0.5690 6.3
1.34E-03 2.516 0.25 0.3440 11.0
1.34E-03 3.184 0.25 0.2455 16.1
1.34E-03 3.786 0.25 0.2069 18.2
1.34E-03 4.333 0.25 0.1815 20.3

99
In solutions containing no nitric acid, the Tc complex is very stable and little to no
detectable Tc is extracted into the organic phase while [UO2]2+
does not readily extract in
low concentrations of nitric acid even in excess ascorbic acid. Therefore the extraction of
[UO2]2+
in the presence of 0.25 M ascorbic acid was evaluated over a wider range of
nitric acid concentrations (Table 3.8).

100
Table 3.8. Conditions and estimated distribution ratio of U in the presence of ascorbic
acid (0.25 M) and various concentrations of nitric acid.
[U] [HNO3] [Asc] D-Value
0.42 0.01 0.25 0.4000
0.42 0.250 0.25 0.9000
0.42 0.500 0.25 1.9000
0.42 0.750 0.25 2.9000
0.42 1.000 0.25 3.4000
0.42 3.000 0.25 3.9000
0.42 6.000 0.25 3.4000

101
Extraction of Uranium
The extraction of [UO2]2+
follows the expected trends. At low concentrations of
HNO3, the species is not readily extracted into TBP/dodecane and has a distribution value
of less than one. At higher HNO3 concentrations the distribution value increases to a
maximum near 3 to 4 M HNO3 then slowly trails off in solutions containing more acid.
Separation factors (SF: DU/DTc) are presented (Table 3.7). The separation factor in
neutral solutions was determined by extrapolating the linear portion of the extraction
curve of [UO2]2+
(Figure 3.11) from 0.01 M to 1.00 M HNO3:
DU= 3.2272[HNO3] + 0.2799 (16)
Considering that in neutral solutions the distribution factor for uranyl nitrate will
be 0.2799 and that the extraction of Tc is suppressed, a large separation factor could be
achieved for the U/Tc separation using ascorbic acid.
3.2.1.3 Distribution factor for Uranium and Technetium in the UREX conditions
The distribution of U and Tc in the UREX conditions was examined. Without
ascorbic acid it is clear that significant quantities of Tc are extracted, along with
unknown quantity of U. The conditions of this initial test are presented in Table 3.9.

102
Table 3.9. Conditions and activity distribution of U and Tc into 30% TBP/dodecane. The
percent of the original activity in the mother solution was determined in the aqueous and
organic after the extraction. A majority of the activity present in the solution is derived
from Tc. Without the presence of ascorbic acid, significant quantities of Tc accompany
the extraction of U.
Vol (mL) [Asc] molar [HNO3] [U] molar [Tc] molar Act % Aq Act % Org
1 0 0.01 0.42 1.34E-03 88.6% 11.4%
1 0.25 0.01 0.42 1.34E-03 99.8% 0.2%
1 0.5 0.01 0.42 1.34E-03 99.9% 0.1%
1 0.75 0.01 0.42 1.34E-03 99.8% 0.2%
1 1 0.01 0.42 1.34E-03 99.8% 0.2%
1 1.5 0.01 0.42 1.34E-03 99.8% 0.2%

103
Figure 3.11. Distribution coefficient of U as a function of HNO3 concentration. Asc =
0.25 M

104
In summary, ascorbic acid has been shown to be a promising chemical
reductant/complexant that can be used for U/Tc separation. Further work needs to be
performed in order to validate this method.
3.3 Precipitation methods
There are approximately fifty pertechnetate salts known to date with formula
A[TcO4]n (A = alkali metal, transition metal, rare earth, tetraalkyammonium, n = 1 to 3).
Pertechnetate salts containing large cations are insoluble in aqueous media [10]. These
large cations can be used to precipitate and separate Tc from U. The resulting
pertechnetate salts can also be used to immobilize Tc as temporary storage forms.
Previous works have shown that tetraalkylammonium cations precipitate pertechnetate
and can be used for Tc separations in the reprocessing of spent fuel [69].
This section is composed of three sub-sections. In the first subsection, the
precipitation of pertechnetate using the tetrabutylammonium cation ((C4H9)4N or
[TBA]+) is presented. In the second subsection, the synthesis, structure and properties of
a new highly insoluble salt 1,2,4,6-tetraphenylpyridinium pertechnetate (TPPy-TcO4) is
presented. In the last subsection, preparation, structure and properties of the new
[Co(NH3)6][TcO4]3 salt is reported.
3.3.1 Precipitation using the tetrabutylammonium cation.
The tetrabutylammonium cation was used to precipitate pertechnetate.
Experimental
In the CETE demonstration, the separation of U and Tc was performed using the
anionic exchange resin Reillex HP/Q resin and Tc was eluted with 1 M NH4OH. The
eluted solution containing [TcO4]- was taken to dryness.

105
Results and Characterization of the sample
The solid CETE sample (79.695 g), containing ammonium pertechnetate and
ammonium nitrate, was sent to UNLV to be converted to the metal. In order to determine
the total amount of Tc in the sample, a portion (5.5 mg) of the sample was diluted into 20
mL of 5% HNO3. This solution was analyzed by ICP-MS, IC and LS counting to quantify
the total concentration of U, Tc and NO3- present in the sample. Total amount of
ammonium nitrate in the CETE sample was determined to be 42.2694 µg/mL. This
indicated that ammonium nitrate represented ~ 99.20 % of the sample mass while
ammonium pertechnetate represented only ~ 0.8 %.
Based on the concentration of ammonium nitrate in the sample, an estimated
elution volume of 987 mL of 1 M NH4OH was used to remove Tc from the resin. With
typical UREX concentrations of Tc approaching 133 mg/L at an approximately fixed
ratio of 100 g/L U would mean that this demonstration resulted from the processing of
approximately 98.7 g U.
Precipitation of [TcO4]- with TBA
The remaining CETE sample (79.690 g) was dissolved into 250 mL of DI H2O
and tetratbutylammonium hydroxide (2 % excess relative to Tc) was added to the
solution. The resulting white precipitate was isolated by vacuum filtration. Analysis by
LS counting of the solution after precipitation indicates that 98% of Tc precipitated. The
filter paper that contained the TBA[TcO4] precipitate was allowed to dry under slow
flowing air for 24 hours. In order to convert TBA[TcO4] to Tc metal, the filter paper and
TBA[TcO4] was placed onto a quartz boat and treated at 750 oC for 8 hours under wet

106
flowing Ar. After the reaction a grey metallic solid was obtained. Further details on
preparation and characterization of the Tc metal are presented in Chapter 4.
3.3.2 Precipitation using the 1,2,4,6-Tetraphenyl pyridinium cation
The large 1,2,4,6-tetraphenylpyridinium cation (C29H22N, TPPy) had already been
used for the precipitation of perrhenate. The TPPy[ReO4] salt is insoluble in aqueous
media [70] with a KSP = 1.35 ∙ 10-10
. The Tc homologue has not been reported, but it is
expected that it will also have a very low solubility in aqueous media. In this context
investigation regarding the preparation, characterization, and solubility properties of the
TPPy[TcO4] salt are presented.
3.3.2.1 Preparation
The compound TPPy[TcO4] was prepared after precipitation of pertechnetate with
2% molar excess of the 1,2,4,6 tetraphenylpyridinium cation. Tetraphenylpyridinium
tetrafluoroborate (TPPy[BF4]) (100.3 mg, 0.251 mmol) was dissolved in 1 mL acetone
and placed in a 15 mL centrifuge tube. A 2 mL solution of ammonium pertechnetate
(44.5 mg, 0.246 mmol) in water was added to the TPPy[BF4] solution and a white solid
immediately precipitated. The precipitate was centrifuged for 5 minutes and the
supernatant removed. The precipitate was washed 3x with 5 mL of water followed by 3x
with 5 mL of diethyl ether and allowed to dry for 24 hours under air. The resulting
TPPy[TcO4] solid (93.9 mg, yield = 80.6 %) was characterized by diffraction techniques
and used for solubility experiments.
3.3.2.2 Structural Characterization
Crystals suitable for single crystal X-ray diffraction were grown in methanol for 3
days at -25 °C. The structure of the TPPy[TcO4] salts was solved by SC-XRD. The

107
compound TPPy-TcO4 (Figure 3.12) crystallizes in the orthorhombic space group (Pbca).
The cell parameter (a = 16.1242(10) (Å), b = 16.7923(10) (Å), c = 17.6229(11) (Å) is
larger than in any other pertechnetate salts [23]. Analysis of the structural parameters in
the pertechnetate anion shows a small disparity of the Tc=O bond distances (from
1.709(1) Å to 1.724(1) Å) in comparison to the one observed in the TBA[TcO4] salt (i.e.,
Tc=O varying from 1.58 Å and 1.706 Å [21]. Disparity of Tc=O distance in
pertechnetate salts has been discussed and is due to various effects such as the size of the
unit cell or polarizability of the cation. In this case, a large unit cell (4771.62 Å3)
combined with a low polarizability2 of the TPPy cation is likely to be the origin of the
small disparity of the Tc=O distances in TPPy-TcO4.
The pertechnetate anion is surrounded by three TPPy cations, the shorter
Tc=O····H distances (i.e.; 2.47, 2.50, 2.56 and 2.59 Å) are less than the sum of the Van
der Waals radius (2.60 Å) and indicates that [TcO4]- is involved in hydrogen bonding
with the cation [23]. Also, the shortest distance between the cations (C····H = 2.84 Å) is
slightly less than the Van der Waals radius (2.9 Å). This indicates that the TPPy cation is
involved in hydrogen bonding which ultimately forms a network in the crystal. Extensive
hydrogen bonding coupled to a low polarizability of the TPPy cation is likely to be
responsible for the low solubility of TPPy[TcO4].
3.3.2.3 Solubility of TPPy[TcO4] in aqueous media
The solubility of TPPy[TcO4] was determined in acidic (HNO3, pH = 2.22),
neutral (DI H2O, pH = 6.61) and basic (NaOH, pH = 9.81) aqueous solution. The samples
2 [Footnote: polarizability is defined as Z/R with Z charge and R radius of the cation; radius of TPPy 6.5 Å
was determined crystallographically]

108
were prepared in 20 mL glass LS counting vials after suspending 5 mg of TPPy[TcO4] in
15 mL of the solution. The experiment was performed over a period of 60 days. During
this time, aliquots (100 µL) were removed, filtered (0.45 um) and the quantity of Tc in
solution was determined by LS counting. The Tc concentrations (Figure 3.13) reached a
plateau after several days. This indicates that the system achieved its equilibrium
solubility from which the estimated KSP values were determined.
The KSP is related to the dissolution equilibrium of TPPy[TcO4] TPPy+ +
[TcO4]- is determined by KSP = [TPP
+]·[TcO4]
-. The solubility values (Table 3.10)
indicate TPPy[TcO4] to be the third most insoluble pertechnetate salts reported. The most
insoluble pertchnetate salts being [(C6H5)4As][TcO4] (Ksp = 1.2.10-11
). The solubility of
TPPy[TcO4] is slightly lower than the one of TPPy[ReO4] (KSP = 1.35 ∙ 10-10
).

109
Figure 3.12. Ball and stick representation of TPPy[TcO4], showing the pertechnetate
anion and the TPPy cation. Hydrogen atoms are omitted for clarity. Tc atoms (black),
oxygen atoms (red), C atoms (grey) and N atom (blue).

110
Figure 3.13. Concentration of [TcO4]- as a function of time obtained after suspension of
TPPy[TcO4] in solution at pH 2.22, 6.91 and 9.81.
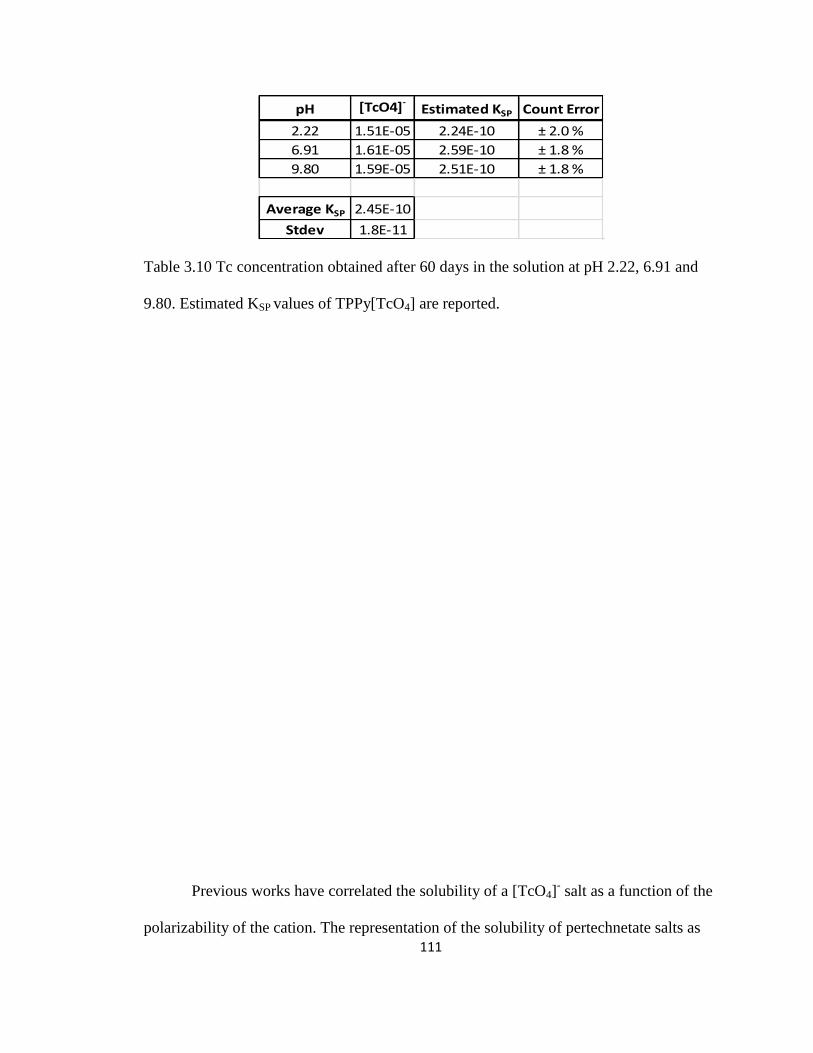
111
pH [TcO4]-Estimated KSP Count Error
2.22 1.51E-05 2.24E-10 ± 2.0 %
6.91 1.61E-05 2.59E-10 ± 1.8 %
9.80 1.59E-05 2.51E-10 ± 1.8 %
Average KSP 2.45E-10
Stdev 1.8E-11
Table 3.10 Tc concentration obtained after 60 days in the solution at pH 2.22, 6.91 and
9.80. Estimated KSP values of TPPy[TcO4] are reported.
Previous works have correlated the solubility of a [TcO4]- salt as a function of the
polarizability of the cation. The representation of the solubility of pertechnetate salts as

112
function of polarizability of the tetramethyl ammonium (TMA), tetraethyl ammonium
(TEA), tetrabutyl ammonium (TBA) and TPPy cations (Figure 3.14) shows a linear
correlation. This indicates that physio-chemical behavior of TPPy[TcO4] can be
correlated to the one of the tetraalkylammonium salts and that polarization could be used
as a parameter to predict solubility of other pyridinium pertechnetate salts.
3.3.2.4 Summary
The new TPPy[TcO4] salt has been synthesized by metathesis from NH4[TcO4]
and TPPy[BF4]. Analysis of the TPPy[TcO4] structure indicates that the pertechnetate
anion is not distorted as in in the tetralkylamonium salts, and shows the presence of
extensive hydrogen bonding in the solid. The polarizability of the TPPy cation is
responsible for the low solubility of this salt.
Due to its slight solubility, TPPy[TcO4] is not a suitable long term waste form.
However it may be a scavenger in environmental recovery of Tc. The TPPy cation can
also be used in separations requiring isolation of Tc from other ions in solution (i.e.,
[UO2]2+
) not precipitated by TPPy.

113
Figure 3.14. Variation of Log [TcO4]- as a function of the R/Z for the A[TcO4] salts, A=
TMA (tetramethyl), TEA (tetraethyl), TBA (tetrabutyl-ammonium) and TPPy. Values for
TMA, TBA and TEA are taken from literature [22].

114
3.3.3 Precipitation using the hexamine cobalt cation
In order to minimize the number of steps for waste form development, the eluted
[TcO4]- can be precipitated with a metal that is a constituent of the final product. The
resulting M[TcO4]n salts will be thermally decomposed into a binary alloys with the
elemental composition TcnM. The metal cation used for precipitation needs to form
insoluble pertechnetate salts, alloys with a relatively low melting point and resistant
against corrosion.
Analysis of literature indicates that amines of Cr, Co, Ni, and Ag meet these
criteria. Due to their relatively low polarizability, metal amine cations are compounds of
choice for precipitation of inorganic metal anions. They have already been used to
precipitate actinides for separation purposes and to recover Re from aqueous solution.
Perrhenate salts containing metal amine cations, (i.e., [M(NH3)6][ReO4]3 for M = Cr, Co,
[Ni(NH3)4][ReO4]2 and [Ag(NH3)2][ReO4] have been reported and are relatively
insoluble. Their Tc homologue has not been reported yet and it is expected that they will
exhibit similar properties [71]. The thermal decomposition of these Tc salts would lead
to binary alloys with the overall composition Tc3M (M = Cr,Co), Tc2Ni and TcAg. In this
context, the preparation, and properties of the new hexamine pertechnetate salt,
[Co(NH3)6][TcO4]3 are reported.
3.3.3.1 Preparation
Hexamine cobalt trichloride [Co(NH3)6]Cl3 (227.2 mg, 0.85 mmol) was dissolved
into DI H2O (10 mL). The hexamine cobalt solution was added to a 5 mL ammonium
pertechnetate solution (365.7 g, 2 mmol) in a centrifuge tube. An orange solid
immediately precipitated (Figure 3.15). The precipitate was centrifuged for 5 minutes and

115
the supernatant removed. The precipitate was washed 3x with 10 mL of warm water and
allowed to dry for 24 hours under air. The resulting solid, [Co(NH3)6][TcO4]3, (257.6 mg,
yield = 58.9 %) was characterized by diffraction techniques and used for solubility
experiments.
3.3.3.2 Structural Characterization
Crystals suitable for single crystal X-ray diffraction were grown from MeOH/H2O
(1:1) solution at -25 °C. The structure of [Co(NH3)6][TcO4]3 was solved by SC-XRD.
The compound crystallizes (Figure 3.16) in monoclinic space group P121/n (a=8.0266(3),
b = 12.6275(5), and c = 17.6438(7) Å). Its unit cell (V = 1787.83 Å3) is 2.6x smaller than
the one previously reported for the TPPy[TcO4] (V= 4771.62 Å3) salt.
Analysis of the structural parameters in the pertechnetate anion in
[Co(NH3)6][TcO4]3 shows a smaller disparity of the Tc=O bond distances (from 1.710(1)
Å to 1.721(1) Å) in comparison to the one observed in the TPPy[TcO4] salt (i.e., 1.709(1)
Å to 1.724(1) Å). However, the average Tc=O distance in the [Co(NH3)6][TcO4]3 salts
(i.e., 1.716[3]) is identical to the one in the TPPy[TcO4] (i.e., 1.717[3]). The
pertechnetate anion is surrounded by three [Co(NH3)6]3+
, the shorter Tc=O····H(N)
distances (i.e., 2.07 Å, 2.09 Å, 2.22 Å) are less than the sum of the Van der Waals radii
(2.60 Å) and indicates that [TcO4]- is involved in hydrogen bonding with the cation. The
shortest distance between the cations (N····H = 3.18 Å) is larger than the Van der Waals
radius (2.70 Å), thus indicating that [Co(NH3)6]3+
cation is not involved in hydrogen
bonding. Due to the absence of hydrogen bonding between the cation, it is expected that
the solubility of the [Co(NH3)6][TcO4]3 will be larger than the one of TPPy[TcO4] which
exhibits extensive hydrogen bonding between cations.

116
Figure 3.15. Solid obtained after precipitation of [TcO4]- with [Co(NH3)6]
3+.

117
Figure 3.16. Ball and stick representation of the [Co(NH3)6][TcO4]3 showing the
pertechnetate anion and the [Co(NH3)6]3+
cation. Hydrogen atoms are omitted for clarity.
Tc atoms (black), oxygen atoms (red), Co atoms (grey) and N atoms (blue).

118
3.3.3.3 Solubility of [Co(NH3)6][TcO4]3 in aqueous media
The solubility of [Co(NH3)6][TcO4]3 was studied in DI H2O at room temperature.
A 0.0989 g sample of [Co(NH3)6][TcO4]3 was suspended in 1 mL DI H2O in a glass
scintillation vial. After 24 hours, the Tc concentration was quantified by LS counting.
The solubility of the [Co(NH3)6][TcO4]3 in H2O is 6.15·10-4
M. As expected, the
solubility of [Co(NH3)6][TcO4]3 in H2O is greater than that of the TPPy[TcO4] salt, which
is1.6·10-5
M.
3.3.3.4 Summary
The new [Co(NH3)6][TcO4]3 salt has been synthesized by metathesis from
NH4[TcO4] and [Co(NH3)6]Cl3 and its structure characterized. Analysis of the structure
indicates that the pertechnetate anion exhibits hydrogen bonding with the [Co(NH3)6]3+
cation, while no hydrogen bonding occurs between the cations. As a result of this absence
of hydrogen bonding, the solubility of the [Co(NH3)6][TcO4]3 in water is higher than the
TPPy[TcO4] salt. Due to its solubility, [Co(NH3)6][TcO4]3 may not have uses as a waste
form, but is thermal decomposition should lead to formation of Tc-Co alloys. The
thermal decomposition of the [Co(NH3)6][TcO4]3 salt is presented in Chapter 5.
3.4 Recommendation on Separation Techniques
Anion exchange chromatography has shown that Tc can be efficiently separated
from U and eluted as pertechnetate. The pertechnetate steam is free of U but contains the
byproduct ammonium nitrate. Treatment of the resulting stream with triethanolamine
effects the removal of the problematic ammonium nitrate at relatively low temperatures
under controlled rates. A larger scale demonstration of the process in the UREX
conditions was performed and was shown to successfully validate the method.

119
The newly developed liquid–liquid separation method using ascorbic acid would
have the advantage to bypass the anion exchange step directly after fuel dissolution.
Initial results show that ascorbic acid suppresses the extraction of Tc while it has
minimum effect on the extraction of U. More studies are needed to validate the
efficiency of this method.
Two new pertechnetate salts [Co(NH3)6][TcO4]3 and TPPy[TcO4] were prepared.
Their crystallographic structures were characterized and the solubility of each compound
was investigated in H2O. Due to their significant solubility in H2O, these salts may not
have noteworthy uses as a waste form, though their thermal decomposition should lead to
formation of Tc metal and Tc-Co alloys respectively. From these results, anion exchange
resins appear to be the most selective method to achieve separation of Tc from U under
the examined conditions. The conversions of the various Tc streams to the metal are
presented in Chapter 4.

120
Chapter 4
Preparation of Metallic Technetium for Waste Form Development
After separation from U, Tc will be converted to the metal and incorporated in a
metallic alloy. In this chapter, three different methods for the production of Tc metal are
presented; thermal, electrochemical and chemicals methods. In the first section, thermal
methods for the production of metal from the Tc streams are presented. In the second
section, electrochemical methods are presented, and electrodeposited Tc metal is
characterized. In the third section, the borohydride and zinc reductions of [TcO4]- and
[TcCl6]2-
species in aqueous media are investigated and their reduction products are
characterized. At the end of the chapter, recommendations for the preparation of metallic
Tc using various techniques are presented.
4.1 Thermal methods
4.1.1 Decomposition of TBA[TcO4]
After the CETE demonstration, pertechnetate was precipitated with [TBA]+
cation
(Chapter 3). The resulting white precipitate TBA[TcO4] was isolated on a filter paper and
allowed to dry under slow flowing air for 24 hours. The paper filter and TBA[TcO4] was
placed onto a quartz boat and treated at 750 oC for 8 hours under wet flowing Ar and 343
mg (yield = 70.1.%) of a gray powder was obtained. This powder was analyzed by
powder XRD. Results (Figure 4.1) indicate the compound to be hexagonal Tc metal. The
low recovery was due to mechanical loss on the filter paper. Additional loses were due to
significant quantities of Tc engrained in filter material that would not decompose even at
temperatures of 900 ˚C for 12 hours.

121
Figure 4.1. XRD powder pattern, of the product obtained after treatment of TBA[TcO4]
at 750 °C under wet Ar for 8 hours.

122
4.1.2 Decomposition of TPPy[TcO4]
A 81.3 mg TPPy[TcO4] precipitate was placed in a quartz boat and loaded into a
tube furnace. The tube was purged under Ar for 1 hour and the temperature ramped at
4.5°C/min to 700 °C and then held at this temperature for 2 hours. During the
experiment visual inspection indicated that the salt is stable until 300 °C. At this
temperature it decomposes to a non-radioactive volatile yellow oil and a black amorphous
solid. Liquid scintillation counting of the water trap shows no volatilization of Tc
occurred during the decomposition. At the end of the experiment, 6.8 mg of product was
recovered (yield = 4.6 %), loses were due to absorption of Tc into the quartz boat used
during thermal treatment. Higher temperatures will be probably required to further
convert [TPPy][TcO4] products to the metal and larger samples should be used.
4.1.3 Decomposition of Co(NH3)6[TcO4]3
The thermal decomposition of the hexamine cobalt salt was performed under
hydrogen atmosphere at 750 ˚C. A 130.8 mg precipitate of [Co(NH4)6][TcO4]3 was
placed in a quart boat, loaded into a tube furnace and purged with Ar/H2 gas for 15
minutes prior to temperature ramping. The furnace was ramped at 3 °C/minute to 750°C
and held at this temperature for 1 hour.

123
Figure 4.2. Thermal treatment of [Co(NH4)6][TcO4]3 under Ar/H2 atmosphere at 750 ˚C
(left) before treatment and (right) after thermal treatment at 750 °C for 1 hour.

124
After decomposition, the sample (Figure 4.2) was weighted (33.8 mg, yield =
47.2%). Losses are due to the fusion of the sample in the quartz boat which could not be
recovered from the surface. The water trap at the end of the furnace did not indicate the
presence of Tc in solution. Following thermal treatment, the resulting metallic phase was
characterized by powder XRD (Figure 4.3).

125
Figure 4.3. XRD powder pattern of product obtained after decomposition of
[Co(NH4)6][TcO4]3 precipitate at 750 °C for 1 hour under H2 atmosphere.

126
The resulting powder XRD pattern indicated that the recovered metallic product
contained two phases, Tc metal and an unknown Co-Tc intermetallic. The morphology
of the sample was further analyzed by SEM microscopy (Figure 4.4). The particle size
was in the range of 1 to 100 microns.
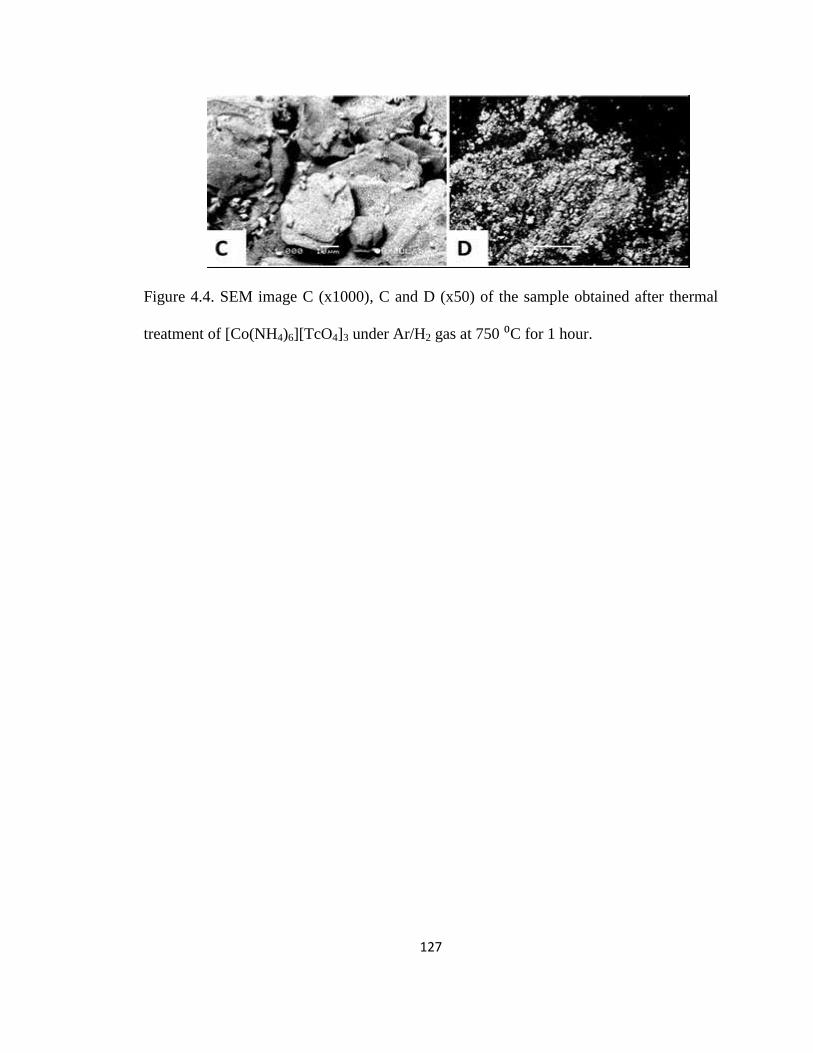
127
Figure 4.4. SEM image C (x1000), C and D (x50) of the sample obtained after thermal
treatment of [Co(NH4)6][TcO4]3 under Ar/H2 gas at 750 ⁰C for 1 hour.

128
4.1.4. Decomposition of the Tc stream obtained after the UREX Demonstration
Two streams resulted from the U/Tc separation using anionic exchange resins
(Chapter 3), [UO2]2+
in 0.01 M HNO3 and [TcO4]- and [NO3]
- in 1 M NH4OH. The U was
recovered in a 98.4 % yield as U3O8. Analysis by ICP-MS indicated the absence of
detectable levels of Tc in the U after conversion. Excess triethanol amine was added to
the 1 M NH4OH eluent containing Tc, placed in a quartz boat and loaded into a tube
furnace. The tube was flushed with Ar (100 – 300 mL/min) for 5 minutes and the
temperature was increased to 110 °C and held at temperature for 45 minutes under
flowing Ar. During this step, water and ammonium hydroxide were evaporated.
Subsequently, the temperature was increased from 110 °C to 150 °C, 170 °C, 180 °C, 200
°C, 225 °C, 240 °C, then finally held at 275 ˚C. Each hold time was 20 minutes, with the
exception of 275 °C which was held for 1 hour. During this step, water vapor was
observed at the end of the tube up to 275 °C and a carbon residue remained in the quartz
boat after 1 hour at 275 °C. The sample was then heated to 800 °C under a wet-Ar/H2O
mixture. After 15 minutes at 800 °C, XRD analysis of the product confirmed the
presence of Tc metal in the sample. After 90 minutes, a metallic solid (63.50 mg, 95.6%
yield) (Figure 4.5) was obtained. The metal was contacted in concentrated nitric acid and
analysis by ICP-MS of the solution did not reveal any trace of U.

129
Figure 4.5. Tc metal product obtained during treatment removed from the furnace after
15 minutes of steam reformation treatment. Tc metal (right) obtained after 90 minutes of
treatment at 800 ˚C of the Tc stream obtained after UREX demonstration (Chapter 3).
2Th Degrees120110100908070605040302010
Sqrt
(Counts
)
20
18
16
14
12
10
8
6
4
2
0
-2
-4
-6
-8
-10
-12
-14
-16
-18
Tc metal - triethanol amine run UTc Separation.raw_1 Tc 40.34 %
TcO2 59.66 %

130
4.1.5 Decomposition of the Tc stream after treatment with ascorbic acid
Conversion of Tc recovered from a 150 mL test run using 1 M NH4OH as the
eluent similar to triethanol amine was made. The recovered Tc exhibited the known
purple color and the solution phase was evaporated. The recovered precipitate was
subsequently steam reformed at 750 °C for 4 hours and the product characterized by
powder XRD (Figure 4.6). Results indicate the presence of hexagonal Tc metal (96.75%)
and a minor phase of TcO2 (3.25%). The recovery yield of Tc as the metal was 97%.

131
Figure 4.6 XRD powder pattern of the product obstained after treatment at 750 °C for 4
hours under wet Ar atmosphere of a Tc ascorbic acid sample

132
4.1.6 Decomposition of the Tc stream after elution with SnCl2/0.01M HCl
After elution of Tc with Sn(II)Cl2/thiourea/0.1M HCl (Chapter 3), 40 mL of
eluent was placed in a quartz boat. The boat was inserted into a tube furnace and flushed
with Ar for 15 minutes. The temperature was ramped to 100 ˚C at 5 ˚C/minute and held
for 30 minutes. The resulting dry product was steamed reformed at 700 ˚C for 4 hours
and a grey metallic powder was obtained. The grey powder was pressed into a 50 mg
pellet of 3 mm diameter and thermally treated at 1700 ˚C in an alumina tube furnace for 4
hours under Ar. After the experiment, the alumina crucible absorbed much of the product
and the material also degraded significantly (Figure 4.7). For future experiments, it is
recommended that a temperature of ~ 1200 – 1400 ˚C be used to prevent sample
interaction with the crucible due to the low melting point of Sn at 231 ˚C.

133
Figure 4.7. Product obtained after treatment of the Tc-Sn pellet following treatment at
1700 ˚C for 4 hours under Ar.

134
4.2 Electrochemical Methods
Electrodeposition of metal ions from an aqueous solution is industrially used for
the synthesis and recovery of metals. In the present work, electrochemical methods have
been explored for the recovery of Tc as the metal for nuclear applications. The
electrodeposition of Tc has been previously investigated in aqueous solvents [72]. In
those studies, the electrodeposits had been poorly characterized. Reinvestigation of the
electrodeposition of Tc metal from a sulfuric acid solution on gold and copper electrodes
and the characterization of the resulting deposits are reported.
4.2.1 Electrodepositon of Tc metal on a gold electrode
4.2.1.1 Experimental
Ten mL solutions of 1 M H2SO4 containing 2 mg and 10 mg of Tc as the element
were used. The electrodeposition experiments were performed using a three electrode
system for bulk electrolysis. The cathode was gold foil, (surface = 0.25 cm2), the
reference electrode was Ag/AgCl in 3 M KCl and the counter electrode a piece of Pt foil.
Electodeposition was performed under active stirring of the solution with a constant
current density of 1.0 A/cm2 at a potential of -2.0 V for a time of up to 2000 seconds.
During deposition, significant hydrogen evolution accompanied the formation of Tc
deposits.
After completion of the experiment a grey deposit was observed on the surface of
the electrode. The deposits are stable in 12 M HCl and could not completely be removed
from the electrode by scratching. Anodic oxidation cleanly removed deposits from the
cathode. The deposits were characterized by XRD, EXAFS, SEM and EDS.

135
4.2.1.2 Electrodeposition Yield
The quantity of Tc remaining in solution after electrodeposition was determined
by LS counting. Mass balance calculations were performed on the Tc metal deposit. The
presence of Tc metal deposits on electrode was confirmed by XRD and XAFS
techniques. For a 1 M H2SO4 solution containing initially 2 mg of Tc, a deposit of 0.167
mg (0.64 mg Tc /cm2
) was estimated after 2000 seconds of deposition (8.35 %yield).
Approximately80 % of the deposition occurs within the first 165 seconds (Figure 4.8).
Gold electrodes with larger surface areas should produce more Tc metal, but would
require a larger DC power source to achieve the same current densities.

136
Figure 4.8 Electrodeposited Tc metal (0.167 mg) onto a gold electrode (surface = 0.25
cm2) as a function of the electro-deposition time. Experimental conditions: 10 mL of 1 M
H2SO4 containing 2 mg of Tc. Current density = 1 A/cm2.

137
Following deposition, the resulting deposits from both solutions were
characterized by powder XRD, XAFS, SEM, and EDS.
4.2.1.3 Characterization of the electrodeposit by powder XRD
For both deposits, the fitted patterns (Figure 4.9) confirm the presence of
hexagonal Tc metal. No other Tc phases were detectable. Lattice parameters found by
powder XRD were determined (Table 4.1).

138
Quantity Tc initially in solution a (Å) c (Å)
10 mg 2.7435(1) 4.3952(1)
2 mg 2.7442(1) 4.4212(1)
Lattice Parameters
Table 4.1 Lattice parameters of resulting Tc deposits on gold from
electrodeposion in 1 M H2SO4 at 1.0 A/cm2
.

139
Though XRD confirms the formation of crystalline Tc metal, the presence of
amorphous Tc phases would not be detectable by this technique. To probe the presence of
potential amorphous Tc oxide, the deposits were analyzed by XAFS spectroscopy.

140
Figure 4.9. XRD powder pattern of the deposit obtained after 500 second electro-
deposition on a gold electrode. Top: deposit from the solution containing 10 mg Tc.
Bottom: from the solution containing 2 mg Tc.
2Th Degrees110100908070605040
Sqrt
(Counts
)
650
600
550
500
450
400
350
300
250
200
150
100
50
0
-50
1M H2SO4 10 mg Tc Plated on Gold2 11-10-09.RAW:1 Gold 31.04 %
Technetium P63/mmc 68.96 %
2Th Degrees110100908070605040
Sq
rt(C
ou
nts
)
1,100
1,000
900
800
700
600
500
400
300
200
100
0
-100
-200
1M H2SO4 500 second deposit on Gold 2theta scan.raw:1 Gold 90.07 %
Technetium P63/mmc 9.93 %

141
4.2.1.4 Characterization of the electrodeposit by XAFS Spectroscopy
XANES spectra were recorded in order to determine the local geometry and
oxidation state of the Tc atoms in the electrodeposits. The XANES spectra (Figure 4.10)
of Tc metal, TcO2 and NH4[TcO4] were recorded and their absorption edge determined
(Tc metal = 21044 eV), TcO2 = 21056 eV) and NH4[TcO4] = 21063 eV). The XANES
spectra of the electrodeposit from the 1 M H2SO4 solution containing 10 mg of Tc were
recorded and the absorption edge was compared with that of the reference samples. The
position of the absorption edge (21,044 eV) of the electrodeposit is consistent with the
presence of Tc metal. The absence of pre-edge features in the XANES spectra is
indicates no pertechnetate species sorbed to the surface of the electrode. In order to
further confirm the presence of Tc metal as a single phase, the EXAFS spectra of the
deposit was analyzed.

142
Figure 4.10. XANES spectra of Tc metal, TcO2, NH4[TcO4] and the Tc product obtained
after electrodeposition on a gold electrode from a 1 M H2SO4 solution containing 10 mg
of Tc. Current density = 1 A/cm2. Electrodeposition time = 500 s.

143
The EXAFS spectra of the deposit were k3
- weighted and the Fourier transform
was performed in the k range [2, 11] Å-1
. For the fitting procedure, amplitude and phase
shift functions were calculated by Feff8.2. Input files were generated by Atoms using
crystallographic structures of Tc metal. Adjustments of the k3 - weighted EXAFS spectra
were performed under the constraints S02 = 0.9. A single value of energy shift (∆E0) was
used for all scattering values.
Results (Figure 4.11 and Table 4.2) indicate the absence of Tc-O scattering and
are consistent with the presence of Tc metal as a single phase on the electrode. The
structural parameter C: (Tc0-Tc2) = 2.74(2) Å is consistent with the presence of the
hexagonal Tc phase [73].

144
Figure 4.11 Fitted Experimental k3- EXAFS spectra (top) and Fourier transform of k
3-
EXAFS spectra (bottom) of the Tc product obtained after electrodeposition on a gold
electrode from a 1 M H2SO4 solution containing 10 mg of Tc. Current density = 1
A/cm2. Electrodeposition time = 500 s. Adjustment between k = [2, 11] Å
-1
0
0.02
0 1 2 3 4 5
R + (Å)
FT
ma
g.
-1
1
1 3 5 7 9 11
k (Å-1
)
k3. c
(k)

145
Table 4.2. Structural parameters obtained after adjustment of the EXAFS spectra of the
Tc product obtained after electrodeposition on a gold electrode from a 1 M [H2SO4]
solution containing 10 mg of Tc. Current density = 1 A/cm2. Electrodeposition time =
500 seconds.

146
4.2.1.5 Characterization of the electrodeposit by scanning electron microscopy
The electrodeposits formed on the gold electrode from 1 M H2SO4 solutions
containing 2 mg and 10 mg of Tc for 100 seconds and 500 seconds of electrodeposition
were characterized by SEM. After 100 seconds of electrodeposition, a smooth, thin and
lustrous Tc electrodeposit (Figure 4.12 A) was formed in the lower concentrated solution.
The thickness of this initial layer is estimated to be between 250 to 750 nm.
After 100 seconds (Figure 4.12. D) and 500 seconds (Figure 4.12. B and 4.11.C)
of electrodeposition formation of metal beads on the initial layer were observed. The
diameter of the beads varies from 1µm to 10 µm. After 100 seconds and 500 seconds of
electrodeposition, the estimated layer thickness for both samples is 1 µm to 3 µm. The
thickness of the layer does not significantly increase with longer deposition times.

147
Figure 4.12 SEM image for the Tc products obtained after electrodeposition of Tc from 1
M H2SO4 (A) Deposit time, 100 seconds, from solution containing 2 mg Tc,
magnification x2700. (B) Deposit time 500 seconds from solution containing Tc 10 mg,
magnification x700. (C) Deposit time 500 seconds from solution containing Tc 10 mg,
magnification x400. (D) Deposit time 100 seconds from solution containing Tc 2 mg,
magnification x3500.

148
4.2.1.6 Elemental Dispersive X-ray Spectroscopy
Electrodeposits generated in 1 M H2SO4 from solutions containing 10 mg and 2
mg of Tc were analyzed by EDS spectroscopy. The EDS spectra of the deposit layer
(Figure 4.13) exhibit the Kα1 line at 2.424 eV characteristic of Tc. The intensity of the Kα1
line increases with increasing deposition times and the initial Tc content in solution.
EDS confirms the presence of Tc on the surface. No oxygen peak (at 0.525 eV) was
observed which is consistent with the absence of Tc oxide. The EDS analysis of the Tc
beads (Figure 4.12.B) further confirms the presence of Tc metal as a single phase.

149
Figure 4.13. EDS spectra of the Tc electrodeposits on gold electrodes from 1 M H2SO4.
A) Tc 2 mg, deposit time 100 seconds , B) Tc 10 mg, deposit time 100 s, C) Tc 2 mg,
deposit time 500 s D) Tc 10 mg, time 500 seconds.

150
In summary, characterization of the electrodeposits by spectroscopic, diffraction
and microscopic techniques is consistent with the presence of Tc metal as a single phase.
In order to gain a better understanding of the mechanism of formation of Tc metal, the
speciation of the solution after electrodeposition was performed.
4.2.1.7 Speciation of Tc in solution after electrodeposition
During electrodeposition of Tc in 1 M H2SO4 a color change of the solution from
translucent to brown was observed [74]. The UV-visible spectra of the brown solution
obtained after electro-reduction in 1 M H2SO4 with 10 mg Tc was recorded. The spectra
(Figure 4.14) exhibits the broad band centered at 500 nm which is characteristic of
polymeric Tc(IV) species [75]. This indicates that the formation of Tc metal from
[TcO4]- is accompanied with the formation of an intermediate Tc(IV) species. Various
mechanisms for the formation of Tc metal can occur:
Tc(VII) + 3e- Tc(IV) + 4e- Tc(0) (equation 14)
Tc(VII) + 7 e- Tc(0) (equation 15)

151
Figure 4.14. UV-visible spectra of the brown solution after electrodeposition of Tc on a
gold electrode.

152
In the context of the electro-reprocessing of Tc for nuclear applications gold
electrodes will likely not be used. Therefore, electrodeposition of Tc on other metallic
electrodes needs to be studied. In subsequent sections, a small electrodepostion study
using copper electrodes is presented.
4.2.2 Electrodeposition of Tc on Copper Cathode
Electrodeposition onto copper is desired over gold because of the cost of the
material required to produce the electrode. The lack of active oxide layers at the surface
of the electrode makes it more useful for electrodeposition over other materials such as
iron and stainless steels, which prevent adhesion of metal deposits. In this section, the
use of copper cathodes and the reported SEM morphology are provided from
electrodeposits of Tc using similar conditions to that on gold.
4.2.2.1 Experimental
Electrodeposition was performed on a 0.25 cm2
copper electrode at a constant
current density of 1 A/cm2 from a 10 mL 0.32 M H2SO4 solution containing 10 mg of Tc.
The electrodeposition time is 1000 seconds.
4.2.2.2 Results
The Tc deposits on smooth Cu (Figure 4.15) are crystalline whereas the deposits
on a rough surface are more spherical. Similar results qualitatively confirms the presence
of Tc in all deposits at the surface of the electrode and oxygen is assumed not to be
present.

153
Figure 4.15. SEM image of Tc electrodeposits on copper electrode from in 0.32 M H2SO4
solution containing 10 mg of Tc. Left: magnification = x 450; Right: magnification = x
1300.

154
In summary, these studies have shown the ability to electrodeposit Tc metal onto
gold and copper electrodes in sulfuric acid in a yield of approximately 10 percent.
Powder XRD, XAFS spectroscopy and microscopy techniques confirm the presence of
hexagonal Tc metal as a single phase on gold. No Tc oxide phases were observed.
Kinetic study indicates that most of the deposition occurs within the first 2 minutes.
During this process, the metal layer thickness is in the range 1 µm - 3 µm, and does not
significantly increase with longer deposition times. UV-visible spectroscopy indicated
that the formation of Tc metal is hindered due to the formation of Tc(IV) species during
electrodeposition. This method could be used for recovery of Tc metal after separation
from U, and could possibly find use in electrochemical deposition of Tc for other uses. At
the laboratory scale, the limitation of this method is on the recovery yield. For an
industrial application, electrodes with much larger surface area would need to be used to
electrodeposit Tc in the quantities required for reprocessing activities.
4.3 Chemical Methods
Previous results (section 4.1) have shown that after separation from U, the Tc
stream can be thermally treated and converted to the metal. An alternative method to
produce the metal would be to treat the pertechnetate stream with a chemical reducing
agent. The literature mentions that Tc metal can be produced via the borohydride
reduction of [TcO4]- in acetic acid and the zinc reduction of [TcCl6]
2- in 12 M HCl [12-
13].
Reduction of pertechnetate with borohydride in the presence of acetic acid
produces a dark compound that was previously reported to be the metal [14]. The

155
oxidation state was determined by cerium titration but no structural characterizations
were performed.
A previous study showed that in 12 M HCl, Zn metal can be used to reduce
TcCl62-
to the Tc(III) dimers as [Tc2Cl8]3-
[76,77,78,79]. In this experiment, a black
precipitate was obtained as a byproduct and proposed to be the metal, but no structural
characterization of these products had been performed. In this context, the borohydride
reduction of pertechnetate in acetic acid and the zinc reduction of [TcCl6]2-
in 12 M HCl,
and characterize the reduction products by diffraction, spectroscopic and microscopic
techniques was reinvestigated.
4.3.1 Borohydride reduction of [TcO4]- in acetic acid
4.3.1.1 Experimental
The reduction of pertechnetate with sodium borohydride was performed
according to the procedure published in the literature [12]. An ammonium pertechnetate
solution ([Tc] = 0.022 M, 0.224 mmol Tc) was purged for 10 minutes with Ar gas prior
to the drop-wise addition of a sodium borohydride/sodium hydroxide solution (8.7 mmol
NaBH4 in 3 mL 0.1 M NaOH) with a needle through a septum. The solution remained
translucent but slowly undertook a pink hue indicative of the formation of Tc(V) or
Tc(VI) intermediates [15,16]. After 3 minutes, 10 µL concentrated acetic acid was
added. Significant gas evolution accompanied by the formation of a brown colored
solution and precipitation of a dark solid was observed. A total of 80 µL concentrated
acetic acid was added to the original solution. After 20 minutes, the production of gas
was no longer apparent. The suspension was collected with a pipette and centrifuged. The
supernatant was removed and the solid (sample A) was rinsed with 3 times with 6 mL DI

156
H2O. The final black compound was dried under vacuum in a desiccator over a period of
24 hours (17.9 mg Tc, 81% yield). The supernatant was characterized by UV-Visible
spectroscopy. The sample was characterized by SEM/EDS and XAFS spectroscopy. An
XRD powder analysis shows the original precipitate to be amorphous and non-
diffracting.
4.3.1.2 UV-visible Spectroscopy
UV-Visible spectra (Figure 4.16) on the solution were recorded:
i) before reduction (A)
ii) after reduction (B)
iii) after dissolution of the precipitate in 12 M HCl (C).
During the reduction of pertechnetate by borohydride, the disappearance of the 288 nm
band of [TcO4]- and the appearance of bands at 350 nm and 500 nm are observed. The
band at 500 nm may be indicative of the formation of a soluble polymeric acetate Tc(IV)
complex [23].
After reduction, less than 1 mg of a portion of the recovered sample (sample A)
was suspended into 10 mL of 12 M HCl and the UV-visible spectra of the solution
recorded after 24 hours (Figure 4.17). The solution exhibited the characteristic UV-
visible spectra of [TcCl6]2-
.
Previous studies (Chapter 5) have indicated that Tc metal does not actively
dissolve in 12 M HCl while Tc(IV) species convert to hexachlorotechnetate [24,25]. In
this context, the formation of [TcCl6]2-
after dissolution of the sample in 12 M HCl
indicates that the reduced Tc precipitate is not the metal but probably a Tc(IV) species.

157
Figure 4.16. UV-Visible spectra of the solution: A) before reduction, B) after the
borohydride reduction of pertechnetate in acetic acid, C) after dissolution of sample A in
12 M HCl.

158
4.3.1.3 Microscopic Analysis of Tc(VII) Reduction Production with BH4- in the
presence of Acetic Acid
In order to characterize the morphology of the precipitate, the solid was mounted
on carbon tape and analyzed by SEM. The sample (Figure 4.17) did not show the
presence of a crystalline phase. In order to obtain further information on the structure of
the solid product, XAFS analysis was performed.

159
Figure 4.17. SEM image (x35, left and x6500 right) micrograph of the reduction product
obtained from the reaction between NH4TcO4 and NaBH4 in acetic acid.

160
4.3.1.4 EXAFS analysis of Tc(VII) Reduction Product by BH4- in the presence of
Acetic Acid
The EXAFS spectra of Tc metal, NH4TcO4, TcO2 and sample A were k3-weighted
and a Fourier transformation was completed in the k- range [3, 12.5] Å-1
. The Fourier
transform of sample A (Figure 4.18), different from Tc metal, exhibited one major peak
(I) centered at R + ΔR ~ 1.5 Å. Comparison with reference compounds indicates that
peak I is located at the same position that the Tc-O peak of TcO2 and could be attributed
to Tc-O scattering. A lower intensity peak (II) is noticed at R + ΔR ~ 2.3 Å. Comparison
with Tc metal and TcO2 indicates that peak II may be due to a Tc-Tc contribution. The
adjustments of the experimental EXAFS spectra were performed using the Tc-O and Tc-
Tc scattering wave functions determined for TcO2.

161
Figure. 4.18. Fourier transform between k = [3, 12.5] Å-1
of k3- EXAFS spectra of Tc
metal, sample A, TcO2 and NH4TcO4.
0
0.1
0.2
0.3
0.4
0 1 2 3 4 5 6 7
FT
ma
g.
R + (Å)
A
B
C
D NH4TcO4
TcO2
Sample
Tc metal
Tc-Tc
Tc=O
Tc-O
Tc-Tc
I
II

162
The EXAFS spectrum was fitted in k-range [3, 12.5] Å-1
using the Tc0O and
Tc0Tc1 scattering. The adjustment was conducted according the following procedure:
The coordination number of O and Tc1 around Tc0 distances Tc0-O and Tc0-Tc1, and the
corresponding σ2 were allowed to vary. The fitted k
3 - EXAFS spectra are shown in
Figure 4.19. The structural parameters are presented in Table 4.3.

163
Figure 4.19. Fitted Experimental k3- EXAFS spectra (bottom) and Fourier transform of
k3- EXAFS spectra (top) of sample A. Adjustment between k = [3, 12.5] Å
-1
0
0.04
0.08
0.12
0 1 2 3 4 5 6
R + (Å)
FT
ma
g.
Exp. Data
-p -p-p- Fit
-10
-6
-2
2
6
10
3 4 5 6 7 8 9 10 11 12 13
k (Å-1
)
k3.
χ(k
)
Exp. Data
- - - Fit

164
Sample A Structural parameter
Scattering C.N. R (Å) σ2 (Å
2)
Tc0-O 5.6 1.98 0.0031
Tc0-Tc1 0.6 2.57 0.0035
Table 4.3. Structural parameter obtained by adjustment of the k3-EXAFS spectra of
sample A. Adjustment between k = [3, 12.5] Å-1
. ∆E0 = 4.99 eV.

165
The first coordination shell around the absorbing atom is constituted by 5.6(1.1) O
atoms at 1.98(2) Å and the second coordination shell is constituted by 0.6(1) Tc atoms at
2.57(2) Å. These results indicate that the reduction product of pertechnetate is not Tc
metal. The number of O atoms indicates that Tc is octahedrally coordinated and the Tc-O
distances are in the same range as TcO2 (1.981(1)) Å. The Tc-Tc distance found is not in
accordance with the one in Tc metal (i.e., 2.743 Å), [25] but more with those found in
compounds that exhibit the [Tc(µ-O)2Tc] core structure [27,28]. The number of Tc
atoms (i.e., 0.6(1)) indicates that the product may contain dimeric species. This result is
in accordance with previous XAFS studies which indicate that reduction of pertechnetate
with borohydride in aqueous media in the presence of diphosphonate lead to polymeric
species exhibiting the [Tc(µ-O)2Tc] core structure [28].
Technetium acetate species have already been reported but never structurally
characterized [29]. It was mentioned that those species contain Tc in various oxidation
states from (III and IV) and exhibit the [Tc(µ-O)2Tc]n+
(n = 4, 3) core structure. In order
to determine the oxidation state of Tc in sample A, XANES study was performed.
4.3.1.5 XANES analysis of sample A
The XANES spectra of Tc metal, TcO2, sample A and NH4TcO4 (Figure 4.20)
were recorded, background subtracted, and normalized. XANES spectroscopy is
commonly used for characterization of the local geometry and oxidation state of
absorbing atoms. Previous studies showed that Tc species with tetrahedral geometry (i.e.,
[TcO4]-) exhibit a pre-edge feature in their XANES spectra [30]. For sample A, no pre-
edge is observed which indicates that the sample does not contain any pertechnetate.

166
Figure 4.20. Normalized Tc-K edge spectra of: A) Tc metal, B) Sample (Tc(VII)
reduction product using BH4- in the presence of acetic acid C) TcO2 and D) NH4TcO4
0
1
21.02 21.03 21.04 21.05 21.06 21.07 21.08
Energy (keV)
A.U
A B C D
A Tc metal
B Sample
C TcO2
D NH4TcO4

167
Previous studies showed that the Tc K-edge position can be correlated to the
oxidation state of the absorbing atom [31]. For sample A, the position of its absorption
edge (Table 4.4), is 1.4 eV lower than TcIV
O2 and 3.6 eV higher than (n-Bu4N)2TcIII
2Cl8.
This further indicates that its average oxidation is comprised between Tc(III) and Tc(IV)
and consistent with the presence of the [Tc(µ-O)2Tc]3+
core structure. The XAFS
experiment confirms the borohydride reduction product of pertechnetate in acetate media
is not Tc metal but polymeric carboxylate Tc species containing trivalent Tc.

168
Table 4.4. Tc K edge (eV) vs. NH4[TcO4] for: TcO2, TcO2.H2O, Sample A, (n-
Bu4N)Tc2Cl8 and Tc metal.

169
In summary, the conversion of pertechnetate into metal and its incorporation into
a waste form represents a challenge for the nuclear industry. Previous studies reported
that Tc metal could be produced from the borohydride reduction of pertechnetate in
acetic acid. In the present study, it is shown by XAFS spectroscopy that the precipitated
product is not Tc metal but a compound exhibiting the [Tc(µ-O)2Tc]3+
core structure. The
precipitation of this compound inhibits further reduction to the metal. For reprocessing
nuclear activities, our results indicate that this method will be not suitable for conversion
of the Tc stream to the metal alone.
4.3.2 Reduction of TcCl62-
by Zn in 12 M HCl
4.3.2.1 Experimental
The compound (NH4)2TcCl6 (283.2 mg) was dissolved in 30 mL of 12M HCl and
warmed to 90 ˚C in a 50 mL round bottom flask. Zinc powder (1.9002g, mesh -50/+100
Sigma-Aldrich) was added to the flask. The reaction is extremely vigorous. Immediately
upon Zn addition, strong evolution of H2 gas and a change of color of the solution from
yellow to deep green were observed. Simultaneously, a black precipitate forms that
settles in solution. After reaction, the suspension was centrifuged and the HCl
supernatant was removed with a glass pipette. After centrifugation, a black precipitate
was recovered (48 mg final) and dried under Ar for 24 hours at room temperature. The
black precipitate was characterized by powder XRD and XAFS spectroscopy. The XRD
shows the original precipitate to be amorphous after immediate production.
A 15 mg sample of the precipitate was thermally treated under Ar at 800 ˚C for 1
hour which produced a crystalline solid. The solid was characterized by powder XRD.
The supernatant from the reduction was characterized by UV-Visible spectroscopy.

170
4.3.2.2 XRD of solid B
The resulting XRD patter (Figure 4.21) shows that the solid contains two
crystalline phases; hexagonal Tc metal (63.2 %) and TcO2. (36.8 %) The fitted lattice
parameters for hexagonal Tc metal (a (Å) = 2.7441(1) and c (Å) = 4.3994(1)) are in
agreement with literature [80,81,82]. The XRD analysis does not indicate the presence of
ammonium or zinc salts.

171
Figure 4.21 Powder XRD patter of the heat treated solid. The second solid was obtained
after thermal treatment (800 °C, 1 hour, Ar) of the initial precipiate from the Zn reduction
product of TcCl62-
in 12 M HCl.
2Th Degrees110100908070605040302010
Sqrt
(Counts
)100
95
90
85
80
75
70
65
60
55
50
45
40
35
30
25
20
15
10
5
0
-5
12M HCl TcCl6 Zn reduction in solution post thermal treatment 800 C.raw TcO2 36.80 %
Tc metal 63.20 %

172
4.3.2.3 XAFS analysis of precipitate A
The EXAFS spectra of the precipitate were k3 weighted and fitted in the k- range
[3.5-12] Å-1
using the Tc-O, Tc-Tc and Tc-Cl scattering. The Debye-Waller factors for
those scattering were fixed to those previously determined (Table 4.5) [83,84,85]. The
Debye–Waller factor is used to describe the attenuation of x-ray scattering caused by
thermal motion of atoms. Atoms with low DWF factors belong to a part of the structure
that is well-ordered while atoms with large DWF factors belong to part of the structure
that is not ordered.

173
TcO2(0.0038 Å2)
Tc Metal (0.0080 Å2)
(n-Bu4N)2Tc2Cl8(0.0021 Å2)
Debye-Waller Factor (DWF)
Table 4.5 Debye-Waller Factor of TcO2, Tc metal and (n-Bu4N)2Tc2Cl8

174
Results (Table 4.6, Figure 4.22) show the presence of 3.2(6) O atoms at 2.03(2)
Å, 5(1) Tc atoms at 2.76(3) Å and 1.1(2) Cl atoms at 2.49(2) Å. Different hypotheses can
be made for the chloro-species. Each could be either a chloride complex (TcCl62-
,
Tc2Cl8n-
) or an oxy-chloride (Tc2OCl104-
) whereas the Tc-Cl distance is consistent with
Tc(II) complexes [86]. Analysis of other structural parameters indicate that the Tc-Tc
distance (2.76(3) Å) is consistent with the presence of hexagonal Tc metal (i.e. Tc-Tc =
2.71- 2.74 Å) where the number of Tc atoms (5(1)) indicate that this phase would
represent 41.6 ± 8.3 % of the product (12 atoms would have represented 100 % Tc
metal). The Tc-O distance is consistent with the presence of amorphous TcO2 in which
this phase would represent 53.3 ± 10% of the product. The EXAFS study unambiguously
shows that the product obtained after the zinc reduction of TcCl62-
in 12 M HCl contains
metallic Tc.

175
Table 4.6. Structural parameters obtained by adjustment of the k3 -EXAFS spectra of the
product. Adjustment between k = [3.5 - 12] Å-1. ∆E0 = 9 eV. S02 =0.9.
Scattering Atoms C.N. Radius (Å) s2 (Å
2)
Tc0O 3.2 2.03 0.0038
Tc0Tc 5.0 2.76 0.008
Tc0Cl 1.1 2.49 0.0021

176
Figure 4.22. Experimental k3- EXAFS spectra (left ) and Fourier transform of k
3- EXAFS
spectra (right) of the precipitate A, obtained from the Zn reduction of TcCl62-
in 12M
HCl. Adjustment between k = [3.5 - 12] Å-1

177
In summary, it has been shown that the zinc reduction of TcCl62-
in 12 M HCl
produces a mixture of Tc metal (~50 %) and Tc dioxide (~50%). The yield of Tc metal is
~30% from the parent compound. The structural parameter of the metal produced are
similar to the one produced by electrochemical reduction of [TcO4]-, and thermal
decomposition of pertechnetate (see Section 4.1). The zinc reduction of Tc(IV) is not
suitable for producing high yields of pure Tc metal from aqueous solutions. The
production of pure Tc metal (free of oxide) from the reduction product would require
further thermal treatment under a hydrogen atmosphere.
4.4 Summary
Thermal treatment under hydrogen atmosphere of the various Tc streams obtained
after separation from U (Chapter 3) produces metallic Tc. The yield of recovery of Tc
metal by these methods can produce Tc metal yields up to 97% of recoverable deposits
collected following separation.
Electrochemical methods show that Tc metal can be electrodeposited from
sulfuric acid solutions on gold and copper electrodes as a single phase in 10 % yield
based on the reported initial conditions. No detectable Tc oxide was observed. After
electrodeposition, the solutions exhibit UV-visible spectra characteristic of Tc(IV)
polymeric species. Concerning the chemical methods, the borohydride reduction of
pertechnetate in glacial acetic is not the metal but a Tc(III) and/or mixed Tc(IV) oxide
compound. Concerning the zinc reduction of [TcCl6]2-
in 12 M HCl, results are
consistent with a mixture of Tc metal and Tc dioxide. The thermal method appears to be
the method of choice for the conversion of the Tc stream obtained after separation from
U to the Tc metal.

178
Chapter 5
Corrosion behavior of Technetium metal and its alloys
After separation from U, the Tc stream will be converted to Tc metal for waste
form development. Three different metallic Tc waste forms are considered in this study,
Tc metal, Tc/stainless steel alloys, and Tc/Zr/stainless steel alloys. Previous studies
indicate that alloying Tc into stainless steel-zirconium and/or stainless steel can be a
promising technique to store Tc for long periods of time in which these alloys have
numerous advantages. Alloys of Tc permit the decrease in the synthesis of the melting
point of waste forms relative to the melting point of pure Tc metal. By alloying Tc with a
lower melting point material, such as stainless steel, Tc can essentially be incorporated
into the SS phase. Such temperatures are more accessible for industrial applications
while incorporating reactor fuel cladding.
Incorporating Tc into a material such as austenitic stainless steel (SS316) (Table
5.1) can potentially provide a passivating character and protect Tc from corrosion under a
wide variety of conditions. Formation of surface oxides can potentially reduce the
corrosion rate of Tc waste forms and increase the long-term stability of Tc within a
repository.
Technetium can be alloyed with cladding from nuclear reactors, including
zircaloy-4. It will permit the combination of two waste streams produced from nuclear
reprocessing activities into a single waste form. Current Generation III light water and
pressurized reactors use zircaloy based alloys (0-1.7 wt% Sn in Zr) as cladding whereas
future Generation IV fast reactors may use advanced stainless steels for cladding.

179
Element Wt%
Fe Balance
Mo 2.00 - 2.50
Cr 16.50 - 18.50
Ni 10.00 - 13.00
Mn 0.00 - 2.00
Composition Range of SS316
Table 5.1. Generalized composition of austenitic stainless steel (SS316)

180
In order to predict the long term behavior of these waste forms in storage
conditions, an understanding of their corrosion behavior is essential. Limited work on
the chemical and electrochemical corrosion behavior of Tc metal and its alloys has been
performed [87,88,89,90]. It was shown that Tc acts as an inhibitor of corrosion of iron
and stainless steel where the adsorption of pertechnetate at the surface of the alloy
prevented corrosion of iron. Other studies have shown that corrosion of Tc metal is
accompanied by the formation of oxides at various oxidation states (i.e., Tc3O4, TcO2 and
Tc4O7). These oxides were not characterized and the exact mechanism of corrosion of Tc
metal in aqueous media is still unknown.
The goal of this work is to examine and compare the corrosion behavior of
metallic Tc, Tc/stainless steel, and Tc/Zr/stainless steel alloys in aqueous media in the pH
range of 2 to 13. Given the lack of an identified repository, understanding of the
corrosion behavior of Tc across a wide spectrum of environmental conditions is
necessary. The results provide evidence and an understanding related to the element’s
behavior that will be used to predict the long term behavior of metallic Tc waste forms
under potential conditions that are either undesired or unexpected when predicting this
corrosion behavior.
This chapter is composed of 2 sections, the corrosion of Tc metal, and corrosion
of Tc stainless steel and Tc/Zr/stainless steel alloys. The studies have been performed in
nitric and hydrochloric acid, and in aqueous media in the pH range of 2 to 13 in the
presence of either sulfate and chloride anions. At the end of the chapter, the corrosion
behavior of the different waste forms is discussed and a recommendation for the optimal
waste form from the study is presented.

181
5.1 Preparation of Tc metal and alloys for corrosion studies
Tc metal was prepared by thermal decomposition of ammonium pertchnetate
under Ar/H2 at 750 °C. A 100 mg sample of powder was pressed into a 5 mm diameter
pellet and the pellet was arc melted 3 times. The resulting bead was mounted on a copper
wire and inserted into a Teflon cylinder. The electrode was polished with sand paper and
the exposed surface area evaluated by optical microscopy (Table 5.2).
The SS (Tc 1.34 %) alloy was prepared after grinding the metallic powders (Tc,
Fe, Ni, Mo, Ru, Rh, Pd, SS316 powder -325 mesh) and pressing it to a pellet of 13 mm
diameter. The pellet was arc melted and annealed for a minimum of 4 hours at 1100 °C
under an Ar atmosphere. Following thermal treatment, the resulting materials were
connected to a copper wire with silver epoxy and imbedded in a non-conducting epoxy.
The surface of the electrode was polished and the surface area evaluated by optical
microscopy prior to use.
The SS (Tc 2 %) Zr alloy was prepared after being pressed in a 5 mm diameter
die from metallic powder of 316 SS (-325 mesh), Tc and Zr. The order of incorporation
of powder in the die is SS316, Tc, Zr followed by SS316 layered on top. If the sample is
not prepared in this order, Tc will not become incorporated into the alloy due to its high
melting point. The pellets were placed in an alumina tube furnace under an Ar
atmosphere at 1700 °C for 4 hours followed by annealing at 1375 °C for an additional 4
hours in a small alumina crucible. The resulting materials were mounted into an
electrode with a Teflon housing and the surface was polished and exposed surface area
evaluated by optical microscopy before use. The general compositions of all materials
are provided in Table 5.2.

182
Table 5.2. Surface area (cm2) and elemental composition (weight %) of electrodes used
for corrosion measurements
Surface Area (cm2) Material Type Tc Zr SS316 Fe Ni Mo Ru Rh Pd
0.05463 Tc Electrode 100.00% - - - - - - - -
0.07423 SS(Tc2%) Zr 2.00% 14.97% - 83.30% - - - - -
0.02058 SS(Tc1.34%) 1.34% - 48.61% 25.29% 6.28% 8.35% 7.45% 1.34% 1.34%
Elemental Composition (wt%)

183
5.1.1 Techniques
Anodic polarization measurements were completed in aerated solutions. For
cathodic polarization measurements, solutions were actively deaerated with Ar gas for 30
minutes prior to polarization. A commercially-available computer-controlled potentiostat
(Biologic SP 210) was used to control potentials, scan rates and record potential-current
curves. Potentials were monitored against a saturated KCl Ag/AgCl reference electrode.
A platinum plate/foil was used as the counter electrode. Prior to starting anodic
polarization measurements, working electrodes were polished to 1 µm with alumina,
rinsed and wiped with a methanol-soaked cotton swab. Following immersion of working
electrodes, potentials were monitored for 4 hours at OCP. Polarization tests were
completed using a scan rate of +0.1 mV/s, from -30 mV cathodic of OCP to +300 mV
anodic of OCP for anodic polarization measurements and from +30 mV anodic of OCP to
-300 mV cathodic of OCP for cathodic polarization measurements. Corrosion rates were
plotted logarithmically over the surface area (Log[A/cm2]) and have been calculated
using the linear resistance polarization and Tafel measurement techniques or by direct
methods using LS counting to evaluate the dissolution rate of Tc in solutions where
soluble Tc could be observed.
5.2 Corrosion of Tc Metal
The corrosion behavior of Tc has been studied in acidic to basic solution in the
presence of chloride and sulfate. This section describes chemical dissolution of Tc metal
in HCl and HNO3, corrosion behavior of Tc metal in the pH range 1 to 13 and the
influence of chloride on the corrosion behavior of Tc metal.

184
5.2.1 Chemical Dissolution of Tc metal in HCl and HNO3
A Tc electrode was placed in a cell containing 10 mL of HX (X = Cl- and NO3
-).
Concentrations of the acids varied from pH 2.5 up to 6 M. Prior to experiment, the
solutions were actively purged with Ar for 30 minutes and during the experiment the Tc
concentration in solution was monitored by LS counting over a period of 24 hours. The
OCP curve of the Tc electrode in 1M HNO3 and HCl (Figure 5.1) was monitored as a
function of the time.
In 1 M HNO3, the dissolution potential (+600 mV vs. NHE) of Tc metal is greater
than the one reported for Re and Mo metal [91]. This indicates that Re cannot be used as
a homologue to predict the behavior of a Tc waste form and that the dissolution in nitric
acid of the UDS phase (Mo, Tc, Ru, Rh, Pd) will follow the order Mo > Tc > Ru> Rh >
Pd which is determined from reduction potentials [92].

185
Figure 5.1. Potential (V vs. Sat. Ag/AgCl) of a Tc metal electrode as a function of time in
aerated 1M HCl and 1M HNO3.

186
Analysis of the dissolution rate (Table 5.3) indicates that Tc will dissolve very
slowly in HCl media while it will dissolve faster in increasing concentrations of nitric
acid. The dissolution rate of Tc in 0.1 M HNO3 is one order of magnitude greater than in
0.1 M HCl, 2 orders of magnitude greater in 1 M HNO3, and 5 orders of magnitude
greater in 6 M HNO3 (Table 5.3).

187
Table 5.3. Release rate (in mols.cm-2
.hr-1
) of soluble Tc species in HCl and HNO3
solution.
Media: Deaerated HCl R.R. (mols Tc·cm-2·hr-1) C.R. (A·cm-2·hr-1)
pH 2.5 3.81E-10 3.06E-08
0.1M 4.37E-10 3.51E-08
1M 4.50E-10 3.62E-08
2M 9.81E-10 7.89E-08
6M 2.05E-09 1.65E-07
Media: Deaerated HNO3 R.R. (mols Tc·cm-2·hr-1) C.R. (A·cm-2·hr-1)
pH 2.5 9.70E-10 7.80E-08
0.1M 1.00E-08 8.04E-07
1M 2.00E-08 1.61E-06
2M 4.00E-08 3.22E-06
6M 8.63E-05 6.94E-03

188
5.2.2 Corrosion behavior of Tc metal in the pH range 1 to 13
The corrosion behavior of Tc was studied by linear polarization techniques in
aqueous media in the pH range of 1 to 13. The acidic solutions were prepared using
sulfuric acid while the basic solutions used sodium hydroxide. Polarization experiments
were used to determined corrosion potentials and corrosion rates of metals in those
solutions. This technique has also provided evidence of the formation of a passivating
layer on the metal during some of the corrosion experiments.
Results
The current density (A/cm2) as a function of the applied potential (V) is presented
in Figure 5.2. For all solutions, the corrosion potential of Tc metal is comprised between
+0.628 V/Ag/AgCl for pH 1 (0.1 M H2SO4) and +0.139 V/Ag/AgCl for pH 13 (0.1 M
NaOH). The value of the corrosion potential were reported and overlaid on the Tc Eh-pH
diagram (Figure 5.3). The value of Tc’s OCP is located in the domain of [TcO4]- which
indicates that pertechnetate is the predominant corrosion product of Tc metal under these
conditions.
Pseudo-passive states are observed on the polarization curves, which are
consistent with the formation of an unstable Tc oxide layer during the corrosion of Tc
metal. Because Tc dioxide is the only low valent Tc oxide unambiguously reported, it is
assumed the layer to be hydrated is TcO2. Concerning corrosion rates (Table 5.4), the
lower values are obtained between pH 4 and the pH 10 range. This indicates that Tc
corrodes slower in pH region 4 to 10 than in the pH regions 1to 4 and 10 to 13 where
TcO2 is not as stable.

189
The corrosion rate of Tc metal as a function of pH is presented in Figure 5.4.
Interestingly, the corrosion rate mimics the solubility of TcO2 [93,94]. Low corrosion
rates are observed in the regions where TcO2 has the lowest solubility, while high
corrosion rates are obtained where TcO2 is unstable. This indicates that during the
corrosion of Tc metal, TcO2 is possibly formed and acts as a kinetic barrier which limits
metal corrosion directly.
In the pH range 4 to 10, the dissolution of Tc metal will be retarded by the
formation of TcO2, which will ultimately oxidize to [TcO4]-. Below pH 4 and above pH
10, TcO2 is not stable and Tc metal will severely corrode. The formation of a layer during
the corrosion of the metal is further confirmed by limited Electrochemical Impedence
Spectroscopy (EIS). Based on these results, the proposed dissolution mechanism of Tc
metal in the pH range 4 to 10 in aerated solutions is Tc metal TcO2·xH2O [TcO4]-.

190
Figure 5.2. Anodic polarization curves of Tc metal in sulfuric acid (0.1 M, 1 mM, 10 mM
and 0.1 mM) and sodium hydroxide (0.1 M and 0.1 mM).

191
Figure 5.3. Eh-pH diagram of Tc in non-complexing media and corrosion potential (V
vs. NHE) of Tc metal determined [this work] in : A) pH 1 , b) pH 2, , C) pH 3, D) pH
4, E) pH 10 and F) pH 13. Acid solutions are in sulfruic acid and basic solutions are in
sodium hydroxide.

192
Table 5.4 – Corrosion rate (A/cm2) and reported OCP (V vs. NHE) of Tc metal as a
function of pH recorded at OCP and reported as the instantaneous corrosion rate without
Tafel branching coefficient interpretation.
Media (non-deaerated) C.R (A/cm2) OCP (mV vs. NHE)
pH 1 H2SO4 (A) 2.62E-07 0.628
pH 2 H2SO4 (B) 6.08E-08 0.552
pH 3 H2SO4 [C] 1.93E-08 0.374
pH 4 H2SO4 (D) 4.16E-09 0.575
pH 10 NaOH [E] 9.68E-09 0.474
pH 13 NaOH (F) 2.50E-07 0.139
Electrode: Tc Metal - 0.05463 cm2

193
Figure 5.4. Solid line: Corrosion rate of Tc metal (mA/cm2 ) as a function of the pH [this
work] Dashed line: Solubility of TcO2 (mol.L-1
) as a function of the pH [95].

194
5.2.3 Limited Electrochemical Impedence Spectroscopy
In order to probe the formation of a layer during the dissolution of Tc, EIS
measurements were performed in non-deaerated HNO3 (pH 4) and NaOH (pH 10)
solutions. Results are shown in Figure 5.5 and Figure 5.6 where two time constants are
apparent upon close inspection for sodium hydroxide and nitric acid, indicating the
formation of a second layer. Data were fit to a 2-time constant model where each time
constant is set in series with the solution resistance. Results are consistent with the
formation of oxide film that is generated on the surface of the metal as the potential is
ramped or the sample held at the working potential. Additional electrochemical data and
surface analyses are necessary to confirm the proposed circuit model.
195
Figure 5.5. EIS (Nyquist plot, left and Impedence Ω•cm2 vs. Hz, right) of Tc metal in pH
10 NaOH. The circuit model used for fitting is shown in the top left (Rs = solution
resistance, R1 = charge transfer resistance, CPE1 = double layer capacitance, R2 = oxide
resistance, CPE2 = oxide capacitance.

196
In HNO3, the EIS curve is not as well defined as in the NaOH experiment.
Though the definition of the curve is not observed as clearly, two or more time constants
are present in the impedance spectra. Diffusional impedance at low frequency is
observed in the immunity region where Tc metal is observed to be stable against
corrosion including the Tc(IV) and Tc(VII) regions which indicates that a non passivating
film is also present when Tc metal corrodes in HNO3.

197
Figure 5.6. Left bottom and left top: Electrochemical impedance spectra of Tc metal in
HNO3 (pH 4) non-deaerated. Bottom right: linear polarization and Tafel plot representing
voltage ramp through potentials in the stable region of Tc metal (triangle, -0.100 V), Tc
oxide, (square 0.150 V) and pertechnetate (circle, 0.270 V). Top right: Eh-pH diagram
of Tc with stable regions of Tc metal, TcO2 and [TcO4]-.

198
5.2.4 Corrosion Behavior of Tc metal in Aqueous Chloride Media
The influence of chloride anion on the corrosion behavior of Tc metal was studied
in neutral, acidic and alkaline media.
5.2.4.1 Aqueous Chloride Media
The effect of chloride on the corrosion of Tc metal was evaluated in solutions
containing NaCl (10-4
M to 1M) in non-deaerated solutions (Table 5.5). Analysis of the
polarization curves (Figure 5.7) indicates that the value of the OCP (Table 5.6) decreases
when the concentration of chloride increases. ICORR values for the corrosion rate of Tc
metal in these media are provided in Table 5.6.

199
Table 5.5. Solutions used for polarization measurements on Tc metal electrode.
Solution Conditions
1M NaCl
0.1M NaCl
0.01M NaCl
0.001M NaCl
0.0001M NaCl
Acidic Brine: 0.01M NaCl + 1E-4M H2SO4
Basic Brine: 0.01M NaCl + 1E-4M NaOH

200
Representation of the OCP on the Eh-pH diagramm (Figure 5.9) shows that in the
chloride concentration range of 1 M to 0.01 M, the potential is located in the domain of
stability of TcO2. This provides evidence that in aqueous media and for [Cl-] > 0.01 M,
Tc metal will corrode to TcO2 then be limited on release due to solubility. In 1 M and 0.1
M NaCl, a pseudo-passive and a transpassive states are observed. This observation is
consitent with the formation of TcO2 on the surface of the metal.
For concentations of [Cl-] < 0.01 M, potentials are located in the domain of
stability of [TcO4]- and Tc metal will corrode to [TcO4]
-. Further analysis shows that the
corrosion rate (Table 5.6, Figure 5.8) of Tc metal increases with the chloride
concentration. The corrosion rate of Tc metal in 1 M NaCl is 2 orders of magnitude
greater than in 0.0001 M NaCl. This indicates that the metal will corrode faster in 1M
NaCl than in 0.01M NaCl but the stability of the corrosion products are different. In high
chloride concentrations the release of Tc in the solution will be driven by the solubility of
TcO2. For low concentrations of chloride, Tc metal will corrode to [TcO4]- and the
release of Tc in solution will be driven by the direct dissolution rate of Tc metal.

201
Figure 5.7. Polarization potential in chloride media for Tc metal exposed to various
concentrations of chloride: A) 1 M NaCl, B) 0.1 M NaCl, C) 0.01 M NaCl, D) 0.001 M
NaCl, and E) 0.0001 M NaCl.

202
Figure 5.8. Corrosion rate (A/cm2) of Tc metal in aqeous chloride media. A) 1 M NaCl,
B) 0.1 M NaCl, C) 0.01M NaCl, D) 0.001 M NaCl, and E) 0.0001 M NaCl. Corrosion
points are connected with straight lines for ease of reading the figure.

203
Media (non-deaerated) C.R. (A/cm2) OCP (V. NHE)
1M NaCl (A) 5.84E-07 0.168
0.1M NaCl (B) 1.56E-07 0.212
0.01M NaCl [C] 1.74E-06 0.26
0.001M NaCl (D) 7.93E-07 0.246
0.0001M NaCl (E) 4.09E-07 0.298
Electrode: Tc Metal - 0.05463 cm2 pH 5.0
Table 5.6. Corrosion Rate (C.R.) of Tc metal in NaCl solution in non-deaerated solutions
A and B recorded at OCP – Instantaneous corrosion rateand C/D/E recorded at +0.0712,
+0.0589, and +0.114 V vs. Saturated Ag/AgCl where Tafel constants intersect. Solution
labels correspond to Figure 5.9

204
Figure 5.9. Eh-pH diagram of Tc in non-complexing media [96]. Value of open circuit
potential [this work] for a Tc electrode in aqueous media: A) 1 M NaCl, B) 0.1 M NaCl,
C) 0.01M NaCl, D) 0.001 M NaCl, and E) 0.0001 M NaCl.

205
5.2.4.2 Aqueous Chloride – Acidic and Basic Media
The effect of chloride on the corrosion of Tc was evaluated in 0.01 M NaCl + 10-4
M H2SO4 acidic brine and 0.01M NaCl + 10-4
M NaOH basic brine solutions. The
polarization curve for both media are presented in Figure 5.10 and are compared to the
chloride results. The value of the OCP of Tc metal as a function of the pH is represented
in Figure 5.11. For acidic and basic brine solutions, the value of Tc’s OCP is located in
the domain of stability of pertechnetate. Under these conditions, Tc metal will actively
dissolve to form [TcO4]-. Corrosion rates of Tc metal in acidic brine is 5 times greater
than in 10-4
M H2SO4 and the corrosion rate in basic brine is 7 times faster than in 10-4
M
NaOH alone (Table 5.7).

206
Figure 5.10. Anodic polarization curves in A) acidic brine, B) basic brine, C) 10-4
M
H2SO4 and D) 10-4
NaOH.
AB
C
D

207
Figure 5.11 Eh-pH diagram of Tc in non-complexing media. The value of open circuit
potential [this work] for a Tc electrode in A) acidic and B) basic brine media.

208
Table 5.7. Instantaneous corrosion rate (C.R.) and OCP vs. NHE of Tc metal as a
function of pH correlated to Figure 5.10 in A) acidic brine (0.01M NaCl + 10-4
M H2SO4)
and B) basic brine (0.01M NaCl + 10-4
M NaOH). Table corresponds to Figure 5.11
Media (non-deaerated) C.R (A/cm2) OCP (V vs. NHE)
Acidic Brine (A) 1.95E-08 0.392
Basic Brine (B) 7.38E-08 0.389
Electrode: Tc Metal - 0.05463 cm2

209
In summary, within the pH range of 4 to 10, the presence of chloride in solution
decreases the corrosion potential of Tc metal. In neutral pH, for [Cl-] > 0.1 M, the value
of the potentials are consistent with the formation of TcO2, while for [Cl-] < 0.1 M, the
formation of [TcO4]- as corrosion products dominates the final form of the element. In 1
M and 0.1 M [Cl]-, the formation of a solid layer has been confirmed by the presence of
pseudo-passive and trans-passive states by observation of reduced currents at greater
potentials in the polarization curves. This indicates that in high [Cl]- concentrations (> 1
M), Tc metal will corrode to TcO2 and the release of Tc in solution will be governed by
the solubility of TcO2. For all solutions studied, the presence of increasing
concentrations of [Cl]- in solution will increase the corrosion rate of Tc metal. At neutral
pH, Tc metal will rapidly corrode to TcO2, while under acidic and basic conditions
[TcO4]- will be formed. This result indicates that if Tc metal is stored in a repository that
exhibits aqueous-neutral conditions, the presence of high concentrations of chlorine is
desired. If the repository exhibits acidic or basic conditions, the presence of chlorine will
considerably enhance the release of Tc into the environment.
5.3 Corrosion of Tc Alloys
The corrosion behavior of Tc stainless steel and Tc stainless steel-Zr alloys were
studied. There is evidence that alloying Tc will lower its corrosion rate due to galvanic
coupling of Tc to other metals that are more electroactive. The decrease of corrosion rates
results in a lower appearance rate in the near field and could be primarily due to dilution
and galvanic coupling effects of the host phase to Tc. In this section report on the
corrosion behavior of 2 alloys SS (Tc 2 wt%)Zr and SS (Tc 1.34 wt%) in 0.01 M NaCl.

210
The weight loading percent of Tc into the host phase is expected to fall within this range
after reprocessing activities.
5.3.1 Corrosion of SS (Tc 2 wt%) Zr and SS (Tc 1.34 wt%) alloys in 0.01 M NaCl
The behavior of the SS (Tc 2 wt%) Zr and SS (Tc 1.34 wt%) alloys was studied in
aerated solutions of 0.01 M NaCl. The polarization curves (Figure 5.12) indicates that
the corrosion potential of the two alloys is lower than Tc metal. The corrosion potential
tracks the following order: Tc > SS (Tc 2 wt%) Zr > SS (Tc 1.34 wt%). This indicates
that Tc metal is more noble than the other alloys and that the corrosion of the materials
will follow the order SS (minus noble additions of Pd and Ru) > Zr > Tc.
The corrosion potential of the alloys is located within the domain of stability of
TcO2 (Figure 5.13). During the corrosion of the Tc alloys, Tc will be in the tetravalent
state (TcO2), and the release of Tc in solution will be governed by the solubility of TcO2.
After the complete dissolution of the matrix, TcO2 will then oxidize to [TcO4]-.
For the alloys, pseudo-passive layers were observed which is consistent with
formation of a solid layer on the surface of the materials, possibly chromium oxide, but
with small increases in potential the corrosion rate is significantly increased in the SS
alloy in the presence of [Cl]-. This is not observed in Tc and SS/Tc/Zr. Because Tc is
immune to significant attack by high concentrations of [Cl]-, there may exist a synergistic
effect in the stability of the stainless steel in the presence of Tc. This effect would need
to be evaluated in a longer dissolution study.

211
Figure 5.12. Polarization curves of Tc metal (top), SS (Tc 2 wt%) Zr) (center), and SS
(Tc 1.34 wt%) (bottom) in non-deaerated solutions containing 0.01 M NaCl.

212
Media (non-deaerated): 0.01M NaCl pH 5.5 C.R. (A/cm2) OCP (V. vs. NHE)
Electrode: Tc Metal - 0.05463 cm2
1.74E-06 0.260
Electrode: SS(Tc1.34%) - 0.02058 cm2
1.54E-06 0.145
Electrode: SS(Tc2%)Zr - 0.07423 cm2
1.81E-08 0.195
Table 5.8. Corrosion rates of Tc metal, SS (Tc 1.34 wt%) and SS (Tc 2 wt%) Zr in non-
deaerated pH 5.5 containing 0.01M NaCl. Values were calculated where the anodic and
cathodic branches intersect adapted from Figure 5.12 used to calculate the life-time of
each material exposed to the same solution.

213
Figure 5.13 Eh-pH diagram of Tc in non-complexing media. Value of open circuit
potential [this work] for A) Tc metal, B) SSTc(1.34 wt%) and C) 2 wt% Tc in SS/Zr
(85:15) in 0.01M NaCl.

214
The measured corrosion rates (Table 5.8) are 1 to 2 orders of magnitude lower
than that of unalloyed Tc. The corrosion rate of the waste form follows the order Tc > SS
(Tc 2 wt%) Zr > SS (Tc 1.34 wt%). These results suggest that in the presence of 0.01 M
NaCl, Tc-SS-Zr and Tc-SS alloys will corrode less rapidly than metallic Tc. This is
probably due to various effects such as formation of a protective oxide layer, dilution of
Tc within the host phase, and dispersion of Tc within the host phase where Tc is
galvanically coupled with surrounding elements that are more electropositive such as Fe,
Ni, Cr, and Mo. This is observed due to the higher nobility of Tc metal compared to the
alloys containing Tc.
During corrosion, Tc is expected to be in the form of TcO2. The release of Tc
into the environment will be governed by the solubility of TcO2 where the life-time of the
bulk modulus will determine the rate of release of Tc in the near-term. Increasing Tc
concentrations in alloys results in the increase of the OCP and general corrosion rates
observed in the LPR. For waste form development, Tc alloys of stainless steel and/or SS
zirconium would have greater durability than pure Tc based on these results under these
conditions.
5.4 Summary
The corrosion behavior Tc metal, Tc/stainless steel alloys, and Tc/Zr/stainless
steel alloys were studied in HCl and HNO3, aqueous media in the pH range 2 to 13 and in
chloride solutions. Technetium metal corrodes much faster in nitric than in hydrochloric
acid. Increasing nitric acid concentration increases the corrosion rate of the materials. In
the absence of chloride and in the pH range of 1 to 13, Tc metal ultimately corrodes to
[TcO4]-. During the corrosion process, a pseudo-passive layer that is likely hydrated

215
TcO2 is observed by EIS and in Tafel observation. The corrosion rate mimics the
solubility of TcO2 where low corrosion rates are observed in the regions where TcO2 has
the lowest solubility while high corrosion rates are obtained where TcO2 is unstable.
During the corrosion of Tc metal, formation of TcO2 may act as a kinetic barrier during
metal corrosion.
The presence of chloride in solution increases the corrosion rate of Tc metal while
it decreases the overall corrosion potential. The presence of high concentrations of
chloride seems to help passivate Tc metal by stabilizing the TcO2 layer. These results
show that if Tc metal is stored in a repository that exhibits aqueous neutral conditions, the
presence of high concentrations of chloride is desired. If the repository exhibits acidic or
basic behavior in solution, the presence of chloride will considerably enhance the release
of Tc within in the environment of the near field of the repository.
The corrosion of TcSS and TcSSZr alloys exposed to 0.01 M NaCl has been
investigated. Linear polarization resistance measurement show that unalloyed Tc metal
corrodes at higher rates than the TcSS and TcSSZr alloys. Both alloys exhibit regions of
passivity which follow the order of SS (Tc 2 wt%) Zr > SS (Tc 1.34 wt%).
In 0.01 M NaCl, the corrosion potential of the waste forms follows the order SS
(Tc 1.34 wt%) > SS (Tc 2 wt%) Zr > Tc while their corrosion rates follow the order of Tc
> SS (Tc 2 wt%) Zr > SS (Tc 1.34 wt%). Among the three waste forms studied, the more
durable waste form appears to be the SS (Tc 1.34 wt%) alloy.

216
Chapter 6
Conclusion
The isotope 99
Tc is a major fission product. In the last decade approximately 20 tons
of Tc has been produced by the US nuclear industry. Due to its long half-life and beta-
radiotoxicity, Tc represents a long-term waste concern. One option to treat Tc is its
separation from spent fuel, conversion to the metal and incorporation into a metallic
waste form for long term geological disposal. After dissolution of spent fuel in nitric acid
and extraction of U and Tc into organic media, different methods have been developed to
separate the components and convert the separated Tc stream to the metal. A variety of
metallic waste forms, ranging from pure Tc metal to ternary Tc alloys with SS and Zr are
proposed. The goal of this work was to answer three major questions:
1. What is the optimal method to separate Tc from U?
2. After separation, what is the most efficient method to convert the Tc stream to Tc
metal?
3. What is the corrosion behavior of Tc metal, Tc-SS alloys and Tc-Zr-SS alloys in
aqueous solution and using this evaluated corrosion behavior and rates, could an
estimation of the life-time of the waste be estimated relative to the half-life of Tc
in the waste form with a goal to predict the long term behavior of metallic Tc
waste in a proposed storage environment.

217
In this work, three different methods have been used to separate Tc from U: anion
exchange chromatography, liquid-liquid extraction and precipitation methods. Of the
three methods studied, anion exchange is the preferred and most selective method.
After sorption on the resin, [TcO4]- can be efficiently eluted by 1M NH4OH. This
hard base exchanges pertechnetate from the resin, but ammonium nitrate is also eluted in
the process. Ammonium nitrate was eliminated after thermal treatment of the Tc stream
with triethanol amine and ascorbic acid. Full scale demonstrations of the separation of
Tc from U, destruction of the ammonium nitrate and the conversion of the eluted stream
to Tc metal have been successfully performed and demonstrated. By controlling the
degradation of the ammonium salts in the presence of triethanol amine and/or ascorbic
acid, Tc can be recovered while the eluting solution, NH4OH, has been shown to be
recycled by distillation for recovery and future use. The dry product containing Tc and
carbon can be steam reformed which results in Tc metal that can be recovered with a very
high degree of efficiency. The Tc produced is free of U and can be used for incorporation
into a metallic waste form.
After separation of Tc from U three different methods were studied to convert the
Tc stream to the metal:
(1) thermal treatment under hydrogen atmosphere,
(2) electrochemical reduction, and
(3) chemical reduction of pertechnetate in aqueous media.
The thermal treatment of the Tc stream under hydrogen atmosphere appears to be the
method of choice for the conversion of the Tc stream to the Tc metal for large throughput
requirements at the industrial scale.

218
In the electrochemical methods, Tc metal is electrodeposited from sulfuric acid in
low yields (< 10 %) on small surface area electrodes. This technique is promising, but
further work is needed to increase the deposition yields. Concerning the chemical
methods, the borohydride and zinc reduction of Tc species did not produce pure metal
and further thermal treatment under hydrogen atmosphere will be required to produce Tc
metal.
After Tc metal is isolated it will be incorporated into a metal host phase. Three
different waste forms were prepared and studied in this work; pure Tc metal, SS(Tc 2
wt%) Zr and SS(Tc 1.34 wt%) alloys. The corrosion behavior of these waste forms has
been studied by electrochemical techniques in aqueous 0.01 M NaCl. Corrosion rate
measurements indicate that both SS (Tc 2 wt%) Zr and SS (Tc 1.34 wt%) alloys corrode
more slowly than metallic Tc in terms of the bulk material which is probably due to the
formation of a protecting layer on the surface of the alloys though the rate of corrosion of
the SS (Tc 2 wt%) Zr alloy corrodes on the same order of magnitude as Tc metal alone.
The challenge in storing Tc for long periods of time then becomes complicated
by the unknown nature of the repository and the host phase it will be stored in.
In order to estimate the volume required to store Tc that is produced every year in
the US (2 000 kg), calculations have been performed. Assuming that all the Tc will be
recovered and used for waste form development the following has been concluded:
If 2000 kg of Tc is melted into a cubic block, the volume of the block will be
~0.174 m3 (56 cm x 56 x 56 cm). Metallic Tc has a density of 11.45 g · cm
-3. A
single face of this cube will have an exposed surface area of 3136 cm2.

219
If 2000 kg of Tc is alloyed in 1.34 wt% with stainless steel, the volume of the
cubic block will be ~ 18.5 m3 (265 cm x 265 cm x 265 cm). Stainless steel has a
density of 8.00 g·cm-3
and the alloy will have a calculated average density of 8.05
g cm3. A single face of this cube will have an exposed surface area of 70,225
cm2.
If 2000 kg of Tc is alloyed in 2 wt% weight with stainless steel and zirconium, the
volume of the cubic bloc will be ~12.73 m3
(234 cm x 234 cm x 234 cm). The
density of metallic zirconium is 6.52 g and the alloy will have a calculated density
of 7.85 g cm3. A single face of this cube will have an exposed surface area of
54,756 cm2.
The relative volume for the three cubic Tc waste forms needed to store the annual
US production of Tc is pictorially presented in Figure 6.1.

220
Figure 6.1 Relative volume of the three metallic Tc waste forms needed to store 2000 kg
of metallic Tc. A) Tc metal 0.174 m3, B) SS (Tc 2 wt%) Zr 12.73 m
3 and C) SS (Tc 1.34
wt%) 18.5 m3.

221
In effort to estimate the life time of the three waste forms containing the 2000 kg
of Tc exposed to a 0.01 M NaCl solution, a calculation using the instantaneous corrosion
rate (Chapter 5) were performed. The value used for the calculation of the lifetime of the
waste forms in 0.01 M NaCl is presented in Table 6.1.

222
Media (non-deaerated): 0.01 M NaCl C.R (A/cm2) OCP (mV vs. NHE)
Electrode: Tc Metal - 0.05463 cm21.74E-06 0.260
Electrode: SS(Tc1.34%) - 0.02058 cm21.81E-08 0.032
Electrode: SS(Tc2%)Zr - 0.07423 cm21.54E-06 0.195
Surface Area (cm2) Avg Density (g/cm
3)
Electrode: Tc Metal - 0.05463 cm2
3136 11.45
Electrode: SS(Tc1.34%) - 0.02058 cm2
70225 8.05
Electrode: SS(Tc2%)Zr - 0.07423 cm2
54756 7.85
Electrons per Event Atoms released per sec
Electrode: Tc Metal - 0.05463 cm2
7 4.87E+15
Electrode: SS(Tc1.34%) - 0.02058 cm2
3 2.64E+15
Electrode: SS(Tc2%)Zr - 0.07423 cm23 1.75E+17
I.C.R (Amps/Coulombs) Electrons Released
Electrode: Tc Metal - 0.05463 cm2
5.46E-03 3.41E+16
Electrode: SS(Tc1.34%) - 0.02058 cm21.27E-03 7.93E+15
Electrode: SS(Tc2%)Zr - 0.07423 cm28.43E-02 5.26E+17
Mols per sec Tc %
Electrode: Tc Metal - 0.05463 cm28.08E-09 100.00%
Electrode: SS(Tc1.34%) - 0.02058 cm2
4.39E-09 1.34%
Electrode: SS(Tc2%)Zr - 0.07423 cm22.91E-07 2.00%
Tc R.R. (g/yr) Lifetime (years)
Electrode: Tc Metal - 0.05463 cm225.235 79,254
Electrode: SS(Tc1.34%) - 0.02058 cm20.184 10,881,614
Electrode: SS(Tc2%)Zr - 0.07423 cm2
18.199 109,897
Electrons per Coulomb 6.24E+18
Tc Quantity (g) 2000000
Table 6.1 Raw values used to estimate the linear lifetime of each material incorporating
2000 kg of Tc metal into the waste form.

223
Calculations of the lifetime of the cubic metallic Tc waste forms containing 2000 kg
of Tc metal have been performed with the following assumptions (Table 6.2):

224
Tc metal SS(Tc2 wt%)Zr SS(Tc1.34 wt%)
1. The dimensions of the exposed
surface area of each alloy is: 3136 cm2 54 756 cm2 70 225 cm2
2. The instantaneous corrosion rate of
each material is: 1.74E-6 A/cm2 1.54E-6 A/cm2 1.81E-8 A/cm2
3. The instantanesous corrosion rate -
Coulombs over the face: 5.46E-03 8.43E-02 1.27E-03
3. The number of electrons per
coulomb:
4. The number of electrons required
to release an atom: 7 3 3
6.24E+18
Table 6.2. Generalized assumptions of corrosion of Tc metal, SS(Tc 2 wt%)Zr, and
SS(Tc 1.34 wt%) used to estimate the lifetime of each material.

225
The cube corrodes uniformly in a 0.01 M NaCl aqueous media at pH 5.5 and Tc is
released as a function of its representative weight percent in the material and is
assumed to be distributed evenly throughout all alloys. Only one face of the cube is
exposed to the corroding solution and that face is corroding at a constant corrosion
rate. A conservative approach is taken for Tc in that 7 electrons are required to
release it from the pure metal. In the case of the alloys, because the dominant phase
is iron, only 3 electrons are required to release Tc after Fe3+
is released into solution.
The influence of Tc decay to Ru is not considered. If all six sides of the cube are
exposed to the solution, the lifetime of the metal phase will have an initial corrosion
rate that exceeds the calculated linear value and this value will be less than that
provided. It does not take in account the shrinking surface area over time beyond the
initial faster rate of corrosion. Effect of oxide layer growth is not accounted for
which may limit electron flow from the base metal to the solution after the fast
corrosion rate occurs. Corrosion from erosion on a flowing solution is not
considered. Pitting corrosion is not assumed (i.e., uniform layer corrosion and that
the areal surface area of the alloy is unchanged from start to finish). Effect of
radiolysis is not considered in the solution (no peroxo species are forming) or on
microstructure of the material (radiation effects do not displace atoms from their
original positions in the alloy). The following equation are used to estimate the linear
corrosion lifetime of the waste forms:
Corrosion Rate (A/cm2) x Surface Area (cm
2) = Amps = Coulombs/sec
Coulombs / 6.241E18 electrons per Coulomb = Electrons released per second

226
Electrons released per second / electrons required to release an atom = atoms
released per second.
Atoms released per second / 6.02E23 atoms per mol = mols released per second
Mols released per second x FW Tc (99 g/mol) x wt % Tc in Alloy = Mass loss of
Tc per second in waste form.
Mass loss of Tc per second / (3600 sec/hr * 24 hr/day * 365 days/yr) = lifetime in
years.
The height that the material in a single phase can be determined when the surface area
is assumed to be constant. In the case of pure Tc metal, the dimensional height loss in cm
can be calculated by evaluating the occupying volume loss of the material by dividing the
mass loss by density. With a known real surface area that is assumed to be fixed, the
height of the exposed face and its dimensional reduction can be estimated and are
provided in table 6.4.

227
1. Tc metal will have a life-time in years of ~79,250 years before the original Tc
totally dissolves in non-deaerated pH 5.5, 0.01M NaCl.
2. The SS (Tc 2 wt%) Zr alloy will have a life-time in years of ~110,000 years
before all of the original Tc dissolves in non-deaerated pH 5.5, 0.01M NaCl.
3. The SS (1.34 wt%) alloy will have a life-time in years of ~10,800,000 years
before all of the original Tc dissolves in non-deaerated pH 5.5, 0.01M NaCl.
Table 6.3 The estimation of the lifetime of each material, Tc metal, SS(Tc 2 wt%)Zr, and
SS(Tc 1.34 wt%)

228
Though Tc metal will not occupy as much space as an alloy, it is clear that the most
important period of time to protect Tc from corrosion is the initial time it is placed in the
repository. An overlay of the % Tc in the alloy as a function of its rate of decay relative
to the total in growth of Ru in the host phase is presented in Figure 6.2. The effect of
galvanically protecting Tc within the host phase appears to reduce the rate at which Tc
could potentially be released as soluble forms of Tc as [TcO4]-. Incorporating Tc into a
phase which will protect Tc from rapidly corroding from the host phase can dramatically
enhance its lifetime in the bulk material as is observed in the SS host phase. In the SS
(Tc 2 wt%) alloy, Tc does not readily incorporate into the Zr phase. The failure of
placing Tc in more contact with protective materials appears to dramatically reduce its
stability in the host phase and ultimately its lifetime in the alloy as it corrodes. More
investigation should be undertaken to verify what these real corrosion values are by
producing coupons of each material and studying their leach behavior, but alloying Tc
appears to be a promising method to protect it from leaching into the environment while
simultaneously allowing Tc to decay to stable Ru.

229
Table 6.2. Life time based on a linear corrosion rate in 0.01 M NaCl for metallic Tc waste
forms containing 2000 kg of Tc metal.. A) Tc metal, B) SS (Tc 2 wt%) Zr and C) SS (Tc
1.34 wt%).

230
Finally, development of other metallic Tc waste forms is in progress, where one
promising waste form is the ε-phase. The ε-phase is an alloy rich in Mo-Ru-Tc-Pd-Rh.
Due to the presence of the platinum group metals (Ru, Pd and Rh) this phase should be
extremely corrosion resistant and should surpass the durability of the alloys presented in
this work due to its stability under dissolution on the front end of reprocessing in HNO3.
Understandably though, these platinum group metals are rare and currently have other
industrial uses but it is clear that a few percent addition into a solid solution such as the
SS(Tc 1.34 wt%) alloy has dramatically enhanced its corrosion behavior. It is suggested
that these types of effects on waste form development be pursued with greater effort if
stable wastes are ever to be developed. With host phases that incorporate Tc similar to
the SS (Tc 1.34 wt%) already produced, the effect of galvanic coupling to Tc should be
investigated and the corrosion rate of these materials containing Tc should be compared
to the previously investigated materials.

231
References
1Nuclear Power Reactors in the World, International Atomic Energy Agency, Reference
data series No. 2, (2012)
2 Status and Trends of Nuclear Fuels Technology for Sodium Cooled Fast Reactors,
International Atomic Energy Agency, IAEA Nuclear Energy Series, No.NF-T-4.1
3 C. Ferry, C. Poinssot, V. Broudic, C. Cappelaere, L. Desgranges, P. Garcia, C. Jegou, P.
Lovera, P. Marimbeau, J-P Piron, A. Poulesquen, D. Roudil, Synthesis on the spent fuel
long term evolution, Direction de L’energie nucleaire, ISSN 0429-3460 (2005).
4 Department of Energy Waste Form Working Group – Adapted from Annual Meeting
(2009) Idaho Falls, ID, MWFWG
5 Campbell, D. O.; Burch, W. D. The chemistry of fuel reprocessing: present
practices, future trends. Journal of Radioanalytical and Nuclear Chemistry (1990),
142(1), 303-20.
6 Nash, Kenneth L.; Choppin, Gregory R. Separations chemistry for actinide
elements: recent developments and historical perspective. Separation Science and
Technology (1997), 32(1-4), 255-274.
7 G. F. Vandegrift, M. C. Regalbuto, S. B. Aase, H. A. Arafat, A. J. Bakel, D. L. Bowers,
J. P. Byrnes, M. A. Clark, Jeffrey W. Emery, J. R. Falkenberg, A. V. G., Lohman D.
Hafenrichter, R. A. Leonard, C. Pereira, K. J. Quigley, Y. Tsai, M. H. Vander Pol, J. J.
Laidler, Lab-Scale Demonstration of the UREX+ Process, WM’04 Conference
8 F. Poineau, J. Du Mazaubrun, D. Ford, J. Fortner, J. Kropf, G. W. C. Silva, N. Smith, K.
Long, G. Jarvinen and K. Czerwinski; U/technetium separation for the UREX process –
synthesis and characterization of solid reprocessing forms. Radiochim. Acta (2008).
9 Frederic Poineau, Edward Mausolf, Gordon D. Jarvinen, Alfred P. Sattelberger, and
Kenneth R. Czerwinski Technetium chemistry in the fuel cycle: Combining basic and
applied studies, Inorg. Chem.; (2012) dx.doi.org/10.1021/ic3016468 | Inorg. Chem
10
K. Schwochau, Technetium: Chemistry and Radiopharmaceutical Applications; Wiley-
VCH: Weinheim, Germany, 2000
11
Sattelberger, A. P. In Multiple Bonds between Metal Atoms, 3 rd
Edition; Cotton, F. A.;
Murillo, C. A.; Walton, R. A. (eds.), Springer, NY, 2005, chap. 7.
12
Poineau, F.; Sattelberger, A. P.; Conradson, S. D.; Czerwinski, K. R. Inorg. Chem.
2008, 47, 1991-1999.

232
13
B. J. McDonald G. J. Tyson, U.K.A.E.A, The crystal structure of caesium, ammonium,
and potassium pertechnetates, Acta Cryst. (1962). 15, 87
14
R. Faggiani, C. J. L. Lock, J. Poce, The structure of ammonium pertechnetate at 295,
208 and 141 K, Acta. Cryst. (1980). B36, 231-233.
15
E. Rodrigues, F. Poineau, A. Llobet, A. Sattelberger, J. Bhattacharjee, U. Waghmare,
T. Hartmann, A. Cheetham; Structural studies of TcO2 by neutron powder diffraction and
first-principles calculation, J. Am. Chem. Soc. 2007, 129, 10244-10248.
16
G. W. Chinthaka Silva, F. Poineau, L. Ma, and K. Czerwinski, Application of electron
microscopy in the observation of technetium and technetium dioxide nanostructures,
Inorganic Chemistry, Vol. 47, No. 24, 2008.
17
D. J. Lam, J. B. Darby, J. W. Downey, L. J. Norton, Nature 1961, 192, 744.
18
J. W. Cobble, C. M. Nelson, G. W. Parker, W. T. Smith, G. E. Boyd, J. Am. Chem.
Soc., 74 (1952) 1852.
19
V. I. Spitsyn, A. F. Kuzina, A. F. Tsarenko, A. A. Oblova,.O. A. Balakhovskii, P. N.
Kodochigov, M. P. Glazunov, I. V. Kaimin, Radiokhimiya, 12 (1970) 617.
20
Cobble, J. W.; Nelson, C. M.; Parker, G. W.; Smith, W. T., Jr.; Boyd, G. E. Chemistry
of technetium. II. Preparation of technetium metal. Journal of the American
Chemical Society (1952), 74 1852 21
J. H. Johnson, U.S. Dept. Com., Office Tech. Serv., P. B. Rept. 133802, 99 pp., 1960
22
R. A. Pacer, J. lnorg. Nucl. Chem. 35, 1375 (1973).
23
R. A. Pacer, J. lnorg. Nucl. Chem. 38, 817 (1976).
24
Mendez, Eduardo; Cerda, Maria F.; Castro Luna, Ana M.; Zinola, Carlos F.; Kremer,
Carlos; Martins, Maria E. Journal of Colloid and Interface Science (2003), 263(1),
119-132
25
Atlas of Eh-pH diagrams – intercomparison of thermodynamic databases; Geological
Survey of Japan Open File Report; 2005 (251)
26
Rard, J. A. J. Nucl. Radiochem. Sci. 2005, 6, 197.
27
Zilberman, B. Ya.; Pokhitonov, Yu. A.; Kirshin, M. Yu.; Ozawa, M.; Blokhin, A. A.
Radiochemistry (New York) 2007, 49, 156.

233
28
Ackerman, J. P. Ind. Eng. Chem. Res. 1991, 30, 141.
29
Schroeder, N. C.; Attrep, M.; Marrero, T. Technetium and Iodine Separations in the
UREX Process; LA-UR-01-6607; Los Alamos National Laboratory: Los Alamos, NM,
2001; 6-19.
30
Uchiyama, G.; Asakura, T.; Hotoju, S.; Mineo, H.; Kamei, K.; Watanabe, M.; Fujine,
S. Radiochem. 2000, 42, 488–492.
31
Koltunov, V. S.; Marchenko, V. I.; Nikiforov, A. S.; Smelov, V. S.; Shmidt, V. S.;
Gomonova, T. V.; Polunin, A. K.; Kondra’ev, B. A. Atomnaya E´ nergiya (trans.) 1986,
60, 35–41.
32
Poineau, F., Hartmann, T., Jarvinen, D., Czerwinski, K.: Preparation of Tc metal by
thermal treatment under Ar/H2O. J. Radioanal. Nucl. Chem.
33
Ravel, B., Newville, M.: ATHENA, ARTEMIS, HEPHAESTUS: data analysis for X-
ray absorption spectroscopy using IFEFFIT. J. Synchrotron Radiat. 12, 537 (2005).
34
Hartmann, Poineau, Czerwinski, Synthesis and Properties of Metallic Technetium and
Technetium-Zirconium Alloys as Transmutation Target and Radioactive waste storage
form in the UREX+1 Process, Atalante (2008)
35
Gordon Jarvinen, David Kolman, Kurt Sickafus, James Valdez, Kenneth Czerwinski,
Frederic Poineau, Thomas Hartmann, Phillipe Weck, and Edward Mausolf, Department
of Energy internal Report, Waste Form Campaign September 2008
36
Mausolf, Edward; Poineau, Frederic; Hartmann, Thomas; Droessler, Janelle;
Czerwinski, Ken, Journal of the Electrochemical Society (2011), 158(3), E32-E35
37
Frederic Poineau, Philippe Weck, Thomas Hartmann, Paul Forster, Ken Czerwinski
(University of Nevada, Las Vegas), Gordon Jarvinen and Dave Kolman. (Los Alamos
National Laboratory), Rory Kennedy (Idaho National Laboratory), Massoud Fattahi,
Laboratoire Subatech, France, Development of Alternative Technetium Waste Forms,
NEUP 09-315
38
W.L. Ebert. Testing to evaluate the suitability of waste forms developed for
electrometallurgically treated spent sodium-bonded nuclear fuel for disposal in the yucca
mountain repository. Chemical Engineering Division, Argonne National Laboratory,
ANL-05/43
39
Utsunomiya, S.; Ewing, R. C. The fate of the epsilon phase (Mo-Ru-Pd-Tc-Rh) in
the UO2 of the Oklo natural fission reactors. Radiochimica Acta (2006), 94(9-11),
749-753

234
40
Cui, Daqing; Low, Jeanett; Sjoestedt, Cecilia J.; Spahiu, Kastriot. On Mo - Ru - Tc -
Pd-Rh-Te alloy particles extracted from spent fuel and their leaching behavior under Ar
and H2 atmospheres. Radiochimica Acta (2004), 92(9-11), 551-555
41
Joseph Wang (2006). Analytical Electrochemistry. 3rd ed. New Jersey: Wiley & Son.
15-16
42
D.O. Campbell, W.D. Burch, Journal of Radioanalytical and Nuclear Chemistry, Vol
142, 1990, 303-320
43
Stern, M., and Roth, R. M., Journal of the Electrochemical Society, Vol 104, 1957, p.
390.
44
Stern, M., Corrosion, Vol 14, 1958, p. 440 t
45
Mansfeld, F., “The Polarization Resistance Technique for Measuring Corrosion
Currents”, Corrosion Science and Technology, Plenum Press, New York, NY, Vol VI,
1976, p.163.
46
Mansfeld, F., “Evaluation of Polarization Resistance Round Robin Testing Conducted
by ASTM G01.11”, Paper No. 106, CORROSION/76, NACE, Houston, TX, March 22-
26, 1976.
47
Gileadi, E., Kirowa-Eisner, E., and Penciner, J. Interfacial Electrochemistry, an
Experimental Approach, Chapter III.1, Addison-WesleyPublishing Co., Reading, MA
1975.
48
Greene, N. D., France, Jr., W. D., and Wilde, B. E.,“ Electrode Mounting for
Potentiostatic Anodic Polarization Studies,” Corrosion, CORRA, Vol 21, 1965, p. 275.
49
France, Jr., W. D., “Controlled Potential Corrosion Tests, Their Applications and
Limitations,” Materials Research and Standards, Vol9, No. 8, 1969, p. 21.
50
N. D. Tomashov and g. P. Chernova, Passivity and Protection of Metals Against
Corrosion, Plenum Press, new york, 1967.
51
M. Stern and A. L. Geary, Electrochemical polarization: I. A theoretical analysis of the
shape of polarization curves, J. Electrochem. Soc. 104: 56 1957.
52
M. Stern and A. L. Geary, Electrochemical polarization: I. A theoretical analysis of
the shape of polarization curves, J. Electrochem. Soc. 104: 56 1957.
53
Stern M. and Geary A.L., J. Electrochem. Soc., 104, (56), 1957.

235
54
E. Huber, W. Heineman, E Deutsch, Inorg. Chem. 26, 3718-3722 (1987)
55
M. Newville, P. Livins, Y. Yacoby, E. A. Stern, J. J. Rehr. Near-edge x-ray-absorption
fine structure of lead: a comparison of theory and experiment. Phys. Rev. B, 47, 14126
(1993).
56
T. Ressler. WinXAS: a program for x-ray absorption spectroscopy data analysis under
MS-Windows. J. Synchrotron Rad. 5, 118 (1998).
57
J. J. Rehr, R. C. Albers. Theoretical approaches to x-ray absorption fine structure. Rev.
Mod. Phys., 72, 621 (2000).
58
B. Ravel. ATOMS: crystallography for the X-ray absorption spectroscopist. J.
Synchrotron Rad. 8, 314 (2001).
59
Rodriguez, E. E.; Poineau, F.; Llobet, A.; Sattelberger, A. P.; Bhattacharjee, J.;
Waghmare, U V.; Hartmann, T.; Cheetham, A. K. Structural Studies of TcO2 by Neutron
Powder Diffraction and First-Principles Calculations. Journal of the American Chemical
Society (2007), 129(33), 10244-10248.
60
Topas V2.0.: Profile and Structure Analysis Software for Powder Diffraction Data.
User Manual; Bruker AXS: Karlsruhe, Germany (2000).
61
Burla, C., Caliandro, R., Camalli, M., Carrozzini, B., Cascarano, G. L., De Caro, L.,
Giacovazzo,C., Polidora, G., Spanga R.: SIR2004: an improved tool for crystal structure
determination and refinement, J. Appl. Cryst. 38, 381-388 (2005)
62
J. Farrigua: WinGX suite for small-molecule single-crystal crystallography, J. Appl.
Cryst. 32, 837-838 (1999)
63
Sheldrick G. M.: A short history of SHELX, Acta. Cryst. A64, 112-122 (2008)
64
A. B. Melent, A. N. Mashkin, O. V. Tugrarina, D. N. Kilupaev, B. Ya. Zilberman, and
I. G. Tananaev, Radiochemistry, 2011, Vol. 53, No. 3. Pp256-263. Effect of some
reducing and complexing agents on the extraction behavior of Technetium in the TBP-
HNO3 system.
65
Kennedy C>, Pinkerton Tc (1988) Technetium carboxylate complexes-I. A review of
technetium, rhenium, and molybdenum carboxylate chemistry. Int. J. Radiat. Ppl.
Instrum. A 39(11): 1159-1165.

236
66
Syngas in Gas Engines, www.clarke-energy.com
67
A. B. Melent’ev, A. N. Mashkin, O. V. Tugarina, D. N. Kolupaev, B. Ya. Zilberman,
and I. G. Tananaev, Effect of some reducing and complexing agents on the extraction
behavior of technetium in the TBP-HNO3 system, Radiochemistry, 2011, Vol. 53, No. 3,
pp. 256-263 (2011)
68
Koltunov, V.S., Gomonova, T.V., Shapovalov, M.P., et al., Radiokhimiya, 1987, vol.
29, no. 4, pp. 489–494.
69
Bonnesen, P. V., Brown, G. M., Alexandratos, S. D., Bavoux, L. B., Presley, J. D.,
Patel, V., Ober R., Moyer, B. A.: Development of Bifunctional anion-exchange resins
with improved selectivity and sorptive kinetics for pertechnetate: batch-equilibrium
experiments, Evniron. Sci. Techol., 34, 3761-3766 (2000).
70
Chadwick, T. C.: 1,2,4,6-Tetraphenylpyridinium Acetate as a New Anion Precipitant
Anal. Chem. 48(8), 1201-1202 (1976)
71
Wilke-Dorfurt, E. et al. Z. Anorg. Allgem. Chem. 1933, 215, 369.
72
E. Mausolf, J. Droessler, F. Poineau, K. Czerwinski, Characterization of
Electrodeposited Technetium on Gold Foil, JES (2011)
73
F. Poineau, J. Du Mazaubrun, D. Ford, J. Fortner U/technetium separation for the
UREX process – synthesis and characterization of solid reprocessing forms,
74
R. E. Voltz, M. L Holt.: Electrodeposition of Tc-99 from Aqueous Solution, J.
Electrochem. Soc.: Electrochemical Science (1967) Vol 114, No. 2, 128-131.
75
V. I. Spitsyn, A. F. Kuzina, A. A. Oblova, M. I. Glinkina, L. I. Stepovaya.:On the
mechanism of the electrochemical reduction of [TcO4]- ion on platinum cathode in
sulphuric acid solutions. J. Radioanalytical Chem., Vol 30 (1976) 561-566.
76
F. A Cotton, W. R. Bratton, J. Amer. Chem. Soc., 87, 921 (1965)
77
W. K. Bratton and F. A. Cotton, Inorg. Chem., 9, 789 (1970)
78
J. D. Eakins, D. G. Humphreys, and C. E. Mellish, New compounds in which
Technetium has a low valency, J. Chem. Soc., 6012 (1963)
79
F. A. Cotton and E. Pedersen, Complexes with Multiple Metal-to-Metal Bonds, Inorg.
Chem., Vol 14, No. 2 (1975)

237
80
Golyanov, V. M., Elesin, L. A., Mikheeva,M. N.: Preparation, superconducting
properties, and structure of technetium films. PismaZh. Eksp. Teor.Fiz.18, 569 (1973).
81
Vinogradov, I. V., Konarev,M. I., Zaitsev, L. L., Shepel’kov, S. V.: Technetium
nitrides. Russ. J. Inorg. Chem. 23, 1158 (1978).
82
Haeglund, J., Fernandez Guillermet, A., Grimvall, G., Kaerling, M.: Theory of bonding
in transition-metal carbides and nitrides. Phys. Rev. B. 48, 11685 (1993).
83
Almahamid, Ilham; Bryan, Jeffrey C.; Bucher, Jerome J.; Burrell, Anthony K.;
Edelstein, Norman M.; Hudson, Eric A.; Kaltsoyannis, Nikolas; Lukens, Wayne W.;
Nitsche, Heino; et al. Electronic and structural investigations of technetium compounds
by x-ray absorption spectroscopy. Inorganic Chemistry (1995), 34(1), 193-198.
84
F. Poineau, J. Du Mazaubrun, D. Ford, J. Fortner, J. Kropf, G. W. C. Silva, N. Smith,
K. Long, G. Jarvinen and K. Czerwinski; U/technetium separation for the UREX process
–synthesis and characterization of solid reprocessing forms. Radiochim. Acta (2008).
85
Poineau, Frederic; Sattelberger, Alfred P.;Conradson, Steven D.; Czerwinski, Kenneth
R. Octachloro- and octabromoditechnetate(III) and their rhenium(III) congeners.
Inorganic Chemistry (2008), 47(6), 1991-1999.
86
Schwochau, K. Technetium: Chemistry and Radiopharmaceutical. Applications;
Wiley-VCH: Weinheim, Germany, 2000. p298-315
87
V. F. Peretrukhin, F. Moisy, A. G. Maslennikov, M. Simonoff, A. Yu. Tsivadze, K. E.
German, F. David, B. Fourest, C. Sergeant, and M. Lecomte, Russian Journal of General
Chemistry, 2008, Vol. 78, No.5, pp. 1031- 1046.
88
Johnson, S.G.; Keiser, D.O.; Frank, S.M.; DiSanto, T.; Warren, A.A. Scientific Basis
for Nuclear Waste Management XXIII. Symposium (Materials Research Society
Symposium Proceedings VoI.608), Smith, RW; Shoesmith, OW. eds. (2000) p.589-94
89
Jeffrey A. Fortner, ' A. Jeremy Kropf, Robert J. Finch, and James C. Cunnane, Mat.
Res. Soc. Symp. Proc. Vol. 824, p. 107
90
V.I. Spitsyn, IVI.M. Kurtepov and A.A. Baru, Dokl. Akad. Nauk SSSR, Vol 229, pp.
673-675 91
Radiochim. Acta 91, 419–425 (2003)
92
A. Maslennikov, B. Fourest, F. David, and M. Masson, Electrochemical dissolution of
simulated “white inclusion” in nitric acid. Linear voltammetry study with Mo, Re, Ru
metals and their alloys electrodes, Radiochimica Acta 2003, v. 91, No.12, p. 761-768

238
93 Thermodynamic Model for the solubility of TcO2.xH2O (am) in the aqueous Tc(IV) –
Na+-Cl—H+-OH—H2O system Hess, Nancy J.; Xia, Yuanxian; Rai, Dhanpat;
Conradson, Steven D. From Journal of Solution Chemistry (2004), 33(2), 199-226
94Solubilities of technetium (IV) Meyer, R. E.; Arnold, W. D.; Case, F. I.; O'Kelley, G.
D. Radiochimica Acta (1991), 55(1), 11-18.
95
K. Cantrell, B. Williams, Solubility control of technetium release from saltstone by
TcO2xH2O, Journal of Nuclear Materials, 437 (2013) 424 – 431.
96
Atlas of Eh-pH diagrams, Intercomoparison of thermodynamic data

239
Curriculum Vitae
NAME: Edward Mausolf DATE: May 29, 2013
JOB TITLE: Post-Doctoral Researcher TOTAL YEARS RELEVANT
EXPERIENCE:
EDUCATION COMPLETED: High School Some College _X_ 4
Years or More of College
Degree: BA Major: Chemistry, UNLV Date
Completed: 2007
Degree: Ph. D. Major: Radiochemistry, UNLV
Date Completed: 2012
WORK EXPERIENCE:
December 2012 – Current
Pacific Northwest National Laboratory
Postdoctoral Researcher
May 2012 – September 2012
TerraPower – Bellevue, WA
Nuclear Scientist
Proprietary work. Primary efforts were related to waste form synthesis as related to the
travelling-wave reactor (TWR)
February 2006 – December 2012
University of Nevada, Las Vegas Nevada
Graduate Student
Nuclear separation and waste form development and characterization
February 2006 – December 2008
YMCA, Las Vegas, NV
Educational Volunteer
Math high school proficiency tutor/volunteer

240
June 2002 – February 2006
Southern Nevada Water Authority, Las Vegas, NV
Chemistry Intern (I-IV)
Water quality chemist and conservationist.
January 2005 – May 2005
PME Assay Labs, Reno, NV
Student Worker
Student worker – primary efforts related to preparation of samples for analysis of gold by
thermal reduction (weight analysis) and ICP techniques.
PUBLICATIONS: U.S.
1. Edward Mausolf, Maryline Ferrier, Frederic Poineau, Dave Kolman, Gordon
Jarvinen and Kenneth Czerwinski – On the corrosion behavior of Tc metal
exposed to aqueous environments – Electrochemica Acta In submission
2. Edward Mausolf, Janelle Droessler, Frederic Poineau, Patricia-Paviet Hartmann,
and Kenneth Czerwinski, Complexation and Extraction behavior of U/Tc in the
presence of excess Ascorbic Acid, Journal of Separation Science – In submission
3. Edward Mausolf, Frederic Poineau, William Ebert, Dave Kolman, Gordon
Jarvivnen and Kenneth Czerwinski – On the corrosion behavior of Tc containing
alloys – Electrochemica Acta, In submission
4. Gordon D. Jarvinen, Kristy M. Long, George S. Goff, Wolfgang H. Runde,
Edward J. Mausolf, Kenneth R. Czerwinski, Frederic Poineau, Daniel R.
McAlister, E. Philip Horwitz, Separation of Pertechnetate from Uranium in a
Simulated UREX Processing Solution Using Anion Exchange Extraction
Chromatography, Solvent Extraction, In submission, Accepted Jan 2013.
5. Edward Mausolf, Erik Johnstone, Suzanne Nguyen, Steven Jones, Frederic
Poineau, Edgar Buck and Kenneth Czerwinski, Production of Tc metal in 12M
HCl using Zn as a reductant, Accepted Feb 2013, International Journal of
Radioanalytical and Nuclear Chemistry
6. Frederic Poineau, Edward Mausolf, Gordon D. Jarvinen, Alfred P. Sattelberger,
and Kenneth R. Czerwinski Technetium chemistry in the fuel cycle: Combining
basic and applied studies, Inorg. Chem.; (2012) dx.doi.org/10.1021/ic3016468 |
Inorg. Chem
7. Edward Mausolf – Electrolysis: Electrodeposition of Technetium, InTech Open
Science Chapter Proposal Accepted Jan 2012
8. Edward Mausolf, Janelle Droessler, Frederic Poineau, Thomas Hartmann, and
Kenneth Czerwinski, Tetraphenylpyridinium Pertechnetate: A promising salt for
the immobilization of technetium. Radiochemica Acta, Jan 2012
241
9. P. Paviet-Hartmann, A. Wright, E. Mausolf, K. Campbell, F. Poineau Application
of formohydroxamic acid in nuclear processing, synthesis and complexation with
technetium-99,: Journal of Engineering for Gas Turbines and Power, Submitted
March 2011.
10. Mausolf, Edward; Poineau, Frederic; Droessler, Janelle; Czerwinski, Kenneth R.
Spectroscopic and structural characterization of reduced technetium species in
acetate media. Journal of Radioanalytical and Nuclear Chemistry (2011),
288(3), 723-728.
11. Mausolf, Edward; Poineau, Frederic; Hartmann, Thomas; Droessler, Janelle;
Czerwinski, Ken. Characterization of electrodeposited technetium on gold foil.
Journal of the Electrochemical Society (2011), 158(3), E32-E35.
12. McGregor, Donna; Burton-Pye, Benjamin P.; Howell, Robertha C.; Mbomekalle,
Israel M.; Lukens, Wayne W.; Bian, Fang; Mausolf, Edward; Poineau, Frederic;
Czerwinski, Kenneth R.; Francesconi, Lynn C. Synthesis, Structure Elucidation,
and Redox Properties of 99Tc Complexes of Lacunary Wells-Dawson
Polyoxometalates: Insights into Molecular 99Tc-Metal Oxide Interactions.
Inorganic Chemistry (Washington, DC, United States) (2011), 50(5), 1670-1681.
13. P. Paviet-Hartmann, E. Mausolf, A. Wright, K. Campbell, F. Poineau,
“Formohydroxamic acid in nuclear fuel reprocessing: Synthesis and complexation
with Technetium 99”, Paper 29028, Proceedings of the International Conference
ICONE 18, 17-21 MAY 2010, Xi’an, China
14. Edward Mausolf, Frederic Poineau, David Kolman, Gordon Jarvinen and Ken
Czerwinski, Corrosion Behavior of Technetium waste forms exposed to various
aqueous environments, NACE San Antonio March 2010
15. P. Paviet-Hartmann, A. Nuñez, F. Poineau, J. Pak, A. Wright, E. Mausolf, A. G.
Espartero, K. Czerwinski, Extraction of technetium as ([Tc(II)(NO)(AHA)2H2O]+
species in the UREX+ process, Proceedings of the International Conference
ICONE 17, Paper 75509, 12-16 JUL 2009, Brussels, Belgium
16. Notable Acknowledgement from undergraduate research Spangelo, Bryan L.;
Pompilius, Melissa; Farrimond, Derald D.; Stevens, Nicole; Nieva, Ria; Shroff,
Sachin; Badamchian, Mahnaz; Johnson, Charlene R.; Jarvis, W. David. Presence
of a peptide component of thymosin fraction-5 manifesting discrete
cytostatic properties in HL-60 human promyelocytic leukemia cells.
International Immunopharmacology (2005), 5(7-8), 1317-1329
Notable Presentations
1. Elution of Technetium from Anion Exchange Resins, Gordon Jarvinen, Doris K.
Ford, Kristy M. Long, Kenneth R. Czerwinski, Frederic Poineau, and Edward
Mausolf. Los Alamos National Laboratory, Los Alamos, NM, University of
Nevada, Las Vegas, Las Vegas, NV
2. Mausolf, Edward, Gong, Cynthia-May S., Poineau, Frederic, Czerwinski,
Kenneth R., Ford, Doris K., Jarvinen, Gordon, Long, Kristy M. “Elution of
Technetium from Anion Exchange Resins” ACS National Conference, New

242
Orleans, LA April 2008. , University of Nevada, Las Vegas, Las Vegas, NV, (2)
Los Alamos National Laboratory, Los Alamos, NM
3. Gong, Cynthia-May S, Poineau, Federic, Mausolf, Edward, Czerwinski, Kenneth
R. Lukens, Wayne. “Something new from something old: Acetohydroxamic acid
for complete and efficient separation of technetium from uranium using liquid-
liquid extraction” Atalante, Montpeller, France May 2008 Harry Reid Center for
Environmental Studies, University of Nevada ; Lawrence Berkeley National
Laboratory
4. Poineau, Frederic, Mausolf, Edward, Czerwinski, Kenneth R. “ Electrochemical
behavior of Metallic Technetium in Aqueous Solution.”, Montpeller, France May
2008
5. Mausolf, Edward, Poineau, Frederic, Czerwinski, Kenneth, Jarvinen, Gordon,
Ford, Doris, Long, Kristy. “Advanced Reduction Methods of Technetium –
Technetium Reduction: Coupled Ion Exchange Methods.” GNEP Waste Form and
Separations Meeting, Washing D.C. July 2008
6. Jarvinen, Gordon, Ford, Doris, Long, Kristy, Czerwinski, Kenneth, Poineau, and
Mausolf, Edward. “Technetium and Uranium Separation and Conversion for the
UREX Process.” ACS Regional Meeting, Las Vegas, NV September 2008
7. Czerwinski, Kenneth R., Poineau, Frederic, Mausolf, Edward, Du Mazaubrun,
Julie, Hartmann, Thomas, Ford, Doris, Jarvinen, Gordon D. “ Separation of
Uranium/Technetium for the UREX Process. Synthesis of Tc-Zr Waste Form.”
IST, Port Elizabeth, South Africa October 2008
8. Poineau, Frederic, Ferrier, Marily, Mausolf, Edward, Silva, Chinthaka G.W., and
Czerwinski, Kenneth R. “Electro-Dissolution of Metallic Technetium in Acidic
Media.” IST, Port Elizabeth, South Africa October 2008
9. Poineau, Frederic, Rodriguez, Efrain E., Sattleberger, Alfred P., Forester, Paul,
Hartmann, Thomas, Gong, Cynthia, Mausolf, Edward, Silva, Chinthaka G. W.,
Weck, Philippe, Jarvinen, Gordon D., Cheetham, Anthony K., and Czerwinski,
Kenneth R. “Technetium Chemistry at The University of Nevada, Las Vegas.”
IST, Port Elizabeth, South Africa October 2008
10. Jarvinen, Gordon, Long, Kristy, Kolman, Dave, Sickafus, Kurt, Valdez, James,
Czerwinski, Kenneth, Poineau, Frederic, and Mausolf, Edward. “Technetium
Recovery and Waste Form Development.” GNEP Waste Form and Separations
Annual Meeting, Idaho Falls, ID October 2008
11. G. Jarvinen,K . Long, D. Kolman, F. Poineau,E . Mausolf,K .
Czerwinski,"Technetium Separationsa nd Waste Form Development",3 3rd
Annual Actinide Separations Conference Tahoe City, CA May 2009
12. G. Jarvinen, K. Long, D. Kolman, F. Poineau E. Mausolf, K. Czerwinski,
"Application of Formohydroxamic Acid in Nuclear Processing: Synthesis and
Complexation with Technetium 99", 33rd Annual Actinide Separations
Conference Tahoe City, CA May 2009
13. P. Paviet-Hartmann, A. N. Gomez-Aleixandre, J. Pak, A.G. Espartero, F. Poineau,
A. Wright, E. Mausolf, and K. Czerwinski, “Extraction of Technteium as
[Tc(II)(NO)(AHA)2H2O)]+ species in the UREX Process”, Proceeding of the 17
th

243
International Conference on Nuclear Engineering (ICONE17) Brussels, Belgium
July 2009
14. E. Mausolf, F. Poineau, G. Jarvinen, K. Czerwinski, ‘Reduction products of
pertechnetate in the presence of borohydride’ ACS 238th
National Meeting
Washington DC August 2009
15. F. Poineau, E. Mausolf, T. Hartmann, G. Jarvinen and K. Czerwinski, Synthesis
and Characterization of Technetium Waste Forms for the UREX+ Process
Migration 2009
16. F. Poineau, E. Mausolf, T. Hartmann and K. Czerwinski “Electro-dissolution of
Metallic Techentium in Acidic Media” 216th
ECS Meeting Vienna, Austria
October 5th
2009
17. E. Mausolf, F. Poineau, T. Hartmann, K. Czerwinski, “Electrochemical
Characterization of Technetium Containing Wasteforms in Acidic Media” 216th
ECS Meeting, Vienna Austria October 5th
2009
18. P. Serrano, E. Mausolf, F. Poineau, T. Hartmann, D. Hattchet, K. Czerwinski,
“Electrochemical behavior of Tc-AHA and Tc-FHA as precursors for the
recovery of Tc metal as related to nuclear reprocessing” 216th
ECS Meeting
Vienna, Austria Oct 2009
19. 2 Posters to APSORC Nov 2009 Napa, CA, ”Synthesis and corrosion of Tc metal
in acidic media” and “Application of Aceto/Formohydroxamic Acid and Ascorbic
Acid in Nuclear Processing: Complexation and Characterization with
Technetium-99”
20. January 2010 - APS Poster on XAFS related to Tc work – Edward M., Frederic
P., Paul F., Dan R., and Bill K.
a. Submitted form evaluating future expectations and uses of the APS for
USERS that evaluate radioactive materials – E. Mausolf and F. Poineau
b. Presented Tc & XAFS at the use of synchrotron radiation workshop
21. Attended and presented at the Tc waste form working group 19 and 20 January
2010, UNLV and provided input for SOW to Metal Waste Form Working Group
on Fe-Mo-Tc and Tc-doped Fe solid-solution alloys
22. Corrosion of Tc and Tc containing alloys was presented at NACE in San Antonio;
D. Kolman, E. Mausolf, F. Poineau, K. Czerwinski March 2010. Publication in
NACE proceedings
23. Presented "Application of Ascorbic Acid and Complexation with Tc" at ACS San
Francisco, CA March 2010
24. Corrosion of Tc and Tc-bearing waste forms – DOE Waste Form Working Group
Meeting – ANL 12 April to 17 April 2010
25. American Nuclear Society, Las Vegas, NV 21 April 2010, “On the
electrodeposition of Tc metal”
26. Electrochemical Society Meeting, Vancouver, Canada – 26 April to 30 April
2010, “Structural Characterization of Electrodeposited Tc”
27. P. Paviet-Hartmann, A. Wright, E. Mausolf, K. Campbell, F. Poineau,
“Application of Formohydroxamic Acid in Nuclear Processing” Synthesis and

244
complexation with Tc-99”, Proceeding of the 18th
International Conference on
Nuclear Engineering (ICONE18) Xi’an, China May 2010
28. Attended and presented at Tc waste form meeting 18 July 2010 at INL
29. Presented at the DOE Annual Meeting (30 August 2010, Washington DC) for
UNLV’s contract work: Effect of Fe on Tc waste forms and initial synthesis,
characterization, and corrosion of these materials.
30. Presented at the 218th
ECS, “Electrochemical Corrosion of Tc Containing Waste
Forms” Oct 13, 2010 Las Vegas, NV
31. Attended and presented at the DOE Electrochemical Waste Forms Meeting held
at UNLV Oct 14, 2010
32. Presented at the DOE annual in Albuquerque, NM December 2010 “Tc containing
waste forms”
33. Waste Form working group meeting 23 February 2011 “Corrosion rate of the Iron
Solid Solutions alloys made at UNLV”
34. “Corrosion of Tc waste forms and the MoTc and FeTc binary alloys” NACE,
March 2011
35. DOE Metal Waste Form working group meeting presentation, LANL 25 August
2011
36. Presented for the DOE Innovative in Fuel Cycle Awards, ANL 01 Nov 2011
37. DOE Annual Meeting on the Nuclear Fuel Cycle, SRNL 03 November 2011
38. DOE Metal Waste Forms (MWF) working group meeting, UNLV Feb 2012
39. Corrosion behavior of Tc metal exposed to aqueous environments, ACS San
Diego March 2012
40. Internal Presentation, TerraPower August 2012
41. Corrosion behavior of Tc containing waste forms, Atalante, Montpelier, FR Sept
2012
42. Extraction and Separation of Tc in the presence of D,L-Ascorbic Acid, Atalante,
Montpellier, FR Sept 2012
43. Corrosion behavior of Tc containing waste forms – An Innovators Perspective,
American Nuclear Society, San Diego, November 2012 – Invited
44. A special topics session – Nuclear Waste Forms, DOE Recommendation Panel,
American Nuclear Society, San Diego, Nov 2012 – Invited
Awards/Acknowledgements/Schools/Other
1. University of Nevada, Las Vegas outstanding graduate student award winner
(May 2013)
2. DOE Nuclear Energy Fuel Cycle R&D Excellence Award recipient (Nov 2012)
3. 1st place winner in the open competition for the DOE Innovations in Fuel Cycle
Awards – Waste Forms, 2012
4. Terrapower Nuclear Scientist Intern 2012
5. Attendee to the innovators forum, Austin, TX hosted by DOE-NE
6. 2nd
place winner in the open competition for the DOE Innovations in Fuel Cycle
Awards – Waste Forms, April 2011

245
7. Co-Author on 3rd
place paper awarded paper for the DOE Innovations in Fuel
Cycle Awards – Separations and Waste Forms, 2010
8. University of Nevada, Las Vegas outstanding graduate student scholarship
nominee, Oct 2009
9. Summer School Student to the GE-Hitachi Summer School program on Gen IV
fast reactors and nuclear fuel cycle funded by DOE in collaboration with GE-
Hitachi, Wilmington, North Carolina August 2009.
Proposals and Contracts – Completed Works
1. Electrochemical Isolation of uranium from seawater – NEUP – $400,000
requested Jan 2013 (rejected)
2. Development of advanced concrete materials for dry cast storage – NEUP –
$775,000 requested Jan 2013 (rejected)
3. Evaluation of the electrochemical corrosion and leach behavior of an aluminum-
lithium target – requested Feb 2013
4. Electrochemical Modeling of Metal Waste Forms Containing Tc - $790,000 May
2012
5. Scope of Work (SOW), Epsilon Phase and Uranium Oxide Preparation – $25,000
Feb 2012
6. Scope of Work (SOW), Corrosion Modeling Effort - $50,000 Jan 2011
7. Scope of Work (SOW), Waste Form Preparation and Characterization - $86,000
April 2010
8. Completed NEUP Waste Form Task, 1/3rd
of project – Tc Waste Forms, Project
Value - $300,000, total value $900,000 Sept 2009 to Sept 2012 – Guidance
provided by Frederic Poineau and Kenneth Czerwinski
Teaching and Mentoring Experience
Mentored undergraduate Doug Woods, Edward Bylina, and Kimberly Gray
(DOE) for the Radiochemistry Fuel Cycle Summer School Program at the
University of Nevada Las Vegas, June 2011 to July 2011.
Mentored Undergraduate Suzanne Nguyen and Steven Jones for the
Radiochemistry Fuel Cycle Summer School Program, University of Nevada Las
Vegas, June 2010 to July 2010 working on dual projects related to Tc metallic
corrosion and isolation of Tc metal from aqueous solutions.
Mentored Undergraduate Janelle Droessler from February 2009 to June 2010
working on various projects from the separation of Tc from U by LLE and anion
exchange, synthesis of various Tc waste forms, and ultimately the publication of
papers through team effort.
University Tutor Physics, Chemistry, Mathematics Fall 2011 and Spring 2012
Organic Chemistry Laboratory I/II TA Spring and Fall 2008
General Chemistry Laboratory I TA Spring 2010
Nursing Chemistry Laboratory I/II TA Fall 2011 and Spring 2011

246
Teaching Assistant SAGE Program Summer 2008
Middle and High School Science Bowl Volunteer 2007 - 2011
CITIZENSHIP: U.S.


![AD-A251 006Recent discoveries of metallic conductivity in alkali metal doped C60 (11 and superconductivity in K3C60 [2] (Tc = 19 K) as well as Rb3C60 [3] (Tc = 28 K) have increased](https://static.fdocuments.us/doc/165x107/5fe8ea8d3b90563d62312d2d/ad-a251-006-recent-discoveries-of-metallic-conductivity-in-alkali-metal-doped-c60.jpg)