SHEPHERD HARDWARE PRODUCTS CATALOG • SHEPHERD HARDWARE PRODUCTS
Upload
archibald-franklinCategory
view
214download
0
sendplot
Lori Shepherd
April 06, 2009

sendplotThe Problem:
The Approach:
How can we quickly generate useful data and get it back to scientists/collaborators with minimal
requirements/effort on their end?
We have developed an R package called sendplot based on Dr. Sucheston’s visualization demo given
on September 4, 2007
What is sendplot?
sendplot generates an interactive layout of plots.
each plot may be interactive or static
What is meant by interactivity is that information specific to a point or image region is displayed when the mouse scrolls over the area
A png file and an html file are sent to end user; it can be sent to and run on any machine with a web browser that has javascript capabilities

End ResultResult is two files:
1. png file2. html file
The researcher/collaborator need only to openthe html file in order to have an interactive graphto view data.
It can be customized on the programmers end to show any data the researcher requests or would find useful

System Requirementsfor Programmer
1. R www.r-project.org/
2. libtiff www.libtiff.org/
All system requirements are free for download
A version of this software that will no longer need system requirements, except R, is being created. Please check future releases.
Previous versions of this software, available on CRAN, do not require system requirements except for R. The functionality is limited to only one plot in the layout being interactive, while the other plots of the layout are static. It also may require more steps for the user.
Main sendplot functions
• initSplot : this function creates an object of the type ’Splot’ which holds all information to generate a static layout of plots.
• makeImap : this function adds image mapping information to the Splot object to allow for figure interactivity.
• makeSplot : this function produces an interactive (or static) layout of plots.

Wrappers Functions• xy.send : this function produces an interactive xy plot without any additional plots (i.e., just a single scatter-plot).
• imagesend : this function produces an interactive image plot without any additional plots (i.e., just a single image plot).
• heatmap.send : this function is a wrapper for the R stats package heatmap. This will create an interactive heatmap image. NOTE: The majority of the code for this function is verbatim from the R package stats heatmap function. This function was designed to work as a wrapper to utilize the same functionality and plotting as the heatmap function with sendplot’s interactive functionality.
Object Oriented Approach
sendplot takes on an object oriented feel:
• creating an object (initSplot)• manipulating the object (makeImap)• acting on the object to display contents (makeSplot)
Let’s look at sendplot functions a little more closely...

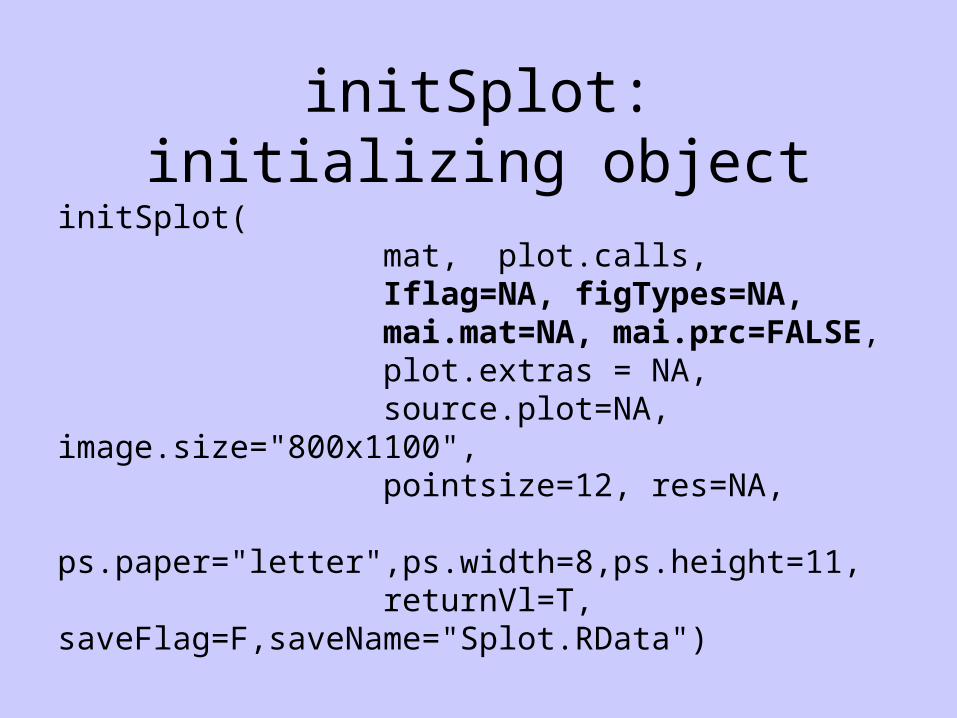
initSplot: initializing object
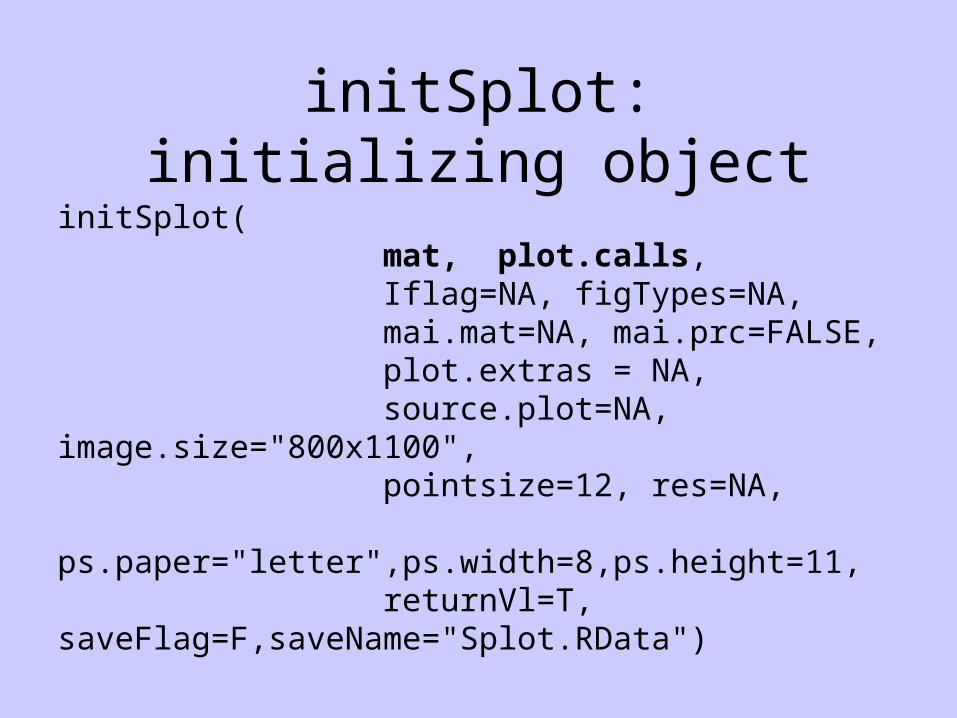
initSplot( mat, plot.calls, Iflag=NA, figTypes=NA, mai.mat=NA, mai.prc=FALSE, plot.extras = NA, source.plot=NA, image.size="800x1100", pointsize=12, res=NA, ps.paper="letter",ps.width=8,ps.height=11, returnVl=T, saveFlag=F,saveName="Splot.RData")
initSplot: initializing object
initSplot( mat, plot.calls, Iflag=NA, figTypes=NA, mai.mat=NA, mai.prc=FALSE, plot.extras = NA, source.plot=NA, image.size="800x1100", pointsize=12, res=NA, ps.paper="letter",ps.width=8,ps.height=11, returnVl=T, saveFlag=F,saveName="Splot.RData")

How it works:initSplot argument mat determines the layout of the plots using R’s layout function.mat is a numeric matrix with numbers 1:number of desired plots.0 indicates area with no plot
4 4 4 4 4 4 4 4 0 0 0 0 04 4 4 4 4 4 4 4 0 0 0 0 01 1 1 1 1 1 1 1 3 3 3 3 31 1 1 1 1 1 1 1 3 3 3 3 31 1 1 1 1 1 1 1 3 3 3 3 31 1 1 1 1 1 1 1 3 3 3 3 31 1 1 1 1 1 1 1 3 3 3 3 31 1 1 1 1 1 1 1 3 3 3 3 32 2 2 2 2 2 2 2 3 3 3 3 32 2 2 2 2 2 2 2 3 3 3 3 32 2 2 2 2 2 2 2 3 3 3 3 32 2 2 2 2 2 2 2 3 3 3 3 3

How it works:plot.calls is a character vector with the plot call that will be executed
plot.calls = c( "boxplot(count ~ spray, data = InsectSprays, col = 'lightgray')",
"plot(1:3,1:3, col='blue', xlab='', ylab=''); points(1:2, 2:3, col='red')",
"image(1:2,1:3, z=matrix(myX,ncol=3,nrow=2), xlab='', ylab='')",
"plot(cos, xlim = c(-pi,3*pi), n = 1001, col = 'blue', xlab='', ylab='')"
you can combined calls with a semicolon
“plot(1:3,1:3, col='blue', xlab='', ylab=''); points(1:2, 2:3, col='red')"

initSplot: initializing object
initSplot( mat, plot.calls, Iflag=NA, figTypes=NA, mai.mat=NA, mai.prc=FALSE, plot.extras = NA, source.plot=NA, image.size="800x1100", pointsize=12, res=NA, ps.paper="letter",ps.width=8,ps.height=11, returnVl=T, saveFlag=F,saveName="Splot.RData")
Let’s look at an example...

plot.extras argument
Based on previous plot.calls, the rectangles in the box plot, the polygon in the scatterplot, and all plot titles (A,B,C,D) have not been drawn. How are these added?
plot.extras=list(
figure1= "rect(xleft=c(3,1), ytop=c(25,5),xright=c(4,2), ybottom=c(20,0)); title(main='A', cex=3)",
figure2=list(c("polygon(x=c(2,2.5,3,2.5), y=c(1,2.5,1,1.5))"), c("title(main='B', cex=3)")),
figure3 ="title(main='C', cex=3)",
figure4="title(main='D', cex=3)“)
initSplot: initializing object
initSplot( mat, plot.calls, Iflag=NA, figTypes=NA, mai.mat=NA, mai.prc=FALSE, plot.extras = NA, source.plot=NA, image.size="800x1100", pointsize=12, res=NA, ps.paper="letter",ps.width=8,ps.height=11, returnVl=T, saveFlag=F,saveName="Splot.RData")
Now what...
Now we have initialized an object, ‘Splot’. The object, atthis point, contains information to make a static layout of plots.
If the user wishes to add interactive capabilities, data needsto be added to the Splot object through makeImap
If the user just wants a static layout of plots, the user mayuse the makeSplot function on the Splot object.

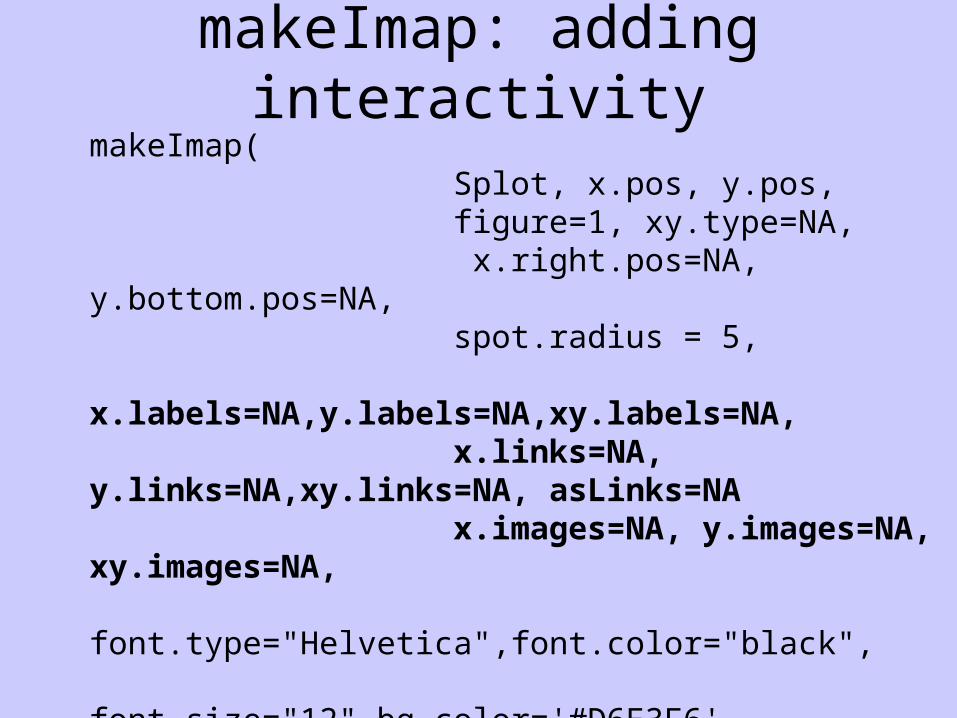
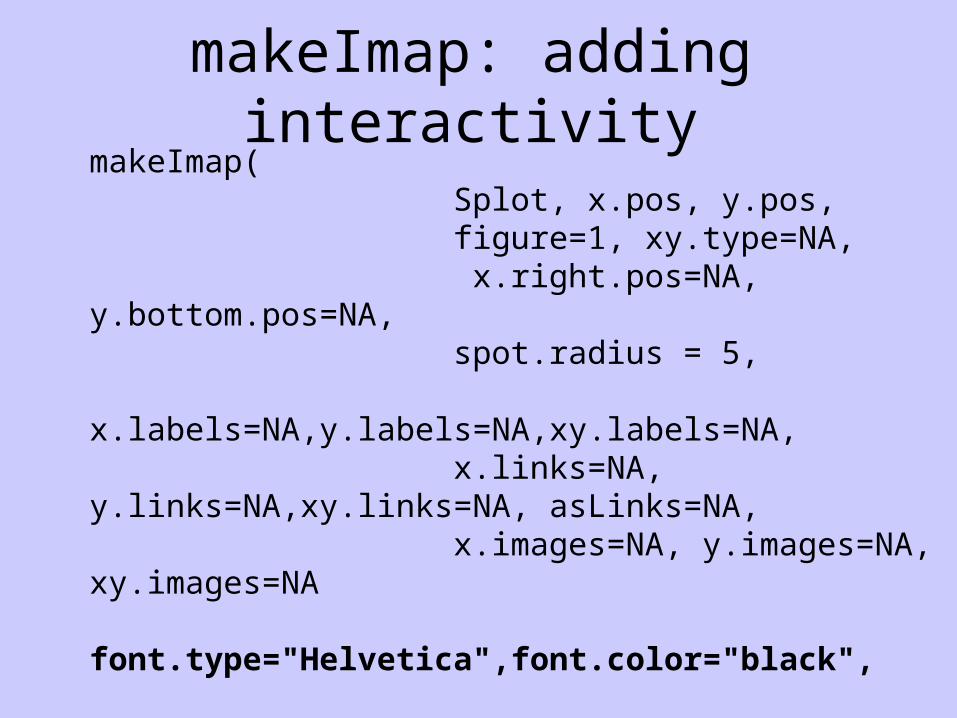
makeImap: adding interactivitymakeImap( Splot, x.pos, y.pos, figure=1, xy.type=NA, x.right.pos=NA, y.bottom.pos=NA, spot.radius = 5, x.labels=NA,y.labels=NA,xy.labels=NA, x.links=NA, y.links=NA,xy.links=NA, asLinks=NA, x.images=NA, y.images=NA, xy.images=NA, font.type="Helvetica",font.color="black", font.size="12",bg.color='#D6E3F6', fname.root="Splot",dir="./", automap=TRUE,automap.method="mode", bb.clr=NA,bb.cex=2, returnVl=T,saveFlag=F,saveName="Splot.RData“, cleanDir=T)
makeImap: adding interactivitymakeImap( Splot, x.pos, y.pos, figure=1, xy.type=NA, x.right.pos=NA, y.bottom.pos=NA, spot.radius = 5, x.labels=NA,y.labels=NA,xy.labels=NA, x.links=NA, y.links=NA,xy.links=NA, asLinks=NA x.images=NA, y.images=NA, xy.images=NA, font.type="Helvetica",font.color="black", font.size="12",bg.color='#D6E3F6', fname.root="Splot",dir="./", automap=TRUE,automap.method="mode", bb.clr=NA,bb.cex=2, returnVl=T,saveFlag=F,saveName="Splot.RData“, cleanDir=T)
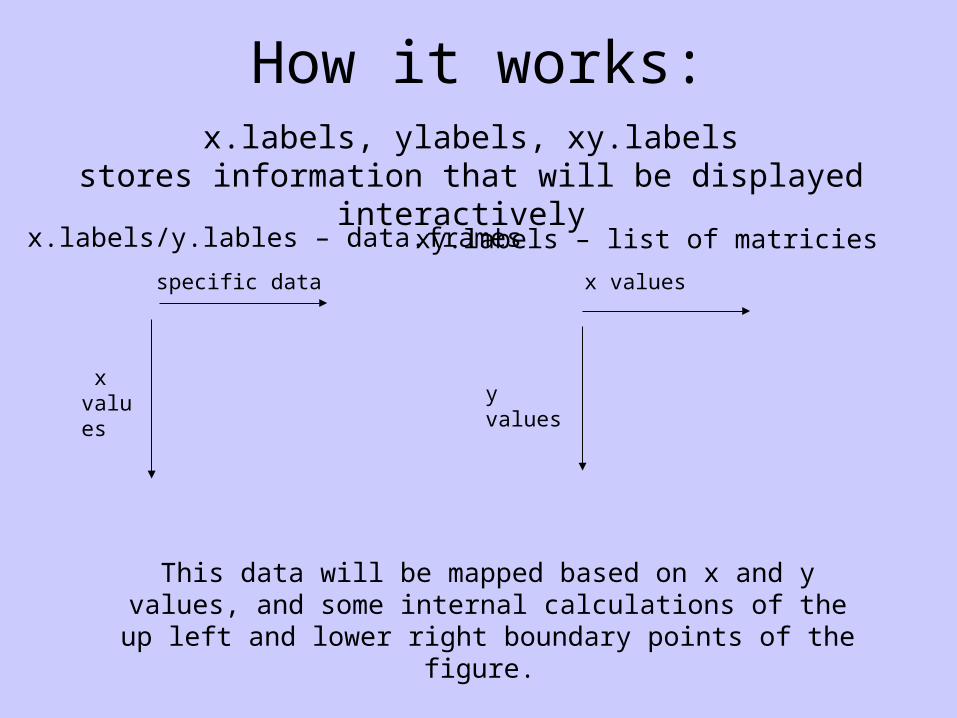
How it works:x.labels, ylabels, xy.labels
stores information that will be displayed interactively
x values
specific data
x.labels/y.lables – data.frames xy.labels – list of matricies
yvalues
x values
This data will be mapped based on x and y values, and some internal calculations of the up left and lower right boundary points of the
figure.
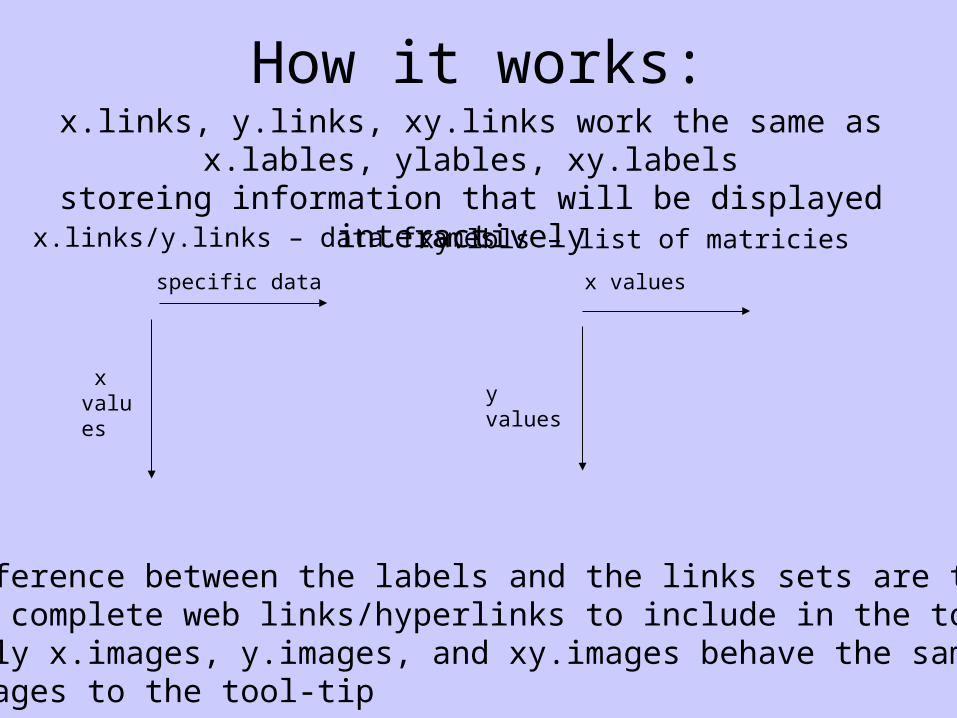
How it works:x.links, y.links, xy.links work the same as x.lables, ylables,
xy.labelsstoreing information that will be displayed interactively
x values
specific data
x.links/y.links – data.frames xy.lbls – list of matricies
yvalues
x values
The difference between the labels and the links sets are the links contain complete web links/hyperlinks to include in the tool tip; Similarly x.images, y.images, and xy.images behave the same but add images to the tool-tip

How it works:
It is also possible for the interactive points to be links themselves.
This is controlled with the asLinks argument.

makeImap: adding interactivitymakeImap( Splot, x.pos, y.pos, figure=1, xy.type=NA, x.right.pos=NA, y.bottom.pos=NA, spot.radius = 5, x.labels=NA,y.labels=NA,xy.labels=NA, x.links=NA, y.links=NA,xy.links=NA, asLinks=NA, x.images=NA, y.images=NA, xy.images=NA, font.type="Helvetica",font.color="black", font.size="12",bg.color='#D6E3F6', fname.root="Splot",dir="./", automap=TRUE,automap.method="mode", bb.clr=NA,bb.cex=2, returnVl=T,saveFlag=F,saveName="Splot.RData“, cleanDir=T)

The following need to be taken into account when determining the upper left and low right boundary coordinates
1. Operating System (windows, linux)
2. Graph type (scatter, image)
3. File type (ps, png)
a. ps width and heightb. resize
All calculations are made within the function. Programmerdoes not have to be concerned
Inner workings:

makeImap: adding interactivitymakeImap( Splot, x.pos, y.pos, figure=1, xy.type=NA, x.right.pos=NA, y.bottom.pos=NA, spot.radius = 5, x.labels=NA,y.labels=NA,xy.labels=NA, x.links=NA, y.links=NA,xy.links=NA, asLinks=NA, x.images=NA, y.images=NA, xy.images=NA font.type="Helvetica",font.color="black", font.size="12",bg.color='#D6E3F6', fname.root="Splot",dir="./", automap=TRUE,automap.method="mode", bb.clr=NA,bb.cex=2, returnVl=T,saveFlag=F,saveName="Splot.RData“, cleanDir=T)

Some example tool-tips...
these are the same tool-tips that are generated in the vignette exampleand utilized in the example that can be downloaded from the sendplot home page off the
University at Buffalo Biostatistics research software page
This is default setting.
font.type="Helvetica“font.color="black“font.size="12“bg.color='#D6E3F6'
font.type=“arial“font.color=“hotpink“font.size=“20“bg.color=“blue”
font.type="Helvetica“font.color=“cyan“font.size="15“bg.color=‘black'

Some example tool-tips...
these are the same tool-tips that are generated in the vignette exampleand utilized in the example that can be downloaded from the sendplot home page off the
University at Buffalo Biostatistics research software page
Notice the transparencyby using empty string
font.type=“arial“font.color=“green“font.size=“14“bg.color=“”
font.type=“sans-serif“font.color=“purple“font.size=“30“bg.color='#D6E3F6'

makeImap: adding interactivitymakeImap( Splot, x.pos, y.pos, figure=1, xy.type=NA, x.right.pos=NA, y.bottom.pos=NA, spot.radius = 5, x.labels=NA,y.labels=NA,xy.labels=NA, x.links=NA, y.links=NA,xy.links=NA, asLinks=NA, x.images=NA, y.images=NA, xy.images=NA, font.type="Helvetica",font.color="black", font.size="12",bg.color='#D6E3F6', fname.root="Splot", dir="./", automap=TRUE,automap.method="mode", bb.clr=NA,bb.cex=2, returnVl=T, saveFlag=F, saveName="Splot.RData“, cleanDir=T)

Now what...
Now we have initialized an object, ‘Splot’.
Added data to the Splot object for interactivity through makeImap
Now it time to make the files that will be send to end user

makeSplot
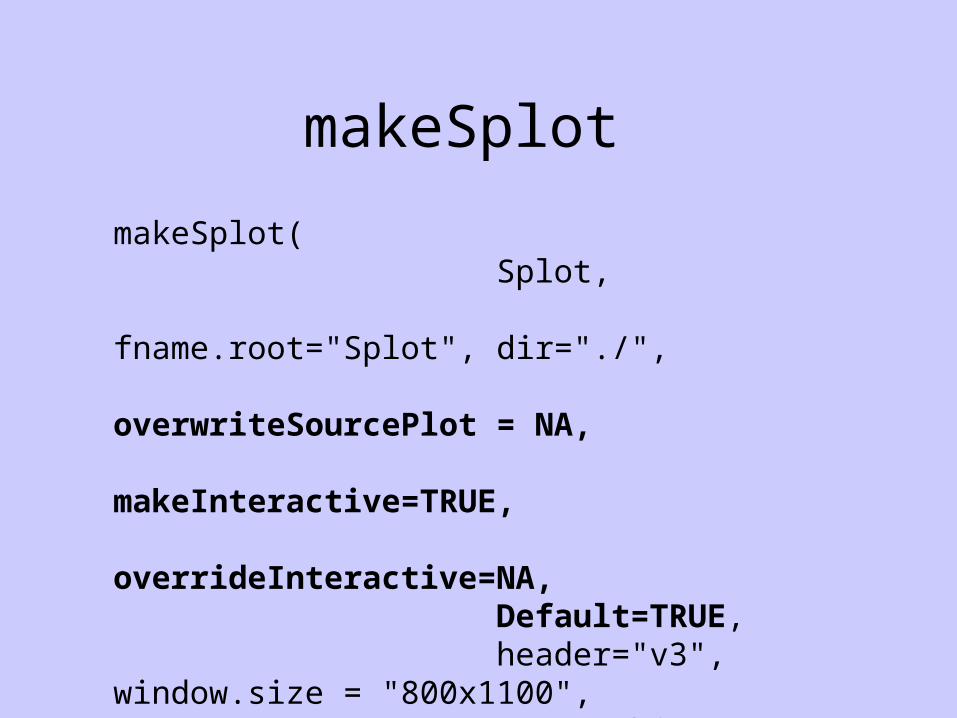
makeSplot( Splot, fname.root="Splot", dir="./", overwriteSourcePlot = NA, makeInteractive=TRUE, overrideInteractive=NA, Default=TRUE, header="v3", window.size = "800x1100", returnObj = FALSE, getLims=FALSE)
makeSplot
makeSplot( Splot, fname.root="Splot", dir="./", overwriteSourcePlot = NA, makeInteractive=TRUE, overrideInteractive=NA, Default=TRUE, header="v3", window.size = "800x1100", returnObj = FALSE, getLims=FALSE)

makeSplot
makeSplot( Splot, fname.root="Splot", dir="./", overwriteSourcePlot = NA, makeInteractive=TRUE, overrideInteractive=NA, Default=TRUE, header="v3", window.size = "800x1100", returnObj = FALSE, getLims=FALSE)

Screenshot of HTML

Wrappers Functions• xy.send : this function produces an interactive xy plot without any additional plots (i.e., just a single scatter-plot).
• imagesend : this function produces an interactive image plot without any additional plots (i.e., just a single image plot).
• heatmap.send : this function is a wrapper for the R stats package heatmap. This will create an interactive heatmap image. NOTE: The majority of the code for this function is verbatim from the R package stats heatmap function. This function was designed to work as a wrapper to utilize the same functionality and plotting as the heatmap function with sendplot’s interactive functionality.

See vignette for some additional functions and other examples

So...Result is two files:
1. png file2. html file
The researcher/collaborator need only to openthe html file in order to have an interactive graphto view data.
It can be customized on the programmers end to show any data the researcher requests or would find useful
Additional files may have been created, however only the main html file and png file are needed
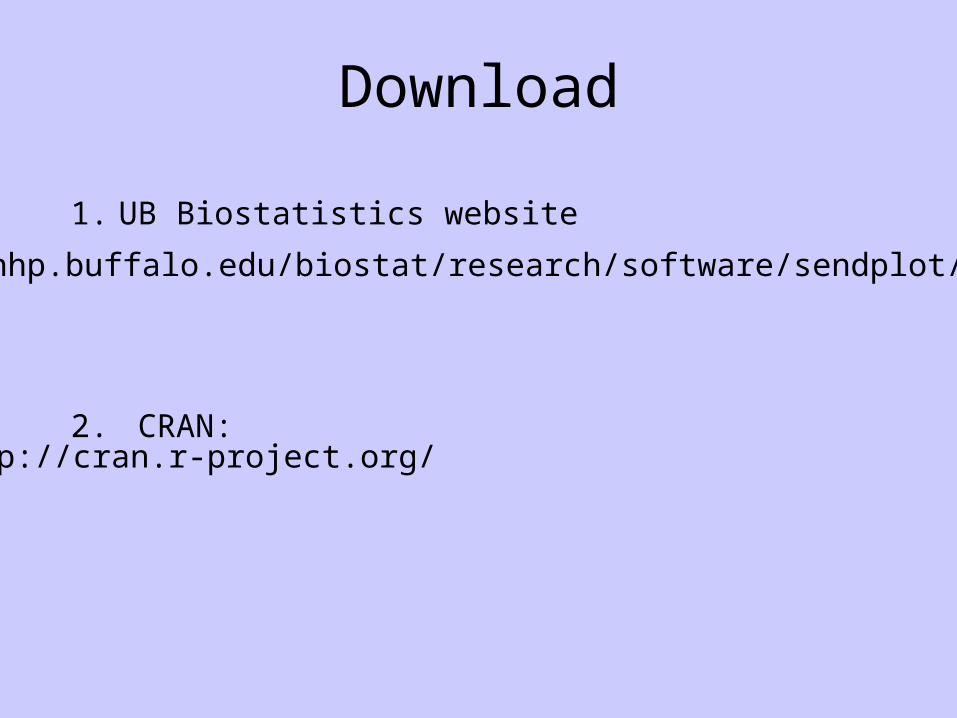
Download
1. UB Biostatistics website
2. CRAN:
http://sphhp.buffalo.edu/biostat/research/software/sendplot/index.php
http://cran.r-project.org/

Up and Coming
Improvements we are implementing in future version releases:
• add option for multiple tool-tip display
See Also
A Bioinformatics wrapper has been created :
iGenomicViewer
available for download from the University at Buffalo Biostatistics research software page
creates an interactive layout of plots for ANY genomic data

Acknowledgments
• Andrew Bruno
• Lara Sucheston
• Kenneth Manly
• Dan Gaile