Self-employment Working Tax Credits claimant survey and qualitative follow up research ·...
77
1 Self-employment Working Tax Credits Claimant Survey and Qualitative Follow-up Research Trinh Tu, Alex Bollen (Ipsos-MORI) and Simon Pannell (DWP) September 2017
Transcript of Self-employment Working Tax Credits claimant survey and qualitative follow up research ·...
1
Self-employment Working Tax Credits Claimant Survey and Qualitative Follow-up Research Trinh Tu, Alex Bollen (Ipsos-MORI) and Simon Pannell (DWP)
September 2017
2
DWP ad hoc research report no. 54 A report of research carried out by IPSOS-MORI on behalf of the Department for Work and Pensions.
© Crown copyright 2017. You may re-use this information (not including logos) free of charge in any format or medium, under the terms of the Open Government Licence. To view this licence, visit http://www.nationalarchives.gov.uk/doc/open-government-licence/or write to the Information Policy Team, The National Archives, Kew, London TW9 4DU,or email: [email protected]. This document/publication is also available on our website at: https://www.gov.uk/government/collections/research-reports If you would like to know more about DWP research, please email: [email protected] First published 2017. ISBN 978-1-78425-962-4 Views expressed in this report are not necessarily those of the Department for Work and Pensions or any other Government Department.

3
Contents
Slide 4 – Executive summary Slide 11 – Background and methodology Slide 17 – Characteristics of self-employed Working Tax Credit (WTC) claimants and routes into self-employment Slide 27 - The nature of self-employed work carried out by self-employed Working Tax Credit claimants Slide 33 - Self-employed work patterns and income Slide 46 - Business administration, expectations and plans

4
Executive summary
Policy Background Universal Credit is revolutionising the welfare system by making work pay. The design and structure of Universal Credit is transformational, it focuses on replicating the world of work, encouraging claimants to take greater responsibility for their finances and incentivising them to earn more and progress in work. At the same time Universal Credit provides support for people who can’t work or need help moving towards the labour market. Universal Credit is already transforming lives and evidence shows people are moving into work faster and working longer with Universal Credit than under the old system. Rollout Universal Credit is now available in every Jobcentre across the country, covering all Local Authorities, and supported by 22 Service Centres. UC is being introduced gradually, and was initially introduced from April 2013 in certain areas of the North West, known as Pathfinder sites. Initial eligibility criteria focused on single, unemployed, non-home-owning claimants without any children. In February 2015 the service started national rollout to new single unemployed claimants across Great Britain. By April 2016 Universal Credit was available for new claims from single unemployed claimants in all jobcentres across the country and also for couples and families in 96 sites across the North West of England. This phase of UC rollout was known as UC Live service. In May 2016 DWP started expansion of Universal Credit to a wider range of claimants. As with the rollout to single jobseekers, DWP have been doing this in a gradual, safe and secure way and the new Full Service is now available in 101 jobcentres around the country. From October 2017 DWP will begin to scale up to more than 50 jobcentres a month and the intention is that all cases are migrated, and a full service is available nationally, by March 2022. After the expansion process is complete, we will begin migrating claimants on other benefits to the Universal Credit full service from July 2019.
5
Executive summary
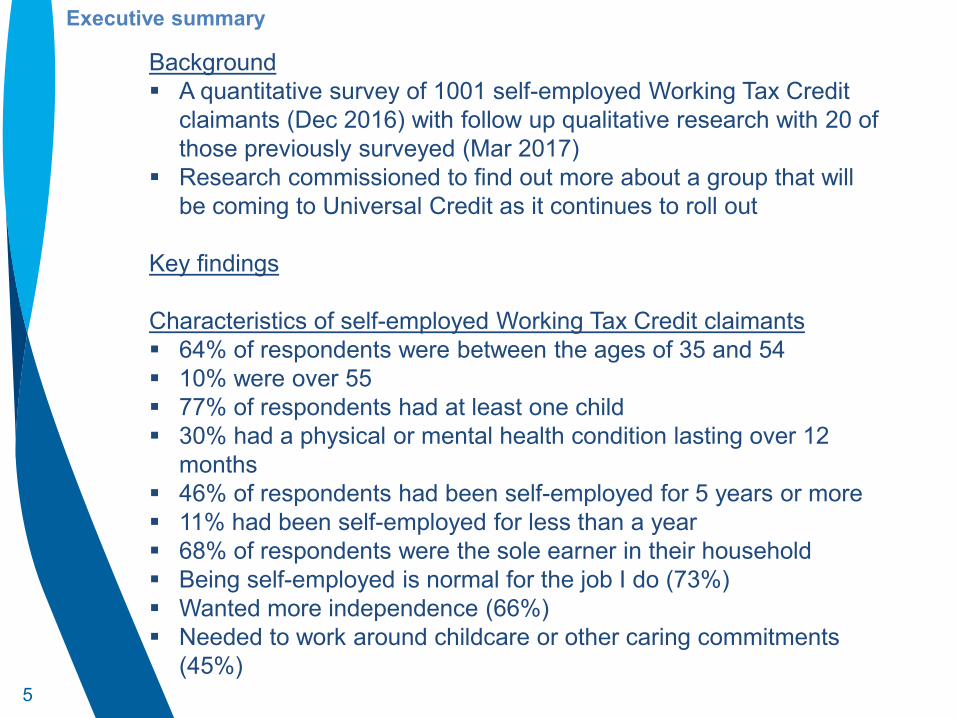
Background A quantitative survey of 1001 self-employed Working Tax Credit
claimants (Dec 2016) with follow up qualitative research with 20 of those previously surveyed (Mar 2017)
Research commissioned to find out more about a group that will be coming to Universal Credit as it continues to roll out
Key findings Characteristics of self-employed Working Tax Credit claimants 64% of respondents were between the ages of 35 and 54 10% were over 55 77% of respondents had at least one child 30% had a physical or mental health condition lasting over 12
months 46% of respondents had been self-employed for 5 years or more 11% had been self-employed for less than a year 68% of respondents were the sole earner in their household Being self-employed is normal for the job I do (73%) Wanted more independence (66%) Needed to work around childcare or other caring commitments
(45%)
6
Executive summary
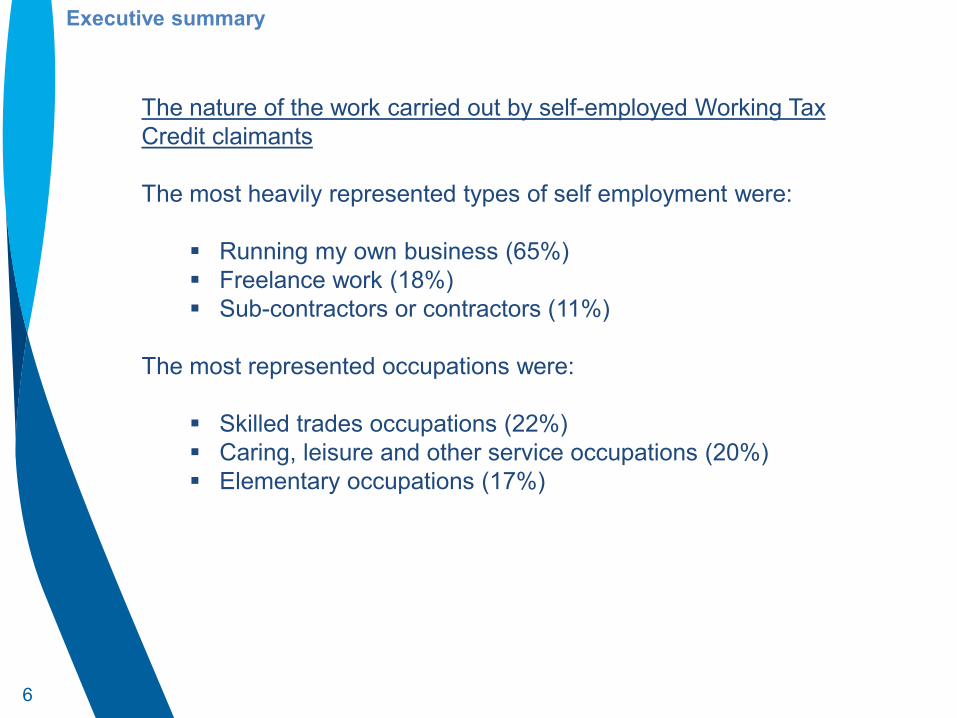
The nature of the work carried out by self-employed Working Tax Credit claimants
The most heavily represented types of self employment were:
Running my own business (65%) Freelance work (18%) Sub-contractors or contractors (11%)
The most represented occupations were:
Skilled trades occupations (22%) Caring, leisure and other service occupations (20%) Elementary occupations (17%)
7
Executive summary
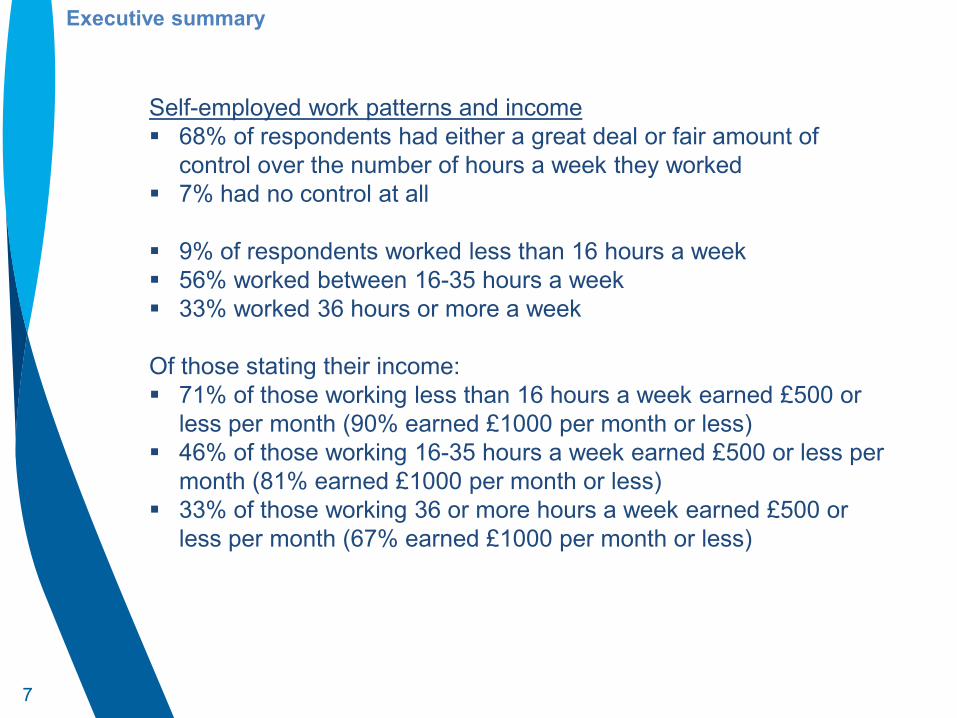
Self-employed work patterns and income 68% of respondents had either a great deal or fair amount of
control over the number of hours a week they worked 7% had no control at all
9% of respondents worked less than 16 hours a week 56% worked between 16-35 hours a week 33% worked 36 hours or more a week
Of those stating their income: 71% of those working less than 16 hours a week earned £500 or
less per month (90% earned £1000 per month or less) 46% of those working 16-35 hours a week earned £500 or less per
month (81% earned £1000 per month or less) 33% of those working 36 or more hours a week earned £500 or
less per month (67% earned £1000 per month or less)

8
Executive summary
Self-employed work patterns and income Of respondents reporting regular net monthly income 79% earned
£1000 or less per month 77% of respondents reporting variable monthly income earned
£12000 or less per year Of those who worked for more than 36 hours or more per week
37% earned £500 or less per month 38% of those who worked for more than 36 hours a week earned
between £501-£1000 per month Of respondents reporting varying net monthly income, 26% had
income that usually varied by within £100 each month 17% had income that varied within £200 12% had income that varied within £300 each month
9
Executive summary
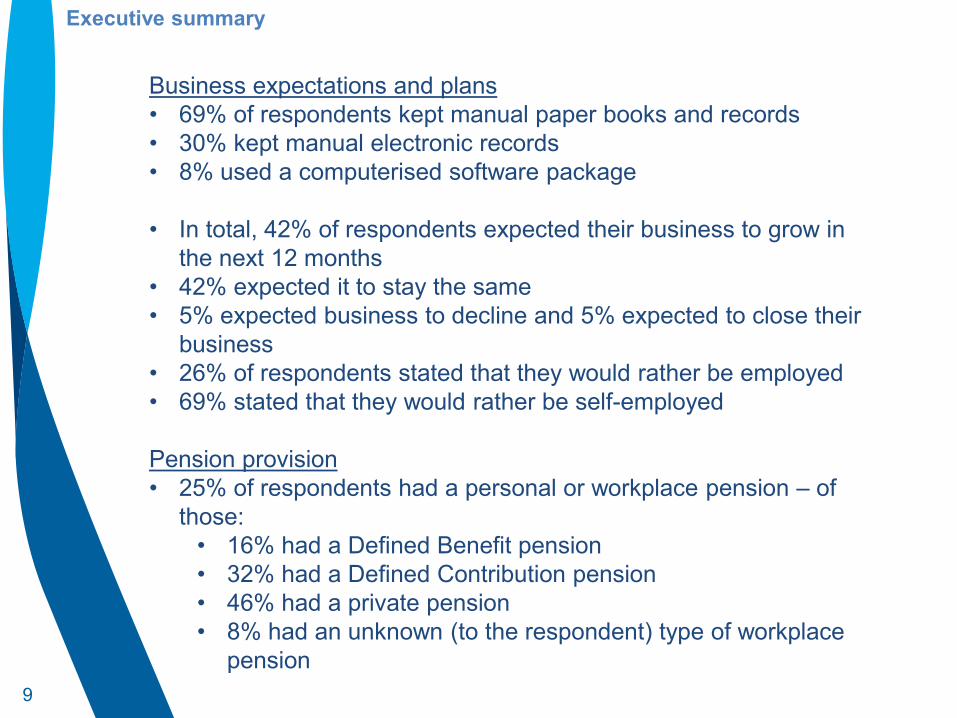
Business expectations and plans • 69% of respondents kept manual paper books and records • 30% kept manual electronic records • 8% used a computerised software package • In total, 42% of respondents expected their business to grow in
the next 12 months • 42% expected it to stay the same • 5% expected business to decline and 5% expected to close their
business • 26% of respondents stated that they would rather be employed • 69% stated that they would rather be self-employed
Pension provision • 25% of respondents had a personal or workplace pension – of
those: • 16% had a Defined Benefit pension • 32% had a Defined Contribution pension • 46% had a private pension • 8% had an unknown (to the respondent) type of workplace
pension
10
Main body of report
11
Background & Methodology
The project was conducted in two parts: the first, a survey with
1001 responses and the second a qualitative follow up to further explore the key findings and questions emerging from the survey. We will refer to both parts of the project throughout the report to give a full account of the experiences of the participants
Please be aware that the two parts of the research use very different methodologies, as a result the qualitative evidence cannot be regarded as representative of the general self-employed Working Tax Credit claimant population

12
Self-employed WTC survey - Methodology
Quantitative survey of self-employed Working Tax Credit (WTC)
claimants on a range of topics including income and business plans and expectations – fieldwork conducted by Ipsos-MORI between 8-23 Dec 2016
15 minute telephone interviews with self-employed WTC claimants across the country conducted by the contractor’s field interviewers – 1001 achieved interviews
Survey findings have been weighted for non-response using a population profile based on age, gender and number of children of existing self-employed Working Tax Credit claimants
The survey evidence was drawn from the current population of self-employed WTC claimants and broadly matches existing HMRC data on Working Tax Credit claimants

13
For the purpose of the survey respondents were defined as self-employed if they were either in receipt of Working Tax Credits (or Universal Credit (UC) if no longer in receipt of WTC) And they were either: Running their own business Doing freelance work A sub-contractor or contract worker Working through an agency Employed on a zero hours contract Self-employed in some other way An employee with a contract of employment And responsible for their own Tax and/or NI payments
How self-employed people were defined in the survey

14
Qualitative research methodology
Ipsos-MORI undertook qualitative research with self-employed people in receipt of Working Tax Credits (WTC). The aims of the research were to explore:
Circumstances and factors which have led to self-employment
Factors determining self-employed people’s ability and willingness to expand their business, hours and income
Ability to meet the requirement to report income and expenses on a monthly basis
Understanding of, and reactions to, Universal Credit and the Minimum Income Floor (MIF)
A total of 20 telephone depth interviews were undertaken with self-employed people claiming WTC as shown on the following page. Participants had previously taken part in a quantitative survey on self-employment in December 2016. The qualitative research fieldwork took place in March 2017.
15
Who took part in the qualitative research?
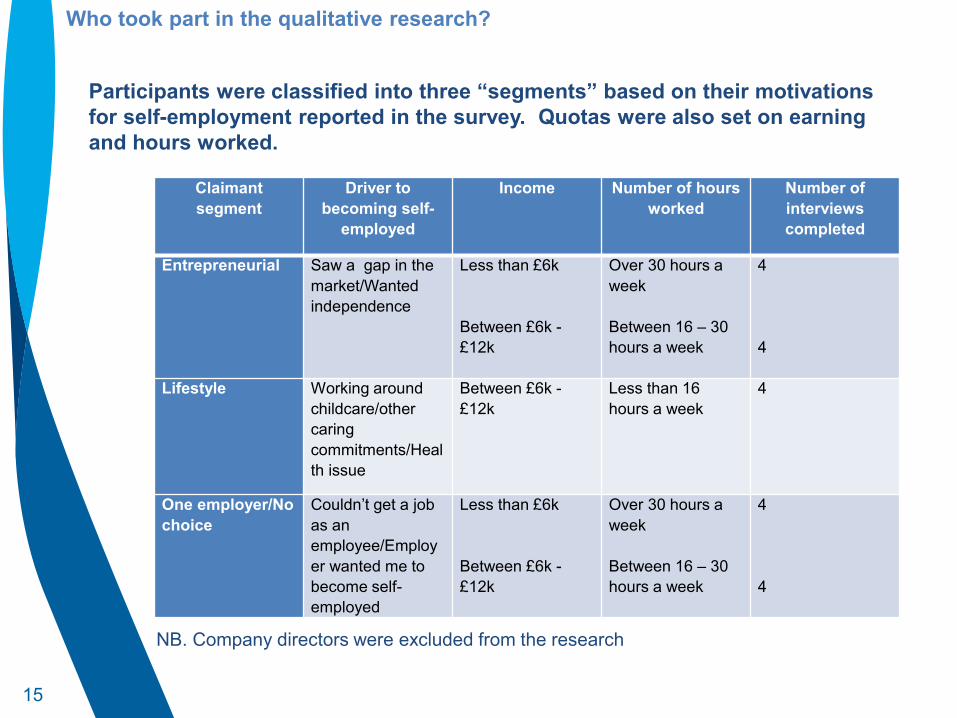
Participants were classified into three “segments” based on their motivations for self-employment reported in the survey. Quotas were also set on earning and hours worked.
NB. Company directors were excluded from the research
Claimant segment
Driver to becoming self-
employed
Income Number of hours worked
Number of interviews completed
Entrepreneurial Saw a gap in the market/Wanted independence
Less than £6k Between £6k - £12k
Over 30 hours a week Between 16 – 30 hours a week
4 4
Lifestyle Working around childcare/other caring commitments/Health issue
Between £6k - £12k
Less than 16 hours a week
4
One employer/No choice
Couldn’t get a job as an employee/Employer wanted me to become self-employed
Less than £6k Between £6k - £12k
Over 30 hours a week Between 16 – 30 hours a week
4 4
16
A note on interpreting qualitative research findings
This research was based on qualitative research; a method which aims to explore views and attitudes, and the underlying reasons views are held. While qualitative research helps to uncover the range of views held across a group of people, and the factors driving these views, it does not provide a precise indicator of the extent to which a certain view is held across a population. In this report, as far as possible, the extent to which a view or opinion was expressed across the 20 participants is provided to give a sense of the extent to which that view was commonly shared or not. This is illustrated by writing, for example, “a few”, “many”, “some”, and “a couple”. Verbatim quotes are used to demonstrate a viewpoint expressed during the depth interviews in the participant’s own words. In order to protect the anonymity of the participant, only general information is disclosed.
17
Characteristics of self-employed WTC claimants and routes into self-employment

18
• 64% of respondents were between the ages of 35 and 54 • 10% were over 55 • 77% of respondents had at least one child • 30% had a physical or mental health condition lasting over 12
months
0
50
100
150
200
250
300
350
400
18 to 34 35-44 45 to 54 55+
Age
0100200300400500600700800
Total Male Female
Do you have a physical or mental health condition lasting over 12
months?
Yes No
Base : All participants
Base : All participants
Age and health characteristics from the survey

19
Base : Participants reporting a long term health condition and income
In total, 30% of respondents reported a long-term physical or mental health condition lasting over 12 months:
• Of those, 50% earned £500 net or
less per month • 80% earned £1000 net or less per
month
Respondents reporting a long-term health condition reported lower net monthly income: 80% of those reporting a long-term health condition reported earning £1000 or less per month, compared to 75% of those not reporting a long-term health condition.
Respondents reporting a long-term health condition also reported greater uncertainty in net monthly income amounts: A comparison of net monthly income variation of respondents with and without a long-term health condition showed differences in: • Those receiving regular net monthly income
(10% v 17%) • Those receiving uncertain amounts of net
monthly income (73% v 56%)
0
20
40
60
80
100
120
140
160
£500 or less £501-£1,000 £1,001 - £2,000 More than £2000
20
Base : All participants
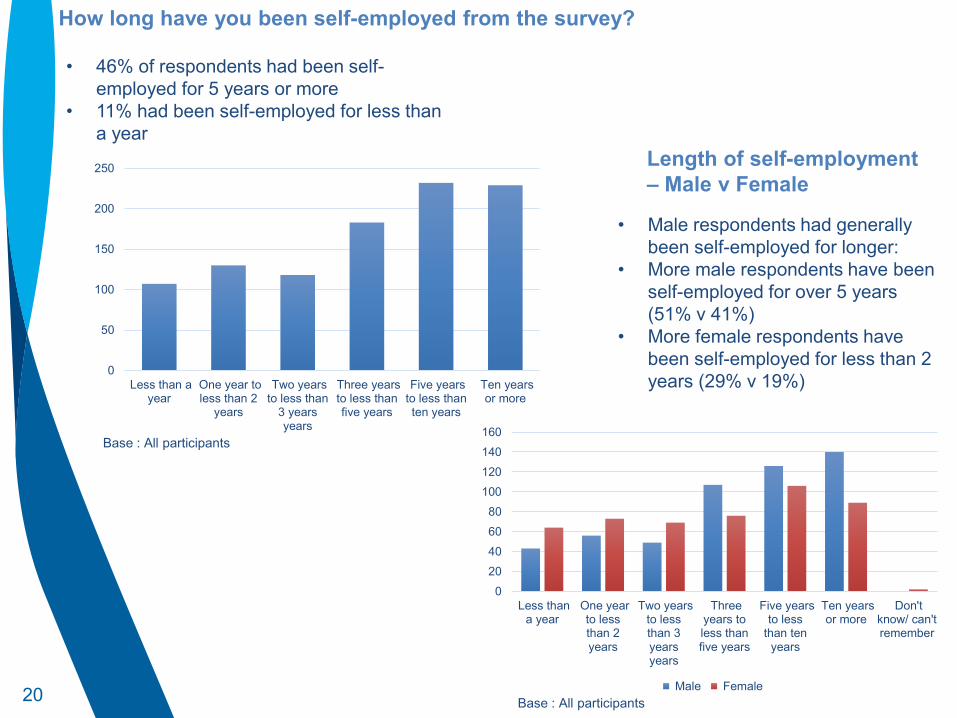
How long have you been self-employed from the survey?
• Male respondents had generally been self-employed for longer:
• More male respondents have been self-employed for over 5 years (51% v 41%)
• More female respondents have been self-employed for less than 2 years (29% v 19%)
0
50
100
150
200
250
Less than ayear
One year toless than 2
years
Two yearsto less than
3 yearsyears
Three yearsto less thanfive years
Five yearsto less thanten years
Ten yearsor more
Base : All participants
Length of self-employment – Male v Female
• 46% of respondents had been self-employed for 5 years or more
• 11% had been self-employed for less than a year
020406080
100120140160
Less thana year
One yearto lessthan 2years
Two yearsto lessthan 3yearsyears
Threeyears toless thanfive years
Five yearsto less
than tenyears
Ten yearsor more
Don'tknow/ can'tremember
Male Female
21 Base : All participants
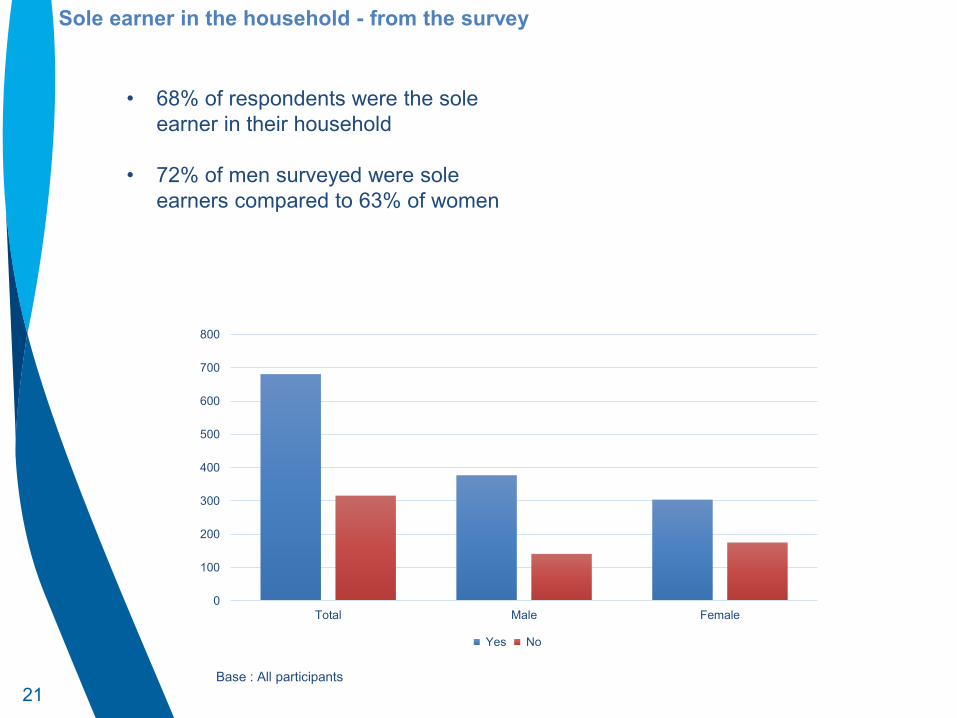
• 68% of respondents were the sole earner in their household
• 72% of men surveyed were sole earners compared to 63% of women
Sole earner in the household - from the survey
0
100
200
300
400
500
600
700
800
Total Male Female
Yes No

22 Base : All participants - multiple responses
The top three contributory factors to becoming self employed identified in the survey were: • Being self-employed is normal for the job I do (73%) • Wanted more independence (66%) • Needed to work around childcare or other caring
commitments (45%)
0
100
200
300
400
500
600
700
800
Male Female Total
23
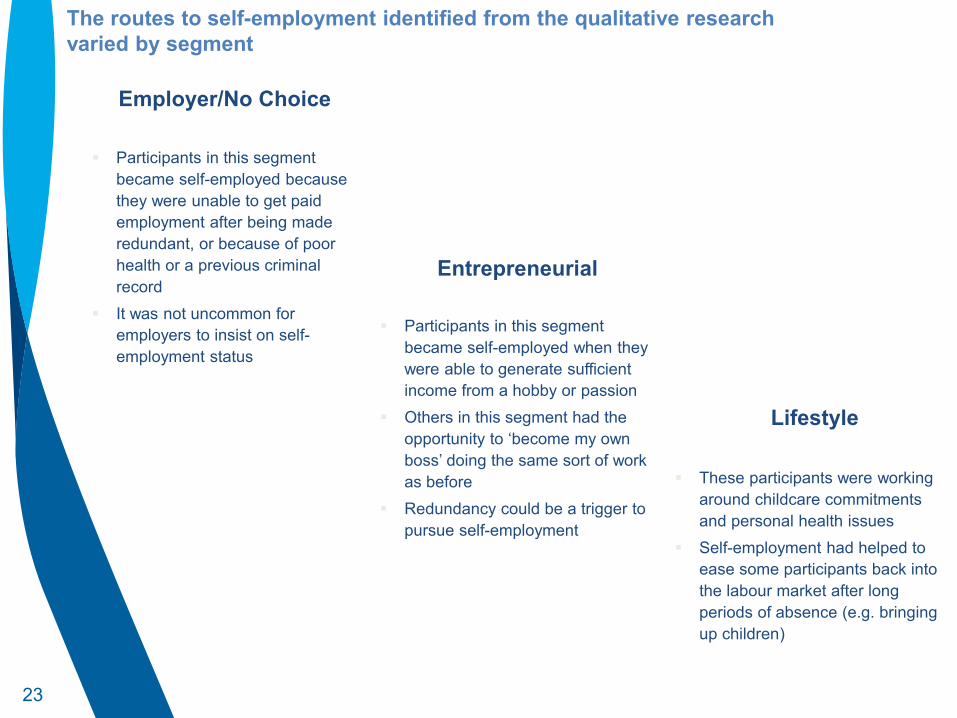
Entrepreneurial
One Employer/No Choice
Lifestyle
Participants in this segment became self-employed when they were able to generate sufficient income from a hobby or passion
Others in this segment had the opportunity to ‘become my own boss’ doing the same sort of work as before
Redundancy could be a trigger to pursue self-employment
Participants in this segment became self-employed because they were unable to get paid employment after being made redundant, or because of poor health or a previous criminal record
It was not uncommon for employers to insist on self-employment status
These participants were working around childcare commitments and personal health issues
Self-employment had helped to ease some participants back into the labour market after long periods of absence (e.g. bringing up children)
The routes to self-employment identified from the qualitative research varied by segment
24
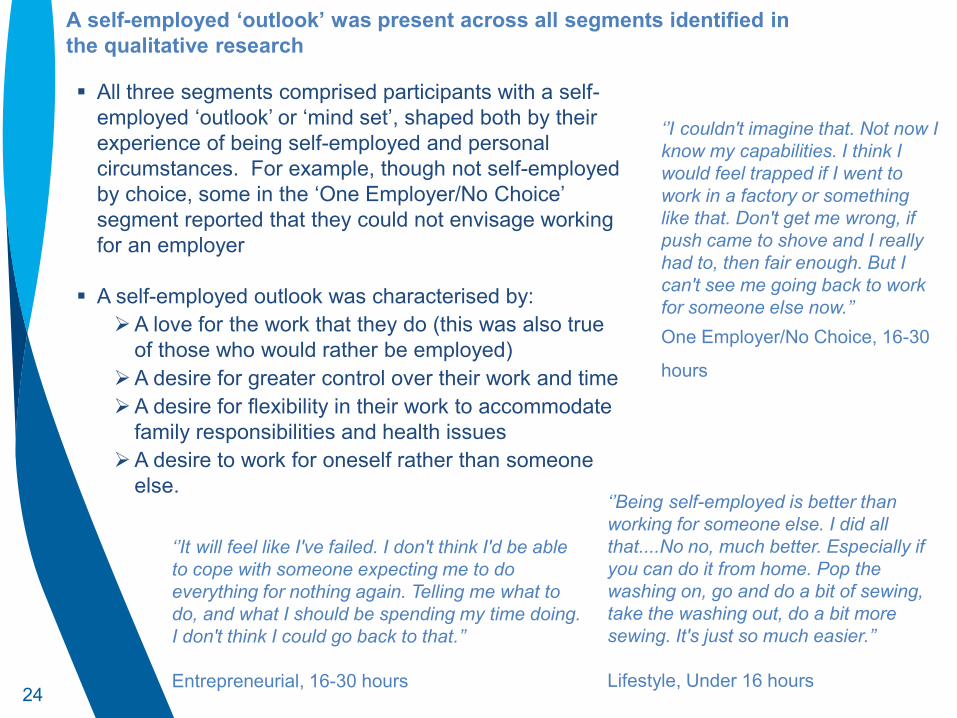
A self-employed ‘outlook’ was present across all segments identified in the qualitative research
All three segments comprised participants with a self-employed ‘outlook’ or ‘mind set’, shaped both by their experience of being self-employed and personal circumstances. For example, though not self-employed by choice, some in the ‘One Employer/No Choice’ segment reported that they could not envisage working for an employer
A self-employed outlook was characterised by:
A love for the work that they do (this was also true of those who would rather be employed)
A desire for greater control over their work and time A desire for flexibility in their work to accommodate
family responsibilities and health issues A desire to work for oneself rather than someone
else.
‘’I couldn't imagine that. Not now I know my capabilities. I think I would feel trapped if I went to work in a factory or something like that. Don't get me wrong, if push came to shove and I really had to, then fair enough. But I can't see me going back to work for someone else now.’’ One Employer/No Choice, 16-30
hours
‘’Being self-employed is better than working for someone else. I did all that....No no, much better. Especially if you can do it from home. Pop the washing on, go and do a bit of sewing, take the washing out, do a bit more sewing. It's just so much easier.’’ Lifestyle, Under 16 hours
‘’It will feel like I've failed. I don't think I'd be able to cope with someone expecting me to do everything for nothing again. Telling me what to do, and what I should be spending my time doing. I don't think I could go back to that.’’ Entrepreneurial, 16-30 hours
25
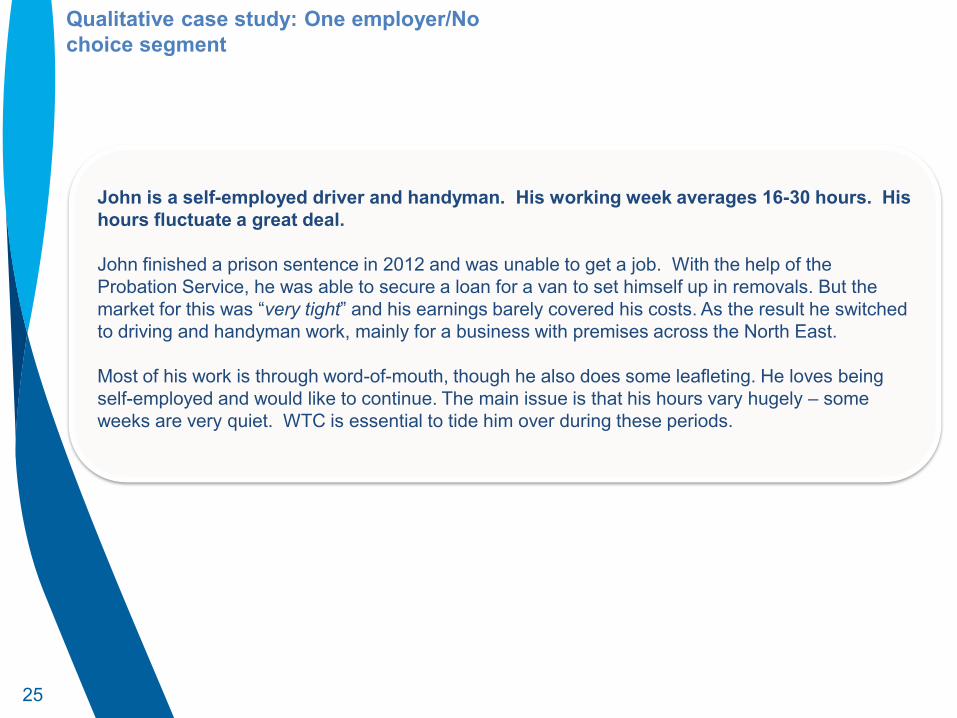
Qualitative case study: One employer/No choice segment
John is a self-employed driver and handyman. His working week averages 16-30 hours. His hours fluctuate a great deal. John finished a prison sentence in 2012 and was unable to get a job. With the help of the Probation Service, he was able to secure a loan for a van to set himself up in removals. But the market for this was “very tight” and his earnings barely covered his costs. As the result he switched to driving and handyman work, mainly for a business with premises across the North East. Most of his work is through word-of-mouth, though he also does some leafleting. He loves being self-employed and would like to continue. The main issue is that his hours vary hugely – some weeks are very quiet. WTC is essential to tide him over during these periods.
26
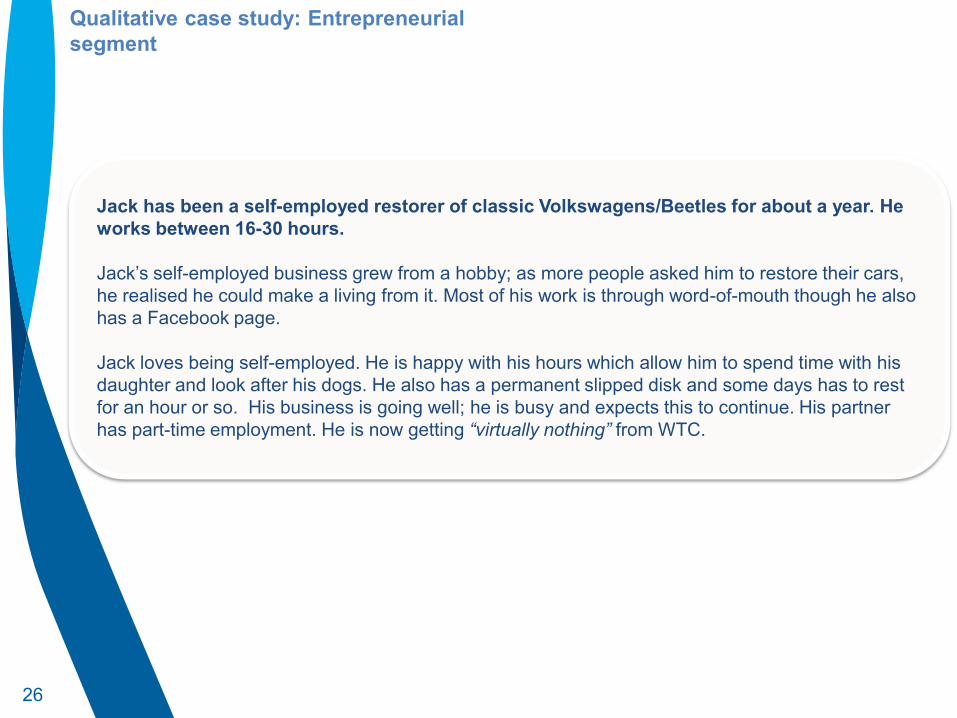
Qualitative case study: Entrepreneurial segment
Jack has been a self-employed restorer of classic Volkswagens/Beetles for about a year. He works between 16-30 hours. Jack’s self-employed business grew from a hobby; as more people asked him to restore their cars, he realised he could make a living from it. Most of his work is through word-of-mouth though he also has a Facebook page. Jack loves being self-employed. He is happy with his hours which allow him to spend time with his daughter and look after his dogs. He also has a permanent slipped disk and some days has to rest for an hour or so. His business is going well; he is busy and expects this to continue. His partner has part-time employment. He is now getting “virtually nothing” from WTC.
“
I just thought to myself one day that it's about time I took the leap and became self-employed…I got sick of working my backside off to fill
someone else's pockets.
27
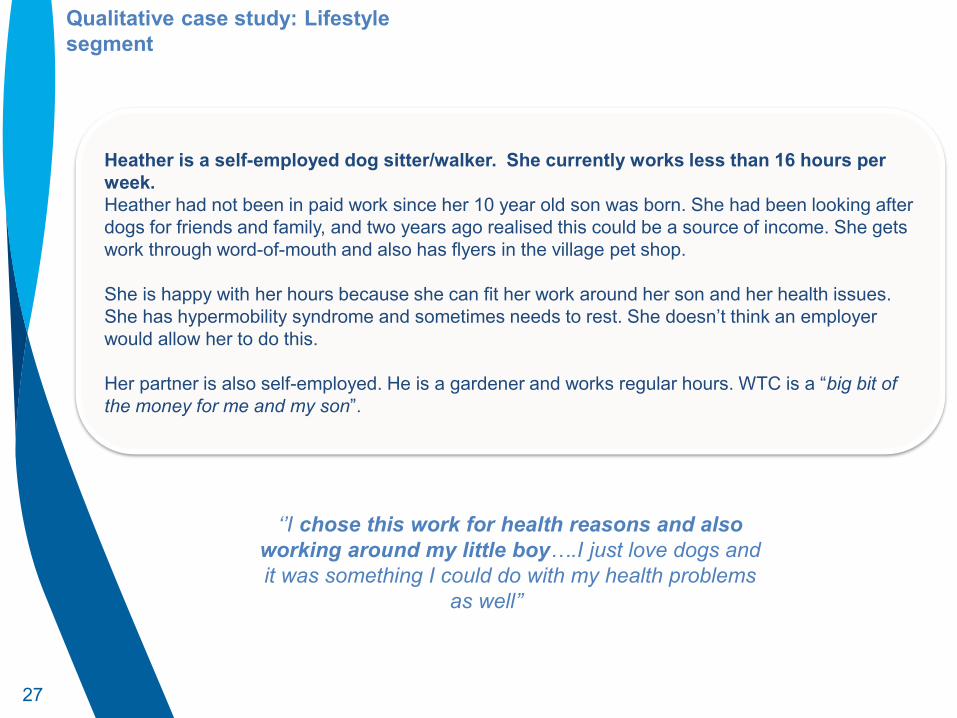
Qualitative case study: Lifestyle segment
Heather is a self-employed dog sitter/walker. She currently works less than 16 hours per week. Heather had not been in paid work since her 10 year old son was born. She had been looking after dogs for friends and family, and two years ago realised this could be a source of income. She gets work through word-of-mouth and also has flyers in the village pet shop. She is happy with her hours because she can fit her work around her son and her health issues. She has hypermobility syndrome and sometimes needs to rest. She doesn’t think an employer would allow her to do this. Her partner is also self-employed. He is a gardener and works regular hours. WTC is a “big bit of the money for me and my son”.
‘’I chose this work for health reasons and also
working around my little boy….I just love dogs and it was something I could do with my health problems
as well’’ well.

28
The nature of self-employed work carried out by self-employed Working Tax Credit claimants
29
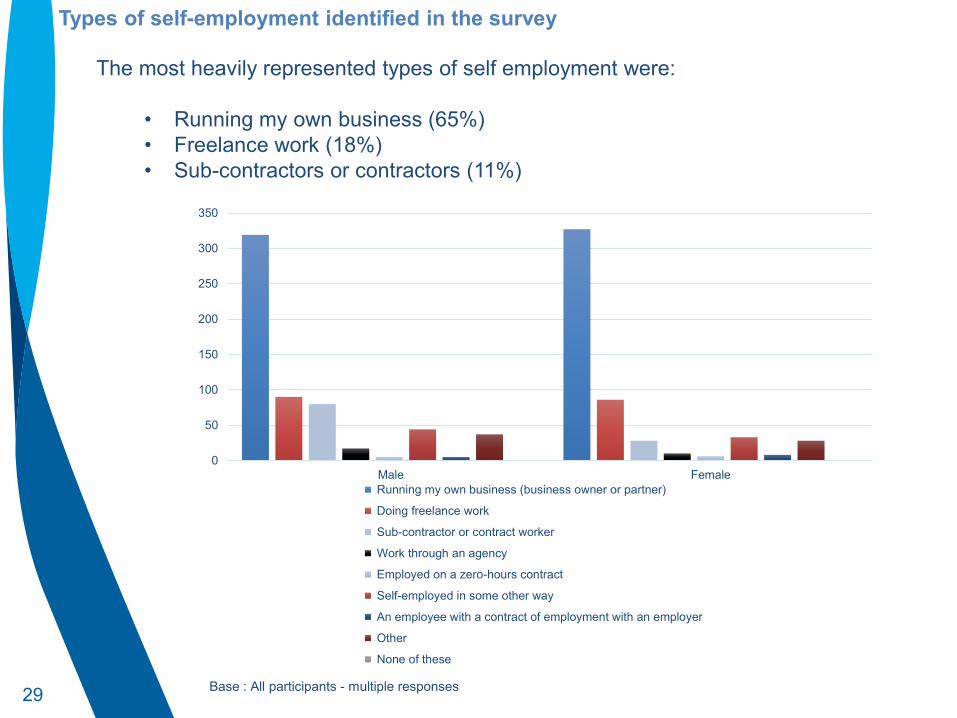
The most heavily represented types of self employment were:
• Running my own business (65%) • Freelance work (18%) • Sub-contractors or contractors (11%)
Base : All participants - multiple responses
0
50
100
150
200
250
300
350
Male Female Running my own business (business owner or partner)
Doing freelance work
Sub-contractor or contract worker
Work through an agency
Employed on a zero-hours contract
Self-employed in some other way
An employee with a contract of employment with an employer
Other
None of these
Types of self-employment identified in the survey
30 Base : All participants
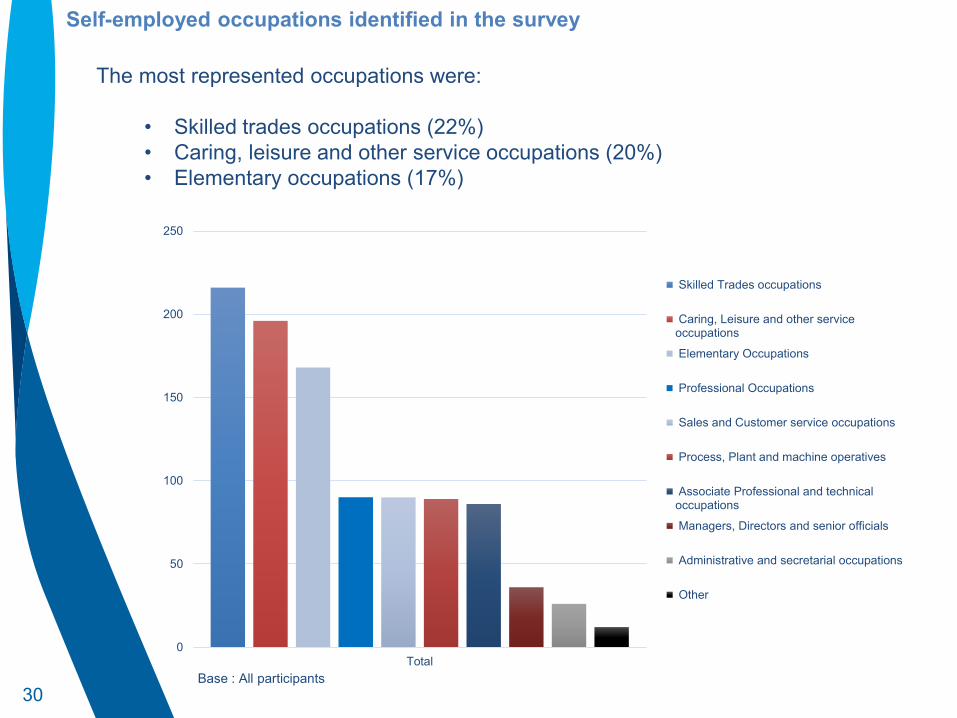
The most represented occupations were:
• Skilled trades occupations (22%) • Caring, leisure and other service occupations (20%) • Elementary occupations (17%)
0
50
100
150
200
250
Total
Skilled Trades occupations
Caring, Leisure and other serviceoccupations
Elementary Occupations
Professional Occupations
Sales and Customer service occupations
Process, Plant and machine operatives
Associate Professional and technicaloccupations
Managers, Directors and senior officials
Administrative and secretarial occupations
Other
Self-employed occupations identified in the survey
31 Base : All participants – multiple responses
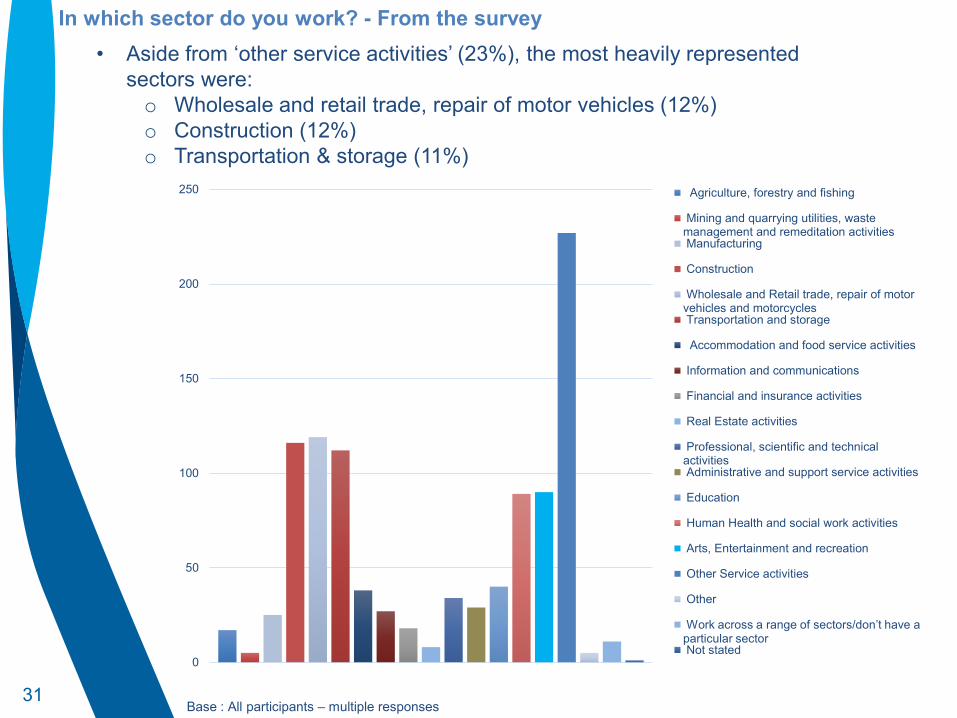
In which sector do you work? - From the survey • Aside from ‘other service activities’ (23%), the most heavily represented
sectors were: o Wholesale and retail trade, repair of motor vehicles (12%) o Construction (12%) o Transportation & storage (11%)
0
50
100
150
200
250 Agriculture, forestry and fishing
Mining and quarrying utilities, wastemanagement and remeditation activities Manufacturing
Construction
Wholesale and Retail trade, repair of motorvehicles and motorcycles Transportation and storage
Accommodation and food service activities
Information and communications
Financial and insurance activities
Real Estate activities
Professional, scientific and technicalactivities Administrative and support service activities
Education
Human Health and social work activities
Arts, Entertainment and recreation
Other Service activities
Other
Work across a range of sectors/don’t have a particular sector Not stated

32 Base : All participants – multiple responses
In which sector do you work by monthly income pattern – From the survey
0
20
40
60
80
100
120
140
Regular month to month Varies but predictable Uncertain
Agriculture, forestry and fishing
Mining and quarrying utilities, wastemanagement and remeditation activities
Manufacturing
Construction
Wholesale and Retail trade, repair of motorvehicles and motorcycles
Transportation and storage
Accommodation and food service activities
Information and communications
Financial and insurance activities
Real Estate activities
Professional, scientific and technical activities
Administrative and support service activities
Education
Human Health and social work activities
Arts, Entertainment and recreation
Other Service activities
33
Self-employed work patterns and income
34 Base : All participants
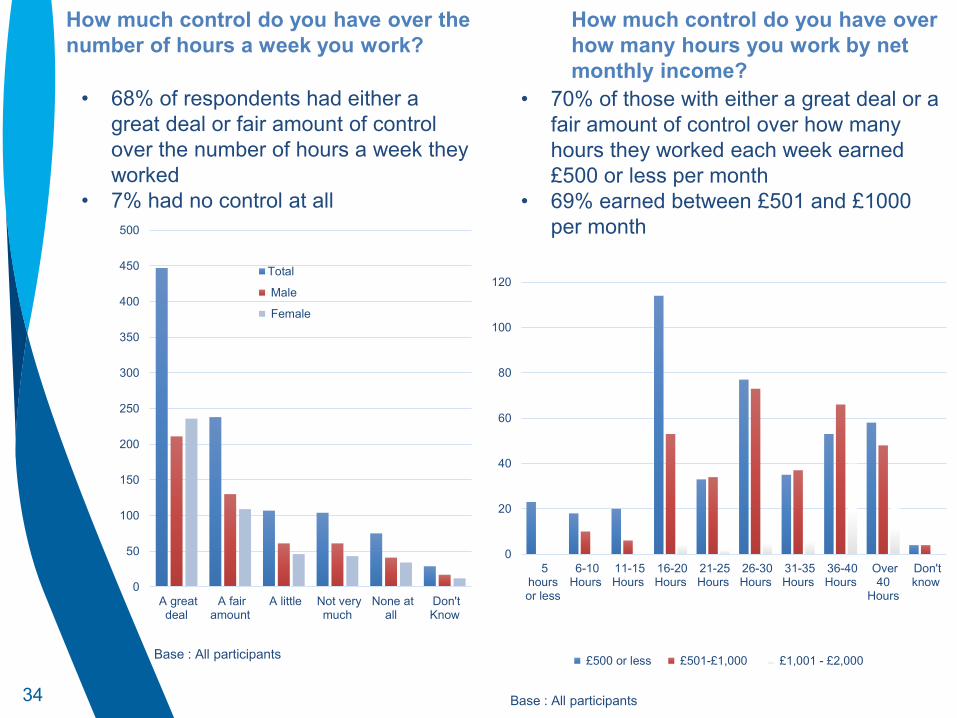
How much control do you have over the number of hours a week you work?
Base : All participants
0
50
100
150
200
250
300
350
400
450
500
A greatdeal
A fairamount
A little Not verymuch
None atall
Don'tKnow
Total
Male
Female
How much control do you have over how many hours you work by net monthly income?
• 68% of respondents had either a great deal or fair amount of control over the number of hours a week they worked
• 7% had no control at all
• 70% of those with either a great deal or a fair amount of control over how many hours they worked each week earned £500 or less per month
• 69% earned between £501 and £1000 per month
0
20
40
60
80
100
120
5hoursor less
6-10Hours
11-15Hours
16-20Hours
21-25Hours
26-30Hours
31-35Hours
36-40Hours
Over40
Hours
Don'tknow
£500 or less £501-£1,000 £1,001 - £2,000

35
Base : All participants
How many hours a week do you work? – From the survey
• 9% of respondents worked less than 16 hours a week
• 56% worked between 16-35 hours a week • 33% worked 36 hours or more a week
Base : All participants stating income
How many hours a week do you work by net monthly income – From the survey Of those stating their income: • 71% of those working less than 16 hours a
week earned £500 or less per month (90% earned £1000 per month or less)
• 46% of those working 16-35 hours a week earned £500 or less per month (81% earned £1000 per month or less)
• 33% of those working 36 or more hours a week earned £500 or less per month (67% earned £1000 per month or less)
0
50
100
150
200
250
Lessthan 5hours
6-10Hours
11-15Hours
16-20Hours
21-25Hours
26-30Hours
31-35Hours
36-40Hours
Over40
Hours
Don'tknow
0
20
40
60
80
100
120
5hoursor less
6-10Hours
11-15Hours
16-20Hours
21-25Hours
26-30Hours
31-35Hours
36-40Hours
Over40
Hours
Don'tknow
£500 or less £501-£1,000 £1,001 - £2,000
36 Base : All participants who reported receiving the same net pay each month
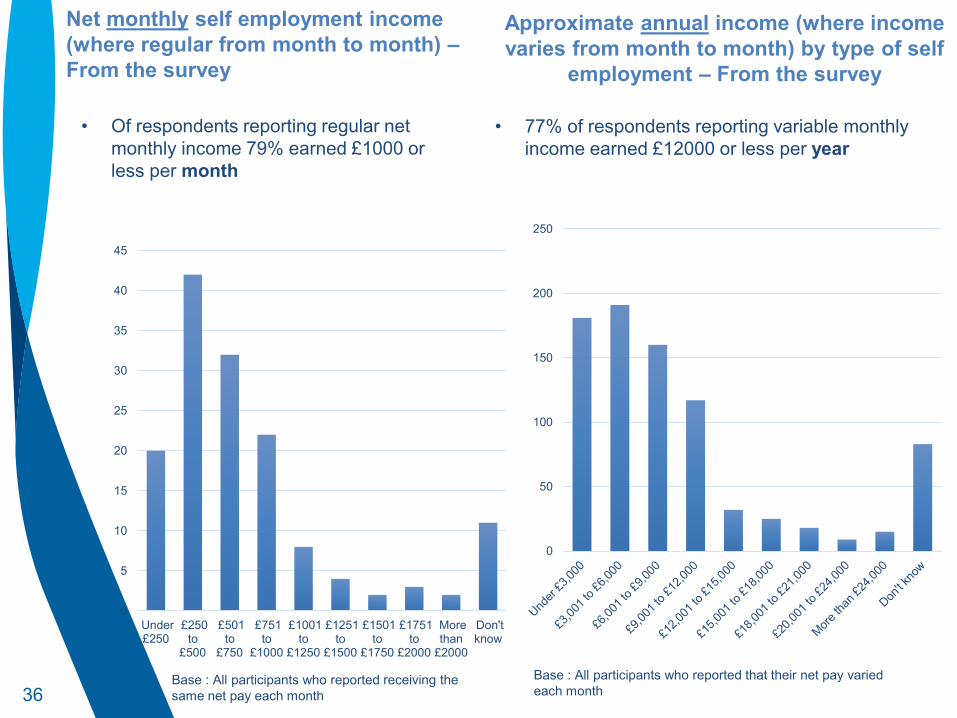
Net monthly self employment income (where regular from month to month) – From the survey
Base : All participants who reported that their net pay varied each month
Approximate annual income (where income varies from month to month) by type of self
employment – From the survey
• Of respondents reporting regular net monthly income 79% earned £1000 or less per month
• 77% of respondents reporting variable monthly income earned £12000 or less per year
0
5
10
15
20
25
30
35
40
45
Under£250
£250to
£500
£501to
£750
£751to
£1000
£1001to
£1250
£1251to
£1500
£1501to
£1750
£1751to
£2000
Morethan
£2000
Don'tknow
0
50
100
150
200
250
37
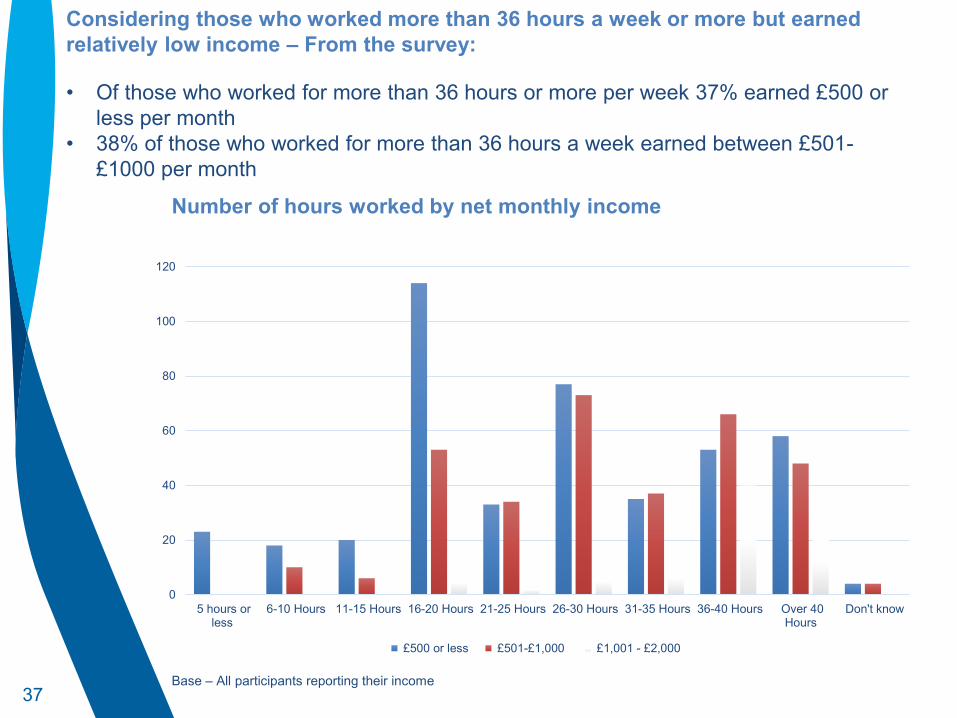
Considering those who worked more than 36 hours a week or more but earned relatively low income – From the survey: • Of those who worked for more than 36 hours or more per week 37% earned £500 or
less per month • 38% of those who worked for more than 36 hours a week earned between £501-
£1000 per month
Base – All participants reporting their income
Number of hours worked by net monthly income
0
20
40
60
80
100
120
5 hours orless
6-10 Hours 11-15 Hours 16-20 Hours 21-25 Hours 26-30 Hours 31-35 Hours 36-40 Hours Over 40Hours
Don't know
£500 or less £501-£1,000 £1,001 - £2,000
38
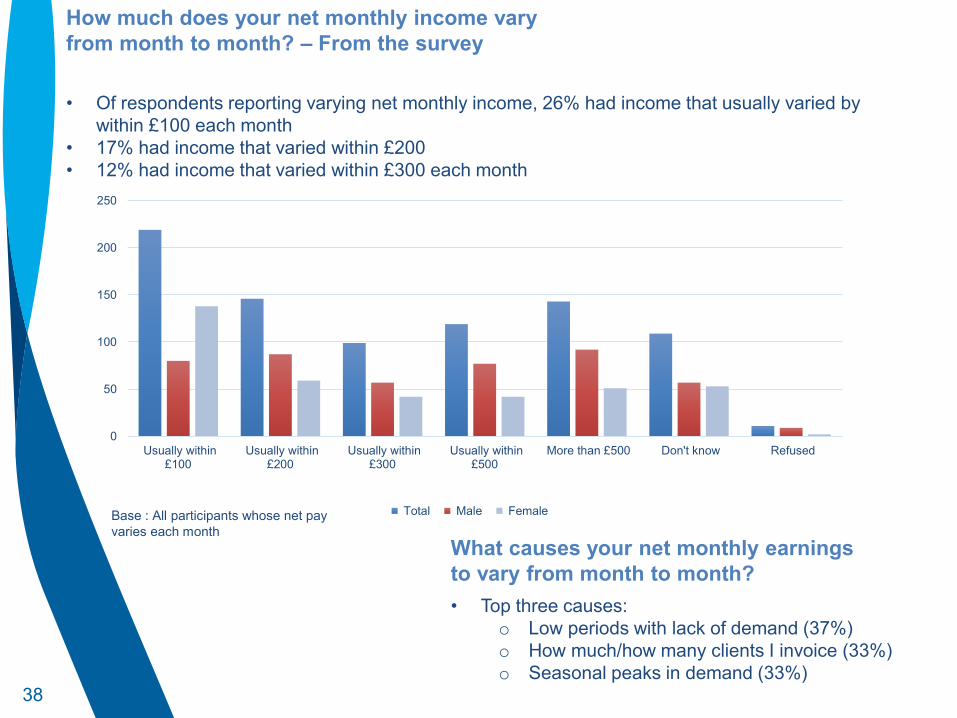
How much does your net monthly income vary from month to month? – From the survey
Base : All participants whose net pay varies each month
• Of respondents reporting varying net monthly income, 26% had income that usually varied by within £100 each month
• 17% had income that varied within £200 • 12% had income that varied within £300 each month
What causes your net monthly earnings to vary from month to month? • Top three causes:
o Low periods with lack of demand (37%) o How much/how many clients I invoice (33%) o Seasonal peaks in demand (33%)
0
50
100
150
200
250
Usually within£100
Usually within£200
Usually within£300
Usually within£500
More than £500 Don't know Refused
Total Male Female

39 Base : All participants whose net pay varies each month
0
50
100
150
200
250
300
350
What causes your income to vary? – From the survey
Low periods with lack of demand
How much/how many clients I invoice
Seasonal peaks in demand
Number of hours worked
Taking time off for personal/familycommitments (ie, holidays, sickness, childcareetc) Infrequent invoices due to long term jobs/work
How promptly customers settle their bills
Poor weather
How much I have to pay suppliers
Expenses / bills
Availability of stock
Nature of the business /market conditions
Bounced cheques/payments from customers
Receive annual subsidy payment
Other

40
There were examples of regular and variable work patterns in the qualitative research
Participants who were providing a service with set hours reported having a consistent work pattern (e.g. carer, police canteen manager, sandwich bar manager, childminder/driver, publican). This group comprised participants who were:
Working 16-30 hours per week, but not through choice (i.e. they would like to increase their hours if they could)
Working 30+ hours and wanted to earn more than £6K per year rather than increase their hours
Purposely restricting to between 16-30 hours to suit their circumstances.
Participants with variable work patterns were usually dependent on word-of-mouth to generate customers, or their work was seasonal, or they varied their working hours to fit in around their family life which was unpredictable.
Lifestyle, Under 16 hours
‘’It's like flipping a light switch...you've been working flat out and then suddenly you've got no work to do.’’
One Employer/No Choice, 16-30 hours
Entrepreneurial, Over 30 hours
‘’I am always at work…. I never have any time off!’’
‘’I have quite a lot of say over what I do and what I don’t do. I'm happy as I am at the minute.’’
Lifestyle, Under 16 hours
41
Recording the amount of time spent working – From the qualitative research
There was variation in how participants gauged the amount of time they spend working. This variation was driven by the types of work undertaken. It was rare for participants to systematically record the amount of time spent working.
Participants who worked regular hours knew how much time they spend working. This was also true for participants who charged customers based on time spent (e.g. dog walker/sitter, driving instructor) which was usually recorded in a calendar.
Participants who charged on a project basis (e.g. financial writer, musician/music producer, seamstress) or earned income through sales were usually unable to provide an accurate assessment of time spent. Participants who worked irregular hours also encountered difficulties estimating how much time they spend working because some of the time was for marketing, training, being ‘on-call’ to customers and doing speculative work.
There was a group of participants for whom work was all-consuming; these participants paid little attention to how much time they spend working.
‘’Because I enjoy what I am doing so much, I just fall into it and the time goes past.’’ Entrepreneurial, 16-30 hours
‘’No week is ever the same. It depends upon what my husband is doing work-wise…. Some weeks I work many more hours than other weeks.’’ Entrepreneurial, 16-30 hours

42
Enablers and barriers to increasing hours/income – From the qualitative research
There were rare examples of actions that participants were actively pursuing to increase their hours and/or income. These included plans to increase marketing activities and expand the business offer to capture more customers.
A range of barriers to increasing hours/income were reported by participants: Personal factors: health issues, caring
responsibilities and a lack of childcare. These participants did not want, or feel able to do more. For participants in with young children, plans to increase hours/income were contingent on their children starting secondary school.
Market conditions: lack of consumer demand, too much competition and technological change which has made redundant some of the services they provide/pushed down the prices they could charge
Over-reliance on word-of-mouth: making it very difficult to source and attract new customers. Despite this, demand for support with marketing was limited. There was a perception among participants that word-of-mouth was most appropriate and effective for the services they were offering.
‘’No one's got any money. Takings have gone down, a quarter of what they were a few years ago. People aren't spending as much. There is a lot of competition.’’ Entrepreneurial, Over 30 hours
‘’It is going quite well and I don't want to push my back any more than I do. There's nothing worse than being laid up for four weeks because you've gone a bit far with what you're doing.’’ Entrepreneurial, 16-30 hours
‘’I try to keep it to that [16 hours]. I feel it's enough. Having three kids is full on…I love the job, I love the hours.’’ Entrepreneurial, 16-30 hours
43
Use of marketing in increasing hours/income – From the qualitative research
‘’How can I overcome these obstacles [digital services becoming more accessible] and convince them to use me? I need almost a marketing consultant I suppose. I think I will probably end up with less work over the next two years or so due to that reason, but with the right marketing I could overcome that.’’
Entrepreneurial, 16-30 hours
‘’It is entirely is word-of-mouth. Anything else hasn't worked, advertising, various forms of marketing, I've got a website. All of it is almost useless. It's the nature of this business, it's a very personal business. It's all to do with contacts and reputation.’’
Entrepreneurial, Over 30 hours
‘’I don't want to advertise because I don't want to be overladen and I don't need to…Very much it's word-of-mouth really and that's how I like it.’’
Lifestyle, Under 16 hours
There was some, albeit limited, demand for advice and support on marketing the business.
Marketing was perceived to be irrelevant by participants who were happy with their current hours. This group included those with caring responsibilities or who were planning to wind down their business.
Participants who wanted to generate additional income were heavily reliant on word-of-mouth for new business. Several had tried or considered marketing but had found it ineffective or too costly. There was some use of social media (Facebook, Twitter) and websites (own website, eBay), alongside traditional methods (flyers, Yellow Pages, and local media).
44
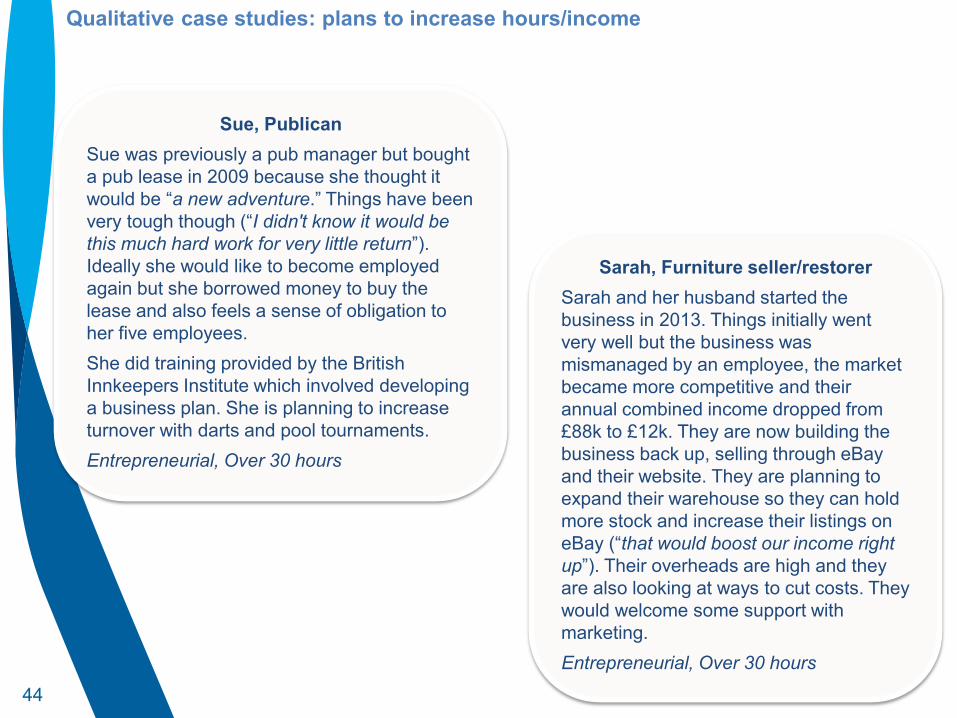
Qualitative case studies: plans to increase hours/income
Sue, Publican Sue was previously a pub manager but bought a pub lease in 2009 because she thought it would be “a new adventure.” Things have been very tough though (“I didn't know it would be this much hard work for very little return”). Ideally she would like to become employed again but she borrowed money to buy the lease and also feels a sense of obligation to her five employees. She did training provided by the British Innkeepers Institute which involved developing a business plan. She is planning to increase turnover with darts and pool tournaments. Entrepreneurial, Over 30 hours
Sarah, Furniture seller/restorer Sarah and her husband started the business in 2013. Things initially went very well but the business was mismanaged by an employee, the market became more competitive and their annual combined income dropped from £88k to £12k. They are now building the business back up, selling through eBay and their website. They are planning to expand their warehouse so they can hold more stock and increase their listings on eBay (“that would boost our income right up”). Their overheads are high and they are also looking at ways to cut costs. They would welcome some support with marketing. Entrepreneurial, Over 30 hours
45
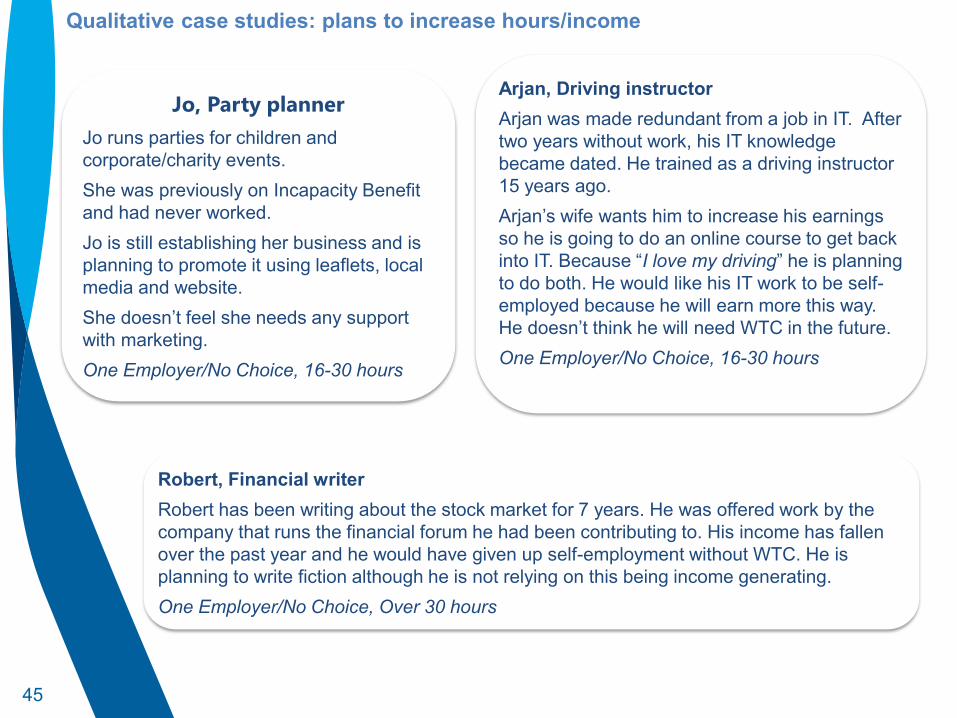
Qualitative case studies: plans to increase hours/income
Jo, Party planner
Jo runs parties for children and corporate/charity events. She was previously on Incapacity Benefit and had never worked. Jo is still establishing her business and is planning to promote it using leaflets, local media and website. She doesn’t feel she needs any support with marketing. One Employer/No Choice, 16-30 hours
Arjan, Driving instructor Arjan was made redundant from a job in IT. After two years without work, his IT knowledge became dated. He trained as a driving instructor 15 years ago. Arjan’s wife wants him to increase his earnings so he is going to do an online course to get back into IT. Because “I love my driving” he is planning to do both. He would like his IT work to be self-employed because he will earn more this way. He doesn’t think he will need WTC in the future. One Employer/No Choice, 16-30 hours
Robert, Financial writer Robert has been writing about the stock market for 7 years. He was offered work by the company that runs the financial forum he had been contributing to. His income has fallen over the past year and he would have given up self-employment without WTC. He is planning to write fiction although he is not relying on this being income generating. One Employer/No Choice, Over 30 hours

46
Business administration, expectations and plans
47
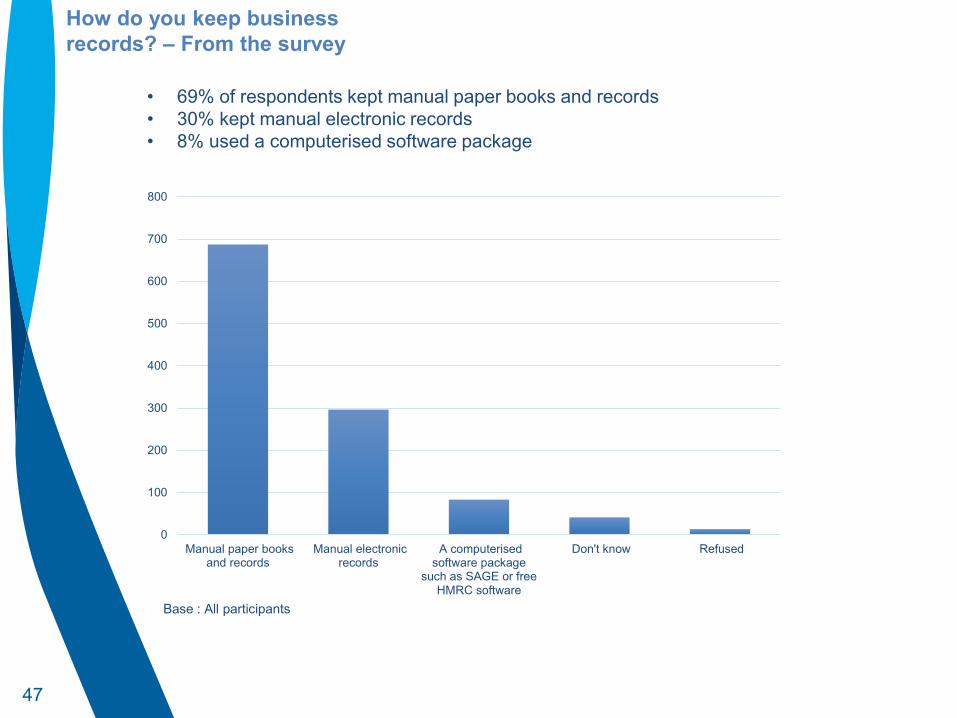
How do you keep business records? – From the survey
Base : All participants
0
100
200
300
400
500
600
700
800
Manual paper booksand records
Manual electronicrecords
A computerisedsoftware package
such as SAGE or freeHMRC software
Don't know Refused
• 69% of respondents kept manual paper books and records • 30% kept manual electronic records • 8% used a computerised software package

48
Business records were generally maintained manually – From the qualitative research
Invoices • Most used an invoice book and give a copy to customers. Only a couple use electronic invoices. Invoices
were generally filed/organised monthly and kept with receipts. Some cash businesses (publican, sandwich bar manager and police canteen manager) had till receipts.
• A few participants who charged cash did not have invoices or till receipts (appointments were noted in their diaries). Only one participant didn’t keep invoices because, ‘it’s the same amount every time.’’s “the same amount all the time”.
• t’s “the same amount all the time”. • it’s “the same amount all the time”.
Record keeping was generally simple and done manually, with ledger books and monthly accounting sheets being the most common tools. Some used diaries and mobile phone calendar to record payments. Use of spreadsheets was rare. Around half of participants used an accountant for their tax returns and/or book keeping.
Expenses • Most recorded expenses in the same book/spreadsheet as income. Receipts were kept by almost all,
either in folders or envelopes. • One participant only kept receipts for cash payments because everything else was on bank statements,
while another did not record expenses because they “don’t break the bank”.
Bank statements • All had a bank account – a few have separate business accounts but mostly personal accounts. Mix of
online and paper statements • But cash may not pass through bank accounts. Businesses that dealt mainly in cash (e.g. pub, sandwich
bar, police canteen) tended to use cash to pay for outgoings including salary.

49
Other business records, software and accountants – From the qualitative research
Use of financial software This was rare. A couple of participants had access to their accountant’s software (QuickBook). One
participant used Waveapps.com to note when invoices were paid.
Other proofs of self-employment Tax return/annual accounts. Work-specific records (disclosure forms/pupil records). A small number had a business plan when they became self-employed (with help from Jobcentre
Plus, Business Link, Business Gateway) or to get a loan. These plans were mostly out-of-date. Only one participant had recently updated her business plan following training.
Records people didn’t have List of clients (these would have to be constructed from invoices/diaries) Receipts issued to customers.
Use an accountant This was more common among more established or complex businesses (e.g. with employees, VAT
registered). Some had a partner who was also self-employed and who they shared an accountant with. An accountant was a necessity because participants would struggle to do their taxes themselves.
50
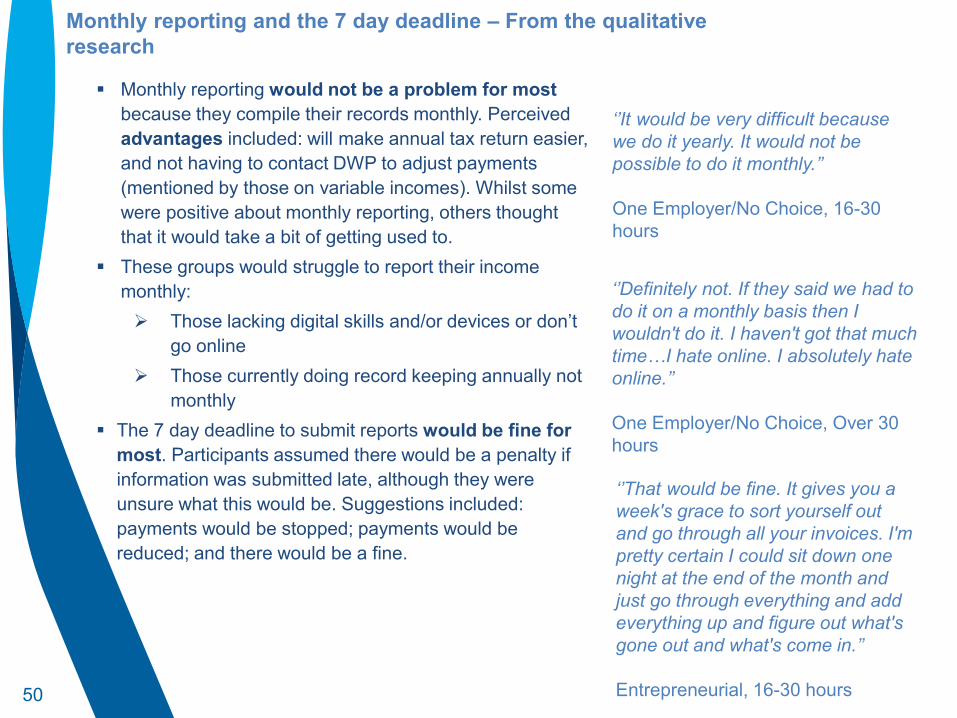
Monthly reporting and the 7 day deadline – From the qualitative research
Monthly reporting would not be a problem for most because they compile their records monthly. Perceived advantages included: will make annual tax return easier, and not having to contact DWP to adjust payments (mentioned by those on variable incomes). Whilst some were positive about monthly reporting, others thought that it would take a bit of getting used to.
These groups would struggle to report their income monthly: Those lacking digital skills and/or devices or don’t
go online Those currently doing record keeping annually not
monthly The 7 day deadline to submit reports would be fine for
most. Participants assumed there would be a penalty if information was submitted late, although they were unsure what this would be. Suggestions included: payments would be stopped; payments would be reduced; and there would be a fine.
‘’Definitely not. If they said we had to do it on a monthly basis then I wouldn't do it. I haven't got that much time…I hate online. I absolutely hate online.’’ One Employer/No Choice, Over 30 hours
‘’It would be very difficult because we do it yearly. It would not be possible to do it monthly.’’ One Employer/No Choice, 16-30 hours
‘’That would be fine. It gives you a week's grace to sort yourself out and go through all your invoices. I'm pretty certain I could sit down one night at the end of the month and just go through everything and add everything up and figure out what's gone out and what's come in.’’ Entrepreneurial, 16-30 hours
51
Base : All participants
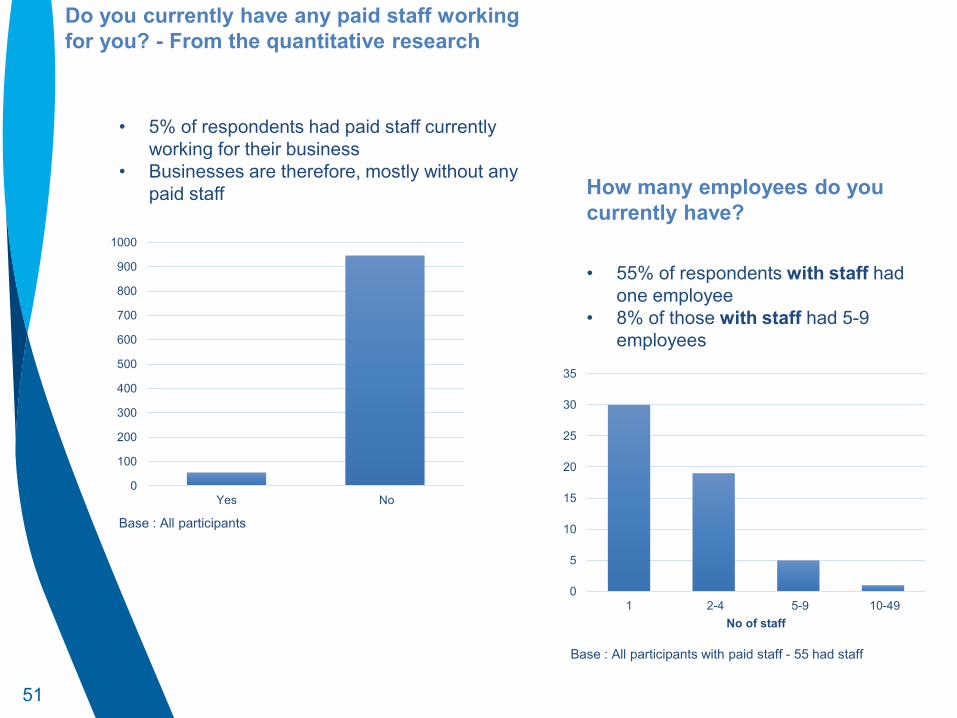
Do you currently have any paid staff working for you? - From the quantitative research
• 5% of respondents had paid staff currently working for their business
• Businesses are therefore, mostly without any paid staff How many employees do you
currently have?
Base : All participants with paid staff - 55 had staff
• 55% of respondents with staff had one employee
• 8% of those with staff had 5-9 employees
0
5
10
15
20
25
30
35
1 2-4 5-9 10-49No of staff
0
100
200
300
400
500
600
700
800
900
1000
Yes No

52
Base : All participants who run their own business, work freelance, sub-contractors or contract work
Which of the following describes your expectations for your business over the next 12 months by type of self employment – From the survey
• In total, 42% of respondents expected their business to grow in the 12 months • 42% expected it to stay the same • 5% expected business to decline and 5% expected to close their business • Comparing those that expected business closure to those expecting growth:
o More had additional paid employment (14% v 7%) o More had been self employed for 5 years or more (53% v 34%) o More were sub-contractors/contractors (16% v 6%)
0
50
100
150
200
250
300
350
400
Grow Stay the same Decline Close the business
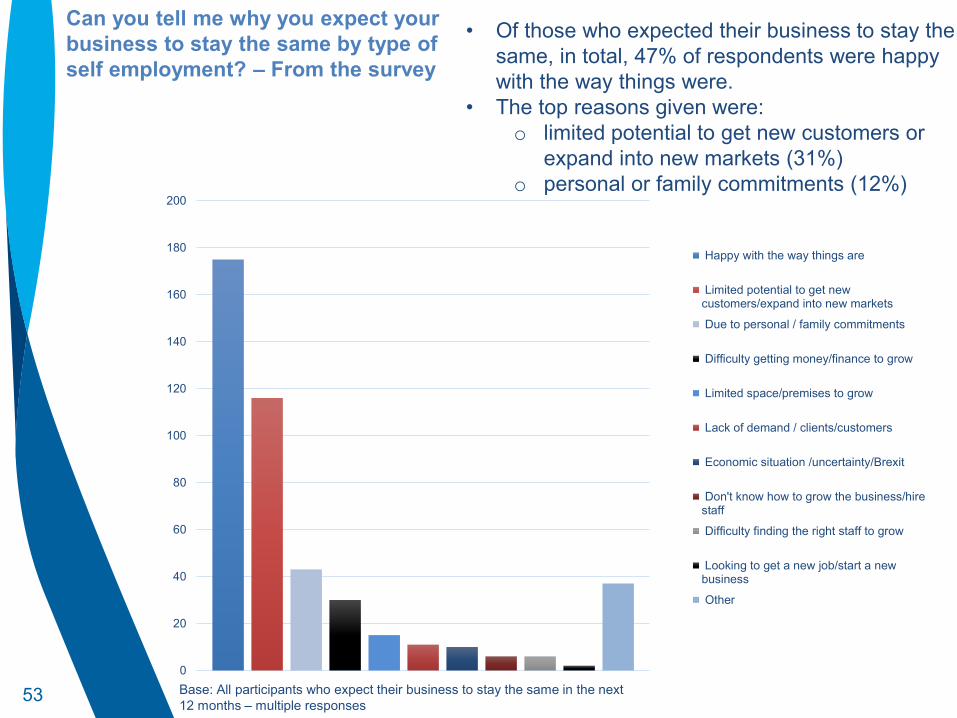
53 Base: All participants who expect their business to stay the same in the next 12 months – multiple responses
Can you tell me why you expect your business to stay the same by type of self employment? – From the survey
0
20
40
60
80
100
120
140
160
180
200
Happy with the way things are
Limited potential to get newcustomers/expand into new markets
Due to personal / family commitments
Difficulty getting money/finance to grow
Limited space/premises to grow
Lack of demand / clients/customers
Economic situation /uncertainty/Brexit
Don't know how to grow the business/hirestaff
Difficulty finding the right staff to grow
Looking to get a new job/start a newbusiness
Other
• Of those who expected their business to stay the same, in total, 47% of respondents were happy with the way things were.
• The top reasons given were: o limited potential to get new customers or
expand into new markets (31%) o personal or family commitments (12%)
54
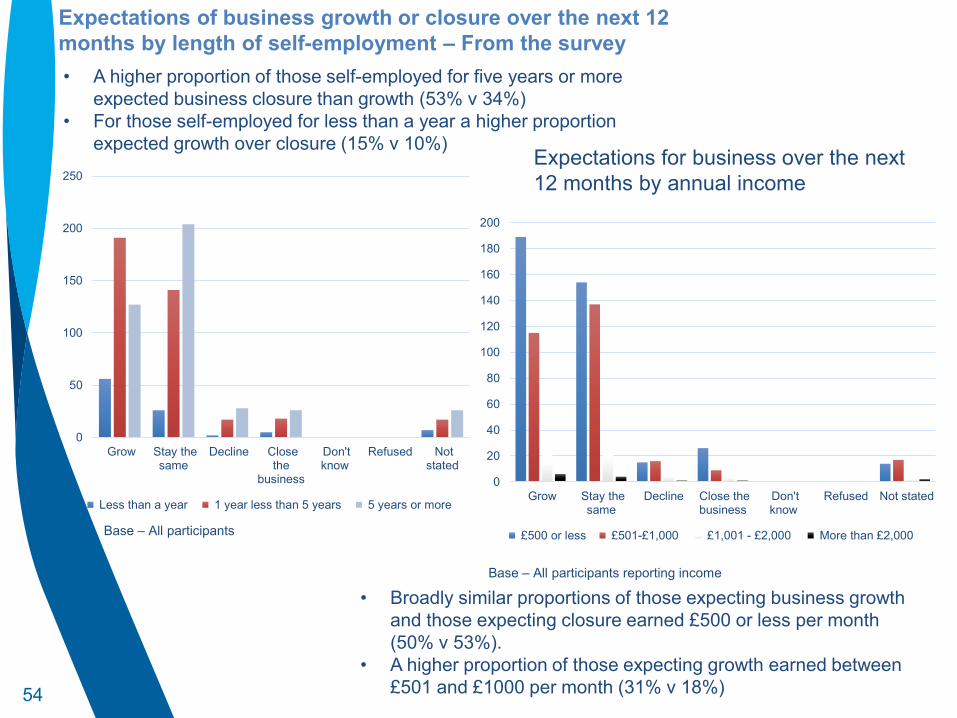
Expectations for business over the next 12 months by annual income
• Broadly similar proportions of those expecting business growth and those expecting closure earned £500 or less per month (50% v 53%).
• A higher proportion of those expecting growth earned between £501 and £1000 per month (31% v 18%)
Base – All participants reporting income
Expectations of business growth or closure over the next 12 months by length of self-employment – From the survey
Base – All participants
• A higher proportion of those self-employed for five years or more expected business closure than growth (53% v 34%)
• For those self-employed for less than a year a higher proportion expected growth over closure (15% v 10%)
0
50
100
150
200
250
Grow Stay thesame
Decline Closethe
business
Don'tknow
Refused Notstated
Less than a year 1 year less than 5 years 5 years or more
0
20
40
60
80
100
120
140
160
180
200
Grow Stay thesame
Decline Close thebusiness
Don'tknow
Refused Not stated
£500 or less £501-£1,000 £1,001 - £2,000 More than £2,000
55
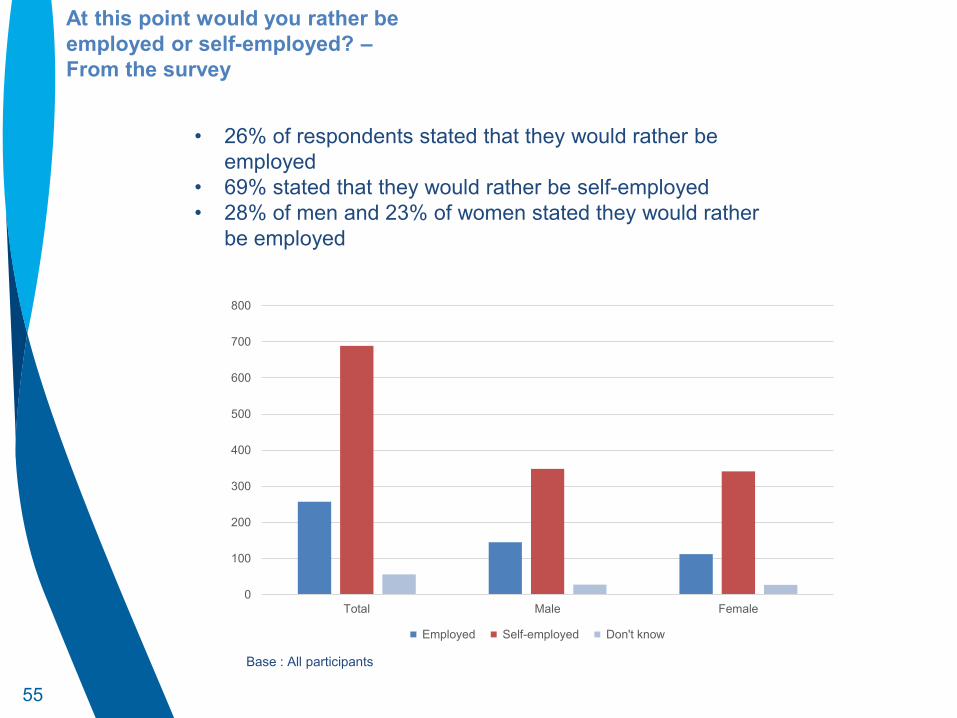
At this point would you rather be employed or self-employed? – From the survey
Base : All participants
• 26% of respondents stated that they would rather be employed
• 69% stated that they would rather be self-employed • 28% of men and 23% of women stated they would rather
be employed
0
100
200
300
400
500
600
700
800
Total Male Female
Employed Self-employed Don't know

56
All three segments also had participants who would rather be in paid employment – From the qualitative research
All three segments (Employer/No choice, Entrepreneurial and Lifestyle) also comprised participants who would rather be employed because employees enjoy benefits (e.g. National Insurance and pension contributions, holidays) and financial security (e.g. sick pay) that are not available to self employed people
Financial security was especially important to participants with a health condition
‘’I've always been quite happy working for somebody because you have your paid holidays, you have your sickness if you're off. When you're self-employed it's very tough trying to make ends meet. We just fell into this self-employment thing, it wasn't something we thought about doing.’’ One Employer/No Choice, Over 30 hours
‘’If I had had to have any time off, I would have been in trouble... If I had to have an operation I would have been off work long-term and would have had to give up being self-employed and look for something when I was well again. Luckily it was all sorted out but it makes you realise how vulnerable you are when you're self-employed.’’ Lifestyle, Under 16 hours
‘’I would love to go back to employed work with someone else but at the moment I can't actually afford to leave because I would lose so much, because of what I've invested and the loans I have. Otherwise I'm going to lose my home… I've got people [employees] reliant on me.’’ Entrepreneurial, Over 30 hours
57
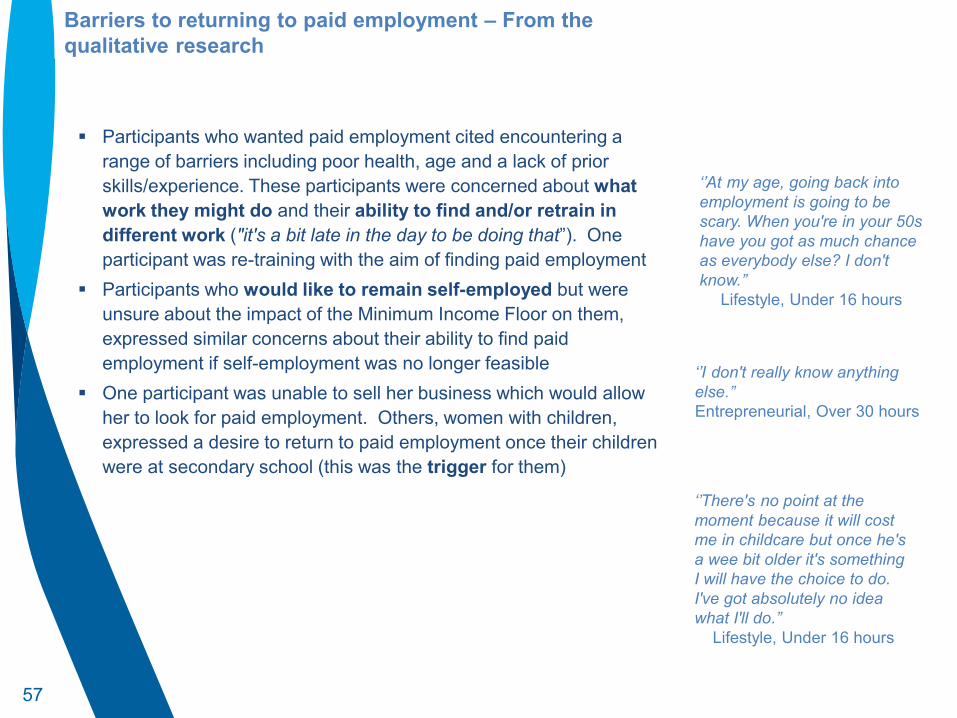
Barriers to returning to paid employment – From the qualitative research
‘’There's no point at the moment because it will cost me in childcare but once he's a wee bit older it's something I will have the choice to do. I've got absolutely no idea what I'll do.’’
Lifestyle, Under 16 hours
Participants who wanted paid employment cited encountering a range of barriers including poor health, age and a lack of prior skills/experience. These participants were concerned about what work they might do and their ability to find and/or retrain in different work ("it's a bit late in the day to be doing that”). One participant was re-training with the aim of finding paid employment
Participants who would like to remain self-employed but were unsure about the impact of the Minimum Income Floor on them, expressed similar concerns about their ability to find paid employment if self-employment was no longer feasible
One participant was unable to sell her business which would allow her to look for paid employment. Others, women with children, expressed a desire to return to paid employment once their children were at secondary school (this was the trigger for them)
‘’At my age, going back into employment is going to be scary. When you're in your 50s have you got as much chance as everybody else? I don't know.’’
Lifestyle, Under 16 hours
‘’I don't really know anything else.’’ Entrepreneurial, Over 30 hours
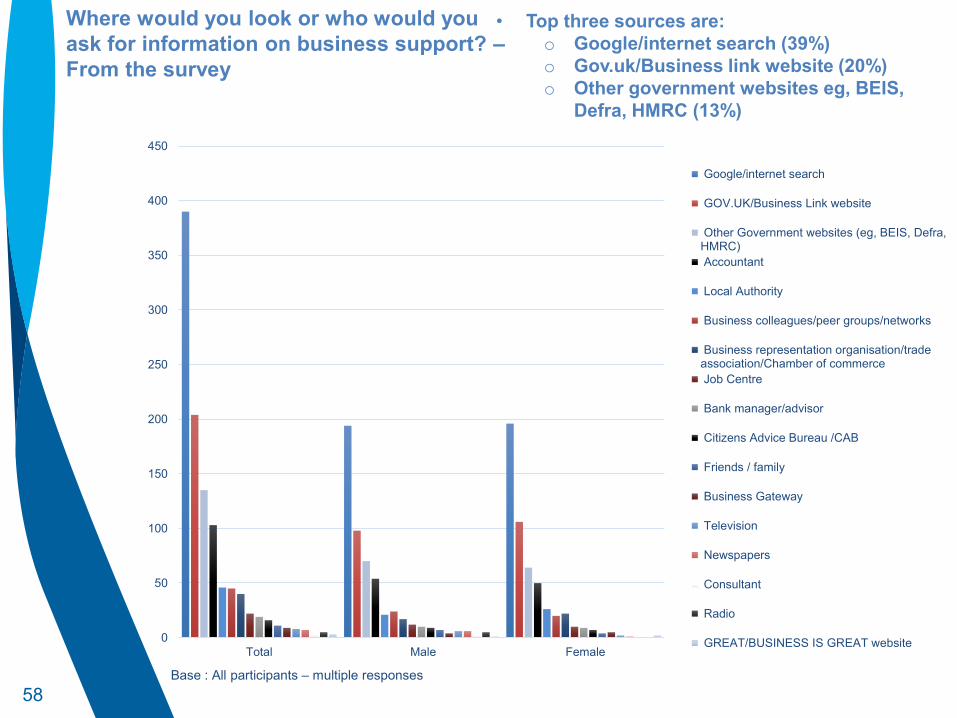
58 Base : All participants – multiple responses
0
50
100
150
200
250
300
350
400
450
Total Male Female
Google/internet search
GOV.UK/Business Link website
Other Government websites (eg, BEIS, Defra,HMRC) Accountant
Local Authority
Business colleagues/peer groups/networks
Business representation organisation/tradeassociation/Chamber of commerce Job Centre
Bank manager/advisor
Citizens Advice Bureau /CAB
Friends / family
Business Gateway
Television
Newspapers
Consultant
Radio
GREAT/BUSINESS IS GREAT website
Where would you look or who would you ask for information on business support? – From the survey
• Top three sources are: o Google/internet search (39%) o Gov.uk/Business link website (20%) o Other government websites eg, BEIS,
Defra, HMRC (13%)
59
Information expected and support needed – From the qualitative research
Most participants expected that they would need to provide details of income and outgoings (similar to tax returns) as a condition for receiving UC. Participants were generally confident that they would be able to comply as long as the information was simple to complete. Only one participant said they would change their record keeping as a result of the requirement
A couple would delegate the monthly reporting task to their accountant. A couple would like to be ‘shown’ how to complete the form, but most assumed there will be online/phone help
Participants raised a number of queries which will require clarifications/guidance: How are expenses treated – including expenses associated with working from home? Which dates should be used in calculations: date of invoice or receipt of income? What is business income versus personal income?
‘’I would have to look at changing it to make it a bit more digital...if there's a way of speeding that process up.’’
Entrepreneurial, 16-30 hours
60
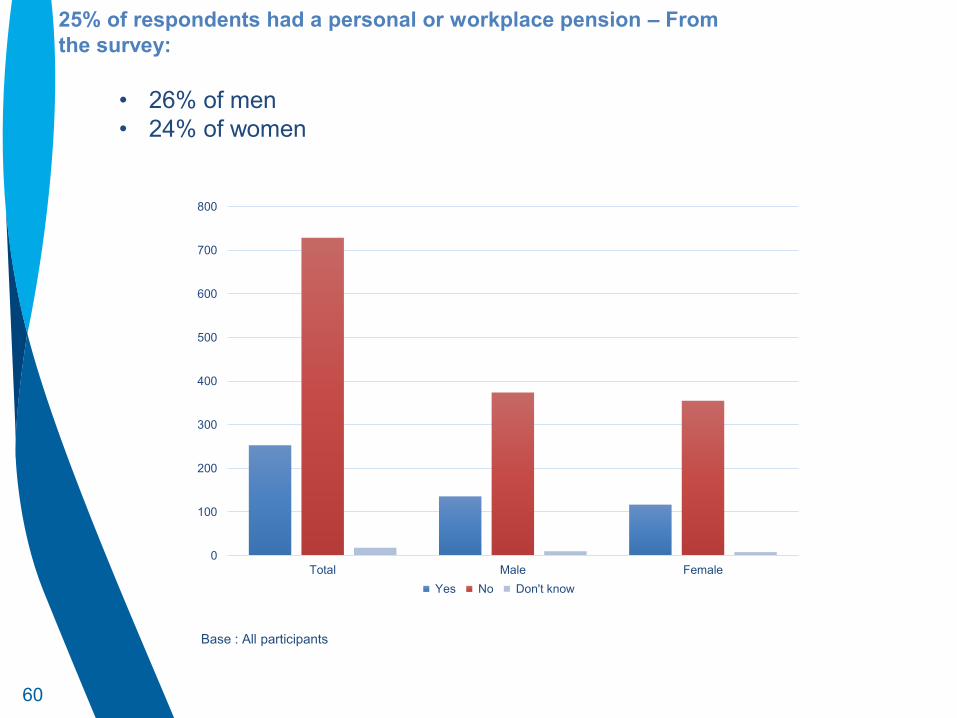
Base : All participants
25% of respondents had a personal or workplace pension – From the survey:
0
100
200
300
400
500
600
700
800
Total Male Female Yes No Don't know
• 26% of men • 24% of women
61
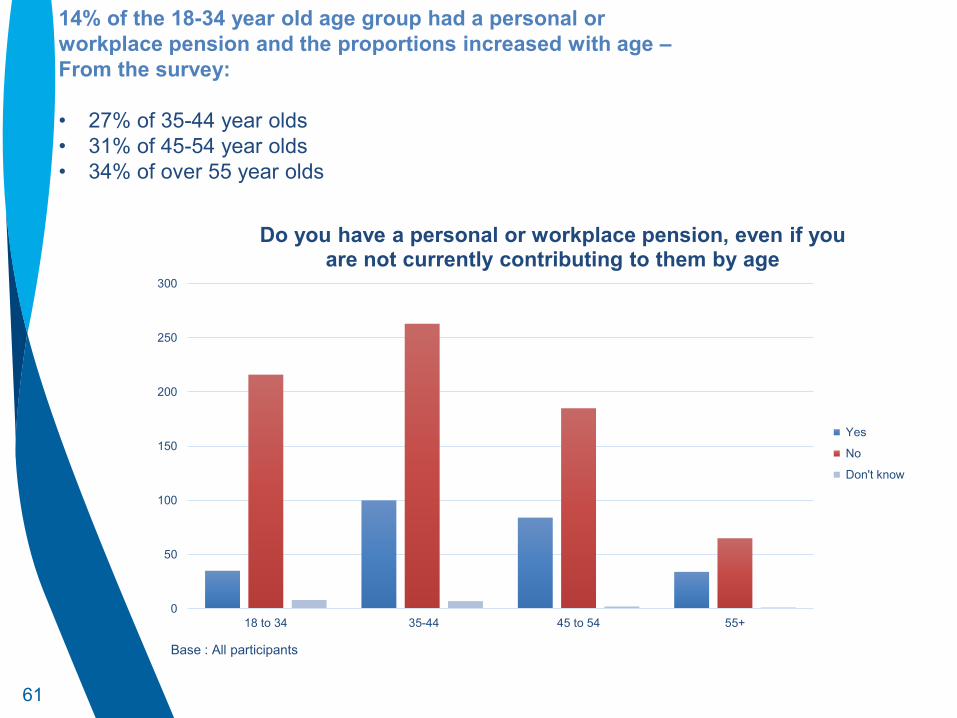
Base : All participants
14% of the 18-34 year old age group had a personal or workplace pension and the proportions increased with age – From the survey: • 27% of 35-44 year olds • 31% of 45-54 year olds • 34% of over 55 year olds
0
50
100
150
200
250
300
18 to 34 35-44 45 to 54 55+
Do you have a personal or workplace pension, even if you are not currently contributing to them by age
Yes
No
Don't know

62
Base : All participants
In terms of length of self-employment, the proportions of those with pension provision increased with the length of self-employment – From the survey: • 22% for those self-employed for less than a year • 24% for those self-employed between one and less than five years • 28% of those self-employed for five years or more
0
50
100
150
200
250
300
350
400
£500 or less £501-£1,000 £1,001 - £2,000 More than £2,000
Do you have a personal or workplace pension, even if you are not currently contributing to them by net monthly income
Yes
No
Don't know
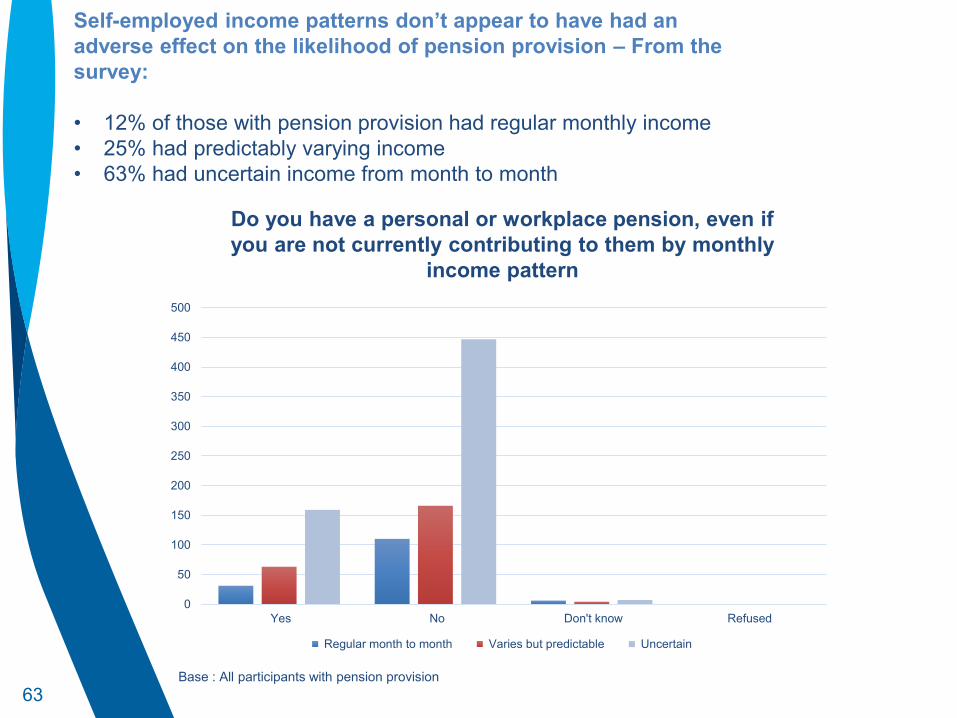
63 Base : All participants with pension provision
Self-employed income patterns don’t appear to have had an adverse effect on the likelihood of pension provision – From the survey: • 12% of those with pension provision had regular monthly income • 25% had predictably varying income • 63% had uncertain income from month to month
0
50
100
150
200
250
300
350
400
450
500
Yes No Don't know Refused
Regular month to month Varies but predictable Uncertain
Do you have a personal or workplace pension, even if you are not currently contributing to them by monthly
income pattern
64
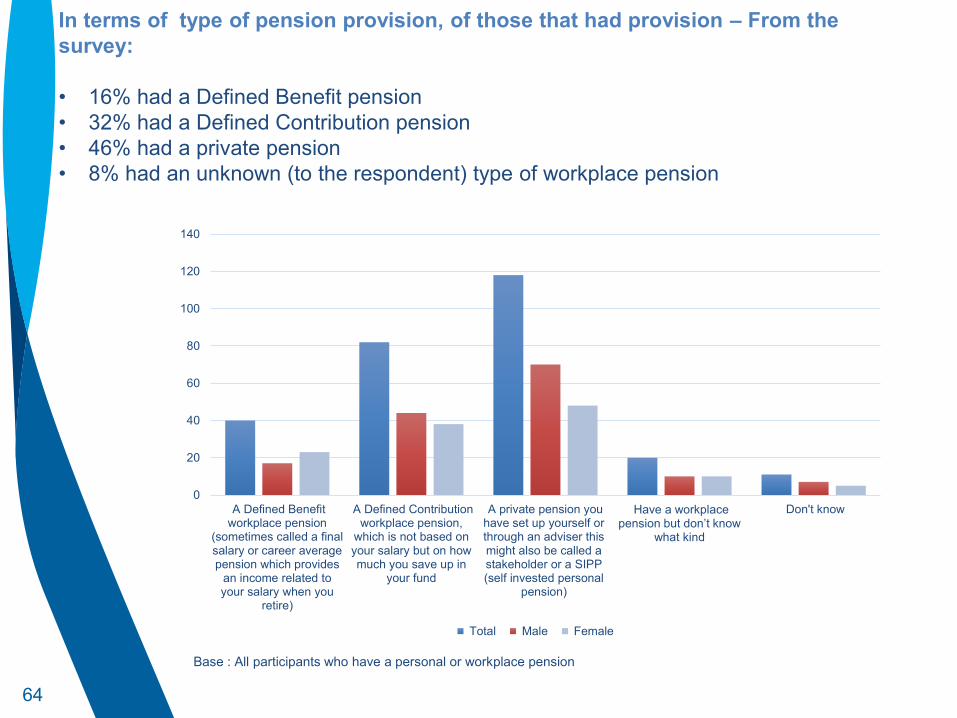
Base : All participants who have a personal or workplace pension
In terms of type of pension provision, of those that had provision – From the survey: • 16% had a Defined Benefit pension • 32% had a Defined Contribution pension • 46% had a private pension • 8% had an unknown (to the respondent) type of workplace pension
0
20
40
60
80
100
120
140
A Defined Benefitworkplace pension
(sometimes called a finalsalary or career averagepension which provides
an income related toyour salary when you
retire)
A Defined Contributionworkplace pension,
which is not based onyour salary but on howmuch you save up in
your fund
A private pension youhave set up yourself orthrough an adviser thismight also be called astakeholder or a SIPP(self invested personal
pension)
Have a workplace pension but don’t know
what kind
Don't know
Total Male Female
65 Base : All participants with a defined benefit, private or unknown workplace pension
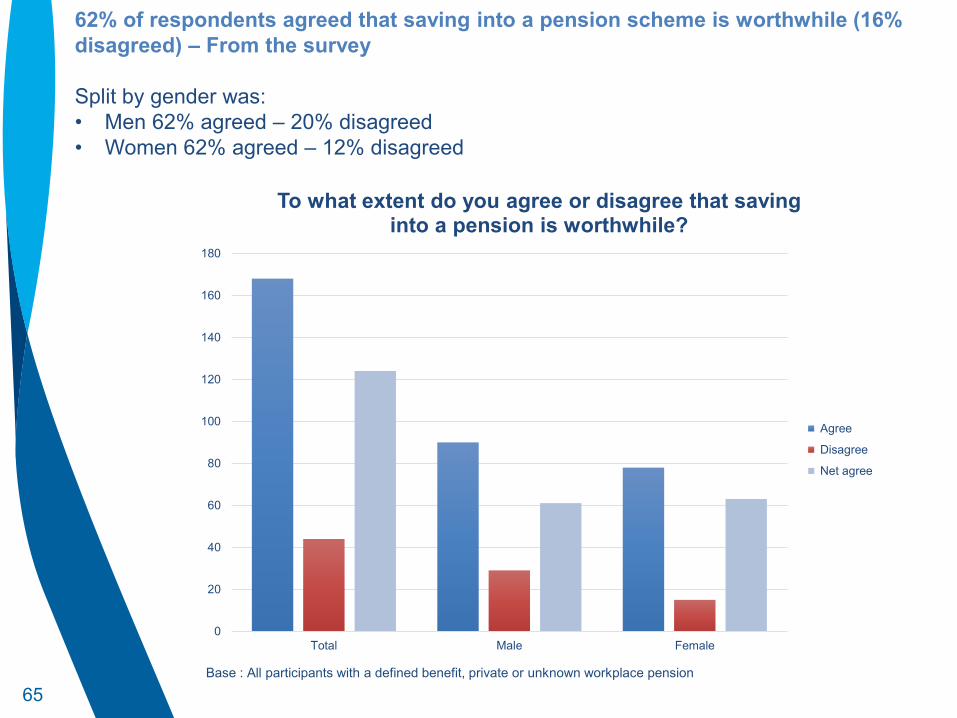
62% of respondents agreed that saving into a pension scheme is worthwhile (16% disagreed) – From the survey Split by gender was: • Men 62% agreed – 20% disagreed • Women 62% agreed – 12% disagreed
0
20
40
60
80
100
120
140
160
180
Total Male Female
To what extent do you agree or disagree that saving into a pension is worthwhile?
Agree
Disagree
Net agree
66
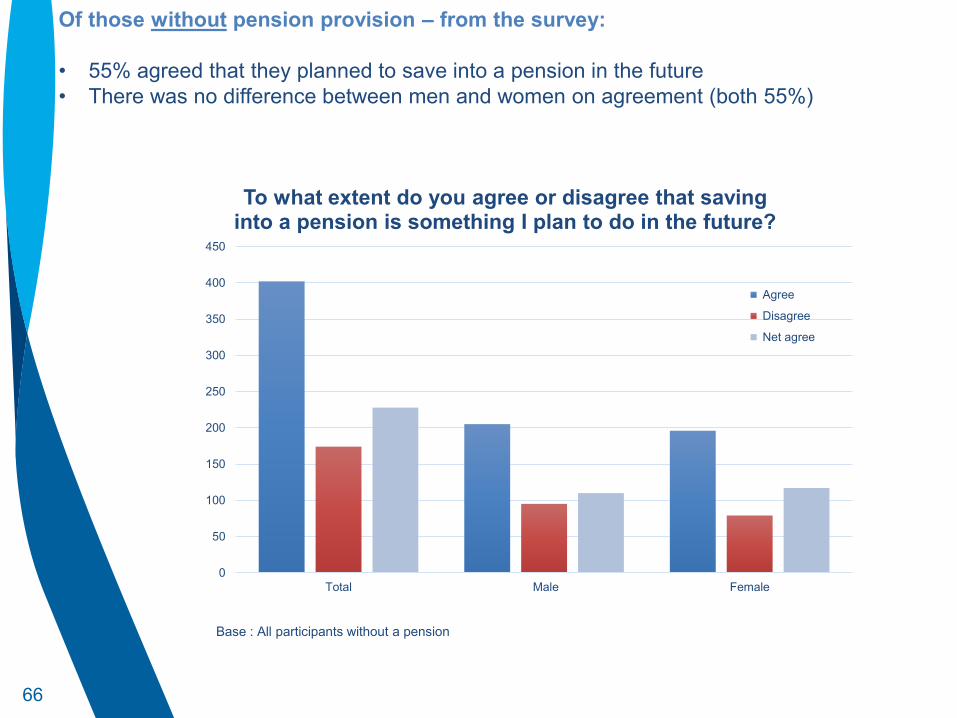
Base : All participants without a pension
Of those without pension provision – from the survey: • 55% agreed that they planned to save into a pension in the future • There was no difference between men and women on agreement (both 55%)
0
50
100
150
200
250
300
350
400
450
Total Male Female
To what extent do you agree or disagree that saving into a pension is something I plan to do in the future?
Agree
Disagree
Net agree

67 Base : All participants without a pension
Agreement with planning to save into a pension in the future decreased by age – From the survey: • 68% of 18-34 year olds agreed that they planned to save into a pension in the future • 60% of those aged between 35-44 years old agreed • 44% of those aged between 45-54 agreed • 22% of those over 55 years old agreed
-40
-20
0
20
40
60
80
100
120
140
160
180
18 to 34 35-44 45 to 54 55+
To what extent do you agree or disagree that saving into a pension is something I plan to do in the future by age
Agree
Disagree
Net agree
68
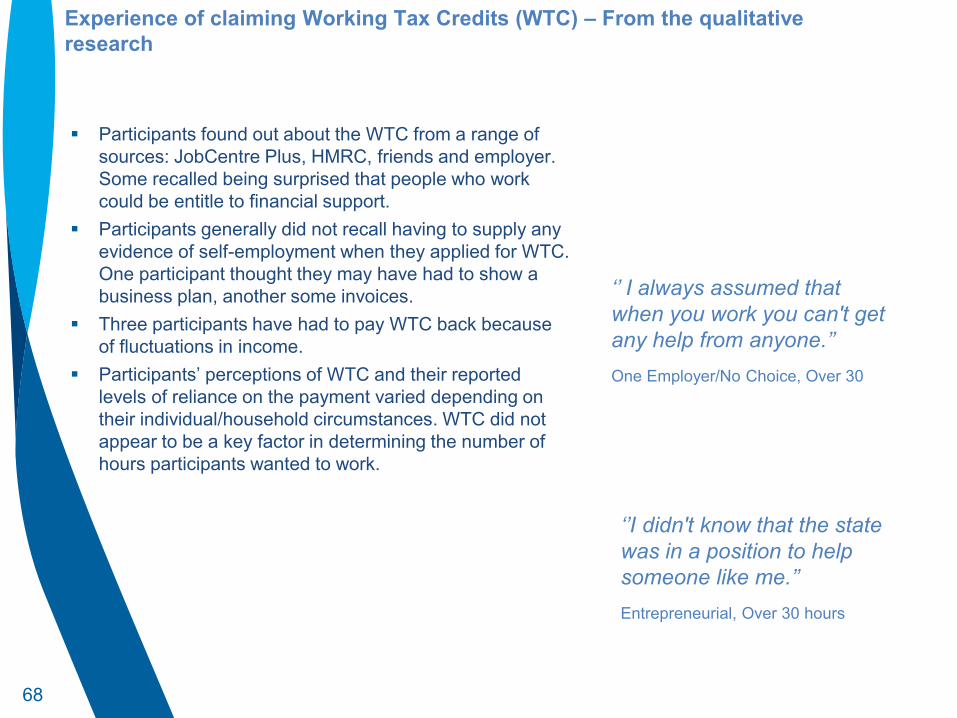
Experience of claiming Working Tax Credits (WTC) – From the qualitative research
Participants found out about the WTC from a range of sources: JobCentre Plus, HMRC, friends and employer. Some recalled being surprised that people who work could be entitle to financial support.
Participants generally did not recall having to supply any evidence of self-employment when they applied for WTC. One participant thought they may have had to show a business plan, another some invoices.
Three participants have had to pay WTC back because of fluctuations in income.
Participants’ perceptions of WTC and their reported levels of reliance on the payment varied depending on their individual/household circumstances. WTC did not appear to be a key factor in determining the number of hours participants wanted to work.
‘’ I always assumed that when you work you can't get any help from anyone.’’ One Employer/No Choice, Over 30
hours
‘’I didn't know that the state was in a position to help someone like me.’’ Entrepreneurial, Over 30 hours
69
Perception of Working Tax Credits – From the qualitative research
Participants’ views of WTC payments can be categorised as follows:
WTC was helpful but not essential because
there were other sources of income (e.g. partner working full-time).
WTC was essential to sustaining self-employment because this was the main source of income and/or the household income was low.
WTC was essential in helping participants through a ‘bad patch’ which may be temporary. Participants in this group had become eligible for WTC because their income from self employment had fallen. If their income doesn’t recover, they would be dependent on WTC to sustain their self employment (group 2 above).
WTC was essential to tide participants over during quiet periods, usually because work from self-employment was erratic or seasonal.
WTC was essential whilst the business was getting established. This period was thought to be longer than 6-12 months.
‘’It's been amazing, especially as I've been adjusting from motherhood to working…As we've been earning more, it's been coming down which is great...we're supporting ourselves through our freelance work.’’ Entrepreneurial, 16-30 hours
‘’It gives me a bit more independence. It lets me go out and do a bit.’’ One Employer/No Choice, 16-30 hours
‘’We wouldn’t be able to afford to live without it. We'd have to change. We'd have to get normal jobs.’’ Lifestyle, Under 16 hours
‘’I hope to get to the point where my wages increase sufficiently so I don't require it. This last year it's been a godsend...Without it, I would probably have had to have stopped.’’ One Employer/No Choice, Over 30 hours

70
Qualitative case studies
Fay: Helpful but not essential Fay has been self-employed since 2010 when she qualified as a clinical aromatherapist. She has 2-3 customers a week. All her work is repeat business. She does not want to do more hours because of problems with her shoulder and “running about” after her 10 year old son. Once her son starts secondary school next year, she will think about part-time employed work. She doesn’t know what she will do. WTC “certainly helps.” Her husband works full-time and they have no mortgage on their house. Lifestyle, Under 16 hours
George: Essential to self-employment
continuing
George has been self-employed for 40 years as a musician/musical producer. He made a reasonable living 20 years ago but “it’s got worse as the years have gone on.” His clients used to be institutions but are individuals now. Technology has helped drive his income down - “anyone can have very sophisticated recording equipment.” He loves his work and can work up to 70 hours a week. He first started claiming WTC three years ago when he found out about it. Without WTC “it would be curtains.” Entrepreneurial, Over 30 hours

71
Qualitative case studies
Liz: Helping me through a bad patch Liz worked for a catering company in a police station. When she was made redundant 12 years ago, she set up her own canteen in the police station with a friend (“we loved our job and wanted to carry on working here”). Their income has fallen over the years because there are now only 20-30 people working at the station when previously there had been 80. She first applied for WTC four years ago when she was off work for health reasons. She would have had to cease her business without it. She is optimistic about the future because the police station is closing down and a bigger one opening 10 minutes away. They are negotiating to move their canteen there. If this happens, she won’t need WTC. One Employer/No Choice, Over 30 hours
Liam: Getting started/tides me over in quiet times
Liam has been self-employed since 2014 following a period of unemployment. He is a web designer, graphic designer and film maker. He also converts video tapes to digital formats. These were previously hobbies but he decided he could make an income from it and did some training. His parents lent him some money to buy equipment. Work has been up and down. Location is his biggest problem because he is “in a dead end town.” He would like his work to increase but the problem is that “the digital world is getting so much easier for the average person to get hold of.” He thinks he may end up with less work over the next couple of years because of this, but with the right marketing could convince more people to use his services. WTC was very valuable when he was establishing his business. It has also been very helpful during quiet times: “When it's been absolutely dead months, it's been my saving grace." Entrepreneurial, 16-30 hours
72
Knowledge about Universal Credit (UC) – From the qualitative research
‘’They are putting all the benefits into one thing. I've never applied for it, I don't even know if it's in this area. I don't know anything about it.’’
Lifestyle, Under 16 hours
Understanding of UC
There was limited understanding about Universal Credit (UC) among participants. The most common response was that it was a move towards having a single payment and it was being rolled out across the country. Participants did not know much more beyond this.
Perceived impact of UC
Participants were unsure about how UC would affect them, and there was a tendency to adopt a ‘wait and see’ approach. Some thought it would be similar to WTC, whilst others thought they would be unaffected because they worked part-time, or would no longer be claiming in the near future. Those who had heard negative things about UC expressed concerns that it may be difficult to get payments.
‘’I kind of feel that by the time that comes into being, we'll probably be past it.’’ Entrepreneurial, 16-30 hours
‘’My friend keeps saying it is going to come in. It's a different way of doing it. She's a bit worried about it. ‘Oh, I'm not going to be able to live and I'm going to have to get a full-time job.’’
Lifestyle, Under 16 hours
73
Sources of information about UC – From the qualitative research
Participants had most commonly heard about UC on the news. Some knew people who were claiming it, whilst others had seen it mentioned on WTC paperwork and claim forms (e.g. claims for dentist treatment).
Participants most commonly reported that they would go online if they wanted to find out more about UC, for example, visiting the gov.uk or DWP website, or simply using Google. Other potential sources that participants would use include libraries and accountants. Some would telephone DWP.
However, at the time of this research, most participants were adopting a ‘wait and see’ approach. There was not an impetus to find out more about it.
‘’Nine times out of ten that sort of thing, it's all through the Government so you get links to the Government sites. That's what I've done in the past.’’
One Employer/No Choice, 16-30 hours
‘’It could be stressful. It would worry me. But I've got to think about it when it happens. There's no point in getting stressed until it happens.’’
One Employer/No Choice, 16-30 hours
74
Awareness and understanding of the Minimum Income Floor (MIF) - From the qualitative research
Only one participant was vaguely aware of something akin to the Minimum Income Floor (MIF). Participants struggled with the concept and interpretations of MIF ranged from: It’s the amount you needed to earn to be eligible for
UC Money will be deducted if you don’t make a certain
amount It’s a minimum wage (the term ‘minimum’ gave the
impression that it was a minimum safety level). Participants were uncertain about how the MIF would
affect them. They raised a number of questions: How does MIF apply to couples? What about if you
are part-time? Is housing taken into account? Is the MIF figure your net profit?
Explanation given to participants: The Minimum Income Floor is an assumed level of income based on how much someone would expect to earn if they work full-time on the NMW for someone their age. For a fit adult aged 25 +, this is around £1,007 a month. DWP will compare a self-employed claimant’s income with the MIF and use whichever figure is higher when calculating the amount of UC the claimant is eligible for.
‘’I have read stuff about self-employed people about whether they're eligible and you've got to meet certain criteria. That we have to be earning so much a week. Other than that, I don't really know.’’ Entrepreneurial, Over 30 hours
‘’I don't get anywhere near that. So what would I do? So you're not allowed to claim Universal Credit?’’ Lifestyle, Under 16 hours
‘’If you don't make that much, your money will probably get deducted.’’ One Employer/No Choice, 16-30 hours
75
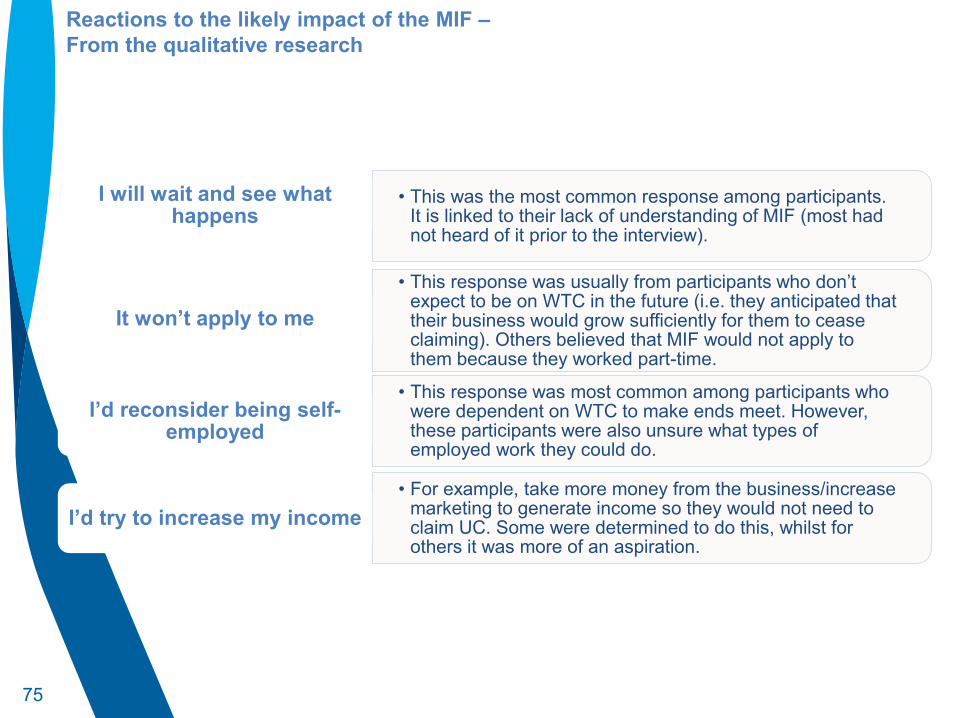
Reactions to the likely impact of the MIF – From the qualitative research
• This was the most common response among participants. It is linked to their lack of understanding of MIF (most had not heard of it prior to the interview).
I will wait and see what happens
• This response was usually from participants who don’t expect to be on WTC in the future (i.e. they anticipated that their business would grow sufficiently for them to cease claiming). Others believed that MIF would not apply to them because they worked part-time.
It won’t apply to me
• This response was most common among participants who were dependent on WTC to make ends meet. However, these participants were also unsure what types of employed work they could do.
I’d reconsider being self-employed
• For example, take more money from the business/increase marketing to generate income so they would not need to claim UC. Some were determined to do this, whilst for others it was more of an aspiration.
I’d try to increase my income
76
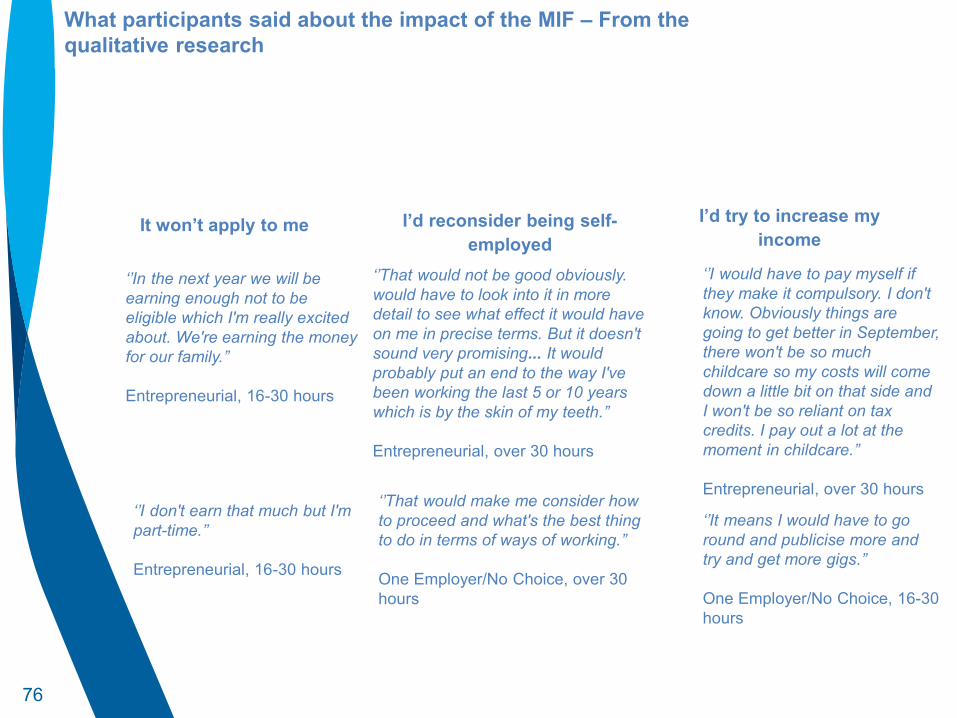
What participants said about the impact of the MIF – From the qualitative research
‘’In the next year we will be earning enough not to be eligible which I'm really excited about. We're earning the money for our family.’’ Entrepreneurial, 16-30 hours
‘’It means I would have to go round and publicise more and try and get more gigs.’’ One Employer/No Choice, 16-30 hours
‘’That would not be good obviously. I would have to look into it in more detail to see what effect it would have on me in precise terms. But it doesn't sound very promising... It would probably put an end to the way I've been working the last 5 or 10 years which is by the skin of my teeth.’’ Entrepreneurial, over 30 hours
‘’I would have to pay myself if they make it compulsory. I don't know. Obviously things are going to get better in September, there won't be so much childcare so my costs will come down a little bit on that side and I won't be so reliant on tax credits. I pay out a lot at the moment in childcare.’’ Entrepreneurial, over 30 hours
‘’That would make me consider how to proceed and what's the best thing to do in terms of ways of working.’’ One Employer/No Choice, over 30 hours
It won’t apply to me I’d try to increase my income
I’d reconsider being self-employed
‘’I don't earn that much but I'm part-time.’’ Entrepreneurial, 16-30 hours
77
Ipsos MORI’s standards and accreditations
Ipsos MORI’s standards and accreditations provide our clients with the peace of mind that they can always depend on us to deliver reliable, sustainable findings. Our focus on quality and continuous improvement means we have embedded a ‘right first time’ approach throughout our organisation.
The international market research specific standard that supersedes BS 7911 / MRQSA & incorporates IQCS (Interviewer Quality Control Scheme); it covers the 5 stages of a Market Research project. Ipsos MORI was the first company in the world to gain this accreditation.
ISO 20252:2012
This work was carried out in accordance with the requirements of the international quality standard for market research, ISO 20252:2012 and with the Ipsos MORI Terms and Conditions.
By being an MRS Company Partner, Ipsos MORI endorse and support the core MRS brand values of professionalism, research excellence and business effectiveness, and commit to comply with the MRS Code of Conduct throughout the organisation.
MRS Company Partnership
International general company standard with a focus on continual improvement through quality management systems. In 1994 we became one of the early adopters of the ISO 9001 business standard.
ISO 9001:2008
International standard for information security designed to ensure the selection of adequate and proportionate security controls. Ipsos MORI was the first research company in the UK to be awarded this in August 2008.
ISO 27001:2005
Ipsos MORI is required to comply with the Data Protection Act; it covers the processing of personal data and the protection of privacy
Data Protection Act