SELECTION FOR RATE AND EFFICIENCY OF LEAN GAIN IN THE
20
SELECTION FOR RATE AND EFFICIENCY OF LEAN GAIN IN THE RAT' DAVID R. NOTTER2, G. E. DICKERSON3 and J. A. DESHAZER4 University of Nebraska and U.S. Department of Agriculture Lincoln, Nebraska 68503 Manuscript received October 20, 1975 Revised copy received May 3, 1976 ABSTRACT Full-sib family selection for rate (WP) or efficiency (WP/F) of protein gain in rats from 3 to 9 weeks of age was applied for five generations. Three rats per litter were killed to estimate carcass protein. Standardized response/ cumulative selection for WP was .19+-.10 for WP, .28+-.10 for 3- to 9-week gain, ,282.08 for 9-week weight, .16+.08 for litter size, .22-C.12 for skinning loss and --.07+.09 for fraction of protein in the live weight. Response from selection for WP/F was .184.16 for WP/P, .20f.11 for WP, .21*.11 for weight gain, .16+-.ll for 3-week weight, .21+-.10 for 9-week weight, but negligible for skinning loss or body protein. Response to WP/F selection was extremely variable among generations, associated with generation differences in weight and composition at 9 weeks. Estimates of heritability from offspring-midparent regression were .201.12 for WP and .24*.08 for WP/P. Estimates of genotype-generation environment interaction were large for growth, feed intake and skinning loss. Maternal effects were large for wean- ing weight, fraction of body protein and WP. Sire component genetic correla- tions were 1.08k.13 for WP with total gain, .92f.08 for WP/F with gross efficiency and .29+.25 for WP with WP/F. A partitional calorimeter was used to evaluate heat production of rats. Lines differed in average heat loss but not in heat loss per unit actual or metabolic weight. Response to selection has been steady for WP but probably could be improved by selecting for WP/F at a constant weight rather than a constant age. 0 improve efficiency of protein production, quantity, cost and composition of Tgain must all be considered. If large animals are larger only because of in- creased fat deposition, the extra fat may be worth much less than the feed re- quired to produce it. BIONDINI, SUTHERLAND and HAVERLAND (1968) found that in mice selected for 4- to 11-week gain (SUTHERLAND et al. 1970), percentage of fat increased by 73% over controls and percentage of protein declined 16%. ROBINSON and BRADFORD (1969) found large increases in percentage of fat but essentially no changes in composition of the fat-free body in mice selected for 3- to &week gain for 14 generations. The present experiment was an extension of a study begun in 1968 to compare selection for rate and for efficiency of lean tis- sue growth in the rat. ' Published as Paper No. 4061 Journal SeTies, Nebraska Agricultural Experiment Station, Lincoln. as partial publication as Master of Science Thesis research. Financial support was provided by the senior au- thor's National Science Foundation Fellowship, Nebraska Asricultural Experiment Station Project 1329 (Swine Breeding) and Animal .Science Small Animal and Meat Laboratories and from College Work Study and Job Experience and Trainipg Programs funded by the U.S. Comprehensive Employment Training Act. 'NSF Fellow 1972-74 at University of Nebraska. Presently Research Geneticist, U.S. Meat Animal Re- search Center, Clay Center, Nebraska 68933 ' U S . Meat Animal Research Center, Clay Center, Nebraska 68933 ' Animal Systems Lab, Department of Agricultural Engineering, University of Nebraska. Lincoln 68503 Genetics 84: 125-144 September, 1976. Downloaded from https://academic.oup.com/genetics/article/84/1/125/5991827 by guest on 01 January 2022
Transcript of SELECTION FOR RATE AND EFFICIENCY OF LEAN GAIN IN THE

SELECTION FOR RATE AND EFFICIENCY OF LEAN GAIN IN THE RAT'
DAVID R. NOTTER2, G. E. DICKERSON3 and J. A. DESHAZER4
University of Nebraska and U.S. Department of Agriculture Lincoln, Nebraska 68503
Manuscript received October 20, 1975 Revised copy received May 3, 1976
ABSTRACT
Full-sib family selection for rate (WP) or efficiency ( W P / F ) of protein gain in rats from 3 to 9 weeks of age was applied for five generations. Three rats per litter were killed to estimate carcass protein. Standardized response/ cumulative selection for W P was .19+-.10 for WP, .28+-.10 for 3- to 9-week gain, ,282.08 for 9-week weight, .16+.08 for litter size, .22-C.12 for skinning loss and --.07+.09 for fraction of protein in the live weight. Response from selection for W P / F was .184.16 for W P / P , .20f.11 for WP, .21*.11 for weight gain, .16+-.ll for 3-week weight, .21+-.10 for 9-week weight, but negligible for skinning loss or body protein. Response to W P / F selection was extremely variable among generations, associated with generation differences in weight and composition at 9 weeks. Estimates of heritability from offspring-midparent regression were .201.12 for WP and .24*.08 for W P / P . Estimates of genotype-generation environment interaction were large for growth, feed intake and skinning loss. Maternal effects were large for wean- ing weight, fraction of body protein and WP. Sire component genetic correla- tions were 1.08k.13 for WP with total gain, .92f.08 for W P / F with gross efficiency and .29+.25 for WP with W P / F . A partitional calorimeter was used to evaluate heat production of rats. Lines differed in average heat loss but not in heat loss per unit actual or metabolic weight. Response to selection has been steady for WP but probably could be improved by selecting for W P / F at a constant weight rather than a constant age.
0 improve efficiency of protein production, quantity, cost and composition of Tgain must all be considered. If large animals are larger only because of in- creased fat deposition, the extra fat may be worth much less than the feed re- quired to produce it. BIONDINI, SUTHERLAND and HAVERLAND (1968) found that in mice selected for 4- to 11-week gain (SUTHERLAND et al. 1970), percentage of fat increased by 73% over controls and percentage of protein declined 16%. ROBINSON and BRADFORD (1969) found large increases in percentage of fat but essentially no changes in composition of the fat-free body in mice selected for 3- to &week gain for 14 generations. The present experiment was an extension of a study begun in 1968 to compare selection for rate and for efficiency of lean tis- sue growth in the rat. ' Published as Paper No. 4061 Journal SeTies, Nebraska Agricultural Experiment Station, Lincoln. as
partial publication as Master of Science Thesis research. Financial support was provided by the senior au- thor's National Science Foundation Fellowship, Nebraska Asricultural Experiment Station Project 1329 (Swine Breeding) and Animal .Science Small Animal and Meat Laboratories and from College Work Study and Job Experience and Trainipg Programs funded by the U.S. Comprehensive Employment Training Act.
'NSF Fellow 1972-74 at University of Nebraska. Presently Research Geneticist, U.S. Meat Animal Re- search Center, Clay Center, Nebraska 68933
'US . Meat Animal Research Center, Clay Center, Nebraska 68933 ' Animal Systems Lab, Department of Agricultural Engineering, University of Nebraska. Lincoln 68503
Genetics 84: 125-144 September, 1976.
Dow
nloaded from https://academ
ic.oup.com/genetics/article/84/1/125/5991827 by guest on 01 January 2022

126 D. R. NOTTER, G . E. DICKERSON A N D J . A. DESHAZER
MATERIALS A N D METHODS
Genetic material: Foundation rats were obtained by crossing females of eight lines with males of two lines from the Small Animal Laboratory of the University of Nebraska Animal Science Department. The lines had been selected for high o r low growth rate on conventional diets or diets supplemented with thyroprotein or thiouracil (ABDEL-MALEK and BLUNN 1974). Initial crosses were made in 1968. Systematic combinations of crosses with random selection of breed- ers within crosses were used to obtain the broadest possible combination of parent lines by the F4. F5 rats from random infer se mating of F4 parents were randomly assigned within litters to one of three populations at weaning (GOSEY 1976). Two of the populations, LG and LE, were selected for rate and for efficiency of lean gain, respectively; the third was an unselected control (C). Each selected population was divided into two lines, each reproduced by randomly mating 40 selected females to 20 selected males. The C population was divided into three lines, each reproduced by 20 pair matings of unselected rats representing all litters. Different population structures were used in selected and control lines to equalize expected effective population size. Inbreeding of 1% or less per generation was expected when breeders were chosen from the best 50% of litters in selected lines and first-cousin matings were avoided. The LG and LE lines were selected for nonfat gain for 6 generations under procedures similar to those in the present study (GOSEY 1976). Base populations for the present study (generation zero) were produced by intra-line matings of unselected progeny from the sixth generation of the initial selection and represent an extension of the original LG, LE and C lines.
Management: The laboratory was kept at 26", 45% relative humidity and 12 hours light per day. The diet was 24% crude protein, 6% crude fat, 4.5% crude fiber and 50% nitrogen-free extract except during generation 2, when a 4% fat ration was fed. Litters were reduced to a maximum of nine rats (ideally, four males and five females) at 1 day of age. Cross-fostering was not allowed. Rats were weaned at 21 days of age, and litters were divided into cages of one or two males or of two or three females from 21 to 63 days. Wahmann LC-278* tunnel feeders designed to minimize feed waste were used to measure feed intake of LE and alternate C litters. Bulk feeders of larger capacity were used for all other rats. Wahmann feeders restrict access to food so true ad libitum feeding was not maintained and rats were about 10% lighter than in bulk feeders. TEPPERMAN and TEPPERMAN (1964) and LEVEILLE (1970) have shown that rats exposed to meal feeding can have poorer nitrogen retention and increased proportion of fat in tissue synthesis. Rats were moved from Wahmann to bulk feeders at 10 weeks ( 3 to 6 weeks before mating) to avoid feeder effects on fertility and to reduce labor.
Selection procedures: Selection among full-sib families was practiced for rate (LG) or for efficiency (LE) of lean gain from 3 to 9 weeks. The selection criterion in LG lines was estimated litter average gain of protein tissue in the skinned carcass from 3 to 9 weeks of age (WP) as calculated from the mean weight of all rats in the litter and carcass data from one female and two males. Rats closest to the litter-sex mean for 9-week weight were killed and skinned after 24 hours without food, but with water (TSAI, COLE and RAMSEY 1972). Two, I-gram samples from the ground, homogenized litter sample of three rats were analyzed for protein (A.O.A.C. 1965) at the University of Nebraska Meat Laboratory. The analysis was repeated i f determina- tions differed by more than 1% protein. Multiplicative within generation and population fac- tors were used to adjust all traits except protein content to a male-equivalent. W P was cal- culated for each litter as:
W P = (G3.9) X (E%) X ( P R O T X ) = (G3.9) (P9/W9) where G3.9 is mean 3- to 9-week gain, SC% is mean ratio of skinned carcass weight to un- shrunk weight for the slaughtered rats, PROT% is protein fraction in the pooled carcass sample, W9 is 9-week weight and P9 is g-vveek protein weight. SC% and PROT% for G3.9 and W9 were assumed equal becauseG3 09 equals about 85% of W9. In LE lines, the selection criterion was W P / F where F is litter mean feed consumption.
Calorimetry: In generation 2, 47 pairs of full-sib males were used to test line differences in
* Mention of a trade name, proprietary product or specific equipment does not constitute a guarantee or warranty by the U.S. Department of Agriculture and does not imply its approval to the exclusion of other products that may be suitable.
Dow
nloaded from https://academ
ic.oup.com/genetics/article/84/1/125/5991827 by guest on 01 January 2022

LEAN GROWTH SELECTION IN RATS 127 heat production at 9 weeks. A continuous-measuring. partitional calorimeter maintained by the Department of Agricultural Engineering of the University of Nebraska ( DESHAZER, JORDAN and SUGGS 1970) was used to measure heat loss. Sensible heat loss, which is the sum of con- ductive, radiative and convective heat losses, was measured using a gradient layer thermopile. Expected conductive heat loss was made negligible by suspending the rats in a wire cage with a plexiglass hanger. An infrared moisture analyzer (OLSON and DESHAZER 1974) was used to measure evaporative heat loss. Rats spent 21. hours before measurement without food in a mock calorimeter to become accustomed to the calorimeter. Temperature and lighting were the same in the calorimeter, mock calorimeter and laboratory. Heat loss was characterized by initial high readings, which declined to apparent equilibrium in 30 to 60 minutes, and were followed by a 60-minute measurement period. The minimum heat loss observed during the measurement period was considered to represent basal heat loss, and the difference between average and basal heat loss was defined as due to voluntary activity.
Statistical methods: Realized heritabilities (h') and genetic correlations ( r , , ) were estimated from simple regressions (b , ) of mean deviations of selected lines from C rats fed in the same type of feeder ( D , ) on corresponding cumulative selection differentials (SI ) over generations. Only selection applied in selected lines was used. Average selection differentials in C lines were not significantly different from zero. Litter mean selection differentials were weighted by the number of offspring contributing to the subsequent generation mean. Selection differentials and selection responses were standardized using within generation and population standard devia- tions of litter means ( U ; : ) . Correlated responses were measured for +week weight (W3), 9- week weight (W9), 3- to 9-week gain (G3*9), yield of shinned carcass ( S C % ) , carcass protein fraction (PROTX), weight of protein as a fraction of live weight (WP/W9) and number born (NOBORN) in LG and LE lines, and for cage mean feed consumption ( F E E D ) and gross ef ficiency (G/F) in LE lines.
Methods of DICKERSON (1969) and HILL (1971. 1972a.b) were adapted to estimate standard errors of realized response to full-slb family selection. DICKERSON (1 969) has shown that the standard error of b, calculated from observed deviations from regression is biased downward because it ignores positive correlation among gerlerations due to cumulative random genetic drift. DICKERSON has defined components of variation due to between generation drift (oe,,)
and random intrageneration sources ( ~ 2 , ) and HILL (1972b) has added adustments for selec- tion such that when a selected population is deviated from an independent control:
where Me and K , are numbers recorded and N , and L, are effective population sizes in se- lected and control populations, respectively. h' is heritability, u,,z is phenotypic variance of in- dividual values and i and z are the mean and truncation point of the selected sample on a standard normal curve.
When selection is based on family means,
1 bc=h2 ["-- r ( n - 1) 1 + t ( n - I )
which is heritability of a litter mean (derived from LUSH 1947). r and t are intraclass genetic and phenotypic correlations among full sibs and n is number per litter. This is not strictly cor- rect when carcass data from a subsample of the litter is used, but should be satisfactory since variation in traits measured on all rats (G3.9. FEED) account for 83 and 67% of the variation in WP and WP/F, respectively. Thus:
For I Z . 5 for full sibs (ignoring inbreeding) and using average n of 8.2 rats, hzu%=1.78 btu,+. Recognizing that the squared correlation between genetic and phenotypic litter means used to adjust ~ ( ~ 2 for selection is estimated by b,, and that the reduction applies only to the
Dow
nloaded from https://academ
ic.oup.com/genetics/article/84/1/125/5991827 by guest on 01 January 2022

128 D. R. NOTTER, G. E. DICKERSON A N D J. A. DESHAZER
between litter fraction of the genetic variance, which is '/z the total genetic variance' in an un- selected random mating population;
uzd 1 1 . 7 8 b,[l - i /bc (i - x)] u$/N, + 1.78 b( .~p ' / /L , U'? 1 (1 ~- .89b,) U?' (l/M,.+ I jK?)
where .89bc='/z (1.78)b,, is the fraction of U$ accounted for by variation among parental gene- tic means, M e and K, are numbers of litters and U,$ = 1 in standardized data. For correlated response. in litter mean of trait j under selection for litter mean of trait i:
u ' ~ = 1.78 b , [l - i / b TI'/,. (i - x)] U? /N;+ 1.78 bc,.u$ . /Le ( i ".i I ' .i I f
U', =I (1 - .89b,,) U$, ( l / M e + l/Kc)
where 1.78 b,,up' is estimated from regression of offspring on midparent litter mean (bop) for traits not under selection. rl, is the realized genetic correlation:
where bl, S. measures indirect response to selection for W P or W P / F . Variances of regression
coefficients [V(b,,)] can be computed as linear functions of U!,, and uze ignoring any real gen- eration variation in response, or may be estimated as linear functions of observed variances of
J L
regression coefficients [U(b,)] and uzd by: ' 2(3z f 4)
V(b,) = U(b,) + U?d 5s2(z + 1) ( z + 2 )
( 3 )
where z is number of generations, s is average selection differential and effective population sizes are assumed constant over generations (HILL 1972b).
When all litters are sampled to obtain breeders, as in C lines, effective population size for estimation of uZd is larger than for random sampling (CROW 1951; CROW and MORTON 1955; GOWE, RORERTSON and LATTER 1958), while under selection N , is reduced (ROBERTSON 1961). Mean number of litters measured and effective population sizes were 61.0 litters and 69.9 rats in each selected popuplation. In C lines; 22.1 bulk-fed and 21.3 Wahmann-fed liters were meas- ured each generation and effective population size averaged 110.7. Effective population sizes were summed across lines to estimate average effects of drift, and were 31% greater and 26% less than for random sampling in C and selected lines, respectively. Withiwline effective num- bers should be used to estimate intra-line inbreeding and averaged 35.0 rats in selected lines and 37.7 rats in C lines.
Analysis of variance was used to estimate genetic parameters from the first three genera- tions. The model varied, depending on whether the trait was measured on individuals, cages or litters. The most complete model was a three-fold nesting considering effects of cage within (lam within sire within line-gener;.tion subclass, and including covariates for number of rats per cage, number weaned arid birth date. Effects of cages, sires and dams were considered ran- dom (HARVEY 1970). Traits measured on individuals or cages were analyzed separately for each feeder type-sex subclass because of heterogeneity of residual variances. Heritabilities, genetic correlations and their standard errors were calculated as described by DICKERSON (1969). Heritabilities may be underestimated somewhat due to selection.
Heritabilities were also estimated by regression of offspring on parent (bo/,). For mean carcass traits (SC%, P R O T X ) , the regression of progeny litter mean on midparent full-sib litter mean estimates:
bo, = h2 [-----I Tn
1 + (n- l ) t where n=3. Thus, b,,, exactly equals h? only if t z . 2 5 . For W P and W P / F , bo,, approximates the heritability of a litter mean [formula (l)], and provides an unbiased estimate of expected selection response.
Calorimetry data were analyzed with a fixed-effects model for unequal subclass numbers (HARVEY 1960) including effects of time, population-feeder subclass and the interaction. The four time classes represent entry into the calorimeter at 9:OO ami., 11:OO a.m., 1:OO p.m. knd 3:OO p.m. Average and basal heat loss and voluntary activity were anaIyzed as heat loss, loss/
Dow
nloaded from https://academ
ic.oup.com/genetics/article/84/1/125/5991827 by guest on 01 January 2022

I WP/ F
n
b Y
W v) z 0 P v) w a W > - s -I 3 I 3 0
n
b Y
W v) z 0 P v) W a w > k 4 J 3 I 3 0
-
W P 2/
11 SC%
\ , -1
0 1 2 3 4 5 CUM U LAT I VE
2 I
1 2 3 4 5
1 I WP/W9
//o-o\/LE 01 ( , , o , , -.5
1 2 3 4 5
I t FEED
-1-5
PROT % I
SELECTION 4 r) I w 3
1 2 3 4 5 - 1
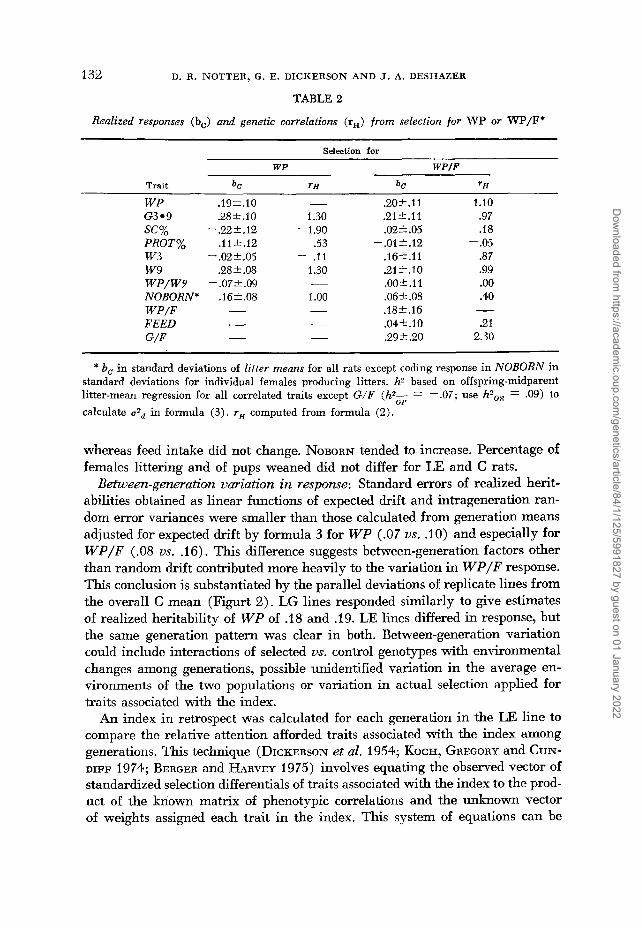
CUMULATIVE SELECTION (ff) FIGURE 1 .-Direct and correlated standardized responses to standardized cumulative selection
for WP in the LG line and W P / F in the LE line from 21 to 63 days of age. Response in NOBORN and percentage of females littering is expressed in rats and percentages, respectively, rather than standard deviation units. See “Statistical methods” in text for abbreviations.
Dow
nloaded from https://academ
ic.oup.com/genetics/article/84/1/125/5991827 by guest on 01 January 2022

130 D. R. NOTTER, G . E. DICKERSON A N D J. A. DESHAZER
TABLE la
Line-generation subclass means’
Line- PROT% SC% WPI w9 Generation feedert W P (g) WPIF (g/g) G3-9 ( 9 ) % % %
0 LG-b C-b LE-s c-s
1 LG-b C-b LE-s c-s
2 LG-b C-b LE-s c-s
3 LG-b C-b LE-s C-S
4 LG-b C-b LE-s c-s
5 LG-b C-b LE-s c-s
34.34 35.15 30.11 30.55
34.55 34.29 31.49 29.81
34.40 32.22 30.57 30.38
30.66 28.56 27.97 25.26
36.70 35.40 29.70 28.41
38.94 37.28 35.24 33.23
- -
.0573
.0555
- -
.0562
.0534
- -
.0487
.0482
- -
.0470
.0414
- -
.0493
.OM2
- -
.0495
.0462
247.3 246.9 217.5 218.5
247.5 239.9 224.8 212.3
265.2 245.2 234.2 235.3
217.0 205.2 203.2 187.1
273.0 258.9 225.1 210.9
291.5 270.2 262.7 248.2
18.98 19.62 19.07 19.16
19.31 19.75 19.15 19.34
18.35 18.44 18.50 18.38
19.16 19.40 19.11 18.94
18.40 18.32 17.98 18.32
18.43 18.76 18.46 18.45
73.2 72.5 72.7 73.2
72.4 72.0 72.8 72.9
70.9 71.1 70.5 70.4
72.1 71.2 71.9 71.7
73.1 74.7 73.4 73.7
72.6 73.6 72.8 73.0
13.89 14.22 13.86 14.03
14.06 14.22 13.93 14.09
12.99 13.12 13.04 12.94
13.82 13.82 13.75 13.58
13.46 13.68 13.19 13.51
13.38 13.81 13.44 13.47
* See “Statistical methods” in text for abbreviations. +Line codes are LGZlean gain, LE=lean efficiency, C=control. Feeder codes are b=bulk
and s=Wahmann.
weight and loss/ (weight).’5. Population and feeder differences were tested with orthogonal linear contrasts.
RESULTS A N D DISCUSSION
Selection response: The relationships between cumulative response in direct and correlated traits and cumulative selection for W P or W P / F are shown in Figure 1. Line-generation subclass means are shown in Table 1. Regression co- efficients of cumulative response on cumulative selection differential are shown in Table 2 for litter means. Standard errors were calculated from formula (3) with four degrees of freedom.
Selection for W P gave positive trends (P<.125) in WP, G3.9 and W9 while W3 did not change. Weight of protein as a percent of live weight increased through generation 3, but then declined as W9 increased. Fraction of protein in
Dow
nloaded from https://academ
ic.oup.com/genetics/article/84/1/125/5991827 by guest on 01 January 2022
LEAN GROWTH SELECTION IN RATS
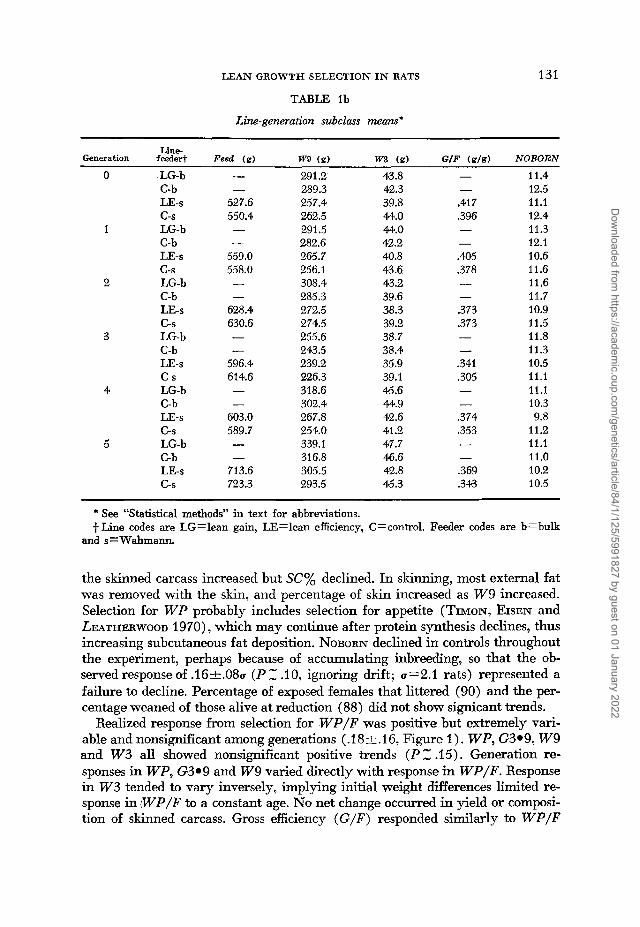
TABLE l b
Lk-generation subclass means*
131
0 LG-b - 291.2 43.8 - 11.4 C-b - 289.3 42.3 - 12.5 LE-s 527.6 257.4 39.8 .417 11.1 c-s 550.4 262.5 44.0 .396 12.4
1 LG-b - 291.5 44.0 - 11.3 C-b - 282.6 42.2 - 12.1 LE-s 559.0 265.7 40.8 .405 10.6 c - s 558.0 256.1 43.6 .378 11.6
2 LG-b - 308.4 43.2 - 11.6 C-b - 285.3 39.6 - 11.7 LE-s 628.4 272.5 38.3 .373 10.9 c-s 630.6 274.5 39.2 .373 11.5
3 LG-b - 255.6 38.7 - 11.8 C-b - 243.5 38.4 - 11.3 LE-s 596.4 239.2 35.9 .341 10.5 c-s 614.6 226.3 39.1 .305 11.1
4 LG-b - 318.6 45.6 - 11.1 C-b - 302.4 44.9 - 10.3 LE-s 603.0 267.8 42.6 .374 9.8 c-s 589.7 254.0 41.2 .353 11.2
5 LG-b - 339.1 47.7 - 11.1 C-b - 316.8 46.6 - 11.0 LE-s 713.6 305.5 42.8 .369 10.2 c-s 723.3 293.5 45.3 .343 10.5
* See “Statistical methods” in text for abbreviations. +Line codes are LG=lean gain, LE=lean efficiency, C=control. Feeder codes are bzbulk
and s=Wahmann.
the skinned carcass increased but SC% declined. In skinning, most external fat was removed with the skin, and percentage of skin increased as W 9 increased. Selection for W P probably includes selection for appetite (TIMON, EISEN and LEATHERWOOD 1970), which may continue after protein synthesis declines, thus increasing subcutaneous fat deposition. NOBORN declined in controls throughout the experiment, perhaps because of accumulating inbreeding, so that the ob- served response of .16,.08a ( P Z .IO, ignoring drift; 0=2.1 rats) represented a failure to decline. Percentage of exposed females that littered (90) and the per- centage weaned of those alive at reduction (88) did not show signicant trends.
Realized response from selection for W P / F was positive but extremely vari- able and nonsignificant among generations ( .I8 -t.. 1 6, Figure 1 ) . W P , G3.9, W 9 and W 3 all showed nonsignificant positive trends ( P .15). Generation re- sponses in W P , G3.9 and W 9 vaned directly with response in WP/F. Response in W 3 tended to vary inversely, implying initial weight differences limited re- sponse in W P / F to a constant age. No net change occurred in yield or composi- tion of skinned carcass. Gross efficiency (G/F) responded similarly to W P / F
Dow
nloaded from https://academ
ic.oup.com/genetics/article/84/1/125/5991827 by guest on 01 January 2022
132 D. R. NOTTER, G. E . DICKERSON A N D J. A. DESHAZER
TABLE 2
Realized responses (b,) and genetic correlations (rH) from selection for WP or W / F *
Selection for
W P WP/F
Trait bC TH bC TH
WP .19f.10 - .20*.ll 1.10 G3.9 .28 2.1 0 1.30 .21*.11 .97
PROT% .112.12 .53 -.01*.12 - .05 w3 - .02 2.05 - .I1 .16).11 .87 w 9 .28 2 .08 1.30 .21*.10 .99 WP/W9 -.07*.09 - .00*.ll .oo NOBORN* .162.08 1 .oo .06*.08 .40 WP/F - - .18*.16 - FEED - - .04' .IO .21 G/F - - .29 t .20 2.30
SC% - .22f. 12 -1.90 .02*.05 .I8
* bo in standard deviations of litter means for all rats except coding response in NOBORN in standard deviations for individual females producing litters. h3 based on offspring-midparent litter-mean regression for all correlated traits except G/F (hz- - .07; use h2,, = .09) to calculate ~2~ in formula (3). rH computed from formula (2).
OP
whereas feed intake did not change. NOBORN tended to increase. Percentage of females littering and of pups weaned did not differ for LE and C rats.
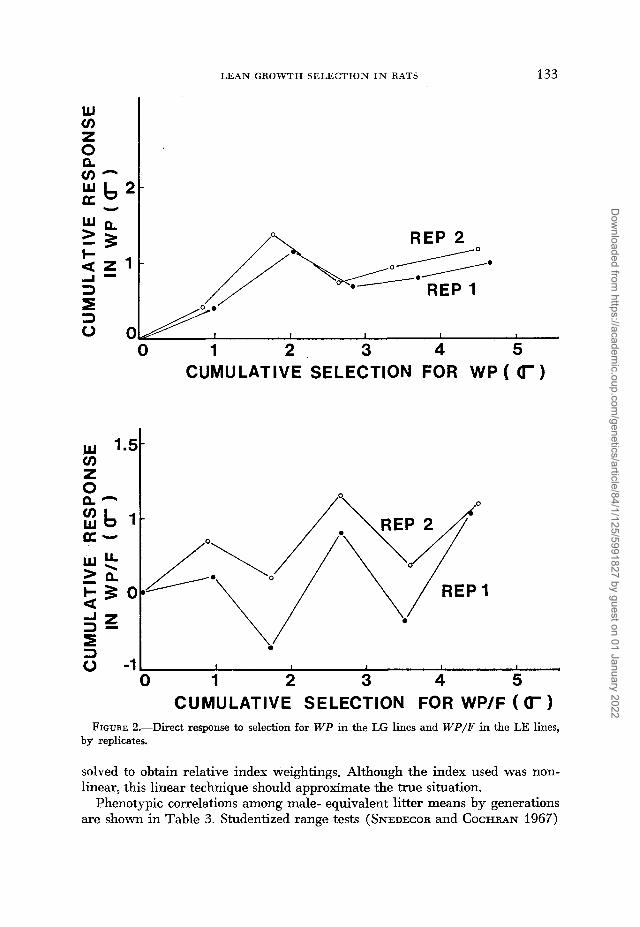
Between-generation uariation in response: Standard errors of realized herit- abilities obtained as linear functions of expected drift and intrageneration ran- dom error variances were smaller than those calculated from generation means adjusted for expected drift by formula 3 for WP (.07 us. .lo) and especially for W P / F (.08 us. .16). This difference suggests between-generation factors other than random drift contributed more heavily to the variation in W P / F response. This conclusion is substantiated by the parallel deviations of replicate lines from the overall C mean (Figurt 2). LG lines responded similarly to give estimates of realized heritability of WP of .18 and .19. LE lines differed in response, but the same generation pattern was clear in both. Between-generation variation could include interactions of selected us. control genotypes with environmental changes among generations, possible unidentified variation in the average en- vironments of the two populations or variation in actual selection applied for traits associated with the index.
An index in retrospect was calculated for each generation in the LE line to compare the relative attention afforded traits associated with the index among generations. This technique (DICKERSON et al. 1954; KOCH, GREGORY and CUN- DIFF 1974; BERGER and HARVEY 1975) involves equating the observed vector of standardized selection differentials of traits associated with the index to the prod- uct of the known matrix of phenotypic correlations and the unknown vector of weights assigned each trait in the index. This system of equations can be
Dow
nloaded from https://academ
ic.oup.com/genetics/article/84/1/125/5991827 by guest on 01 January 2022
LEAN GROWTH SELECTION I N RATS
W a Z 0 n a- CT b2-
Y
133
i-
0
I REP 2
I I I I I
0 1 2 3 4 5 CUMULATIVE SELECTION FOR WP [ 6)
v) w 1-51 z 0 n- a b W a-
0 1 2 3 4 5 CUMULATIVE SELECTION FOR WP/F ((r)
FIGURE 2.-Direct response to selection for WP in the LG lines and W P / P in the LE lines, by replicates.
solved to obtain relative index weightings. Although the index used was non- linear, this linear technique should approximate the true situation.
Phenotypic correlations among male- equivalent litter means by generations are shown in Table 3. Studentized range tests (SNEDECOR and COCHRAN 1967)
Dow
nloaded from https://academ
ic.oup.com/genetics/article/84/1/125/5991827 by guest on 01 January 2022

134 D. R. NOTTER, G . E. DICKERSON A N D J. A. DESHAZER
3
Dow
nloaded from https://academ
ic.oup.com/genetics/article/84/1/125/5991827 by guest on 01 January 2022

LEAN GROWTH SELECTION IN RATS 135
were used to test homogeneity of correlation coefficients among generations. The significant reduction in correlations of G3.9 and FEED with PROT% between generations 3 and 5 occurred as W9 increased from 239 to 305 grams, and pro- tein gain came to represent a lesser fraction of total gain (Table 1 ) .
Because progeny of parents selected from generation 5 were not included in this study, correlations pooled over generations 0 through 4 ( P I ) were used to compute the index in retrospect shown in Table 4 for LE lines. Neither litter mean selection differentials nor relative index weightings of traits differed much among generations, except possibly for a negative shift in emphasis on W3 and PROT% in generation 4. Individual selection differentials for actual parents producing progeny (Table 4) were expected to be more variable than litter mean selection differentials because of sampling, selection of rats for slaughter or dif- ferences in fertility. Fertility differences are suggested by the greater variability in selection applied for FEED and G3.9 in females than males. Generation 2 seems especially associated with selection against FEED and G3.9 in the female. Simple Correlations of individual-generation response in WPJF with selection differentials for correlated traits were -.80 for FEED ( P Z . lo) and -.78 for W3 (. 10 < P< .15). Apparently, response in W P / F was greater when there was more selection for low initial weight and low feed consumption.
Genotype-environment interaction may be involved if the difference in W P / F between LE and C lines, or the ranking of litters within LE lines, is affected by generation changes in the average environment. The efficiency of deposition of protein tissue is a function of rate and composition of gain and of weight main- tained. When enviroment restricts growth, protein gain is likely to be a larger
TABLE 4
Standardized litter mean selection differentials, relative index weightings and standardized indiuidual selection differentials for LE line
Generation of parents
Trait 0 1 2 3 4
Standardized litter mean selection differentials w 3 - .09 - .09 .03 .I5 - .35 G3.9 .30 .32 .26 .35 .31 FEED - .24 - .09 -.I2 - .02 -.I2 SC% .oo - .21 .26 .23 .05 PROT% .47 .40 .65 .75 .29
Relative index weights PROT% .35 .33 .56 .63 .23 w 3 .of3 .01 .07 .I7 - .24 G3.9 1 .oo 1 .oo 1 .oo 1 .oo 1 .oo FEED - 1.28 - .85 - .93 - 3 4 - .79 SC% .26 - .09 .53 .47 .30
Standardized individual selection differentials Male Female Male Female Male Female Male Female Male Female
w 3 -.04 .02 .06 -.06 -.03 -.08 .31 .I1 -.31 -.34 G3.9 2 7 .35 .26 .46 .47 .07 .34 .22 .14 .16 PEED -.I1 .OO -.I1 .I2 .05 -.48 .07 -.I7 .OO -.23
Dow
nloaded from https://academ
ic.oup.com/genetics/article/84/1/125/5991827 by guest on 01 January 2022
136 D. R. NOTTER, G . E. DICKERSON AND J. A. DESHAZER
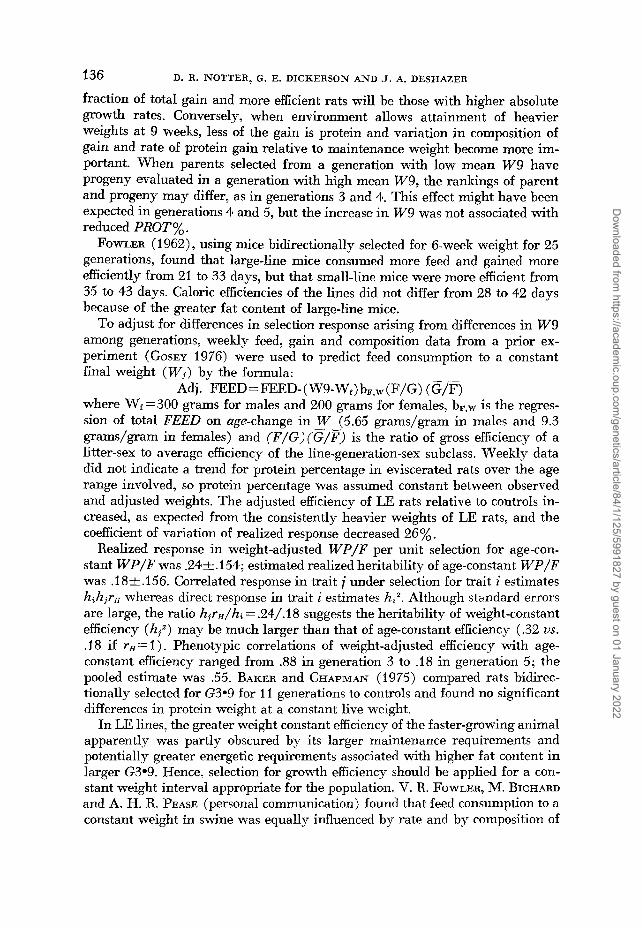
fraction of total gain and more efficient rats will be those with higher absolute growth rates. Conversely, when environment allows attainment of heavier weights at 9 weeks, less of the gain is protein and variation in composition of gain and rate of protein gain relative to maintenance weight become more im- portant. When parents selected from a generation with low mean W9 have progeny evaluated in a generation with high mean W9, the rankings of parent and progeny may differ, as in generations 3 and 4. This effect might have been expected in generations 4 and 5, but the increase in W9 was not associated with reduced PROTX.
FOWLER (1962), using mice bidirectionally selected for 6-week weight for 25 generations, found that large-line mice consumed more feed and gained more efficiently from 21 to 33 days, but that small-line mice were more efficient from 35 to 43 days. Caloric efficiencies of the lines did not differ from 28 to 42 days because of the greater fat content of large-line mice.
To adjust for differences in selection response arising from differences in W9 among generations, weekly feed, gain and composition data from a prior ex- periment (GOSEY 1976) were used to predict feed consumption to a constant final weight ( Wf) by the formula:
Adj. FEED =FEED- ( W9-Wf) bF,W (F/G) (G/F) where Wr=300 grams for males and 200 grams for females, b ,w is the regres- sion of total FEED on age-change in W (5.65 grams/gram in males and 9.3 grams/gram in females) and (F/G)(G/F) is the ratio of gross efficiency of a litter-sex to average efficiency of the line-generation-sex subclass. Weekly data did not indicate a trend for protein percentage in eviscerated rats over the age range involved, so protein percentage was assumed constant between observed and adjusted weights. The adjusted efficiency of LE rats relative to controls in- creased, as expected from the consistently heavier weights of LE rats, and the coefficient of variation of realized response decreased 26%.
Realized response in weight-adjusted WPJF per unit selection for age-con- stant WP/F was .24+.154; estimated realized heritability of age-constant WP/F was .18&.156. Correlated response in trait i under selection for trait i estimates hrh3rH whereas direct response in trait i estimates ht2. Although standard errors are large, the ratio hirH/hi = .24/.18 suggests the heritability of weight-constant efficiency ( h f ) may be much larger than that of age-constant efficiency (.32 us. .I8 if rH = 1 ) . Phenotypic correlations of weight-adjusted efficiency with age- constant efficiency ranged from .88 in generation 3 to .18 in generation 5 ; the pooled estimate was .55. BAKER and CHAPMAN (1975) compared rats bidirec- tionally selected for G3.9 for 11 generations to controls and found no significant differences in protein weight at a constant live weight.
In LE lines, the greater weight constant efficiency of the faster-growing animal apparently was partly obscured by its larger maintenance requirements and potentially greater energetic requirements associated with higher fat content in larger G3.9. Hence. selection for growth efficiency should be applied for a con- stant weight interval appropriate for the population. V. R. FOWLER, M. BICHARD and A. H. R. PEASE (personal communication) found that feed consumption to a constant weight in swine was equally influenced by rate and by composition of
_ _
-. -
Dow
nloaded from https://academ
ic.oup.com/genetics/article/84/1/125/5991827 by guest on 01 January 2022

LEAN GROWTH SELECTION IN RATS 137
gain. Thus, selection for days to a constant weight, adjusted for effects of carcass composition on feed costs, could effectively improve growth efficiency during that weight interval without use of feed records. However, indirect effects of such selection on mature size and reproduction would influence life cycle efficiency, as would any unmeasured genetic variation in metabolic rate or efficiency of tissue synthesis. Even in LG lines, the cumulative response in lW9 was accom- panied by changes in SC%, which may have limited response in WP. Although selection on days to a prepuberal standard lean body weight may be more ef- fective than selection to a constant age, it would still be expected to increase skinning losses at 9 weeks.
Alternative estimators of realized heritability: In addition to regression of cumulative response on cumulative selection (b,) , realized heritabilities were estimated by the ratio of total response to total selection applied (bE) and by regression of cumulative response on cumulative selection when the regression is forced through the point (0, do where do is the difference between select and C lines in generation zero (bw) . Estimates of realized heritability from bo, bR and bw were .19, .22 and .28, respectively, for WP and .18, .25 and .18 for WP/F. ZIMMERMAN and CUNNINGHAM (1 975) found that if selected and control lines were derived from the same base population, the standard error of realized her- itability was smaller for bE than for b,. In the present study, the lines differed in selection histories at generation 0 and b, was the most efficient estimator. Considering only drift and random intrageneration variance, V (b,) averaged 20% and 30% less than V ( b R ) and V ( b r v ) , respectively. bm, has the advantage of weighting each generation's heritability estimate inversely as its error vari- ance from uee and does not greatly increase the coefficient of drift variance rela- tive to b, if selection is practiced over several generations (DICKERSON 1969). However, the coefficient of random interageneration error was much larger for bw than for b, because of errors in estimating the difference in the base genera- tion. bn is the simpler estimator, but the coefficient of ue2 is doubled when the initial difference is measured with error, Also, if generation-environment x line interaction is important (as in LE lines), bR is inappropriate.
The importance of variation in selection applied, number measured and effec- tive population size among generations was appraised by comparing exact for- mulas with approximations using means (HILL 1972a,b). Coefficients of varia- tions averaged .09 for selection differential, .12 for number measured and .16 for effective population size. Approximations underestimated the variance of re- alized heritability by 5.8% in LG lines and 4.3% in LE lines.
Variance estimation of heritability: Heritability estimates from paternal half- sib correlation (h"), full-sib correlation (h",,) and regression of offspring on sire (hzoos). dam (hzoD) and midparent (hZoP) are shown in Table 5. Estimates were averaged across feeder-sex subclasses for individual traits and across feed- er types for litter traits. Expectations of these estimators are given by DICKER- SON (1 969). Estimates of hzoo, and hZop generally agree with those cited for mice (SUTHERLAND et al. 1970; JARA-ALMONTE and WHITE 1973), but estimates of hZ, were considerably larger. Estimates of hzOs were quite low for SC%, PROT% and WP in agreement with the hzs of .10+.15 reported by GALL et al. (1967)
Dow
nloaded from https://academ
ic.oup.com/genetics/article/84/1/125/5991827 by guest on 01 January 2022

138 D. R. NOTTER, G. E . DICKERSON A N D J. A. DESHAZER
0 w w m ? Y - ! ?
9 -!"c?". Y - 1
2! Ioooa t I $1 +I I o - h 0 - h a- ?".9 $1 t I t i $1 9 o m c ? q ". I I
I h C O " I w
I
i, b
Dow
nloaded from https://academ
ic.oup.com/genetics/article/84/1/125/5991827 by guest on 01 January 2022
LEAN GROWTH SELECTION I N RATS 139
for carcass nitrogen in mice. The estimate of hzoos for G3.9 agrees closely with the average realized estimate of .25 found in rats by BAKER, CHAPMAN and WARDELL (1975). hzOp would be expected to most nearly predict selection re- pome, and the estimates for litter means of .20-t.08 for W P and .24f.08 for WP/F do correspond well to the realized estimates of .19 and .18.
Except for €‘ROT%, values of hZs were much larger than those for h20S. If epistatic effects are negligible, hzOs estimates the additive genetic variance with a bias of one-half the plus or minus additive direct by additive maternal covari- ance ( u A A m ) whereas hsz is biased upward by genotype-environment interac- tion (u’GE) . hzoo, is not biased by genotype-environment interaction, but genera- tion changes in environment would reduce it below values obtained in a con- stant environment (DICKERSON 1969). Values of ( h90s-h20s) shown in Table 5 estimate phenotypic variance due to ( U ’ G E - % U A A ~ > . Negative values for UAA,,,
are not precluded, but the magnitude of the differences tends to corroborate evidence for genotype-environment interaction from selection responses. If en- vironmental differences are random, one can only select for improved average performance over the range of environments involved (DICKERSON 1962) ; but if interaction is a function of variation in size and composition at 9 weeks, it could be reduced using a weight-constant endpoint.
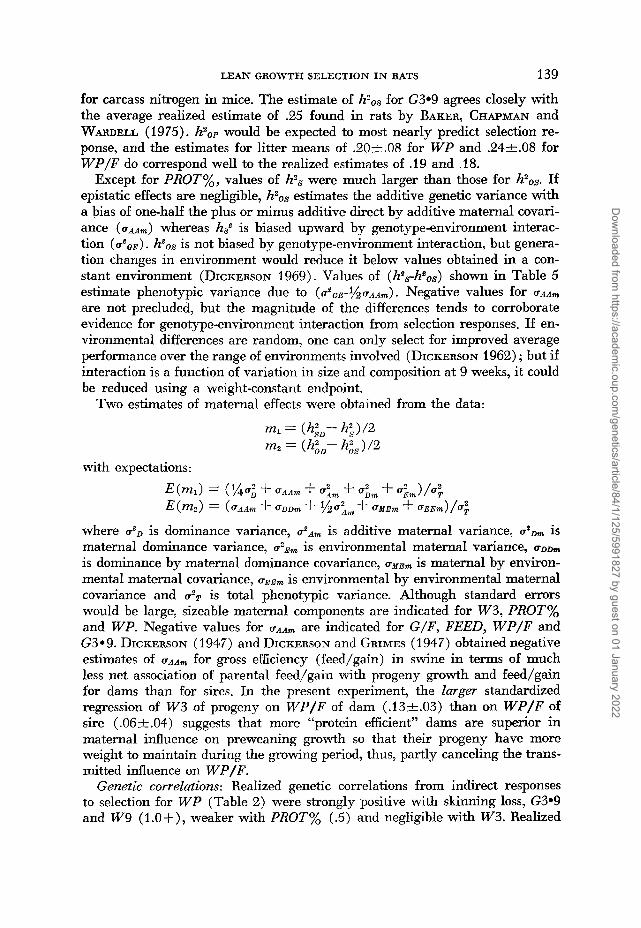
Two estimates of maternal effects were obtained from the data:
ml = (AL&-- h2,)/2 m, = ( hiD- his ) / 2
with expectations:
E(mi) E(m2) = (UAAAm + UDDm +
(XU: + uAA, + U:, 4 u ; ~ + u & ) / u ~ + U M E m + u E E m ) / U ;
where ulD is dominance variance, ugAm is additive maternal variance, usm is maternal dominance variance, uZEm is environmental maternal variance, uDDn
is dominance by maternal dominance covariance, uMEm is maternal by environ- mental maternal covariance, ucEm is environmental by environmental maternal covariance and u~~ is total phenotypic variance. Although standard errors would be large, sizeable maternal components are indicated for W3, PROT% and WP. Negative values for u A A m are indicated for G/F, FEED, WP/F and G3.9. DICKERSON (1947) and DICKERSON and GRIMES (1947) obtained negative estimates of uAA, for gross efficiency (feed/gain) in swine in terms of much less net association of parental feed/gain with progeny growth and feed/gain for dams than for sires. In the present experiment, the larger standardized regression of W3 of progeny on WP/F of dam (.13&.03) than on WP/F of sire (.06&.04) suggests that more “protein efficient” dams are superior in maternal influence on preweaning growth so that their progeny have more weight to maintain during the growing period, thus, partly canceling the trans- mitted influence on WP/F.
Genetic correlations: Realized genetic correlations from indirect responses to selection for WP (Table 2) were strongly positive with skinning loss, G3.9 and W9 (1.0+), weaker with PROT% (.5) and negligible with W3. Realized
Dow
nloaded from https://academ
ic.oup.com/genetics/article/84/1/125/5991827 by guest on 01 January 2022

140 D. R. NOTTER, G. E. DICKERSON AND J. A. DESHAZER
genetic correlations from WP/F selection were very high with W P , G/F, G3.9 and W 9 but differed from those for W P selection in being high and positive with W 3 (.87) but negligible with SC% or PROTX. The genetic correlation with NOBORN was surprisingly high for W P (1+) but much lower (.4) for WP/F.
Full-sib component estimates of genetic correlations among individual and cage mean traits are shown in Table 6. W 3 showed moderate correlation, in- cluding part-whole, with W9 in all subclasses. The correlation of W 3 with G3.9 was smaller in females than in males in both LG and LE lines, possibly be- cause females mature several weeks earlier than males. The correlation of W 9 with G3.9 was very large and significantly smaller in females (.90 us. .96) , as expected from the smaller fraction of W9 due to G3.9 in females than in males (80 us. 85%). FEED was strongly correlated with both W9 (.71) and G3.9 (.67), and the correlations were significantly larger in males. The correlations of G/F with W 3 (- .30) , W9 (.06) and G3.9 (.20) are consistent with the high correlations of W9 and G3.9 with FEED and the fact that rats with larger W 3 , G3.9 and W9 have heavier mean weights to maintain from 3 to 9 weeks. The correlation of FEED with G/F was - 5 7 and was significantly more nega- tive in females than in males, partly because of the earlier maturity of females. SUTHERLAND et al. (1970) and JARA-ALMONTE and WHITE (1973) obtained much higher correlations of .91 k.04 and .75*.28, respectively, between post- weaning gain and gain/feed in mice.
Paternal half-sib estimates of genetic correlations among litter mean traits (Table 7 ) are unbiased but have very large standard errors. Extremely high cor- relations of G3.9 and W 9 with W P and of G/F with WP/F imply that variation in composition was a minor source of genetic variation in W P or WP/F. Pheno- typic coefficients of variation in G3.9 or G/F for means of three rats were about double those for SC% and PROTX. Thus, additional selection accuracy ob- tained from slaughter of three rats per litter may not be sufficient to overcome consequent reduction in selection intensity. One would expect selection for G/F to include some selection for leanness, because of the greater energetic cost per
TABLE 6
Full-sib component estimates of genetic correlations among indiuidual and cage mean traits for the lean gain (LG) and lean efficiency (LE) lines'
Trait Lines w3 w9 G3.9 FEED G / F
w 3 LG LE
w 9 LG LE
G3.9 LG LE
FEED LE G/F LE -
- .50+.07 .24+ .09 - .41 f .08 .17+.09
- .96+ .01 .M+ .07 .51* .07 - .97+.01 .01+ .09 .90+.02 - .08*.09 .90+.02 - .30* .09 .61+.08 .56?.10
..31*.ll .03+ .I 5 .21*.15 -
- - .36 2 . I O - .29 * .I2
312.06 .08*.17
.78*.07 .19+.17 - .46 * .13
- -
- -
-.67*.09 -
* Estimates for males are shown above the diagonal and estimates for females below.
Dow
nloaded from https://academ
ic.oup.com/genetics/article/84/1/125/5991827 by guest on 01 January 2022
LEAN GROWTH SELECTION IN RATS
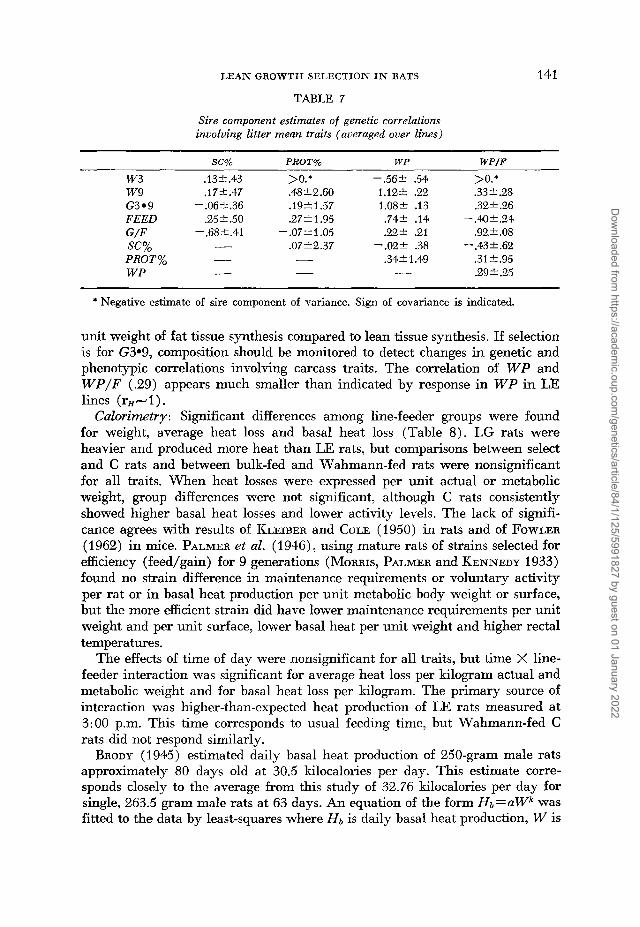
TABLE 7
Sire component estimates of genetic correlations involving litter mean traits (averaged over lines)
141
SC% PROT% W P W P / F
w 3 .13+.43 w 9 .17f.47 G3.9 -.06f.36 FEED .25 2.50 G/F - .68,.41
- se% PROT% - WP -
>O.* .48?2.60 .19k 1.57 .27k 1.95
- .07+ 1.05 .07*2.37
-.56? .54 1.12t .22 1.08t .I3 .74k .14 .22* .21
-.02+ .38 .34+ 1.49 -
>O.* .33 k .28 .32+ 2 6
- .4Of .24 .92?.08
- .43 2.62 .31 k.95 .29 k .25
* Negative estimate of sire component of variance. Sign of covariance is indicated.
unit weight of fat tissue synthesis compared to lean tissue synthesis. If selection is for G3.9, composition should be monitored to detect changes in genetic and phenotypic correlations involving carcass traits. The correlation of W P and W P / F (.29) appears much smaller than indicated by response in W P in LE lines ( rH+ 1 ) .
Calorimetry: Significant differences among line-feeder groups were found for weight, average heat loss and basal heat loss (Table 8). LG rats were heavier and produced more heat than LE rats, but comparisons between select and C rats and between bulk-fed and Wahmann-fed rats were nonsignificant for all traits, When heat losses were expressed per unit actual or metabolic weight, group differences were not significant, although C rats consistently showed higher basal heat losses and lower activity levels. The lack of signifi- cance agrees with results of KLEIBER and COLE (1950) in rats and of FOWLER (1962) in mice. PALMER et al. (1946), using mature rats of strains selected for efficiency (feed/gain) for 9 generations (MORRIS, PALMER and KENNEDY 1933) found no strain difference in maintenance requirements or voluntary activity per rat or in basal heat production per unit metabolic body weight or surface, but the more efficient strain did have lower maintenance requirements per unit weight and per unit surface, lower basal heat per unit weight and higher rectal temperatures.
The effects of time of day were nonsignificant for all traits, but time X line- feeder interaction was significant for average heat loss per kilogram actual and metabolic weight and for basal heat loss per kilogram. The primary source of interaction was higher-than-expected heat production of LE rats measured at 3:OO p.m. This time corresponds to usual feeding time, but Wahmann-fed C rats did not respond similarly.
BRODY (1945) estimated daily basal heat production of 250-gram male rats approximately 80 days old at 30.5 kilocalories per day. This estimate corre- sponds closely to the average from this study of 32.76 kilocalories per day for single, 263.5 gram male rats at 63 days. An equation of the form Hb=aWk was fitted to the data by least-squares where Hb is daily basal heat production, W is
Dow
nloaded from https://academ
ic.oup.com/genetics/article/84/1/125/5991827 by guest on 01 January 2022

D. R. NOTTER, G . E. DICKERSON A N D J. A. DESKAZER
Dow
nloaded from https://academ
ic.oup.com/genetics/article/84/1/125/5991827 by guest on 01 January 2022

LEAN GROWTH SELECTION I N RATS 143
weight in kilograms and a and k are estimated parameters. For single rats with a weight equal to the mid-weight of the pair, Hb = 75.14W.625 whereas BRODY’S equation for daily basal heat production in growing male rats between 100 and 350 grams was Hb = 49.48W.35. BRODY divided the period of rapid growth from birth to some time after puberty in rats into four phases.The first three extend from birth to 100 grams and are characterized by higher powers of W than BRODY’S general curve for prediction of basal heat among mature individuals of different species, Hb = 70.5W.734. Phase IV is characterized by the curve given above and by lower relative growth rate. Rats in this study, were younger than BRODY’S and may have been in a more rapid phase of growth intermediate between BRODY’S phase I11 (50 to 100 grams; H b = 21.54WS4) and phase IV. An exponential curve was also fitted to the average heat data ( H a ) and gave Ha = 85.66W.68g+.21s, implying total heat production is characterized by in- creases over basal in average level of heat loss and slightly in rate of increase in heat loss with increasing weight.
LITERATURE CITED
ABDEL-MALEK, A. A. W. and C. T. BLUNN, 1974 Selection for positive and negaitve post- weaning gain of rats fed thyroprotein. Zagazey J. Agr. Res. 1: 57-65.
A.O.A.C., 1965 OEcial methods of analysis (11th ed.). Ass. of Official Agr. Chem., Wash- ington, D.C.
BAKER, R. L. and A. B. CHAPMAN, 1975 Correlated responses to selection for postweaning gain in the rat. Genetics 80: 191-203.
BAKER, R. L., A. B. CHAPMAN and R. T. WARDELL, 1975 Direct response to selection for post- weaning gain in the rat. Genetics 80: 171-189.
BERGER, J. P. and W. R. HARVEY, 1975 Realized genetic parameters from index selection in mice. J. Anim. Sci. 40: 38-47.
BXONDINI, P. E., T. M. SUTHERLAND and I,. H. HAVERLAND, 1968 Body composition of mice selected for rapid growth rate. J. Anim. Sci. 27: 5-12.
BRODY, SAMUEL, 1945 Bioenergetics and growth. Reinhold Publishing Corp., New York. CROW, J. F., 1954 Breeding structure of populations. 11. Effective population number. pp. 543-
CROW, J. F. and N. E. MORTON, 1955 Measurement of gene frequency drift in small popula-
DFSHAZER, J. A., K. A. JORDAN and S. W. SUGGS, 1970 The effect of acclimation on partition- ing of heat loss by the laying hen. Trans. of ASAE 13: 82-84.
DICKERSON, G. E., 1947 Composition of hog carcasses as influenced by heritable differences in rate and economy of gain. Iowa Agr. Exp. Sta. Bull. 354. -, 1962 Implications of genetic-environmental interaction in animal breeding. Anim. Prod. 4 : 47-63. - , 1969 Techniques for research in quantitative animal genetics. In: Techniques and Procedures in Animal Science Research. Amer. Soc. Anim. Sci., Champaign, 111. 61820.
DICKERSON, G. E., C. T. BLUNN, A. G. CHAPMAN, R. M. KOTTMAN, J. L. KRIDER, E. J. W ~ W X C K , J. A. WHATLEY, JR., M. L. BAKER, J. L. LUSH and L. M. WINTERS, 1954 Evaluation of selection in developing inbred lines of swine. Res. Bull. 551 University of Missouri, Col- umbia.
Effectiveness of selection for efficiency of gain in Duroc swine. J. Anim. Sci. 6: 265-287.
The efficiency of food utilization, digestibility of food stuffs and energy expenditure of mice selected for large or small body size. Genet. Res. 3: 51-68.
556. In: Statistics and Mathetmutics in Biology. Iowa State College Press, Ames, Iowa.
tions. Evolution 9: 202-214.
DICKERSON, G. E. and J. C. GRIMES, 1947
FOWLER, R. E., 1962
Dow
nloaded from https://academ
ic.oup.com/genetics/article/84/1/125/5991827 by guest on 01 January 2022

144
GALL, G. A. E., W. H. KYLE, J. C. ROGLER and V. L. ANDERSON, 1967 Genetic parameters of protein metabolism and growth in mice. Genetics 56: 215-225.
GOSEY, J. A., 1976 Selection for efficiency of lean tissue growth in rats. Ph.D. Dissertation, University of Nebraska, Lincoln.
GOWE, R. S., ALAN ROBERTSON and B. D. H. LATTER, 1958 Environment and poultry breeding problems. 5. The design of poultry control strains. Poultry Sci. 37: 46M71.
HARVEY, W. R., 1960 Least-squares analysis of data with unequal subclass numbers. ARS 20-8. U.S.D.A., Washington, D.C. - , 1970 Estimation of variance and covariance com- ponents in the mixed model. Biometrics 26: 485-504.
Design and efficiency of selection experiments for estimating genetic para- meters. Biometrics 27: 293-311. - , 1972a Estimation of realized heritabilities from
timation of realized heritabilities from selection experiments. 11. Selection in one direction. Biometrics 28: 767-780.
JARA-ALMONTE, MARCIAL and J. M. WHITE, 1973 Genetic relationships among milk yield, growth, feed intake and efficiency in laboratory mice. J. Anim. Sci. 37: 410-416.
KLEIBER, M. and H. H. COLE, 1950 Body size, growth rate and metabolic rate in two inbred strains of rats. Amer. J. Physiol. 161: 294-299.
KOCH, R. M., K. E. GREGORY and L. V. CUNDIFF, 1974 Selection in beef cattle. I. Selection applied and generation interval. J. Anim. Sci. 39: 449458.
LEVEILLE, G. A., 1970 Adipose tissue metabolism: Influence of periodicity of eating and diet composition. Federation Proc. 29: 1294-1301.
LUSH, J. L., 1947 Family merit and individual merit as bases for selection-Part I. Am. Naturalist 81: 241-261.
MORRIS, H. P., L. S. PALMER and C. KENNEDY, 1933 An experimental study of inheritance as a factor influencing food utilization in the rat. Minn. Agr. Exp. Sta. Tech. Bull. No. 92.
OLSON, L. L. and J. A. DFSHAZER, 1974 Synthetically spanning an infrared moisture analyzer. Trans. of ASAE 17: 773-736.
PALMER, L. S., C. KENNEDY, C. E. CALVERLY, C. LOHN and P. H. WESWIG, 1946 Genetic dif- ferences in the biochemistry and physiology influencing food utilization for growth in rats. Minn. Agr. Exp. Sta. Tech. Bull. No. 176.
ROBERTSON, ALAN, 1961 Inbreeding in artificial selection programmes. Genet. Res. 2: 189-194.
ROBINSON, D. W. and G. E. BRADFORD, 1969 Cellular response to selection for rapid growth in
SNEDEBOR, G. W. and W. G. COCHRAN, 1967 Statistical Methods. The Iowa State University
SUTHERLAND, T. M., P. E. BIONDINI, L. H. HAVERLAND, D. PETTUS and W. B. OWEN, 1970 Se- lection for rate of gain, appetite and efficiency of feed utilization in mice. J. Anim. Sci. 31: 1049-1 057.
Adaptive hyperlipogenesis. Federation Proc. 23 : 73-75.
Comparisons of ad libitum and restricted feeding in mice selected and unselected for postweaning gain. 11. Carcass com- position and energetic efficiency. Genetics 65: 145-155.
TSAI, R. Y. T., J. W. COLE and C. B. RAMSEY, 1972 Effects of fasting on tissue shrinkage in rats. J. Anim. Sci. 35: 345-350.
ZIMMERMAN, D. R. and P. J. CUNNINGHAM, 1975 Selection for ovulation rate in swine: pop- ulation, procedures and ovulation response. J. Anim. Sci. 40: 61-69.
Corresponding editor: R. W. ALLARD
D. R. NOTTER, G. E. DICKERSON A N D J . A . DESHAZER
HILL, W. G., 1971
selection experiments. I. Divergent selection. Biometrics 28: 747-765. - , 1972b ES-
mice. Growth 33: 221-229.
Press, Ames, Iowa.
TEPPERMAN, H. N. and JAY TEPPERMAN, 1964
TIMON, V. M., E. J. EISEN and J. M. LEATHERWOOD, 1970
Dow
nloaded from https://academ
ic.oup.com/genetics/article/84/1/125/5991827 by guest on 01 January 2022