Selecting a waste management option using a life-cycle analysis approach
14
PACKAGING TECHNOLOGY AND SCIENCE VOL 6 159-172 (1993) Selecting a Waste Management Option using a Life-cycle Analysis Approach" Neil Kirkpatrick Pira International, Randalls Road, Leatherhead, Surrey KT22 7RU. UK Solid-waste management, and in particular the disposal of used packaging, is currently the subject of much topical debate. This is driven by both consumer and legislative pressures. Consumers see used packaging as a highly visible element of municipal solid waste, complaining of excessive packaging and low levels of recycling. Legislators, perhaps in pandering to the views expressed by consumer bodies, have been active within the CEC and individual Member States by introducing (or proposing) legislation or similar regulatory tools and targets t o facilitate a greater diversion of used packaging from disposal by landfill to alternative solid-waste management practices, in particular recycling, which are widely accepted to have a lower impact on the environment. In this paper the relative environmental profiles of pursuing alternative solid-waste management practices to disposal by landfill are explored, focusing not just on solid waste per se but also on associated considerations of energy consumption and emis- sions, which are invariably overlooked as factors contributing to the environmental impact of solid-waste management practices. Solid- waste management; life- cycle analysis; Land fill alternatives; Legislation SOLID-WASTE MANAGEMENT IN CO N T EXT Solid-waste management is one facet only of the environmental debate. In this respect, it is essential to recognize that environmental impacts do not occur only when materials have served their useful purpose and hence become waste, nor are they restricted to considerations of solid waste only. In quantifying the environmental impacts associ- ated with any given product, it is necessary to examine all stages of the life cycle, including the initial extraction of raw materials from the Earth's surface, manufacturing processes (including conversion/finishing and distribution/ transportation) use, and finally disposal. Further, it must be recognized that environmental impacts result through the use of raw materials and con- sumption of energy, which in turn lead to the generation of atmospheric emissions, discharges to a receiving water, and solid waste disposal. An examination of all environmental impacts over the complete life cycle of a given product is referred to as the life-cycle analysis (LCA) approach. It is only by adopting an LCA approach that the issues of solid-waste manage- ment can be placed in context. Solid-waste management is only one step in a life cycle and should be viewed as a process, itself requiring inputs such as energy (for collection, sorting, pro- cessing and transportation). resulting in emissions to the atmosphere as well as possible discharges to a receiving water and yet further solid waste being generated. This approach to solid-waste management is and example of the so-called 'black box principle', where solid-waste manage- ment represents the black box (i.e. the process) with the solid waste for disposal/processing being an input into the system. This concept of viewing solid-waste management as a process with a series of inputs and outputs challenges the whole notion of relative prioriti- 0894-3214/93/030159- 15s12.50 0 1993 by John Wiley & Sons, Ltd. Received December 1992
-
Upload
neil-kirkpatrick -
Category
Documents
-
view
212 -
download
0
Transcript of Selecting a waste management option using a life-cycle analysis approach

PACKAGING TECHNOLOGY AND SCIENCE VOL 6 159-172 (1993)
Selecting a Waste Management Opt ion using a Life-cycle Analysis Approach"
Neil Kirkpatrick
Pira International, Randalls Road, Leatherhead, Surrey KT22 7RU. UK
Solid-waste management, and in particular the disposal o f used packaging, is currently the subject of much topical debate. This is driven by both consumer and legislative pressures. Consumers see used packaging as a highly visible element o f municipal solid waste, complaining o f excessive packaging and l o w levels o f recycling. Legislators, perhaps in pandering t o the views expressed by consumer bodies, have been active within the CEC and individual Member States by introducing (or proposing) legislation or similar regulatory tools and targets t o facilitate a greater diversion of used packaging from disposal by landfil l t o alternative solid-waste management practices, in particular recycling, which are widely accepted t o have a lower impact on the environment.
In this paper the relative environmental profiles o f pursuing alternative solid-waste management practices t o disposal by landfill are explored, focusing not just on solid waste per se but also on associated considerations of energy consumption and emis- sions, which are invariably overlooked as factors contributing t o the environmental impact o f solid-waste management practices.
Solid- waste management; life- cycle analysis; Land fill alternatives; Legislation
SOLID-WASTE MANAGEMENT IN CO N T EXT
Solid-waste management is one facet only of the environmental debate. In this respect, i t is essential to recognize that environmental impacts do not occur only when materials have served their useful purpose and hence become waste, nor are they restricted to considerations of solid waste only.
In quantifying the environmental impacts associ- ated with any given product, it is necessary to examine all stages of the life cycle, including the initial extraction of raw materials from the Earth's surface, manufacturing processes (including conversion/finishing and distribution/ transportation) use, and finally disposal. Further, it must be recognized that environmental impacts result through the use of raw materials and con- sumption of energy, which in turn lead to the generation of atmospheric emissions, discharges to a receiving water, and solid waste disposal.
An examination of all environmental impacts over the complete life cycle of a given product is referred to as the life-cycle analysis (LCA) approach. It is only by adopting an LCA approach that the issues of solid-waste manage- ment can be placed in context. Solid-waste management is only one step in a life cycle and should be viewed as a process, itself requiring inputs such as energy (for collection, sorting, pro- cessing and transportation). resulting in emissions to the atmosphere as well as possible discharges to a receiving water and yet further solid waste being generated. This approach to solid-waste management is and example of the so-called 'black box principle', where solid-waste manage- ment represents the black box (i.e. the process) with the solid waste for disposal/processing being an input into the system.
This concept of viewing solid-waste management as a process with a series of inputs and outputs challenges the whole notion of relative prioriti-
0894-3214/93/030159- 15s12.50 0 1993 by John Wiley & Sons, Ltd. Received December 1992

160 N. KIRKPATRICK
Table 1. Environmental inputs and outputs for recycling 100 kg of mixed paper waste
Total Transport
Inputs (kg) Fossil fuels Other non-renewables Renewables Waste materials Ancillaries Net water Net air Electrical energy (kWh)a Outputs (kg) co2 co vo c NO so2 Halides Otherb Dust TDS TSS BOD COD Oils Landfill weight Landfill volume (m3) Electrical energy (kWh)
954.2666 0.0000
22.941 6 1000.0000
0.0000 0.0000
785.7386 2592.631 7
1340.0473 0.7705
32.4948 4.8447
14.8637 0.0000 7.8890 0.01 25 0.0000 1.0546 0.5083 3.621 3 0.0000
394.4497 564.0631
0.0000
3.4744 0 0000 0.0000 0.0000 0.0000 0.0000 7.5957 0.7427
10.6322 0.0576 0.0284 0.201 2 0.0459 0.0000 0.0000 0.01 25 0 0000 0.0000 0 0000 0 0000 0.0000 0.0000 0.0000
Unit energy Electricity
36.6729 950.7922 0.0000
0.8849 22.941 6 0.0000 0.0000 0.0000
30.01 36 778.1 430
51.2767 1329.41 51 0.0275 0 71 29 0.1 568 4 0660 0.21 77 5.6435 0.571 5 14.81 79
15.21 43 394.4497
100.0000 2592.631 7
Waste management
0.0000 0.0000 0.0000
1000.0000 0.0000 0.0000 0.0000
2591.8890
28.4044
7.8890
1.0546 0.5083 3.621 3
394.4497 564.0631
~~
aRaw materials and environmental impacts associated with generation included bLeachates and smell gases included
zation of solid-waste management practices. Con- vention dictates that solid-waste management practices can be placed in a fixed order of prefer- ence, often referred to as the solid-waste manage- ment hierarchy.
The hierarchy is often presented as shown below, with waste minimization as the most preferred (least environmental impact) and landfill as the least preferred (most environmental impact). (i) waste minimization at source (ii) re-use (iii) recycle (iv) incineration with energy recovery (v) incineration without energy recovery (vi) landfill In recent years this hierarchy has been presented in different ways, with additional practices, such as composting/biodegradation, becoming integrated above landfill and somewhere above or below the different modes of incineration.
Having established that solid waste and solid- waste management are only single elements of the whole process of life-cycle analysis, we can now explore further the relative inputs and outputs for some of those solid-waste management practices listed above. This will illustrate that assumptions about the relative preferences for solid- waste management practices do not necessarily hold true but depend on the parameters under consideration.
CHALLENGING THE SOLID-WASTE MANAGEMENT HIERARCHY
The solid-waste management hierarchy was deter- mined on the basis of a common-sense approach focusing on considerations of resource conserva- tion and optimization of the use of raw materials. Cynically, however, one might argue that elements

LIFE-CYCLE ANALYSIS AND WASTE MANAGEMENT 161
10000.0000
0 Y
c
5 B
1000.0000
100.0000
10.0000
1 .oooo
0.1000
0.0100
0.0010
0.0001
Figure 1. Inputs into the disposal of 1000 kg of paper by recycling
10000.0000
1000.0000
100.0000
0 Y 10 0000
1 .oooo
0 1000
0.0100
0 0010
0.0001
a -
Figure 2. Outputs from the disposal of 1000 kg of paper by recycling
162 N. KIRKPATRICK
of its structure have more to do with political and national concerns over the lack of available licensed landfill space and perceptions of the negative impacts associated with practices such as incineration.
Waste minimization at source is undoubtedly the most preferred (least environmental impact) solid-waste management option. Environmental considerations are invariably directly related to economic considerations and on both accounts there is no argument that the most preferred way to tackle the solid-waste issue is to minimize those quantities of materials that become waste in the first place.
This is determined in two ways. The first con- sideration is to ensure that raw materials are con- verted into the desired product by the most effective and efficient means available. Typically this relates to the generation of pre-consumer waste (or scrap), which by virtue of its nature repre- sents both a loss of an economic resource and the
cleanest, i.e. least contaminated, category of waste for subsequent treatment/reprocessing. The second consideration relates to the quantities of raw mate- rials used in the manufacture of a given product, recognizing that the use of less materials (often referred to as lightweighting) may be short-sighted if it results in greater secondary, downstream losses if that product is no longer able to perform its func- tion to an equivalent performance standard.
The debate becomes much more complex when considering the other elements of the solid-waste management hierarchy. Consider, for example, scenarios of recycling, incineration and landfill for mixed paper waste and high-density polyethylene (HDPE). As discussed previously, recycling, incineration and landfill are themselves processes with their own environmental inputs and outputs. Further, to facilitate comparisons that reflect infra- structure considerations, it is necessary to build into these scenarios, environmental impacts associ- ated with transportation.
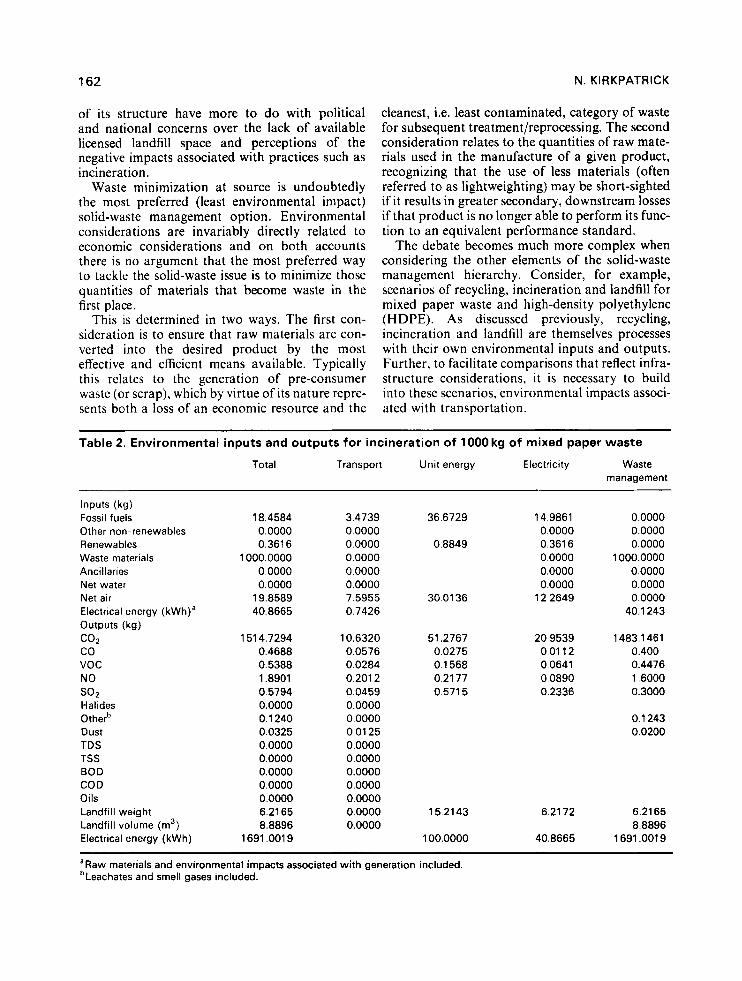
Table 2. Environmental inputs and outputs for incineration of lOOOkg of mixed paper waste
Total Transport Unit energy Electricity Waste management
Inputs (kg) Fossil fuels Other non-renewables Renewa bles Waste materials Ancillaries Net water Net air Electrical energy (kWh)a Outputs (kg) CO2 co voc NO SO2 Halides Otherb Dust TDS TSS BOD COD Oils Landfill weight Landfill volume (m3) Electrical energy (kWh)
18.4584 0.0000 0.361 6
1000.0000 0.0000 0.0000
19.8589 40.8665
151 4.7294 0.4688 0.5388 1.8901 0.5794 0.0000 0.1 240 0.0325 0.0000 0.0000 0.0000 0.0000 0.0000 6.21 65 8.8896
1691.001 9
3.4739 0.0000 0.0000 0.0000 0.0000 0.0000 7.5955 0.7426
10.6320 0.0576 0.0284 0.201 2 0.0459 0.0000 0.0000 0.01 25 0.0000 0.0000 0.0000 0.0000 0.0000 0.0000 0.0000
36.6729
0.8849
30.01 36
51.2767 0.0275 0.1 568 0.21 77 0.571 5
15.21 43
100.0000
14 9861 0 0000 0 361 6 0 0000 0 0000 0 0000
12 2649
20 9539 00112 0 0641 0 0890 0 2336
6 21 72
40 8665
0.0000 0.0000 0.0000
1000.0000 0.0000 0.0000 0.0000
40.1 243
1483.1 461 0.400 0.4476 1.6000 0.3000
0.1 243 0.0200
6.21 65 8.8896
1691.001 9
aRaw materials and environmental impacts associated with generation included. bLeachates and smell gases included.
LIFE-CYCLE ANALYSIS AND WASTE MANAGEMENT 163
10000.0000
1000.0000
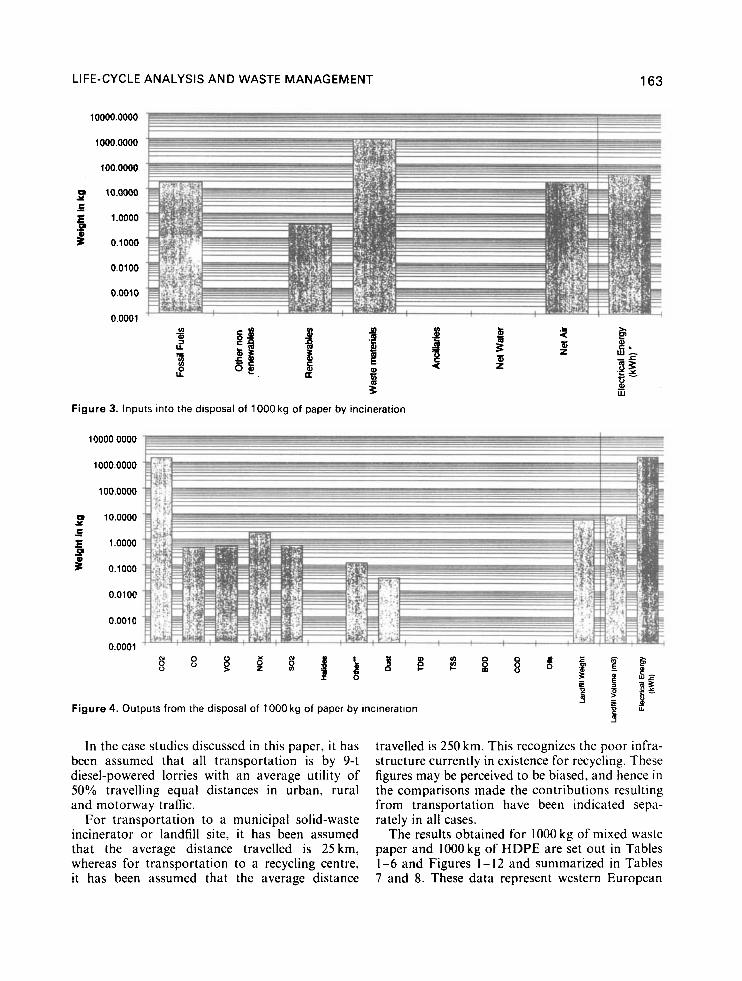
Figure 3. Inputs into the disposal of 1000 kg of paper by incineration
1rJooo 0000
1000 0000
10.0000
1 .oooo
0.1000
0.0100
0.0010
0.0001 g s g g ; n s
% o
Figure 4. Outputs from the disposal of 1000 kg of paper by incineration
In the case studies discussed in this paper, it has been assumed that all transportation is by 9-t diesel-powered lorries with an average utility of 50% travelling equal distances in urban, rural and motorway traffic.
For transportation to a municipal solid-waste incinerator or landfill site, i t has been assumed that the average distance travelled is 25km, whereas for transportation to a recycling centre, it has been assumed that the average distance
travelled is 250 km. This recognizes the poor infra- structure currently in existence for recycling. These figures may be perceived to be biased, and hence in the comparisons made the contributions resulting from transportation have been indicated sepa- rately in all cases.
The results obtained for 1000 kg of mixed waste paper and 1000 kg of HDPE are set out in Tables 1-6 and Figures 1-12 and summarized in Tables 7 and 8. These data represent western European

164 N. KIRKPATRICK
Table 3. Environmental inputs and outputs for disposal of 1000 kg of mixed paper waste by landfill
management Total Transport Unit energy Electricity Waste
Inputs (kg) Fossil fuels Other non-renewables Renewa bles Waste materials Ancillaries Net water Net air Electrical energy (kWh)a Outputs (kg) Electrical energy (kWh) COZ co voc NO
Halides Otherb Dust TDS TSS BOD COD Oils Landfill weight Landfill volume (m3)
SO2
11.0931 0.0000 0.1 841
1000.0000 0.0000 0.0000
13.81 66 20.8037
0.0000 21.2674 0.0631 0.2899 0.2458 0.1 646 0.000 0.0633 0.01 24 0.0000 0.000 0.0000 0.0000 0.0000
1003.1 651 1054.5261
3 4638 0 0000 0 0000 0 0000 0 0000 0 0000 7 5726 0 7404
10 5999 0 0574 0 0284 0 2006 0 0457 0 000 0 0000 0 01 24 0 0000 0 0000 0 0000 0 0000 0 0000 0 0000 0 0000
36.6729
0.8849
30.01 36
100.0000 51.2767 0.0275 0.1 568 0.21 77 0.571 5
15.21 43
7.6293 0.0000 0.1 841 0.0000 0.0000 0.0000 6.2440
20.8037 10.6675 0.00057 0.0326 0.0453 0.1 189
3.1651
0.0000 0.0000 0.0000
1000.0000 0.0000 0.0000 0.0000
20.0633
0.2279
0.0633
1003.1 651 1054.5261
'Raw materials and environmental impacts associated with generation included bLeachates and smell gases included.
average values and have been abstracted from the Pira International database generated as part of its major research programme on the life-cycle analysis of packaging.
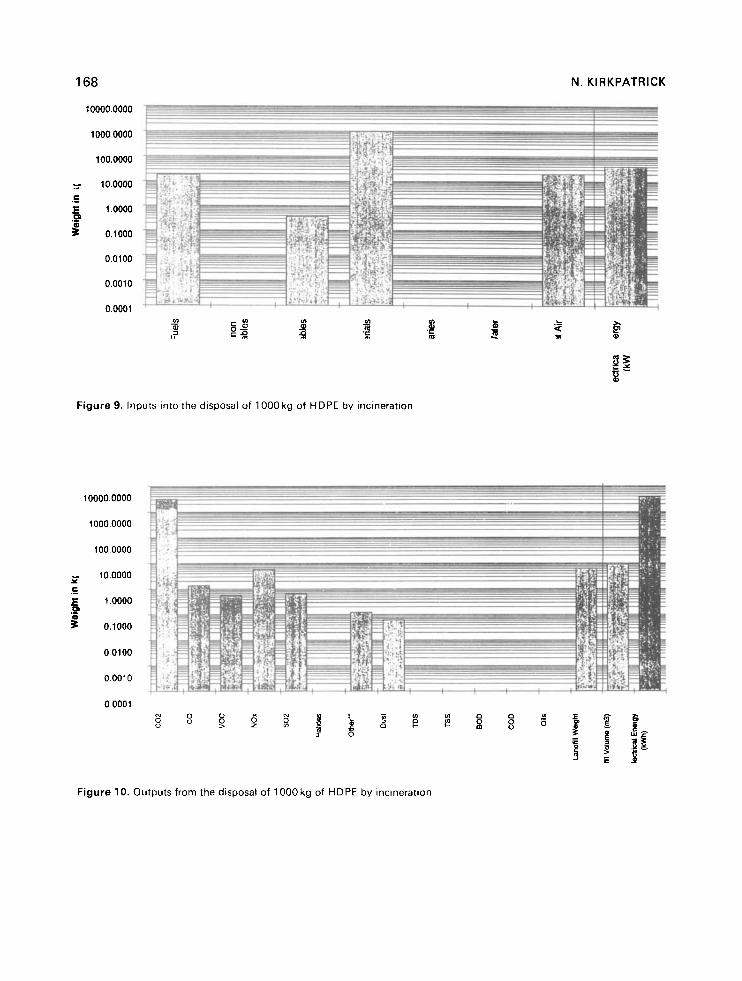
In both cases, it can be seen that recycling requires much greater quantities of fossil fuels (largely to generate the energy required to facilitate the process) compared with incineration and land- fill. As a consequence relatively substantial levels of carbon dioxide (a greenhouse gas) are generated.
Incineration also results in relatively substantial levels of carbon dioxide, especially in the case of HDPE. However, even allowing for a 30-35% efficiency of energy conversion, incineration may offer quite respectable levels of electrical energy recovery.
It is interesting to note that solid-waste manage- ment practices are not strictly defined, in the sense that even recycling and incineration (in the case
of paper) generate solid waste through losses, removal of contaminants and/or ash formation.
In making these comparisons it is emphasized that there is no attempt to advocate recycling, incineration or landfill as a preferred method of solid-waste management. Rather, it is intended simply to illustrate that depending on the particu- lar perspective, each option may be argued to be more or less favourable than any other.
PRlORlTlZATlO N OF ENVIRONMENTAL CONCERNS
There is at present no universally accepted way of prioritizing environmental concerns. This being the case, for the purposes of discussion some of the perceived relative advantages and dis- advantages of each of the solid-waste management

LIFE-CYCLE ANALYSIS AND WASTE MANAGEMENT 165
10000.0000
1000.0000
100.0000
3 10.0000 E .- E, 1.0000
5 0.1000 .-
0.0100
0.0010
0.0001
Figure 5. Inputs into the disposal of 1000 kg of paper by landfill
1000.0000
100.0000
0 10.0000 1 E I .-
I .oooo E, - P 0.1000
0.0100
0.0010
0.0001
N g s $ q g 4 b J g $ g g " d 5 f I 0
Figure 6. Outputs from the disposal of 1000 kg of paper by landfill
166 N. KIRKPATRICK
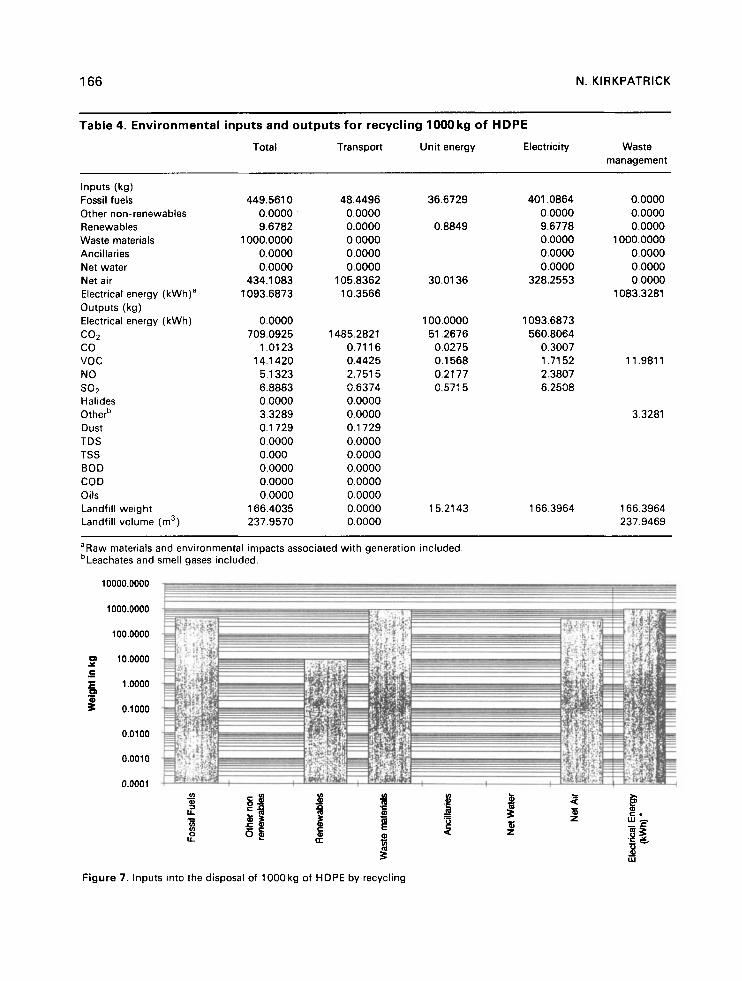
Table 4. Environmental inputs and outputs for recycling l000kg of HDPE
Total Transport Unit energy Electricity Waste management
Inputs (kg) Fossil fuels Other non-renewables Renewables Waste materials Ancillaries Net water Net air Electrical energy (kWh)a Outputs (kg) Electrical energy (kWh) co2 co voc NO so2 Halides Otherb Dust TDS TSS BOD COD Oils Landfill weight Landfill volume (m3)
449.561 0 0.0000 9.6782
1000.0000 0.0000 0.0000
434.1 083 1093.6873
0.0000 709.0925
1.01 23 14.1 420 5.1 323 6.8883 0.0000 3.3289 0.1 729 0.0000 0.000 0.0000 0.0000 0.0000
166.4035 237.9570
48.4496 0.0000 0.0000 0.0000 0.0000 0.0000
105.8362 10.3566
1485.2821 0.71 16 0.4425 2.751 5 0.6374 0.0000 0.0000 0.1 729 0.0000 0.0000 0.0000 0.0000 0.0000 0.0000 0.0000
36.6729
0.8849
30.01 36
100.0000 51.2676 0.0275 0.1 568 0.21 77 0.571 5
15.21 43
401.0864 0.0000 9.6778 0.0000 0.0000 0.0000
328.2553
1093.6873 560.8064
0.3007 1.71 52 2.3807 6.2508
166.3964
0.0000 0.0000 0.0000
1000.0000 0.0000 0.0000 0.0000
1083.3281
11.9811
3.3281
166.3964 237.9469
a Raw materials and environmental impacts associated with generation included. bLeachates and smell gases included.
10000.0000 -- 1
1000.0000
100.0000
2 10.0000 c -
1 .oooo E, - s 0.1000
0.0100
0.0010
0.0001
Figure 7. Inputs into the disposal of 1000 kg of HDPE by recycling
LIFE-CYCLE ANALYSIS AND WASTE MANAGEMENT 167
1 ooo.ooO0
100.0000
D 10.0000 1 E -
1 .oooo
0.1000
E, -
0.0100
0.0010
0.0001 g s g g p a g p z i $ k i
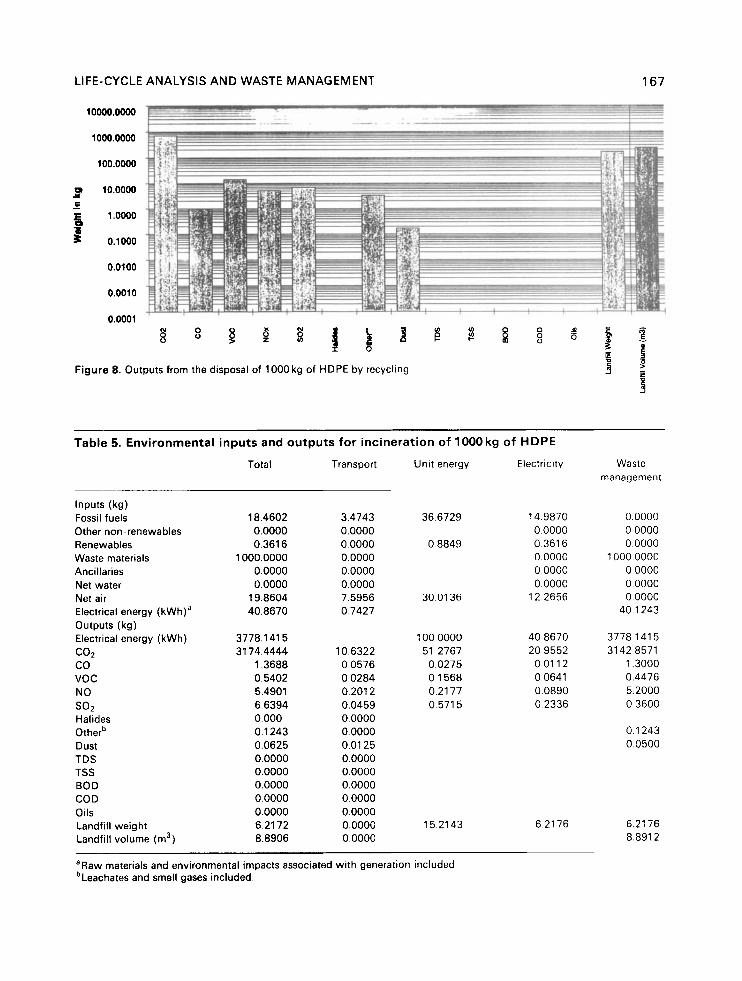
Figure 8. Outputs from the disposal of 1000 kg of HDPE by recycling
Table 5. Environmental inputs and outputs for incineration of lOOOkg of HDPE
Total Transport Unit energy Electricity Waste management
Inputs (kg) Fossil fuels Other non-renewables Renewables Waste materials Ancillaries Net water Net air Electrical energy (kWh)a Outputs (kg) Electrical energy (kWh) co2 co voc NO so2 Halides Otherb Dust TDS TSS BOD COD Oils Landfill weight Landfill volume (m3)
18.4602 0.0000 0.361 6
1000.0000 0.0000 0.0000
19.8604 40.8670
3778.1 41 5 31 74.4444
1.3688 0.5402 5.4901 6.6394 0.000 0.1 243 0.0625 0.0000 0.0000 0.0000 0.0000 0.0000 6.21 72 8.8906
3.4743 0.0000 0.0000 0.0000 0.0000 0 0000 7.5956 0 7427
10.6322 0.0576 0.0284 0.201 2 0.0459 0.0000 0.0000 0.01 25 0.0000 0.0000 0.0000 0.0000 0.0000 0.0000 0.0000
36.6729
0.8849
30.01 36
100.0000 51.2767 0.0275 0.1 568 0.21 77 0.571 5
15.21 43
14 9870 0 0000 0 3616 0 0000 0 0000 0 0000
12 2656
40 8670 20 9552 00112 0 0641 0 0890 0 2336
6 2176
0 0000 0 0000 0 0000
1000 0000 0 0000 0 0000 0 0000
40 1243
3778 141 5 31 42 8571
1 3000 0.4476 5 2000 0 3600
0.1 243 0.0500
6.21 76 8.891 2
aRaw materials and environmental impacts associated with generation included. bLeachates and smell gases included.
168 N. KIRKPATRICK
10000.0000
1000.0000
100.0000
=. 10.0000 c .- ~
1 .oooo E, .- s 0.1000
0.0100
0.0010
0.0001
Figure 9. Inputs into the disposal of 1000 kg of HDPE by incineration
10000.0000
1000.0000
100.0000
L a - 8 ii
0 0100
0 0010
0 0001
Figure 10. Outputs from the disposal of 1000 kg of HDPE by incineration

LIFE-CYCLE ANALYSIS AND WASTE MANAGEMENT 169
Table 6. Environmental inputs and outputs for disposal of 1000 kg of HDPE by landfill
Total Transport Unit energy Electricity Waste management
Inputs (kg) Fossil fuels Other non-renewables Renewables Waste materials Ancillaries Net water Net air Electrical energy (kWh)a Outputs (kg) Electrical energy (kWh) c02 co voc NO so2 Halides Otherb Dust TDS TSS BOD CO D Oils Landfill weight Landfill volume (m3)
11.1 162 0.0000 0.1 845
1000.0000 0.0000 0.0000
13.8320 20.8058
0.0000 21.271 9
0.0631 0.2907 0.2459 0.1 647 0.0000 0.0638 0.01 24 0.0000 0.000 0.0000 0.0000 0.0000
1003.1 71 7 11 64.5355
3.4639 0.0000 0.0000 0.0000 0.0000 0.0000 7.5727 0.7404
10.6000 0.0574 0.0284 0.2006 0.0457 0.0000 0.0000 0.01 24 0.0000 0.0000 0.0000 0.0000 0.0000 0.0000 0.0000
36.6729
0.8849
30.01 36
100.0000 51.2767 0.0275 0.1 568 0.21 77 0.571 5
15 2143
7.6301 0.0000 0.1 841 0.0000 0.0000 0.0000 6.2446
20.8058 10.6685 0.0057 0.0326 0.0453 0.1 189
0.0000 0.0000 0.0000
1000.0000 0.0000 0.0000 0.0000
20.0634
0.2284
0.0634
3.1 654 1003.1 654 1 164.5266
'Raw materials and environmental impacts associated with generation included bLeachates and smell gases included.
10000.0000
1000.0000
100.0000
9 10.0000 c -
1 .oooo E, I 5 0.1000
0.0100
0.0010
0.0001
Figure 11. Inputs into the disposal of 1000 kg of HDPE by landfill

170 10000.0000
1000.0000
100.0000
a 10.0000
1 .oom
0.1000
0.0100
0.0010
0.0001
Y c - 5 -
N. KIRKPATRICK
" 3 Figure 12. Outputs from the disposal of 1000 kg of HDPE by landfill
Table 7. Total environmental input and outputs for various management systems for mixed paper waste
Inputs (kg) Recycling Incineration Landfill
Fossil fuels Other non-renewables Renewables Waste materials Ancillaries Net water Net air
Electrical energy (kWh)
Outputs (kg) COZ co voc NO SO2 Halides Other Dust TDS TSS BOD COD Oils Landfill weight Landfill volume Electrical energy
(kWh)
954 0
23 1000
0 0
786
2600
1340 0.8
32.5 5.8
14.9 0.0 7.9 0.01 0.0 1.05 0.51 3.62 0.0
394 584
0.0
18 0 0.4
1000 0 0
20
41
151 5 0.5 0.5 1.9 0.6 0.0 0.1 2 0.03 0.0 0.0 0.0 0.0 0.0 6.2 8.9
1691
11 0 0.2
1000 0 0
14
21
21 0.06 0.3 0.2 0.2 0.0 0.06 0.01 0.0 0.0 0.0 0.0 0.0
1003 1055
0.0
Table 8. Total environmental inputs and out- puts for various management systems for HDPE
Inputs (kg) Recycling Incineration Landfill
Fossil fuels Other non-renewables Renewables Waste materials Ancillaries Net water Net air
Electrical energy (kWh)
Outputs (kg) co2 co vo c NO so2 Halides Other Dust TDS TSS BOD COD Oils Landfill weight Landfill volume Electrical energy
(kWh)
450 0 0 9 7
0 0 0 0
1000
434
1094
709 1 0
14 1 5 1 6 9 0 0 3 3 0 2 0 0 0 0 0 00 0 00 0 0
16 6
0 0 238
18 0.0 0.4
0.0 0.0
1000
20
41
31 74 1.4 0.5 5.5 0.6 0.0 0.1 0.06 0.0 0.0 0.0 0.0 0.0 6 9
3778
11 0 0 0 2
0 0 0 0
1000
14
21
21 0 06 0 3 0 2 0 2 0 0 0 06 0 01 0 0 0 0 0 0 0 0 0 0
1003 1165
0 0

LIFE-CYCLE ANALYSIS AND WASTE MANAGEMENT 171
practices discussed above are listed in Table 9, which is based (where possible) on the quantifiable measures illustrated in Tables 1-6.
The most obvious conclusions reached from these comparisons are that on environmental grounds there are arguments for and against the claim that each of recycling, incineration and land- fill is preferred, whereas on economic grounds, capi- tal investment and current net costs for disposing/ processing dictate that landfill is the cheapest method of solid-waste management. This fact has been recognized by government and regulatory authorities and leads them to the conclusion that to promote the diversion of solid waste from land- fill to any alternative solid-waste management practice, it is necessary to increase the cost of disposal by landfill with diversion of funds made possible also through recycling credits.
HOW TO RESOLVE THE DILEMMA OVER
MANAGEMENT PRACTICES PREFERRED SOL1 D-WASTE
The first point to re-emphasize here is that the rela- tive environmental impact of solid-waste manage- ment can be considered only in the context of a full life-cycle analysis.
Interpretation of the findings of a life cycle analysis requires additional steps, typically referred to as classiJication and valuution, in order to build up a holistic picture of quantified measures and their relative contributions to different environmental concerns. Collectively, these considerations define life-cycle assessment.
CIassiJication entails an aggregation (summa- tion) of related parameters into what are generally referred to as ‘potential factors’; for example, the aggregation of atmospheric emissions, such as carbon dioxide and methane, into a global warm- ing potential factor, where the units might be expressed as carbon dioxide equivalents. The latter would allow for the fact that methane is believed to contribute over 20 times more to global warming on a comparative per unit weight basis.
Valuation provides an interpretation of the rela- tive environmental significance of those parameters aggregated at the classification stage, which in an ideal world should be on the basis of scientifically derived formulae, although in reality it is currently conducted based on subjective perception.
To this end, classification and valuation have
been selected as key areas for future research activ- ities to be carried out by Pira International.
Without there being a definitive approach to conducting life-cycle assessment studies (as dis- tinct from life-cycle analysis studies), one approach that companies might use to justify a given solid-waste management (or other) practice is to specify precise targets in their environmental policy and then use these to provide the necessary framework against which decisions can be made. Adopting this approach, it is not vital-although it is desirable-to know the relative contribution to individual environmental concerns made by all parameters quantified. The principle operates on the bases of a ‘less is best philosophy’, which serves to provide some direction, though, admittedly, it will not resolve all topics for discussion, owing to the complexity of the subject and the interactions that occur when one parameter contributes to more than one environmental concern.
To follow this approach, it is first necessary to quantify all environmental inputs and outputs that occur as a result of an organization’s activ- ities, as laid down in the review of environmental effects described in BS7750 ‘Specification for environmental management systems’. This will include all inputs and outputs resulting from manufacturing processes, as well as those asso- ciated with heating, lighting, transportation and procurement (including packaging).
This is no simple task, but it is the only way a given organization can build up a detailed picture of the impact on the environment of its nor- mal operations. Taking a simple case, a company may specify in its environmental policy a target to decrease its energy consumption by a given percentage over a defined period of time. If that company had sufficient resources to process its solid waste by incineration with energy recovery, then that could provide the justification for select- ing incineration with energy recovery as the pre- ferred solid-waste management practice.
In reality, such business decisions can only be taken bearing in mind the legislative and regula- tory framework that exists and the key to business success is recognizing the resulting economic impli- cations. The question then arises as to whether a decision based on environmental grounds that was not the cheapest option to adopt could be exploited in order to achieve market gain, thereby providing a financial justification by an indirect means as opposed to the obvious bottom line con- siderations of assuming a static market.
172 N. KIRKPATRICK
~~
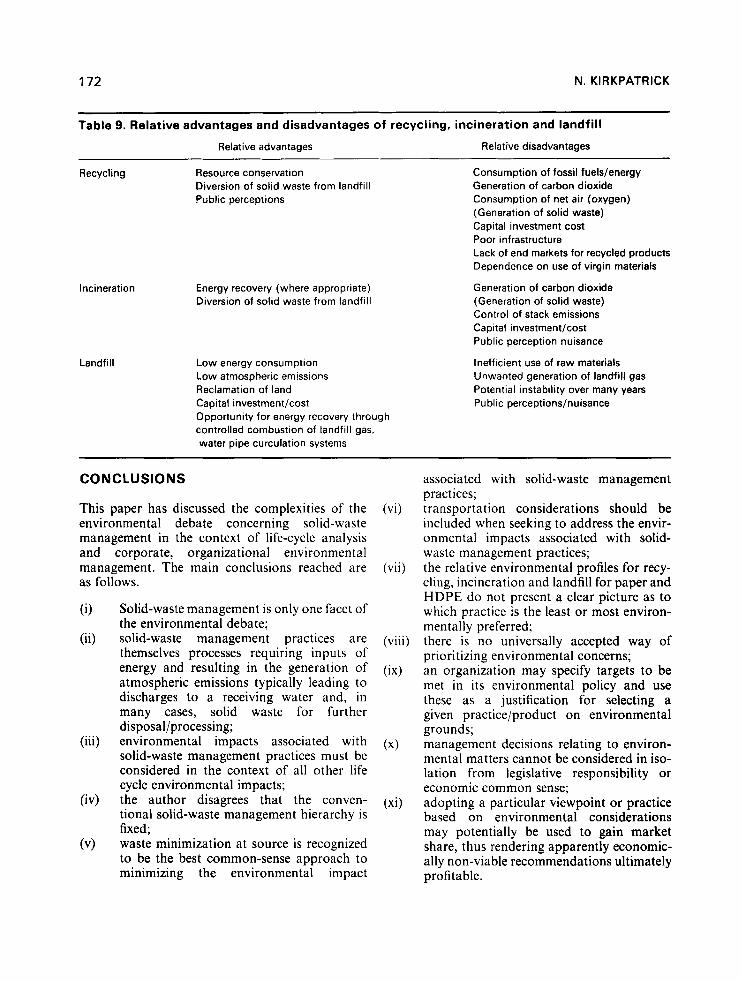
Table 9. Relative advantages and disadvantages of recycling, incineration and landfill
Relative advantages Relative disadvantages
Recycling Resource conservation Diversion of solid waste from landfill Public perceptions
Incineration
Landfill
Energy recovery (where appropriate) Diversion of solid waste from landfill
Low energy consumption Low atmospheric emissions Reclamation of land Capital investment/cost Opportunity for energy recovery through controlled combustion of landfill gas, water pipe curculation systems
Consumption of fossil fuels/energy Generation of carbon dioxide Consumption of net air (oxygen) (Generation of solid waste) Capital investment cost Poor infrastructure Lack of end markets for recycled products Dependence on use of virgin materials
Generation of carbon dioxide (Generation of solid waste) Control of stack emissions Capital investment/cost Public perception nuisance
Inefficient use of raw materials Unwanted generation of landfill gas Potential instability over many years Public perceptions/nuisance
CONCLUSIONS
This paper has discussed the complexities of the environmental debate concerning solid-waste management in the context of life-cycle analysis and corporate, organizational environmental management. The main conclusions reached are as follows.
(i) Solid-waste management is only one facet of the environmental debate;
(ii) solid-waste management practices are themselves processes requiring inputs of energy and resulting in the generation of atmospheric emissions typically leading to discharges to a receiving water and, in many cases, solid waste for further disposal/processing;
(iii) environmental impacts associated with solid-waste management practices must be considered in the context of all other life cycle environmental impacts;
(iv) the author disagrees that the conven- tional solid-waste management hierarchy is fixed; waste minimization at source is recognized to be the best common-sense approach to minimizing the environmental impact
(v)
associated with solid-waste management practices;
(vi) transportation considerations should be included when seeking to address the envir- onmental impacts associated with solid- waste management practices; the relative environmental profiles for recy- cling, incineration and landfill for paper and HDPE do not present a clear picture as to which practice is the least or most environ- mentally preferred; there is no universally accepted way of prioritizing environmental concerns; an organization may specify targets to be met in its environmental policy and use these as a justification for selecting a given practice/product on environmental grounds; management decisions relating to environ- mental matters cannot be considered in iso- lation from legislative responsibility or economic common sense; adopting a particular viewpoint or practice based on environmental considerations may potentially be used to gain market share, thus rendering apparently economic- ally non-viable recommendations ultimately profitable.
(vii)
(viii)
(ix)
(x)
(xi)