Anaerobic Digestion as a Waste Disposal Option for ...
35
ELP-422-5043 • UC Category: 320 • DE93000068 Anaerobic Diges Disposal Option Samoa C. Rivd nasa Waste American Naonal Renewable Energy Laboratory 1617 Cole Boulevard Golden, Colorado 80401-3393 A Division of Midwest Research Instute erated for the U.S. Deptment of Energy under Conact No. DE-AC02-83CH10093 Preped under task no. WM213232 January 1993
Transcript of Anaerobic Digestion as a Waste Disposal Option for ...

l -�, I
t l
'r
J
I J
NREL/TP-422-5043 • UC Category: 320 • DE93000068
Anaerobic Diges Disposal Option Samoa
C. Rivard
n as a Waste American
National Renewable Energy Laboratory 1617 Cole Boulevard Golden, Colorado 80401-3393 A Division of Midwest Research Institute Operated for the U.S. Department of Energy under Contract No. DE-AC02-83CH10093
Prepared under task no. WM213232
January 1993
NOTICE NOTICE: This report was prepared as an account of work sponsored by an agency of the United States government Neither the United States government nor any agency thereof, nor any of their employees, makes any warranty, express or implied, or assumes any legaHiability or responsibility for the accuracy, completeness, or usefulness of any information, apparatus, product, or process disclosed, or represents.that its use would not infringe privately owned rights. Reference herein to any specific commercial product, process, or service by trade name, trademark, manufacturer, or otherwise does not necessarily constitute or imply its endorsement, recommendation, or favoring by the United States government or any agency thereof. The views and opinions of authors expressed herein do not necessarily state or reflect those of the United States government or any agency thereof.
Printed in the United States of America Available from:
National Technical Information Service U.S. Department of Commerce
5285 Port Royal Road Springfield, VA 22161
Price: Microfiche A01 Printed Copy A03
Codes are used for pricing all publications. The code is determined by the number of pages in the publication. Information pertaining to the pricing codes
. .
,n 1
-� J
L, _ _,
1>- i
can be found in the current issue of the following publications which are generally available in most libraries: Energy Research Abstracts (ERA); Government · 1 Reports Announcements and Index (GRA and I); Scientific and Technical Abstract Reports (STAR); and publication NTIS-PR-360 available from NTIS at the above address.
#. a ' Printed on recycled paper ( 1 •• j � I
l .I r
1
J l \ I !: J
1.0
2.0
3.0
4.0
5.0
6.0
7.0
8.0
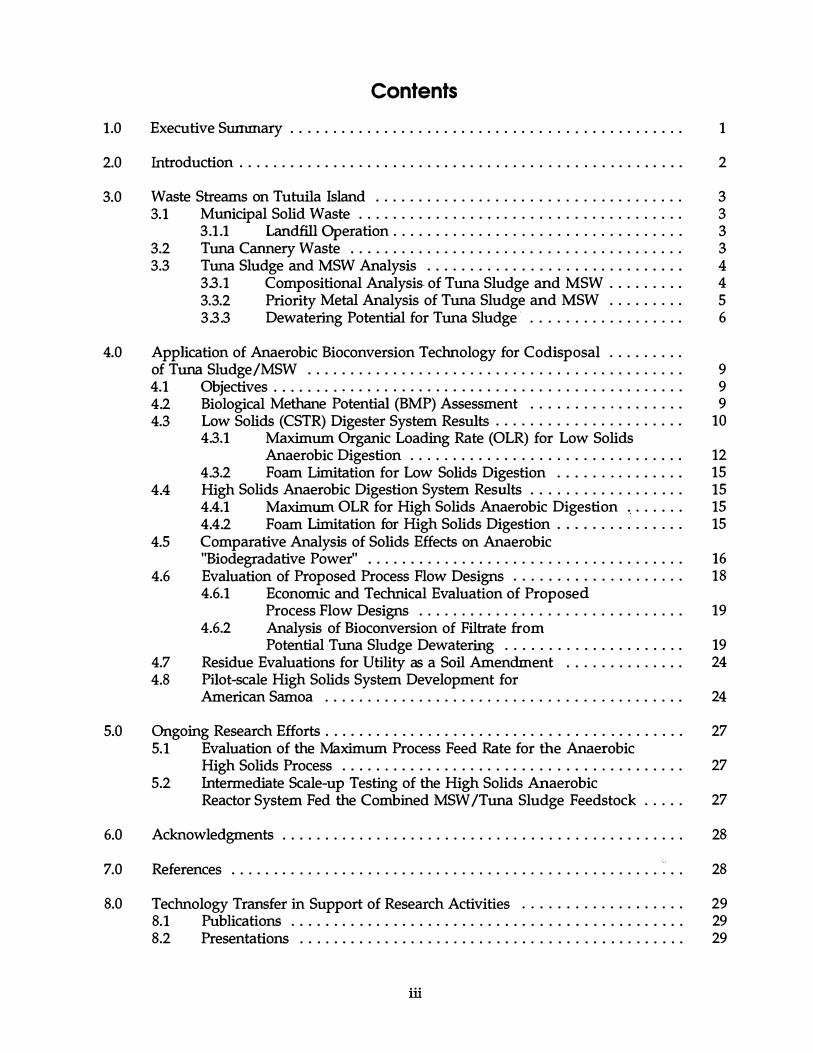
Contents
Executive SUIIllll.ary . . . . . . . . . . . . . . . . . . . . . . . . . . . . . . . . . . . . . . . . . . . ...
Irttroduction . . . . . . . . . . . . . . . . . . . . . . . . . . . . . . . . . . . . . . . . . . . . . . . . . . ..
Waste Streams on Tutuila Island ................................... . 3.1 Municipal Solid Waste ..................................... .
3.1.1 Landfill Operation ................................. . 3.2 Tuna Cannery Waste ...................................... . 3.3 Tuna Sludge and MSW Analysis ............................. .
3.3.1 Compositional Analysis. of Tuna Sludge and MSW ........ . 3.3.2 Priority Metal Analysis of Tuna Sludge and MSW ........ . 3.3.3 Dewatering Potential for Tuna Sludge· ................. .
Application of Anaerobic Bioconversion Technology for Codisposal ........ . of Tuna Sludge/MSW ........................................... . 4.1 Objectives . . . . . . . . . . . . . . . . . . . . . . . . . . . . . . . . . . . . . . . . . . . . ... . 4.2 Biological Methane Potential (BMP) Assessment . . . . . . . . . . ....... . 4.3 Low Solids (CSTR) Digester System Results ..................... .
4.3.1 Maximum Organic Loading Rate (OLR) for Low Solids Anaerobic Digestion ............................... .
4.3.2 Foam Limitation for Low Solids Digestion .............. . 4.4 High Solids Anaerobic Digestion System Results . . . . . . . . . . . . . . . .. .
4.4.1 Maximum OLR for High Solids Anaerobic Digestion ....... . 4.4.2 Foam Limitation for High Solids Digestion . . . . . . . . . . . . . ..
4.5 Comparative Analysis of Solids Effects on Anaerobic "Biodegradative Power" .................................... .
4.6 Evaluation of Proposed Process Flow Designs ................... . 4.6.1 Economic and Technical Evaluation of Proposed
Process Flow Designs .............................. . 4.6.2 Analysis of Bioconversion of Filtrate from
Potential Tuna Sludge Dewatering .................... . 4.7 Residue Evaluations for Utility as a Soil Amendment ............. . 4.8 Pilot-scale High Solids System Development for
American Samoa ......................................... .
Ongoing Research Efforts . . . . . . . . . . . . . . . . . . . . . . . . . . . . . . . . . . ....... . 5.1 Evaluation of the Maximum Process Feed Rate for the Anaerobic
High Solids Process . . . . . . . . . . . . . . . . . . . . . . . . . . . . . .......... . 5.2 Irttermediate Scale-up Testing of the High Solids Anaerobic
Reactor System Fed the Combined MSW /Tuna Sludge Feedstock .....
Acknowledgments .............................................. .
References . . . . . . . . . . . . . . . . . . . . . . . . . . . . . . . . . . . . . . . . . . . ....... ·:· .. Technology Transfer in Support of Research Activities .................. . 8.1 Publications . . . . . . . . . . . . . . . . . . . . . . . . . . . . . . . . . . . . . . . . . . . . .. 8.2 Presentations . . . . . . . . . . . . . . . . . . . . . . . . . . . . . . . . . . . . . . . . . . . ..
iii
1
2
3 3 3 3
4 4 5 6
9 9 9
1 0
1 2 15 15 15 15
1 6 1 8
1 9
1 9 24
24
27
27
27
28
28
29 29 29
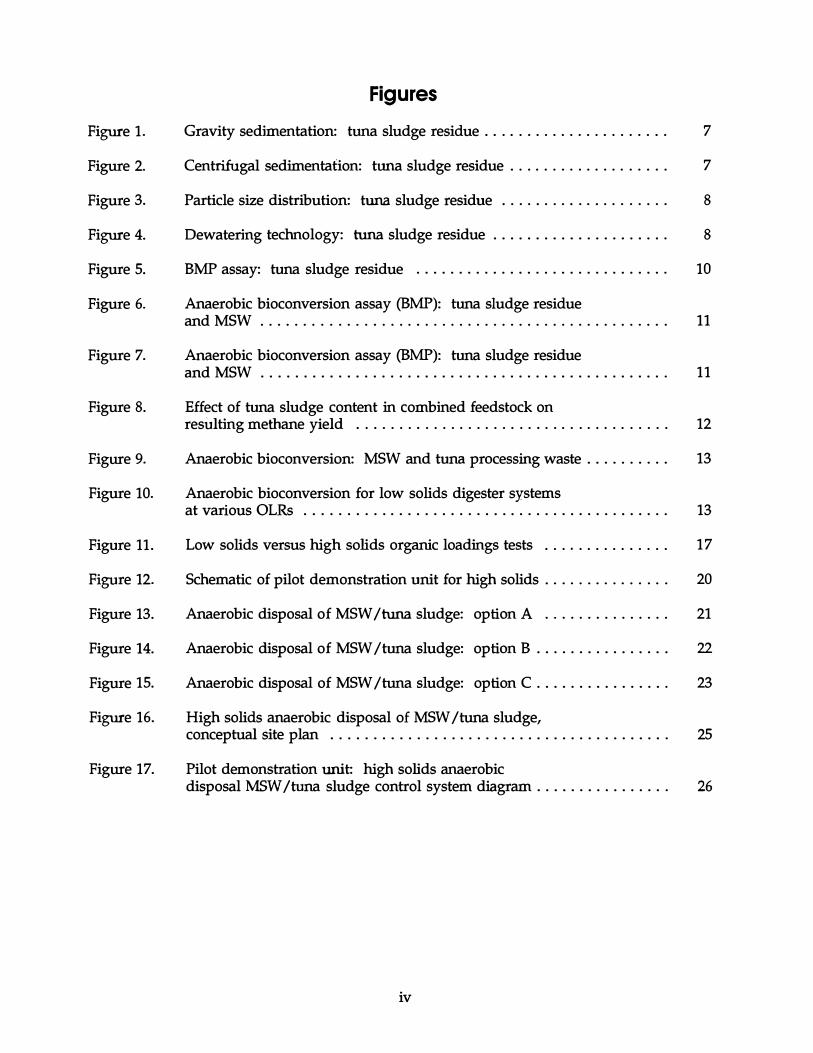
Figure 1 .
Figure 2.
Figure 3.
Figure 4.
Figure 5.
Figure 6.
Figure 7 .
Figure 8.
Figure 9 .
Figure 1 0 .
Figure 11.
Figure 1 2.
Figure 1 3.
Figure 1 4.
Figure 15.
Figure 1 6.
Figure 1 7.
Figures
Gravity sedimentation: tuna sludge residue . . . . . . . . . . . . . . . . . . . . . .
Centrifugal sedimentation: tuna sludge residue . . . . . . . . . . . . . . . . . . .
Particle size distribution: tuna sludge residue . . . . . . . . . . . . . . . . . . . .
Dewatering technology: tuna sludge residue .................... .
BMP assay: tuna sludge residue ............................. .
Anaerobic bioconversion assay (BMP): tuna sludge residue and MSW . . . . . . . . . . . . . . . . . . . . . . . . . . . . . . . . . . . . . . . . . . . . . . . .
Anaerobic bioconversion assay (BMP): tuna sludge residue and MSW ............................................... .
Effect of tuna sludge content in combined feedstock on resulting methane yield . . . . . . . . . . . . . . . . . . . . . . . . . . . . . . . . . . . . .
Anaerobic bioconversion: MSW and tuna processing waste ......... .
Anaerobic bioconversion for low solids digester systems at various OLRs .......................................... .
Low solids versus high solids organic loadings tests . . . . . . . . . . . . . . .
Schematic of pilot demonstration unit for high solids . . . . . . . . . . . . . . .
Anaerobic disposal of MSW I tuna sludge: option A .............. .
Anaerobic disposal of MSW I tuna sludge: option B ............... .
Anaerobic disposal of MSW I tuna sludge: option C ............... .
High solids anaerobic disposal of MSW /tuna sludge, conceptual site plan ....................................... .
Pilot demonstration unit: high solids anaerobic disposal MSW /tuna sludge control system diagram ............... .
iv
7
7
8
8
10
11
11
1 2
1 3
1 3
1 7
2 0
21
22
23
25
2 6
' 1
i � j
] -l -� Table 1 .
- t Table 2.
I Table 3.
r � Table 4 .
Table 5.
Table 6.
j Table 7.
l Table 8.
'I 1
1
I :•
j
J
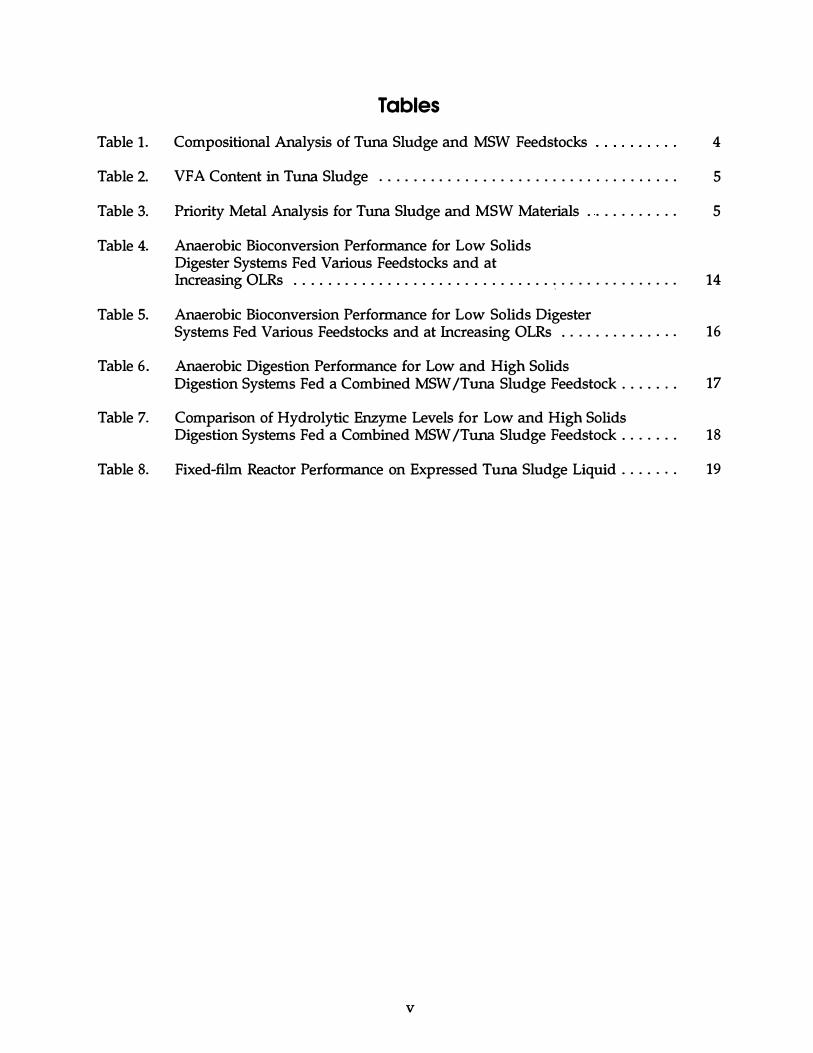
Tables
Compositional Analysis of Tuna Sludge and MSW Feedstock s 4
VFA Content in Tuna Sludge . . . . . . . . . . . . . . . . . . . . . . . . . . . . . . . . . . . 5
Priority Metal Analysis for Tuna Sludge and MSW Materials . . . . . . . . . . . 5
Anaerobic B ioconversion Performance for Low Solids Digester Systems Fed Various Feedstock s and at Increasing OLRs . . . . . . . . . . . . . . . . . . . . . . . . . . . . . . � . . . . . . . . . . . . . . 1 4
Anaerobic B ioconversion Performance for Low Solids Digester Systems Fed Various Feedstock s and at Increasing OLRs . . . . . . . . . . . . . . 1 6
Anaerobic Digestion Performance for Low and High Solids Digestion Systems Fed a Combined MSW /Tuna Sludge Feedstock ....... 17
Comparison of Hydrolytic Enzyme Levels for Low and High Solids Digestion Systems Fed a Combined MSW /Tuna Sludge Feedstock . . . . . . . 1 8
Fixed-film Reactor Performance on Expressed Tuna Sludge Liquid . . . ... . 1 9
v

) � 1
r r
r }
1 ) l r
.I
1.0 Executive Summary
Tuna sludge and municipal solid waste (MSW ) generated on Tutuila Island, American Samoa, represent an ongoing disposal problem as well as an emerging opportunity for use in renewable
fuel production. This research project focuses on the biological conversion of the organic fraction of these wastes to useful products including methane and fertilizer-grade residue through anaerobic high solids digestion.
Preliminary assessments of the anaerobic bioconversion potential for tuna sludge wastes indicated that after adaptation of the anaerobic microbial consortium, this waste was amenable to bioconve:tsion. Additionally, increasing the level of tuna sludge in a combined tuna sludge/MSW feedstock also required adaptation of the microbial consortium but ultimately resulted in increases in the methane yield and in the extent of anaerobic bioconversion.
Therefore, the addition of tuna sludge was found to supply nutrients required for effective MSW bioconversion, and thereby enhance the bioconversion of the MSW portion of the feedstock substantially.
The anaerobic bioconversion of the. combined tuna sludge/MSW feedstock evaluated in the conventional low solids continuous stirred tank reactor (CSTR) system demonstrate4 optimum bioconversion up to and including organic loading rates (feed introduction rates) of 8 grams of volatile solids per liter of reactor sludge volume per day (g VS/L•d). Even at this loading rate, the fermentation parameters were quite stable, with sludge pH values in excess of 7 .2 and low cumulative volatile fatty acid pools. However, organic loading rates in excess of 8 g VS/L•d resulted in excessive foam production, which limits the safe operation of the fermentation system.
The novel high solids system utilized to conduct anaerobic fermentations of the combined feedstock performed as anticipated and similarly to the low solids system, resulting in greater than 8 0 % bioconversion of the combined feedstock chemical oxygen demand (COD) content. The average methane yield for the combined feedstock was 0 .3 6 3 -0 .4 22 liters of methane per gram of volatile solids fed per day {L/g VS•d [5.82 -6 .7 6 ft3 /lb VS•d]). However, the high solids system was operated at a much greater organic loading than were the low solids systems.
Organic loading rates examined to date indicate a stable fermentation at loadings of 1 4 -1 8 g VS/L•d (0 .87 -1 .1 2 lb VS/ft3•d) for the combined feedstock Although additional studies are in progress to determine the maximum organic loading rate for the high solids system, results to date indicate the level of improvement in process economics that may be expected for the high solids system, including reduced reactor sizing {lOo/o-1 5% of a comparative low solids system) and organic feed rates of 2 -3 times that of the low solids system.
In summary, the anaerobic bioconversion of tuna sludge with MSW appears promising. In this preliminary study, the addition of tuna sludge to the MSW feedstock serves to enhance the overall bioconversion of the combined waste. This result will affect the bioconversion process by increasing the yield of the methane energy produced and will ensure a higher quality residue that is more stable to further bioconversion for use as a soil amendment.
1
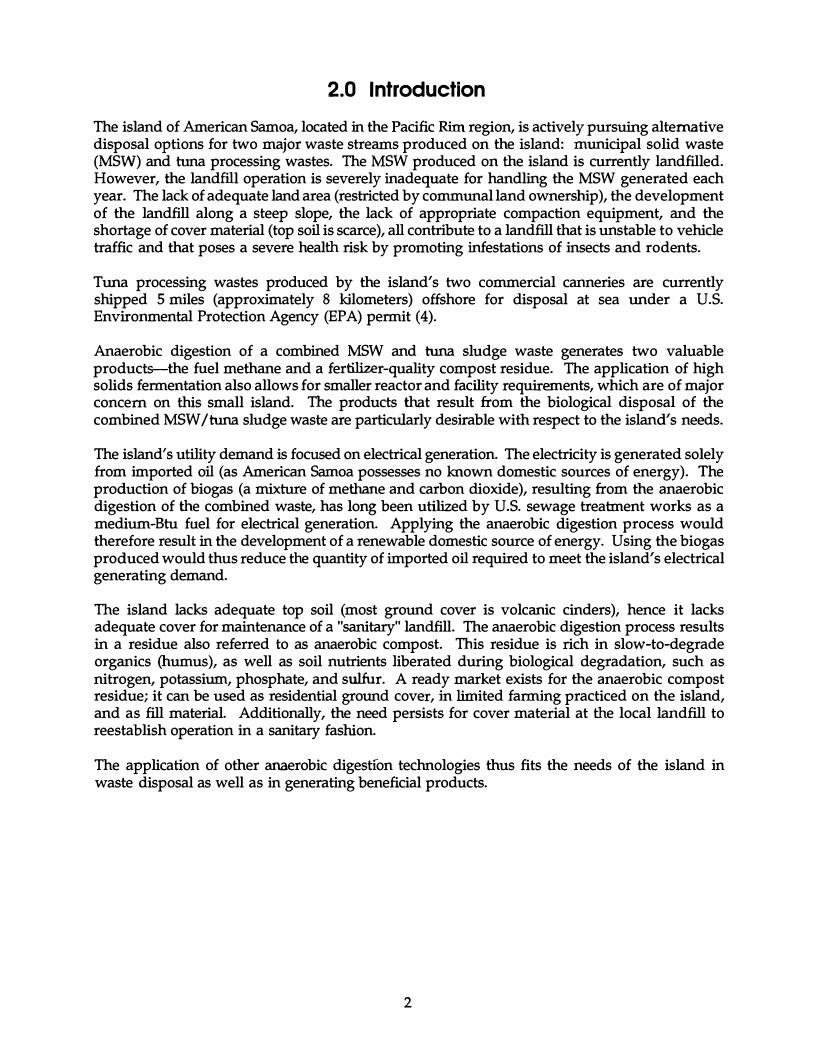
2.0 Introduction
The island of American Samoa, located in the Pacific Rim region, is actively pursuing alternative disposal options for two major waste streams produced on the island: municipal solid waste ·
(MSW) and tuna processing wastes. The MSW produced on the island is currently landfilled. However, the landfill operation is severely inadequate for handling the MSW generated each year. The lack of adequate land area (restricted by communal land ownership), the development of the landfill along a steep slope, the lack of appropriate compaction equipment, and the shortage of cover material (top soil is scarce), all contribute to a landfill that is unstable to vehicle traffic and that poses a severe health risk by promoting infestations of insects and rodents.
Tuna processing wastes produced by the island's two commercial canneries are currently shipped 5 miles (approximately 8 kilometers) offshore for disposal at sea under a U.S. Environmental Protection Agency (EPA) permit (4). Anaerobic digestion of a combined MSW and tuna sludge waste generates two valuable products-the fuel methane and a fertilizer-quality compost residue. The application of high solids fermentation also allows for smaller reactor and facility requirements, which are of major concern on this small island. The products that result from the biological disposal of the combined MSW /tuna sludge waste are particularly desirable with respect to the island's needs.
The island's utility demand is focused on electrical generation. The electricity is generated solely from imported oil (as American Samoa possesses no known domestic sources of energy). The production of biogas (a mixture of methane and carbon dioxide), resulting from the anaerobic digestion of the combined waste, has long been utilized by U.S. sewage treatment works as a medium-Btu fuel for electrical generation. Applying the anaerobic digestion process would therefore result in the development of a renewable domestic source of energy. Using the biogas produced would thus reduce the quantity of imported oil required to meet the island's electrical generating demand.
The island lacks adequate top soil (most ground cover is volcanic cinders), hence it lacks adequate cover for maintenance of a "sanitary" landfill. The anaerobic digestion process results in a residue also referred to as anaerobic compost. This residue is rich in slow-to-degrade organics (humus), as well as soil nutrients liberated during biological degradation, such as nitrogen, potassium, phosphate, and sulfur. A ready market exists for the anaerobic compost residue; it can be used as residential ground cover, in limited farming practiced on the island, and as fill material. Additionally, the need persists for cover material at the local landfill to reestablish operation in a sanitary fashion.
The application of other anaerobic digestion technologies thus fits the needs of the island in waste disposal as well as in generating beneficial products.
2
'1
! '
]
' > I i 1
I ,' l
� I
...... ·J
I i' j 1
) J .
I J
l )
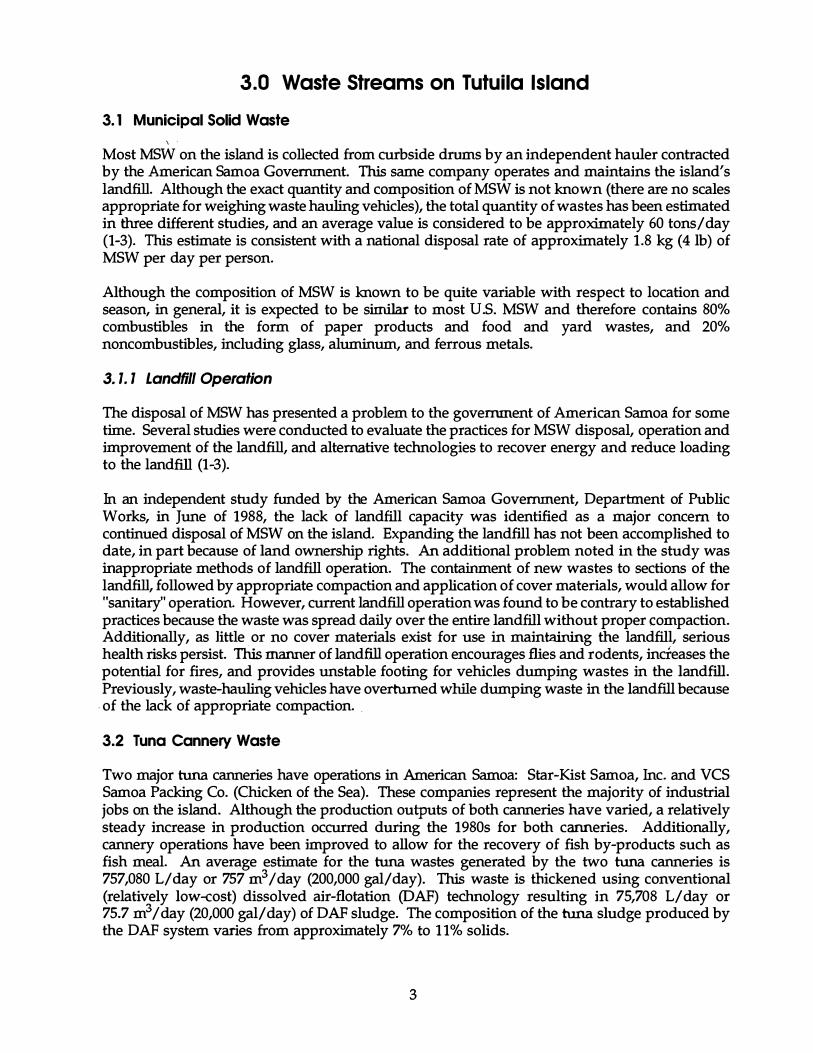
3.0 Waste Streams on Tutuila Island
3. 1 Municipal Solid Waste
' ' Most MSW on the island is collected from curbside drums by an independent haul er contracted by the American Samoa Government. This same company operates and maintains the island's landfill. Although the exact quantity and composition of MSW is not k nown (there are no scales appropriate for weighing waste hauling vehicles), the total quantity of wastes has been estimated in three different studies, and an average value is considered to be approximately 6 0 tons/day
{1 -3 ). This estimate is consistent with a national disposal rate of approximately 1 .8 k g (4 lb) of MSW per day per person.
Although the composition of MSW is known to be quite variable with respect to location and season, in general, it is expected to be similar to most U.S. MSW and therefore contains 8 0 % combustibles in the form of paper products and food and yard wastes, and 20 % noncombustibles, including glass, aluminum, and ferrous metals.
3. 1. 1 Landfill Operation
The disposal of MSW has presented a problem to the government of American Samoa for some time. Several studies were conducted to evaluate the practices for MSW disposal, operation and improvement of the landfill, and alternative technologies to recover energy and reduce loading to the landfill (1 -3 ).
In an independent study funded by the American Samoa Government, Department of Public W ork s, in June of 1 9 8 8 , the lack of landfill capacity was identified as a major concern to continued disposal of MSW on the island. Expanding the landfill has not been accomplished to date, in part because of land ownership rights. An additional problem noted in the study was
inappropriate methods of landfill operation. The containment of new wastes to sections of the landfill, followed by appropriate compaction and application of cover materials, would allow for
"sanitary" operation However, current landfill operation was found to be contrary to established practices because the waste was spread daily over the entire landfill without proper compaction.
Additionally, as little .or no cover materials exist for use in maintaining the landfill, serious health risk s persist. This mann er of landfill operation encourages flies and rodents, increases the potential for fires, and provides unstable footing for vehicles dumping wastes in the landfill. Previously, waste-hauling vehicles have overturn ed while dumping waste in the landfill because
. of the lack of appropriate compaction. .
3.2 Tuna Cannery Waste
Two major tuna canneries have operations in American Samoa: Star-Kist Samoa, Inc. and VCS Samoa Packing Co. (Chick en of the Sea). These companies represent the majority of industrial jobs on the island. Although the production outputs of both canneries have varied, a relatively steady increase in production occurred during the 1 9 8 0 s for both canneries. Additionally, cannery operations have been improved to allow for the recovery of fish by-products such as fish meal. An average estimate for the tuna wastes generated by the two tuna canneries is 75 7, 0 8 0 L/ day or 75 7 m3 I day (20 0 , 0 0 0 gal/ day). This waste is thick ened using conventional
(relatively low-cost) dissolved air-flotation (DAF ) technology resulting in 75 , 70 8 L/ day or 75 .7 m3 I day (20 , 0 0 0 gal/ day) of DAF sludge. The composition of the tuna sludge produced by the DAF system varies from approximately 7% to 1 1 % solids.
3
3.3 Tuna Sludge and MSW Analysis
Because of the remote location of the canneries in American Samoa, local (California) tuna sludge was procured for analysis and study. The cannery from which tuna sludge was procured is similar in operations to both canneries in American Samoa. Additionally, the MSW used for analysis and experimentation was obtained from a mainland U.S. source.
Specifically, tuna processing waste (sludge) was obtained .from Pan Pacific Fisheries, Inc., Terminal Island, California. During cannery operations, tuna processing wastes are partially dewatered, using DAF, to produce a sludge for disposal. Tuna sludge from the DAF was shipped frozen to our laboratory and maintained at -20°C in freezers until use.
The MSW feedstock used was obtained from Future Fuels; Inc., Thief River Falls, Minnesota. The MSW, a mixture of residential and industrial wastes, was processed using a combination of mechanical and manual separation. The MSW feedstock was obtained in two fractions, including the food/yard waste portion and the paper and paperboard materials (also referred to as refusederived fuel [RDF] in the form of densified pellets). The food/yard waste fraction was stored at 4°C until it was blended with the RDF-MSW fraction. Prior to blending, the food/yard waste was screened using a 1.9-cm {3/4-in.) tray sieve, and plastic materials were removed by hand. The RDF-MSW was size-reduced from the storage pellets using a knife mill (All Steel, Inc., Brunswick, New Jersey), equipped with a 0.95-cm {3/8-in.) round hole rejection screen. These materials were weighed separately and added to a large-scale cube blender at 82-kg {180-lb) total weight (50%-50% mix) and blended with forty 12.7-cm (5-in.) ceramic balls for approximately 48 h. The mixed MSW was again screened using the 1.9-cm {3/4-in.) tray sieve before it was packaged into plastic drum liners for storage. Most of the mixed MSW was stored at -20°C until it was used. -
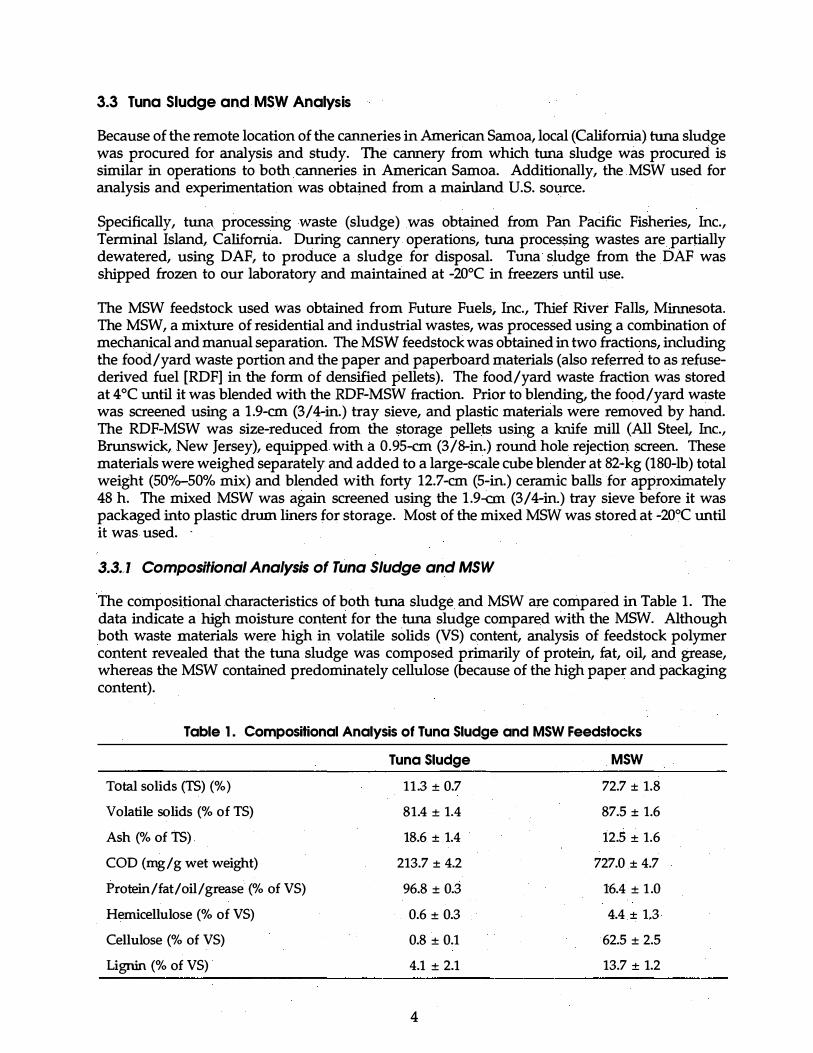
3.3.1 Compositional Analysis of Tuna Sludge and MSW
The compositional characteristics of both tuna sludge and MSW are compared in Table 1. The data indicate a high moisture content for the tuna sludge compared with the MSW. Although both waste materials were high in volatile solids (VS) content, analysis of feedstock polymer content revealed that the tuna sludge was composed primarily of protein, fat, oil, and grease, whereas the MSW contained predominately cellulose (because of the high paper and packaging content).
Table 1 . Compositional Analysis of Tuna Sludge and MSW Feedstocks
Tuna Sludge MSW
Total solids (1S) (%) 11 .3 ± 0.7 72.7 ± 1.8
Volatile solids (% of TS) 81.4 ± 1.4 87.5 ± 1.6
Ash (% of 1S) . 18.6 ± 1.4 12.5 ± 1.6
COD (mg/g wet weight) 213.7 ± 4.2 727.0 ± 4.7
Protein/fat/oil/grease (% of VS) 96.8 ± 0.3 16.4 ± 1 .0
Hemicellulose (% of VS) 0.6 ± 0.3 4.4 ± 1.3
Cellulose (% of VS) 0.8 ± 0.1 62.5 ± 2.5
Lignin (% of VS) 4.1 ± 2.1 13.7 ± 1.2
4
' ,
. '\
, I
'i i
· -1
w I
l:._d

1 J
I l J } J
I \ J l I J
J I
j
As one might expect, the tuna sludge contains a signillcant level of odor, much of which is caused by the presence of volatile fatty acids (VFA). Although the presence of VFAs increases the odor level of the sludge, these organic acids are readily biodegraded to methane in anaerobic bioconversion systems. An analysis of the VFA content in tuna sludge is given in Table 2.
Table 2. VFA Content in Tuna Sludge
Organic Acid
Acetic acid
Propionic acid
iso-Butyric acid
n-Butyric acid
Concentration (millimolar)
12.3 ± 0.5
10.9 ± 0.5
0.6 ± 0.2
1.1 ± 0.2
3.3.2 Priority Metal Analysis of Tuna Sludge and MSW
The presence of priority metals (heavy metals) in the tuna sludge was evaluated utilizing the E P A-approved toxicity characteristic leaching procedure (TCLP) for extraction. Metal concentration was determined by atomic adsorption spectrophotometry. The analysis for both tuna sludge and MSW is detailed in Table 3 .
Table 3. Priority Metal Analysis for Tuna Sludge and MSW Materials
Priority Metal Abbreviation Tuna Sludge* MSW** EPA Umits
Arsenic As 0.2 <0.1 5.0
Barium Ba 1.7 0.31 100.0
Cadmium Cd <0.008 <0.008 1.0
Chromium Cr <0.1 <0.1 5.0
Lead Pb <0.2 <0.2 5.0
Mercury Hg 0.0003 <0.0002 0 .2
Selenium Se <0.15 <0.15 1.0
Silver Ag 0.36 <0.005 5.0
*Analyzed 8/27/91 by Evergreen Analytical, Inc., Wheat Ridge, Colorado **Analyzed 7/15/92 by Analytical, Inc., Golden, Colorado
The results indicate that the levels of priority metals for both tuna sludge and MSW are well below established EPA limits. Therefore, the tuna sludge and MSW do not pose a hazard or health risk and may be disposed of like any ordinary organic waste.
5
3.3.3 Dewatering Potential for Tuna Sludge
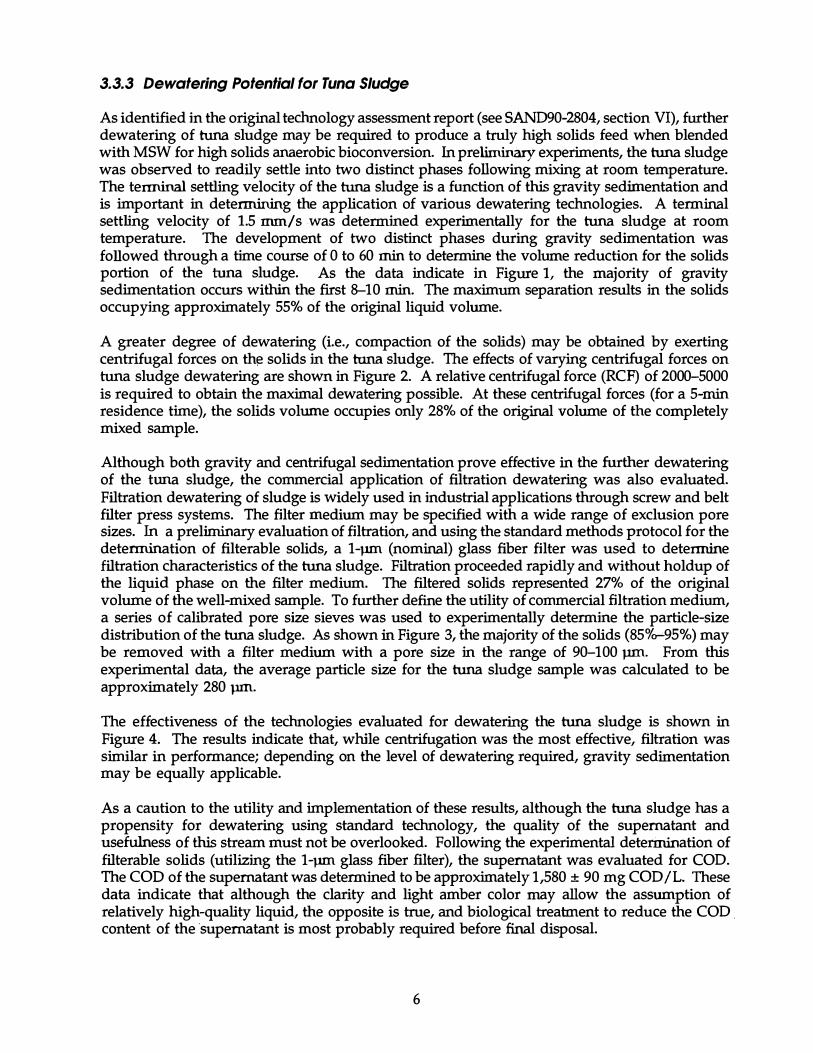
As identified in the original technology assessment report (see SAND90-2804, section VI), further dewatering of tuna sludge may be required to produce a truly high solids feed when blended with MSW for high solids anaerobic bioconversion. In preliminary experiments, the tuna sludge was observed to readily settle into two distinct phases following mixing at room temperature. The terminal settling velocity of the tuna sludge is a function of this gravity sedimentation and is important in determining the application of various dewatering technologies. A terminal settling velocity of 1.5 mm/ s was determined experimentally for the tuna sludge at room temperature. The development of two distinct phases during gravity sedimentation was followed through a time course of 0 to 60 min to determine the volume reduction for the solids portion of the tuna sludge. As the data indicate in Figure 1, the majority of gravity sedimentation occurs within the first 8-10 min. The maximum separation results in the solids occupying approximately 55% of the original liquid volume.
A greater degree of dewatering (i.e., compaction of the solids) may be obtained by exerting centrifugal forces on th� solids in the tuna sludge. The effects of varying centrifugal forces on tuna sludge dewatering are shown in Figure 2. A relative centrifugal force (RCF) of 2000-5000 is required to obtain the maximal dewatering possible. At these centrifugal forces (for a 5-min residence time), the solids volume occupies only 28% of the original volume of the completely mixed sample.
Although both gravity and centrifugal sedimentation prove effective in the further dewatering of the tuna sludge, the commercial application of filtration dewatering was also evaluated. Filtration dewatering of sludge is widely used in industrial applications through screw and belt filter press systems. The filter medium may be specified with a wide range of exclusion pore sizes. In a preliminary evaluation of filtration, and using the standard methods protocol for the determination of filterable solids, a 1-prn. (nominal) glass fiber filter was used to determine filtration characteristics of the tuna sludge. Filtration proceeded rapidly and without holdup of the liquid phase on the filter medium. The filtered solids represented 27% of the original volume of the well-mixed sample. To further define the utility of commercial filtration medium, a series of calibrated pore size sieves was used to experimentally determine the particle-size distribution of the tuna sludge. As shown in Figure 3 , the majority of the solids (85o/o-'-95%) may be removed with a filter medium with a pore size in the range of 90-100 pm. From this experimental data, the average particle size for the tuna sludge sample was calculated to be approximately 280 pm.
The effectiveness of the technologies evaluated for dewatering the tuna sludge is shown in Figure 4. The results indicate that, while centrifugation was the most effective, filtration was similar in performance; depending on the level of dewatering required, gravity sedimentation may be equally applicable.
As a caution to the utility and implementation of these results, although the tuna sludge has a propensity for dewatering using standard technology, the quality of the supernatant and usefulness of this stream must not be overlooked. Following the experimental determination of filterable solids (utilizing the 1-prn. glass fiber filter), the supernatant was evaluated for COD. The COD of the supernatant was determined to be approximately 1,580 ± 90 mg COD /L. These data indicate that although the clarity and light amber color may allow the assumption of relatively high-quality liquid, the opposite is true, and biological treatment to reduce the COD . content of the ·supernatant is most probably required before final disposal.
6
! ,
f -�
c '
' j
' '
) J ) J
I J
_.._ Q) a ::s
-�
. 00 "0 ..... -0 lZl
_.._ Q) a ::s -�
-� ...... � f.+-4 0
� ........, Q) a ::s -� 00
"0 ..... -0
lZl
1
10 20 30 Time (min)
40 50
Figure 1 . Gravity sedimentation: tuna sludge residue
2 4 6 8 10 12 14 16 18 20 Relative Centrifugal Force (RCF x 1 000)
Figure 2. Centrifugal sedimentation: tuna sludge residue
7
60

"'0 Q) > 0 E Q) '-en
"'0 0 en rn -0 -
� 0
100
0 10,000 1,000 100
Sieve pore size (microns)
Figure 3. Particle size distribution: tuna sludge residue
... ---
10
Concentration Factor 4
3
2
1
0 Gravity settling Filtration Centrifugation
Figure 4. Dewatering technology: tuna sludge residue
8
; '
C'\ !
i I ' i
� ! I
' · -
, I ' !
' 1
c--l.
r 1 ' -,
'
n 1
'----

l
J
I I. ( )
4.0 Application of Anaerobic Bioconversion Technology for Codisposal of Tuna Sludge/MSW
4. 1 Objectives
Waste conversion technology for American Samoa should include processes that encompass both waste streams (MSW and tuna sludge); produce a useful fuel to reduce the use of imported fuel; produce by-products that are useful or do not pose disposal problems themselves; and are uncomplicated and stable to operate and maintain. The high solids anaerobic digestion process may be the best overall solution to American Samoa's waste problems.
'
The anaerobic digestion process has been found to be effective in reducing odors, organic content, and further biological activity of many organic waste streams. Its primary use has been in municipal sewage treatment. However, because these waste streams are low in solids content (5%-8%), the reactor design most often employed is the CSTR. Economic evaluations indicate that the high level of water (which acts as a carrier for the solids) drives the costs of the process prohibitively high, in part because of the large reactor vessels required, high heating requirements for large vessels, and high stirring or mixing costs. Research at the National Renewable Energy Laboratory (NREL) has resulted in the development of an improved reactor design that has specific applications for feedstocks or wastes that are initially low in water content (such as MSW). Laboratory-scale reactor systems have been successfully tested on MSW, sewage sludges, and various forms of biomass and agricultural residues. A description of the reactor design and process performance can be found in references 6-10.
In anaerobic biodegradation assessments, the theoretical methane yield for various feedstocks (or wastes) tested is traditionally calculated from the feedstock COD content (8). The level of anaerobic biodegradation is then determined by the ratio of the actual methane yield for a given anaerobic fermentation system to the theoretical methane yield .calculated from the feedstock COD value. This ratio serves as a direct reflection of the organic carbon conversion of the substrate added.
4.2 Biological Methane Potential (BMP) Assessment
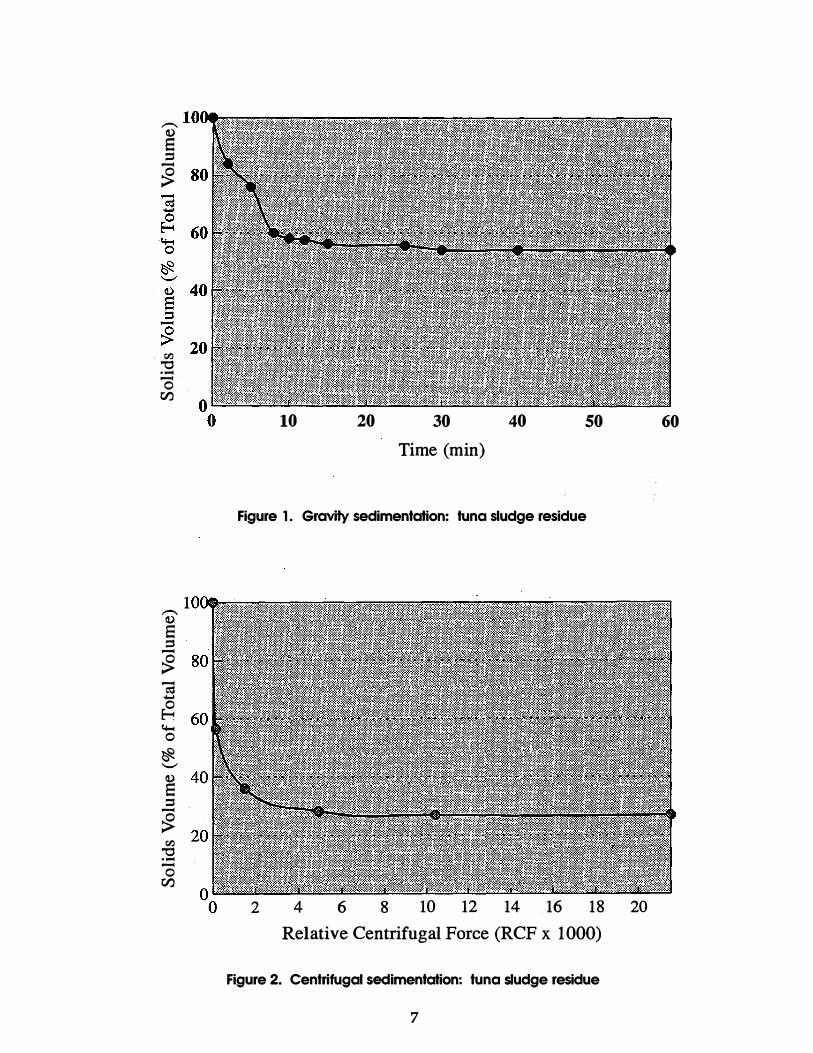
Initial anaerobic digestibility assessments were conducted with the tuna sludge, employing the traditional BMP protocol that uses low solids digester sludge adapted to a MSW feedstock as the biocatalyst. The data, as shown in Figure 5, demonstrate the anaerobic bioconversion of tuna sludge at various feed addition levels for the first 80 days of incubation (the BMP analysis was conducted for a total incubation time of 90 days) .. The data indicate that when the tuna sludge feedstock was added at volumetric loadings greater than 0.5 mL (for this assay protocol), the anaerobic microbial consortium was initially inhibited.
The inhibition of the microbial consortium was transient, lasting from 18 to 28 days, after which active anaerobic biodegradation occurred (denoted by cumulative biogas production above zero). Total methane yields from the BMP90 resulted in an anaerobic bioconversion for the tuna sludge feedstock of 89%-98% of the theoretical yields (as determined by feedstock COD content) for all the organic loadings tested.
After information was gained from the initial BMP assay conducted with the tuna sludge feedstock, a low solids anaerobic digester was operated on a combined feedstock of 30% tuna
9
200 ;J' . 8 160 ,_., Cl) � gf120
. """ �
40��--�--�--��--�--�--��
0 10 20 30 40 50 60 70 80 90 T�me (d)
Figure 5. BMP assay: tuna sludge residue
0 rganic Loading •0.5mL -G--1.0 mL + 1.5 mL -v-2.0 mL
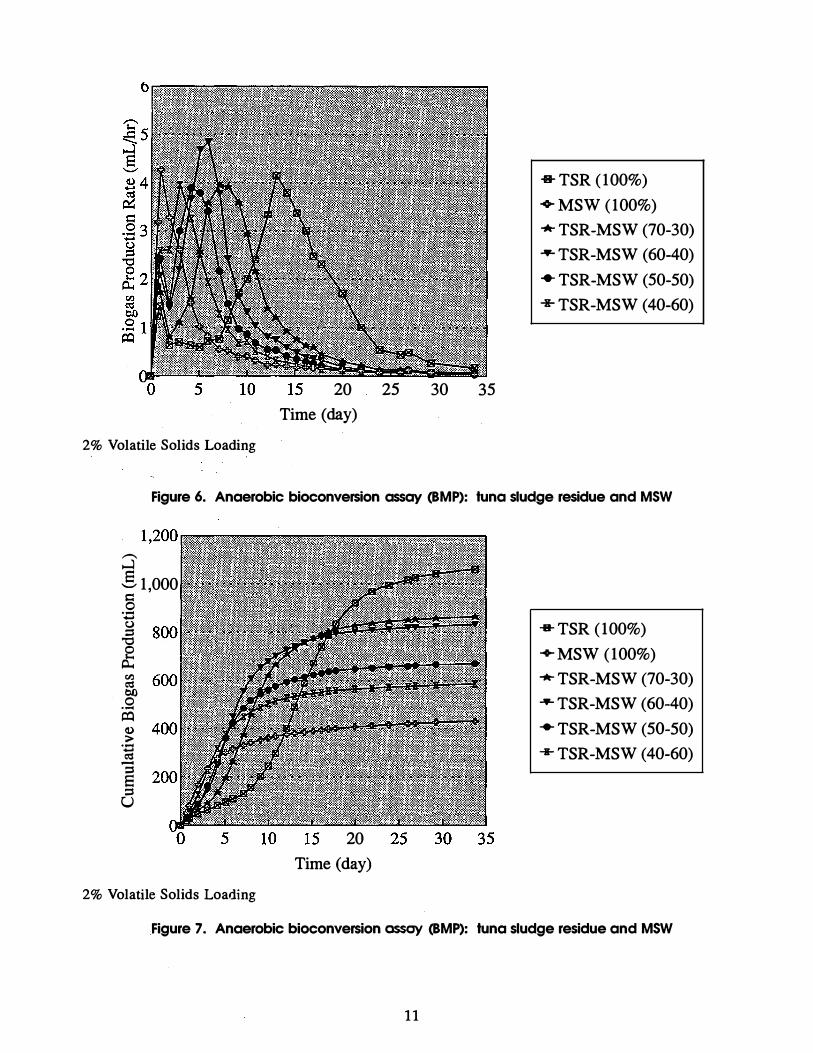
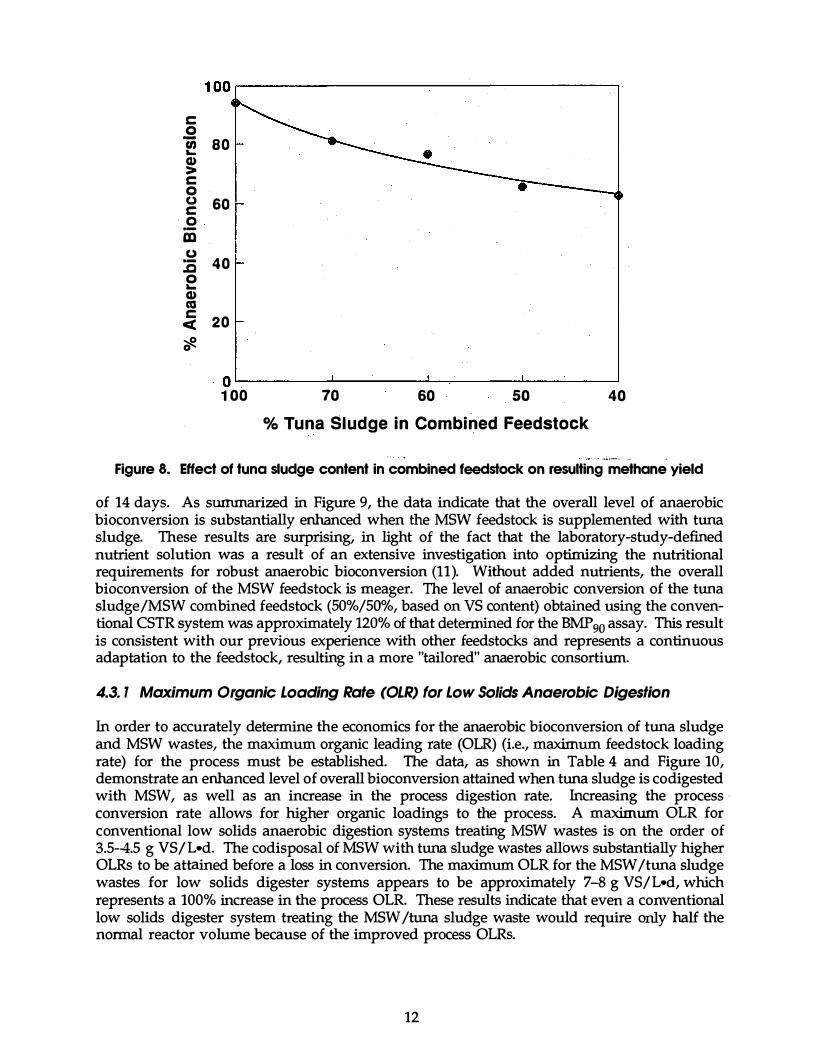
sludge and 70% MSW (based on VS content), in order to adapt the anaerobic consortium to a combined waste. This adapted anaerobic consortium was then utilized in further BMP assays to evaluate the effects of increasing the tuna sludge content of the combined feedstock. The data shown in Figure 6 indicate that the onset of anaerobic biodegradation was most rapid with the addition of the 100% MSW feedstock; as the level of tuna sludge in the combined feedstock was increased, the onset of anaerobic bioconversion was delayed. However, as noted above, the results indicate only a transient inhibition in response to the changing feedstock composition, and, on further incubation, the microbial consortium became adapted, resulting in comparable fermentation rates. In addition, increasing the level of tuna sludge in the feedstock resulted in a greater level of bioconversion, as shown by an increase in the total biogas production (Figure 7). The analysis of the effect of tuna sludge content in the combined feedstock on the resulting methane yield (i.e., compared to the theoretical yield determined from the feedstock COD content) is shown more graphically in Figure 8, at the completion of the 90-day incubation period of the BMP assay. The data indicate that increasing the tuna sludge content of the combined feedstock results in greater overall anaerobic bioconversion for the combined feedstock, based on feedstock COD content.
4.3 Low Solids (CSTR) Digester System Results
The effects of tuna sludge addition to the MSW feedstock on the overall anaerobic bioconversion were also evaluated using conventional laboratory-scale low solids CSTR systems. These digesters were operated at a nominal organic loading rate of 4 g VS/L•d and a retention time
10
' '
I ' J
r 'i: \ I J
: I (_I
! � I . I ' �
-1 �I J -� l J I J
2% Volatile Solids Loading
20 25 Time (day)
30 35
-a- TSR (100%) +MSW (100%) * TSR-MSW (70-30) ..._ TSR-MSW (60-40) + TSR-MSW (50-50) + TSR-MSW ( 40-60)
Figure 6. Anaerobic bioconversion assay (BMP): tuna sludge residue and MSW
\ J J l I 'r
·-·'
..-� 51,000 r::: 0
·-...... c.> ::s '"d
£ en � b.() 0 ·-t:Q <D >
·-...... � -::s e ::s u
] 2% Volatile Solids Loading
20 Time (day)
+TSR (100%) +MSW (100%) * TSR-MSW (70-30) ..._ TSR-MSW (60-40) + TSR-MSW (50-50) +TSR-MSW (40-60)
Figure 7. Anaerobic bioconversion assay (BMP): tuna sludge residue and MSW
11
c 0 u; 80 II.. Q) > c 0 CJ 60 c
· o ·-
m CJ :c 40 0 II.. Q) as � 20 '#.
0�--------�--------�--------�---------J 100 70 60 50 40
%Tuna Sludge in Combined Feedstock .. · . . . ..· · ..... . �.:..--.:. ·� -
Figure 8. Effect of tuna sludge content in combined feedstock on resulting methane yield
of 14 days. As summarized in Figure 9, the data indicate that the overall level of anaerobic bioconversion is substantially enhanced when the MSW feedstock is supplemented with tuna sludge. These results are surprising, in light of the fact that the laboratory-study-defined nutrient solution was a result of an extensive investigation into optimizing . the nutritional requirements for robust anaerobic bioconversion {11 ). Without added nutrients, the overall bioconversion of the MSW feedstock is meager. The level of anaerobic conversion of the tuna sludge/MSW combined feedstock (50%/50%, based on VS content) obtained using the conventional CSTR system was approximately 120% of that determined for the BMP 90 assay. This result is consistent with our previous experience with other feedstocks and represents a continuous adaptation to the feedstock, resulting in a more "tailored" anaerobic consortium.
4.3. 7 Maximum Organic Loading Rate (OLR) for Low Solids Anaerobic Digestion
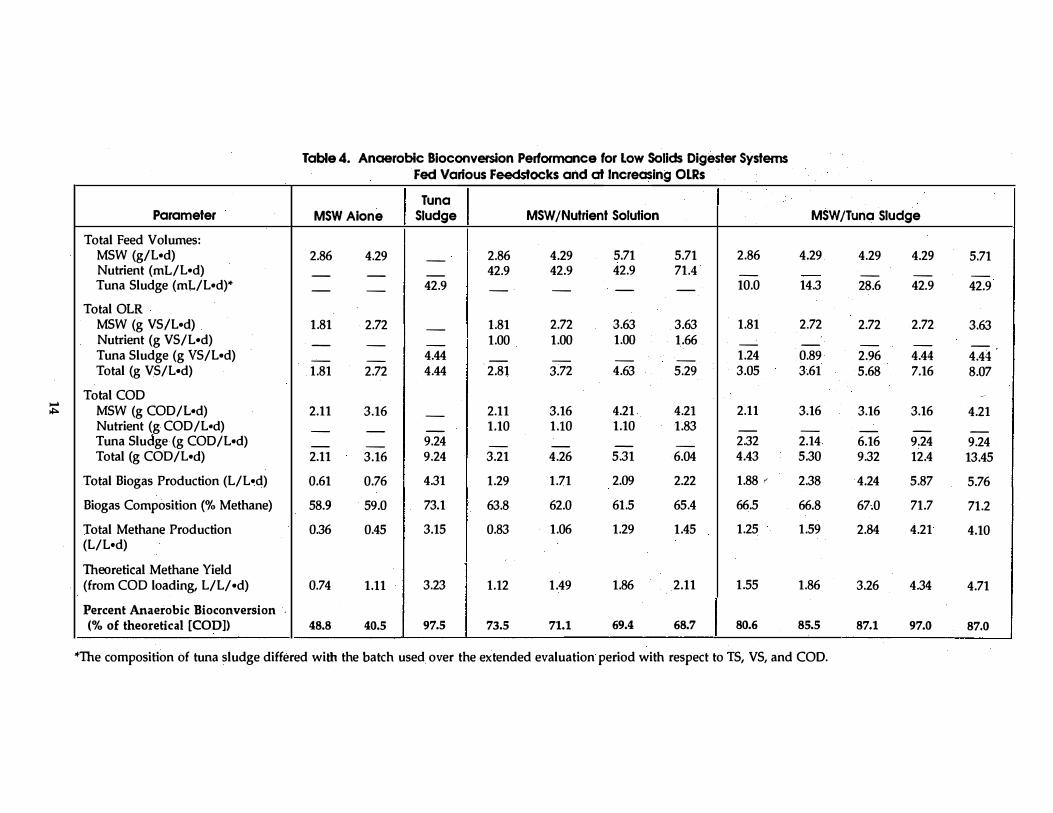
In order to accurately determine the economics for the anaerobic bioconversion of tuna sludge and MSW wastes, the maximum organic leading rate (OLR) (i.e., maximum feedstock loading rate) for the process must be established. The data, as shown in Table 4 and Figure 10, demonstrate an enhanced level of overall bioconversion attained when tuna sludge is codigested with MSW, as well as an increase in the process digestion rate. Increasing the process ·
conversion rate allows for higher organic loadings to the process. A maximum OLR for conventional low solids anaerobic digestion systems treating MSW wastes is on the order of 3.5-4.5 g VS/L•d. The codisposal of MSW with tuna sludge wastes allows substantially higher OLRs to be attained before a loss in conversion. The maximum OLR for the MSW /tuna sludge wastes for low solids digester systems appears to be approximately 7-8 g VS/L•d, which represents a 100% increase in the process OLR. These results indicate that even a conventional low solids digester system treating the MSW /tuna sludge waste would require only half the normal reactor volume because of the improved process OLRs.
12
ff '\
I ,
I ' '
"' l
I i
.... _ __/
' I
' '
>.._ , ••

-l �, j l J
.. , J ) l
\ J -] l l J
I ) )
j l
1:: 0 ·� Cl.) � Q) > 1:: 0
u � 1:: Q) u � Q) �
100
80
60
40
20
0 MSW Alone MSW/Nutrient Soln
Feedstock MSW {funa Sludge
Figure 9. Anaerobic bioconversion: MSW and tuna processing waste
100
c 0 ·m 80 ICD > c 0 0 60 0
:.0 e Q) 40 0 c <( � 20
0 MSW alone e Tuna sludge alone '1 MSW/nutrient soln. 'Y MSW/tuna sludge
o�--L---�--�--�--�--�--�--�--�--� 0 2 3 4 5 6 7 8 9 10
Loading rate (gVS/Ld) Figure 1 0. Anaerobic bioconversion for low solids digester systems Ot various OLRs
13
.... ""'
]
Parameter
Total Feed Volumes: MSW (g/L•d) Nutrient (mL/L•d) Tuna Sludge (mL/L•d)*
Total OLR MSW (g VS/L•d) Nutrient (g VS/L•d) Tuna Sludge (g VS/L•d) Total (g VS/L•d)
Total COD MSW (g COD /L•d) Nutrient (g COD /L•d) Tuna Sludge (g COD /L•d) Total (g COD/L•d)
Total Biogas Production (L/L•d)
Biogas Composition (% Methane)
Total Methane Production (L/L•d)
Theoretical Methane Yield (from COD loading, L/L/•d)
Percent Anaerobic Bioconversion . (% of theoretical [COD])
Table 4. Anaerobic Bioconversion Performance for Low Solids Digester Systems Fed Various Feedstocks and at Increasing OLRs
Tuna MSWAione Sludge MSW/Nutrient Solution
2.86 4.29 - 2.86 4.29 5.71 5.71 2.86
- - - 42.9 42.9 42.9 71.4 -- - 42.9 - - - - 10.0
1.81 2.72 - 1.81 2.72 3.63 3.63 1.81
- - - 1.00 1.00 1.00 1.66 -- - 4.44 - - - - 1.24
1.81 2.72 4.44 2.81 3.72 4.63 5.29 3.05
2.11 3.16 - 2.11 3.16 4.21 4.21 2.11
- - - 1.10 1.10 1.10 1.83 -- - 9.24 - - - - 2.32
2.11 3.16 9.24 3.21 4.26 5.31 6.04 4.43
0.61 0.76 4.31 1.29 1.71 2.09 2.22 1.88 ,-
58.9 59.0 73.1 63.8 62.0 61.5 65.4 66.5
0.36 0.45 3.15 0.83 1.06 1.29 1.45 1.25
0.74 1.11 3.23 1.12 1.49 1.86 2.11 1.55
48.8 40.5 97.5 73.5 71.1 69.4 68.7 80.6 ----- ·-- -·------
MSW /Tuna Sludge
4.29 4.29 4.29
-.- - -14.3 28.6 42.9
2.72 2.72 2.72
- - -0.89 2.96 4.44
3.61 5.68 7.16
3.16 3.16 3.16
- - -2.14 6.16 9.24
5.30 9.32 12.4
2.38 4.24 5.87
66.8 67.0 71.7
1.59 2.84 4.21
1.86 3.26 4.34
85.5 87.1 97.0
*The composition of tuna sludge differed with the batch used over the extended evaluation period with respect to TS, VS, and COD.
r' ' r ( _] ,.··-,,-__ i (
5.71
-42.9
3.63
-4.44
8.07
--4.21 I -9.24
13.45
5.76
71.2
4.10
4.71
87.0

.l
-� l
I J
4.3.2 Foam Limitation for Low Solids Digestion
Although further increases in the process loading rates did not result in a reduced level of anaerobic bioconversion, the low solids systems were unstable because of foam production. The production of foam during anaerobic fermentation at elevated process loading rates is a result of the high sludge solids levels (8%-9%) and vigorous biogas production. Foam results when sludge solids become entrapped in the biogas produced. With small laboratory-scale systems, this foam may plug gas ports resulting in elevated reactor head pressures and possible vessel failure. Therefore, because of the production of foam, the low solids digester systems are limited to OLRs of 7-8 g VS/L•d for safe operation.
4.4 High Solids Anaerobic Digestion System Results
As discussed above, the advantages of high solids anaerobic digestion includes improved process economics through smaller reactor sizing, lower heating and mixing requirements, and the reduction or elimination of process water treatment. The laboratory-scale (20-L) high solids digesters used for experimentation were previously adapted to a MSW feedstock. The adaptation to the tuna sludge/MSW feedstock was facilitated by reducing the process OLR. Although the adaptation to the new feedstock was slow, after a 2-month period of adjustment, the fermentation became robust and stable. Process stability is denoted by relatively high sludge pH values (i.e., 7.6-8.2) and low VFA pools.
Initial fermentation data for the extent of anaerobic bioconversion were similar to those obtained from the low solids anaerobic digester systems.
4.4.1 Maximum OLR for High Solids Anaerobic Digestion
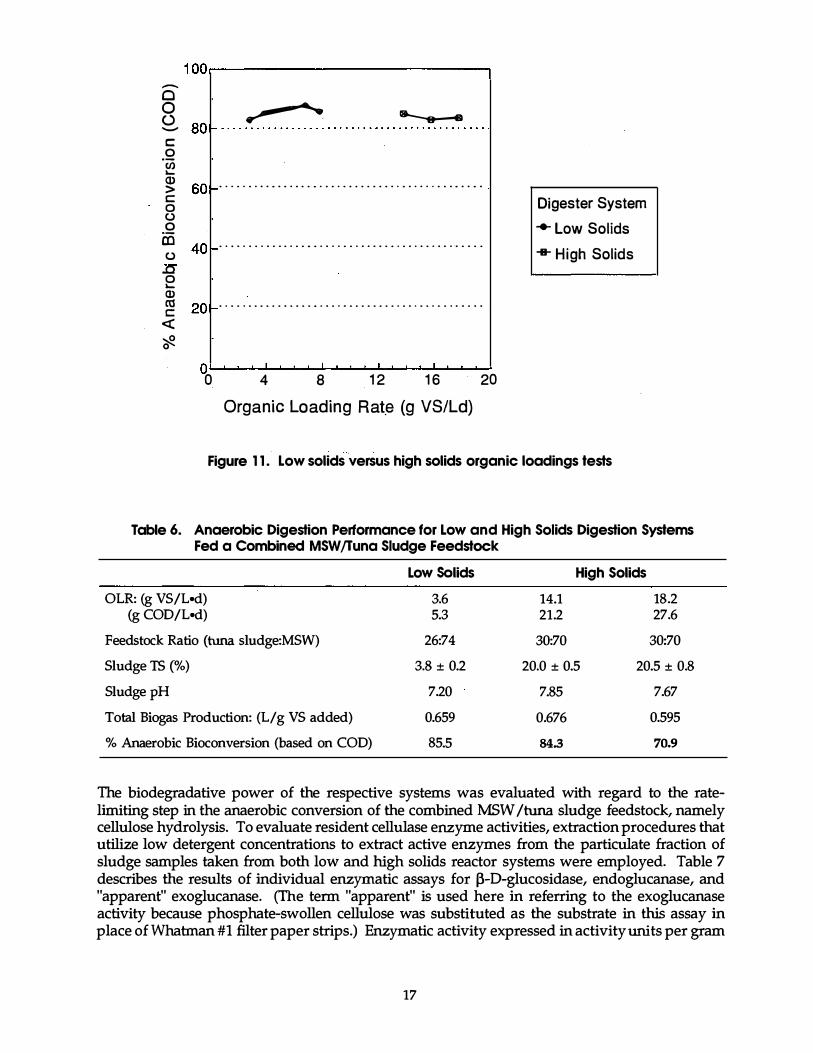
After the initial adaptation and evaluation of fermentation performance, research to identify the maximum OLR for the high solids process began. The adaptation of the high solids system to increasing OLRs requires a longer time period than a comparable low solids system before steady state data become available. Therefore, data identifying the maximum OLR for the high solids process are incomplete at this time. Data gathered to date are detailed in Table 5 and indicate that at organic loadings of 14-18 g VS/L•d for the tuna sludge/MSW feedstock, near complete bioconversion is obtained. These data are compared in Figure 11 to the experimentally derived data for the conventional low solids process (CSTR). The data indicate that at the present high solids organic loadings tested, the high solids system may be loaded at 2-3 times the rate of the low solids system. Additionally, when operated at 32%-35% sludge solids, the high solids reactor system would be approximately 10%-15% of the size of a comparable low solids CSTR system (operated at 3%-5% sludge solids).
4.4.2 Foam Limitation for High Solids Digestion
High solids digester systems are unaffected by the consideration of foam as the low level of free water eliminates foam production. However, although foam production is not a problem in the operation of the high solids process, this depends on the sludge solids level. In order to maintain a high sludge solids level, the feedstock materials must be considerably higher in solids. For example, a feedstock solids content of 60%-75% will result in sludge solids levels of
15

TableS. Anaerobic Bioconversion Performance for Low Solids Digester Systems Fed Various Feedstocks and at Increasing OLRs
Parameter Units Tuna Sludge/MSW Feedstock
Total Feed Volumes MSW (g/L•d) 20 20 20 Nutrient (mL/L•d) Tuna Sludge (mL/L•d)* 11 .6 35 60
Total OLR MSW (g VS/L•d) 12.7 12.7 12.7 Nutrient (g VS/L•d) Tuna Sludge (g VS/L•d) 1.2 3.6 6.2 Total (g VS/L•d) 13.9 16.3 18.9
Total COD MSW (g COD/L•d) 14.7 14.7 14.7 Nutrient (g COD/L•d) Tuna Sludge (g COD/L•d) 2.5 7.5 12.9 Total (g COD/L•d) 17.2 22.2 27.6
Total Biogas Production (L/L•d) 8.4 10.0 .11.9
Biogas Composition (% Methane) 60 64 67
Total Methane Production (L/L•d) 5.04 6.40 7.97
Theoretical Methane Yield (from COD loading) (L/L•d) 6.02 7.77 9.66
Percent Anaerobic Bioconversion (% of theoretical [COD]) 83.7 82.4 82.5
*The composition of tuna sludge differed with the batch used over the extended evaluation period with respect to TS, VS, and COD.
30%-35% (the practical limit for the microbial consortium). When "wet" feedstocks are added (wet is defined here as a feedstock with a solids content of <30%), the solids level within the reactor system may be significantly lower than the optimum level. In fact, when a significant level of wet feedstock is added, the sludge solids level may fall below 20%, where foam production may again cause operational problems and limit the fermentation.
4.5 Comparative Analysis of Solids Effects on Anaerobic "Biodegradative Power"
Both low and high solids digestion systems were evaluated with respect to fermentation performance (Table 6) and resident cellulase enzyme activities (Table 7, using a series of detergent extractions developed by Adney, Rivard, Grohmann, and Himmel [1989] Biotech. Appl. Biochem. 11, 387). Results indicate that in general, both low and high solids digestion systems performed appropriately at their respective OLRs (note that the high solids system was
·loaded at 4 to 5 times the load of the low solids system). Bioconversion, as determined from the theoretical values for biogas calculated from feedstock COD content, indicates a 71%-85% eonversion for all systems.
16
� �
I. --�
� 1 I
t "!
� '
:, j r 1
�--
r-1 ' I
r 1
" }
" ) !
l l J I J
\ __,
I J
1 00 r-------------------------� -Q 0 .....__........ � £ 80 f- · · · · · · · · · · · · · · · · · · · · · · · · · · · · · · · · · · · · · · · · · · · · ·
c:: .Q en "-� 60 r- . . . . . . . . . . . . . . . . . . . . . . . . . . . . . . . . . . . . . . . . . . . . . c:: 0 0
.Q co 0
.0 0 "-Q)
40 r- . . . . . . . . . . . . . . . . . . . . . . . . . . . . . . . . . . . . . . . . . . . . .
� 2Q r- . . . . . . . . . . . . . . . . . . . . . . . . . . . . . . . . . . . . . . . . . . . . .
<( � 0
a ����·���·���·����·�� 0 4 8 1 2 1 6 20
Organic Loading Rat� (g VS/Ld)
Digester System -e- Low Solids + High Solids
Figure 1 1 . Low solids versus high solids organic loadings tests
Table 6. Anaerobic Digestion Performance for Low and High Solids Digestion Systems Fed a Combined MSW /Tuna Sludge Feedstock
Low Solids High Solids
OLR: (g VS/L•d) 3.6 14.1 18.2 (g COD/L•d) 5.3 21.2 27.6
Feedstock Ratio (tuna sludge:MSW) 26:74 30:70 30:70
Sludge TS (%) 3.8 ± 0.2 20.0 ± 0.5 20.5 ± 0.8
Sludge pH 7.20 7.85 7.67
Total Biogas Production: (L/ g VS added) 0.659 0.676 0.595
% Anaerobic Bioconversion (based on COD) 85.5 84.3 70.9
The biodegradative power of the respective systems was evaluated with regard to the ratelimiting step in the anaerobic conversion of the combined MSW /tuna sludge feedstock, namely cellulose hydrolysis. To evaluate resident cellulase enzyme activities, extraction procedures that utilize low detergent concentrations to extract active enzymes from the particulate fraction of sludge samples taken from both low and high solids reactor systems were employed. Table 7 describes the results of individual enzymatic assays for !3-D-glucosidase, endoglucanase, and "apparent" exoglucanase. (The term "apparent" is used here in referring to the exoglucanase activity because phosphate-swollen cellulose was substituted as the substrate in this assay in place of Whatman #1 filter paper strips.) Enzymatic activity expressed in activity units per gram
17
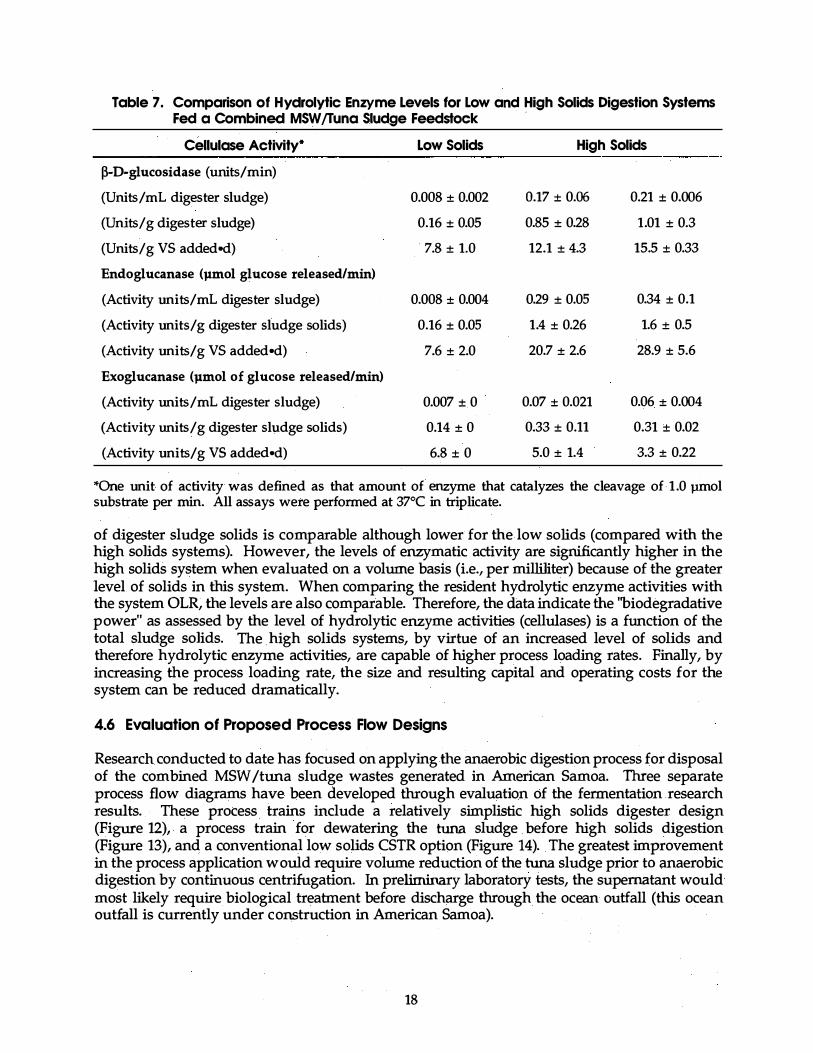
Table 7. Comparison of Hydrolytic Enzyme Levels for Low and High Solids Digestion Systems Fed a Combined MSW /Tuna Sludge Feedstock
·
Cellulase Activity* Low Solids High Solids
�-D-glucosidase (units/min)
(Units/mL digester sludge) 0.008 ± 0.002 0.17 ± 0.06 0.21 ± 0.006
(Units/g digester sludge) 0.16 ± 0.05 0.85 ± 0.28 1.01 ± 0.3
(Units/g VS added•d) 7.8 ± 1.0 12.1 ± 4.3 15.5 ± 0.33
Endoglucanase (pmol glucose released/min)
(Activity units/mL digester sludge) 0.008 ± 0.004 0.29 ± 0.05 0.34 ± 0.1
(Activity units/g digester sludge solids) 0.16 ± 0.05 1.4 ± 0.26 1.6 ± 0.5
(Activity units/g VS added•d) 7.6 ± 2.0 20.7 ± 2.6 28.9 ± 5.6
Exoglucanase (pmol of glucose released/min)
(Activity units/mL digester sludge) 0.007 ± 0 0.07 ± 0.021 0.06 ± 0.004
(Activity units/g digester sludge solids) 0.14 ± 0 0.33 ± 0.11 0.31 ± 0.02
(Activity units/g VS added•d) 6.8 ± 0 5.0 ± 1.4 3.3 ± 0.22
*One unit of activity was defined as that amount of enzyme that catalyzes the cleavage of 1 .0 pmol substrate per min. All assays were performed at 37°C in triplicate.
of digester sludge solids is comparable although lower for the low solids (compared with the high solids systems). However, the levels of enzymatic activity are significantly higher in the high solids system when evaluated on a volume basis (i.e., per milliliter) because of the greater level of solids in this system. When comparing the resident hydrolytic enzyme activities with the system OLR, the levels are also comparable. Therefore, the data indicate the "biodegradative power" as assessed by the level of hydrolytic enzyme ac.tivities (cellulases) is a function of the total sludge solids. The . high solids systems, by virtue of an increased level of solids and therefore hydrolytic enzyme activities, are capable of higher process loading rates. Finally, by increasing the process loading rate, the size and resulting capital and operating costs for the system can be reduced dramatically.
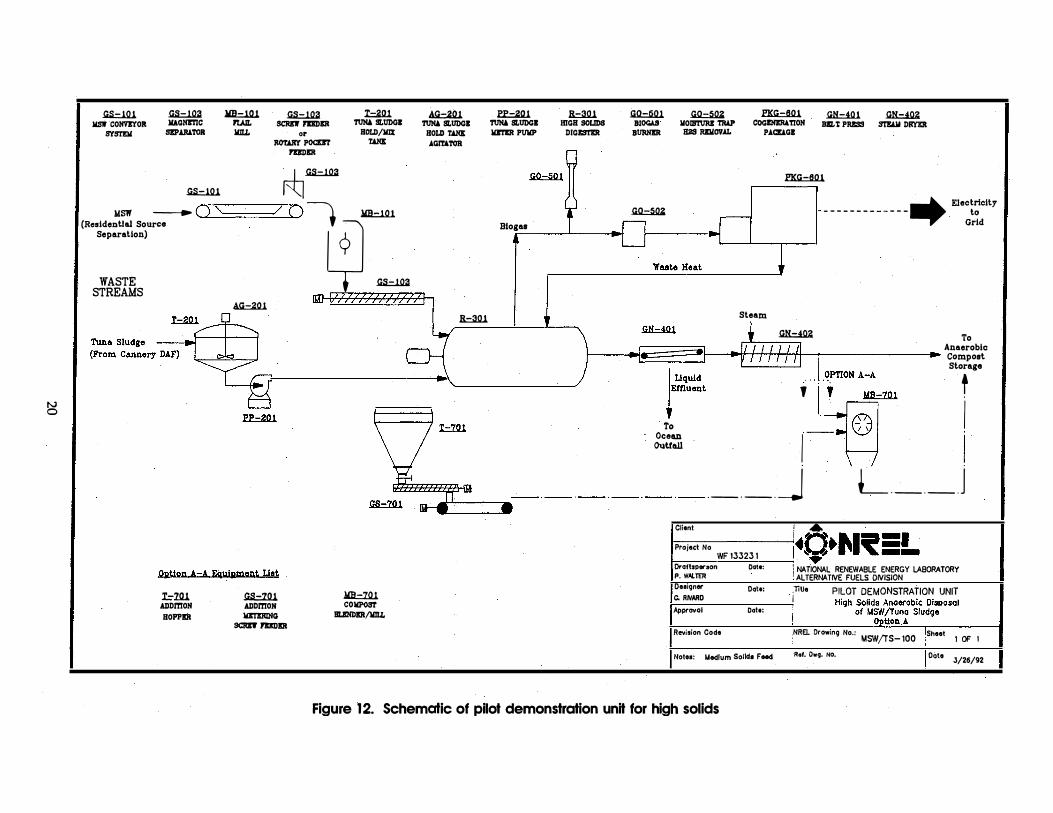
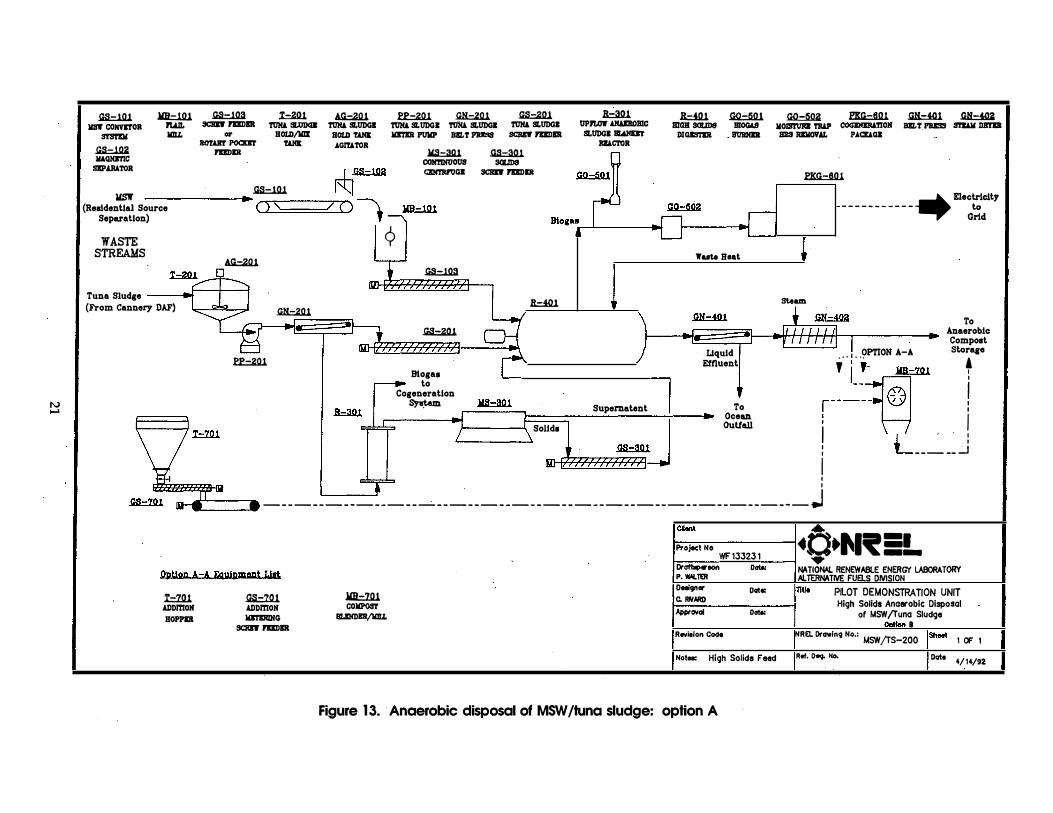
4.6 Evaluation of Proposed Process Flow Designs
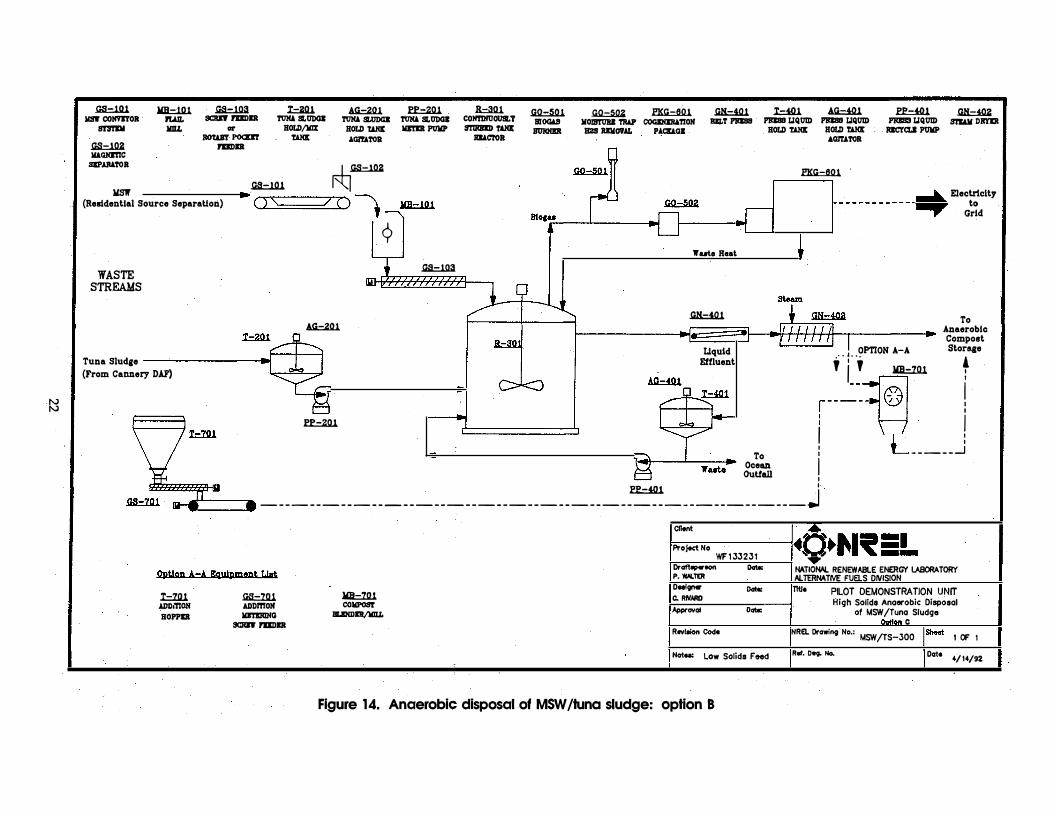
Research conducted to date has focused on applying the anaerobic digestion process for disposal of the combined MSW /tuna sludge wastes generated in American Samoa. Three separate process flow diagrams have been developed through evaluation of the fermentation research results. These process trains include a relatively simplistic high solids digester design (Figure 12), a process train for dewatering the tuna sludge before high solids digestion (Figure 13), and a conventional low solids CSTR option (Figure 14). The greatest improvement in the process application would require volume reduction of the tuna sludge prior to anaerobic digestion by continuous centrifugation. In preliminary laboratory tests, the supernatant would most likely require biological treatment before discharge through the ocean outfall (this ocean outfall is currently under construction in American Samoa).
18
< '
I. )
' . . ' I
' ' '• '
'I I \._j
I i ' J
' ' � I
', I
" l
1 J
J } \ I
4.6.1 Economic and Technical Evaluation of Proposed Process Flow Designs
The principal objective is to rank the three proposed process flow designs for site implementation and subsequent research efforts. Through a subcontract with an independent engineering firm, a preliminary economic analysis will be performed on all three proposed process designs. The analysis includes process mass flow evaluation based on full-scale implementation in American Samoa. Economic information as to local labor rates and remote site installation costs will be taken into account in the economic evaluation. A detailed report, including engineering process flow diagrams and mass flow information, with detailed cost estimates and assumptions, will be prepared. This information will be used to develop an objective ranking of the three proposed process flow designs as a basis for determining future efforts.
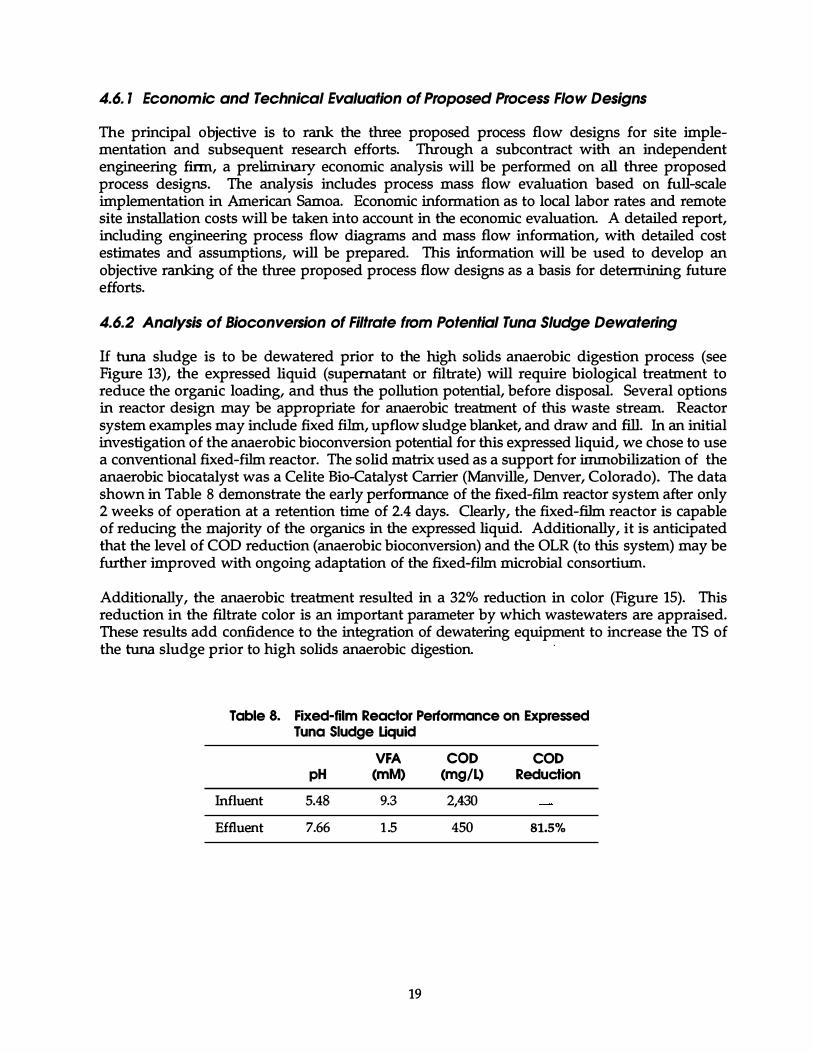
4.6.2 Analysis of Bioconversion of Filtrate from Potential Tuna Sludge Dewatering
If tuna sludge is to be dewatered prior to the high solids anaerobic digestion process (see Figure 13), the expressed liquid (supernatant or filtrate) will require biological treatment to reduce the organic loading, and thus the pollution potential, before disposal. Several options in reactor design may be appropriate for anaerobic treatment of this waste stream. Reactor system examples may include fixed film, upflow sludge blanket, and draw and fill. In an initial investigation of the anaerobic bioconversion potential for this expressed liquid, we chose to use a conventional fixed-film reactor. The solid matrix used as a support for immobilization of the anaerobic biocatalyst was a Celite Bio-Catalyst Carrier (Manville, Denver, Colorado). The data shown in Table 8 demonstrate the early performance of the fixed-film reactor system after only 2 weeks of operation at a retention time of 2.4 days. Clearly, the fixed-film reactor is capable of reducing the majority of the organics in the expressed liquid. Additionally, it is anticipated that the level of COD reduction (anaerobic bioconversion) and the OLR (to this system) may be further improved with ongoing adaptation of the fixed-film microbial consortium.
Additionally, the anaerobic treatment resulted in a 32% reduction in color (Figure 15). This reduction in the filtrate color is an important parameter by which wastewaters are appraised. These results add confidence to the integration of dewatering equipment to increase the TS of the tuna sludge prior to high solids anaerobic digestion.
·
Table 8. Fixed-film Reactor Performance on Expressed Tuna Sludge Uquid
VFA COD COD pH (mM) (mg/L) Reduction
Influent 5.48 9.3 2,430 Effluent 7.66 1 .5 450 81.5%
19
�
c l
� IIS1r CONVIYOR S'lSTIII
� llAGNmC SEPARATOR
�
lm=.ill l"LAAL liiiL
� SCRD' mmER
or IIO'WIY POCKIT
PUDER
�� Separation) 9
.I::2.Q1 TUIQ 9L1JDGI
HOLD/MIX 'Wilt
WASTE �
AG.:=a.Q1 TUIQ SLUDCI
HOLD 'Wilt AGITATOR
(Reside:� Sour� ( ) '-() ·�lm=.ill STREAMS liD I ( ( ( < ( < (( ( ( < < < h
AG.:=a.Q1 ) j ) ) ) ) J /77 ) ) )
Ef=.2.Q.1
Qptlon A-A Equipment tJat I=!QJ. ADDmON
HOPPER
.GS.=1Q.1 ADDmOH lllmlllNG
SCI!D' PUDER
� COIIPOS'I' BLI!IDER/IIIU.
B::W
Ef=.2.Q.1 TUIQ SLUDCI IIITIII PUIIP
Btogas .--
B::W IDGH SOLIDS
DIGISTER
.!ill::Jill BIOGAS BUR!IIR
�
� IIOIB'I'tiRI TlW'
H2S RIIIOVAL
� COGINIRAT!ON
PACKAGI
� BIL'J: PRISS
� ----,
� STI.lll DRYXII
[}-_ - - - - - - - - - - - -.. Elec��city
Grid
Steam
� + � To Anaerobic ���=�-_,�titiftl::::-----., Compost
Storage
t 1�-:, ' I�· � I + _ _ · © I ��� I J.
_ _ _ _ j L _ _ _ _ _
Client . .. Project No ;·o·���=-WF 13323 1 .... Droftsperoon Date: i NATIONAL RENEWABLE ENERGY LABORATORY P. W.II.TER ! ALTERNATIVE FUELS DIVISION Deeigner Dote: :nue PILOT DEMONSTRATION UNIT C. RIII.IRD i Approvol Dolo:
Revision Code
Notee: Medium Soli de F Md
.NREL Dr owing No.: MSW fTS- 100
Ref. Owg. No.
Sheet 1 OF 1
Dote J/26/92
Figure 12. Schematic of pilot demonstration unit for high solids
r· I r· ·�, I J r J ' l .. �-
_ ___[___
N ......
.Gll=.llU 11ft COIIRI'OR
S'f81'lll
llll.:::1DJ. rwL IIIU.
'"'-::-�-· ·�
.G3=.ll!a SCIIft I'IIDIR
... IIOTAR'f POCDT
rDDIR
.T.:W � TUII4 SL1IDGI TUII4 SLUDGI Hotll/m Hotll 'WII:
'WII: AGITATOR
U=W � TUII4 SLUDGI 'niili SLUDGI Kl'l'lll PtJliP BILT PIIISS
.!iS.=2lU TUII4 SLUDGI SCIID I'IIDIR
.!IS.:.1.Q2 IIAGHITIC
DPAJIATOR .-h.!IS.:.l.Q2
lm=.alU COIITIIIUOUS CIN'I'Rl'tJOB
.Ga:aQ1 SOIJDS
SCIIft I'IIDIR
llS1r .Gll=.llU I "-.I
(Residential Source (""�)�.__-----,/-(,....) \ Separation) f WASTE
STREAMS �
Tuna Sludge ..r I I (From Cannery DAF)
U=W
� '---�
¢ llll.:::1DJ.
.G3=.ll!a
.!iS.=2lU
Blogaa to
Cogeneration �
B::ru
�
Solids
.R::m1 UPrtow !II.UIIOmc
SLUDGI IILlNDr !III.C'I'OR
Supernatant
R=iQ1 mas sotms
DIGIS'I'IR
Ii2:M1 BIOCAS
_ IMIIIIIl
Wute Heat
�
Liquid Effluent
To Ocean OuUall
-�-� ____ ...__._)
� fXli::.6.0.1 .G1i=!lU .G.H::iQa KOilii'UIII TIW' COGmiBRI.TIOH BILT P111SS SDAK llR'liR B2S RIKOVAL PACKAOB
.
fXli::.6.0.1 --,
steam
- - - - - - - - - - -· Ele:�:ty
To Anaerobic Compost
OPTION A-A Storage • • • 1 • • •
, L�j©]-- r ,----- � i ! L _ _ _ · __ j I I I
.... !' - _ _ _ _ _ _ _ _ _ _ _ _ _ _ _ _ _ _ _ _ _ _ _ _ _ _ _ _ _ _ _ _ _ _ _ _ _ _ _ _ _ _ _ _ _ _ _ _ _ _ _ _ J
<mUon A-A EqJLipment List
I=Za1 ADDmOH BOPPIR
� ADDmOH llln'KRIIIG
SCRI1r I'IIDIR
lm::1QJ. COKPOST
IILDIDIR/KIU.
Client . -
Project No •O·��� :!.. WF 13323 1 • Oraftlptroon Dato: �TIOtW. RENEWABLE ENERG!' LABORATORY P. Wli.TeR AI.TER�TIVE FUas DMSION Deoign• oato: rU• PILOT DEMONSTRATION UNIT c. RIVARD High Solids Anaerobic Disposal Apptovol Dato: of MSW/Tuna Sludge
Revision Code
Not..: High Solids F eod
8 NRa Drawin9 No.:
MSW/TS-200 'Sheet 1 OF 1
Ref, Ower No. Date 4/14/92
Figure 13. Anaerobic disposal of MSW /tuna sludge: option A
I ..____..
�
F "1
.Ga::1Q1 lllllr CONRYOR srmDol � IUGHfttC
SIP AliA TOR
llSlf
lm=;.W. rwL KILL .!ia:1l13.
SCIID PIIDIR
or RO'WIY POCDT PIIDIR
I=iQJ. 'I'OK.t. SLIIDGI
BOLD/1m 'Will: .M1::ZQ1 �
'I'OK.t. Sl.llDCm 'I'OK.t. SLIIDGI BOLD 'Will: IIITIR P11WP .\GITATOil
.. �� .Ga::1Q1 (Residential Source Separation) () '\ () --. lm=1D.1
WASTE STREAMS
.M1::ZQ1
Tuna Sludge � I J (From Cannery DAF)
�
9 .!ia:1l13.
.B::aQ1 COIITI!IUOUSLT S'I'IRIIID T.uut
RU.CTO!l
� BIOG.\8
BORIIIIl
� � IIOIBTt1lll TRAP COGIHIRlTIOH B2S III(OV.&L P.\CltlOI
Btoau • -..! •
� 1=JlU Aa=ru BILT PRIS8 PRIS8 IJQOID PRIS8 IJQOID BOLD 'Will: BOLD 'Will:
.\Gl'UTOil
� ----,
fE=ID � PR1S8 IJQOID STI.U( DRYIR RIC'Ca.J P11WP
- - - - - - - - - - - � Elec�clty
..,.. Grid
Wute Reet
�
� -- =-
Uqutd Effluent
Yaete To
Ocean OuUall
steam To
Anaerobic Com poet
OPTION A-A storage .· · • · · · i ' i ' � : --j@l I
�----- � i l L _ _ _ _ _ j I I
fE=ID I ...,ll - _ _ _ _ _ _ _ _ _ _ _ _ _ _ _ _ _ _ _ _ _ _ _ _ _ _ _ _ _ _ _ _ _ _ _ _ _ _ _ _ _ _ _ _ _ _ _ _ _ _ _ _ J
F I 1 r
OJ!tlgn A -A Equipment IJat
I=Za1 .lDDI'TIOH HOPPIR
r
.Ga=7lU .\DDMOH IIITIRIHG
9CRII' rDDIR
lm=7.!U COIIPOST
IILBIIDIR/IIIU.
Client .. I Project No 1•0• .. 1·-=-· WF133231 ..... ., ' Dr�- Dot.: p, WAI.ltR Deei91MF Dot.: C. Rr.'NIIl
l.pp<<Nol D-
Rovlalon Code
Nat..: Low Solids F oed
W.TIOJIW. RENEWABLE ENERGY LABORATORY ALTERNATIVE FUELS DIVISION Title PILOT DEMONSTRATION UNIT
High Solids Anaerobic Disposal of MSW/funa Sludge
1011 c NREI. Drawi119 No.:
MSW/TS-300 JSheet 1 OF 1
Rt!l. DW9o No. Date 4/14/92
Figure 14. Anaerobic disposal of MSW /tuna sludge: option B
r I_ r- _·J

l J
I J
j
l \ /• .J
I l
I -j
. • • . . . \ I >. sm• B1 -ro0 .3tlM TO 25e .rat!M INTERVAL tiME 3090 MIN
ABS Gf- 1 -'-f'?---DAT£ _________ _
PEAK P tti< I
"' . oe1 · · 1 �---L----'----'----L---L----'-----'----'----'�� �co -- - .
/' \-? ,... � .J u. 2 H
'-../ . � 2<;14·. 7St_§ 1-.�M�-31\ '$;3:;!;;:tt�T"f��--
'
I . � '---L----''----�--''--L--.I. __ _ _.____ L __ L_
23
. oo·--.n -
' ;t ' , . J

4. 7 Residue Evaluations for Utility as a Soil Amendment
Although agriculture is not a major industry in American Samoa, a demand still exists for fertilizers and ground cover materials for residential use (personal communication, Land Grant). The American Samoa wastewater treatment works makes available partially digested municipal sewage solids that are free to the public for residential landscaping purposes. Additionally, on nearby islands (including Western Samoa), substantial agricultural industries do exist, representing a market for fertilizers or composted (ground cover) materials.
Local demand for the process residue (anaerobic compost) is paramount to the effective application of the high solids anaerobic treatment technology for MSW I tuna sludge wastes. However, the local market must be carefully evaluated, especially with regard to the varied uses. In addition to ordinary use of the anaerobic compost in residential and farm applications, this material may be used as fill to increase level land production. Furthermore, the most pressing need. for top soil is in the operation of the island's landfill. It is not anticipated that landfill use will completely end with the application of the anaerobic disposal technology for MSW. Rather, it is expected that limited use of the landfill will continue into the future. Therefore, there will be an ongoing need for landfill cover materials in order to maintain sanitary operation and prevent infestations of insects and rodents. The application of cover materials to the landfill also improves the overall compaction and stability to disposal vehicle traffic.
Several studies designed to identify the potential utility and market for the process residue are under way through a subcontract with Colorado State University's Department of Agronomy. ·
These studies evaluate the local (American Samoa) market for utilization of the anaerobic compost produced by focusing on relevant residue processing considerations and analysis, as well as evaluations of American Samoan soil. ReqUirements for dewatering/ drying of the anaerobic compost to approximately 75% solids for ease of handling and transportation will be evaluated. Additionally, the quality of the compost produced will be determined through extensive chemical analyses, including evaluation of potential heavy metal contamination (as identified by U.S. EPA Resource Conservation and Recovery Act [RCRA] requirements). Research will determine the fertilizer quality of the anaerobic compost through standard chemical assessments for components such as nitrogen, potassium, phosphate, and sulfur. Local (American Samoa) soil will be analyzed to ascertain desirable attributes of a potential compost for use as a soil amendment. Finally, plant growth studies, involving the use of varying ratios of anaerobic residue to American Samoan soil, will be conducted with representative plants of agricultural importance to this area.
4.8 Pilot-scale High Solids System Development for American Samoa
Aspects of pilot-scale development were evaluated, including site-specific application of this technology to this remote island location. Information on the potential pilot-scale system configuration, equipment selection, and detailed cost breakdowns was provided for inclusion in a proposal from the government of American Samoa for this waste-to.:energy (WTE) technology development. The conceptual site plan (Figure 16) and the ability to share data from this remote location (Figure 17) were also evaluated.
24
1.:. __ 1
• j
il. _ ..

·--.L.___ , __ _
�
100'
Utilities
Anaerobic Compost Holding Area
�
Cogeneration Package
Control
Room
Biogas - - - - -1 - - - , I
I I I I
I I I I I I I I I I
,/ l, , " ' ' , ' , ' / '
'
Tipping Floor� too•·---------
D MSW
�' '
·---· t____j .._______j c____]
<:;::::D Tuna Sludge
Scale: 1/2"=10'
Client ... Project No •O·���=!.
__j
WF 13323 1 � Drofloperoon Dote: t-16.TIOWIL RENEWABLE ENERGY LABORATORY P. W.II.TER Al.TERt-16.TIVE FUELS DIVISION Oeaign.C. Rlvcrd
Approval
Reviaion Code
t.lioc. Data
Dote:
Dote:
TIUe High Solids Anaerobic Disposal . of
MSW/Tuna Sludge Conceptual Site Pan
NREL Drawing No.: MSW/TS-OO l .Sheet 1 0F Ref. Owg. No. Date 3/27/92
Figure 1 6. High solids anaerobic disposal of MSW /tu�a sludge, conceptual site plan
; .__,

r
N 0'\
(' " I
II II 0 v. �-·-·---c::J- ·-·-·-·i7Jn 72\ I ��
/ �
I I
I Backup Data
L•••·· 1 i I � - I:=J I I I I I I /
D I I
L.-.�·-·-·-<JJ§77?• � I \ a::::> c=o
Modem
Analoi Inputs Flows Levels Pressures Temperatures pH Power Consumption
Discrete Inputs Equipment Status Alarm Condition
CPU
Discrete Outputs Permissive Interlocks Control Actions Alarms
I I I I
D
Primary Data Logger
� . [
Analog Inputs
Discrete Inputs
Discrete Outputs �
NREL GOLDEN , CO
_l CD o o o o o o o o
AMERICAN SAMOA PILOT FACILITY
(Pago Pago) .... -
Pr ject No •0• .. 1::1-1 0 WF 13323 1 '11'9' �� ' --Droft.peroon Dato: NATIONAL RENEWABLE ENERGY LABORATORY P. WII.TER ALTERNATIVE FUELS DIVISION Dooigner Dato: TiUo PILOT DEMONSTRTION UNIT c. RIIINID High Solids Anaerobic Disposal Approval Dolo: 1LS1r /Tuna Sludge
Reviaion Code
Miac. Dolo
CONTROL SYSTEM DIAGRAM NREL Drawing No.: llSlf /TS-002
jShoot 1 OF 1
Rtf. Dwg. No. Dolo 4/24/92
Figure 1 7. Pilot demonstration unit: high solids anaerobic disposal MSW /tuna sludge control system diagram
r l ; r J L c
l
J j l
5.0 Ongoing Research Efforts
Multiple research projects (some ongoing from FY 1992 funding [subcontracted]) are required to rapidly bring this technology to the stage of pilot-scale demonstration in American Samoa. Subcontracted economic and engineering assessments of three potential process flow designs and analyses of residue quality for determination of market demand will be concluded in early FY 1993. However, analysis of the maximum process OLR and scale-up fermentation performance requires attention in FY 1993 to provide important information in advance of potential pilot-scale development.
5. 1 Evaluation of the Maximum Process Feed Rate for the Anaerobic High Solids Process
In order to accurately 'determine the process economics, engineer the pilot-scale system, and finally develop the full-scale system for implementation, the maximum process feed rate must be known. The OLR affects the biological system by influencing the size and operating costs of the system, the methane fuel yield, and the quality of the anaerobic compost (residue) produced. The knowledge of the maximum feed rate for the process allows informed operation of the process at rates known to permit enhanced yet stable performance.
The evaluation of the maximum feed rate for the high solids anaerobic process will be determined using one MSW and tuna sludge mixture. The composition of the. combined feedstock will be maintained at a ratio similar to that at which these waste materials are produced in American Samoa. The process feed rate will be evaluated through stepped increases in the organic.loading of feedstock to the laboratory-scale reactor system and careful analysis of the process conversion and stability. Process variables, such as pH, volatile organic acid pools, biogas composition, and VS content of the residue, will be monitored. The data will be correlated to determine the effects of increasing process feed rate on anaerobic bioconversion efficiency.
5.2 Intermediate Scale-up Testing of the High Solids Anaerobic Reactor System Fed the Combined MSW /Tuna Sludge Feedstock
The proposed research focuses on the development and testing of an intermediate-scale high solids reactor system in advance of a proposed pilot-scale system. The intermediate-scale system to be evaluated has a 1000-L total capacity with a 750-L working volume. The scale of this system represents a sizable advance over the laboratory reactors now in operation. This intermediate-scale system is the largest system that is still appropriate for testing within our NREL laboratories (high bay facility). Following fabrication of the reactor system and equipment shakedown, the system will be operated for 8 months using the combined MSW I tuna sludge feedstock. During this time, additional information as to the process performance, mixing horsepower requirements, and process stability will be determined. The information gained from the intermediate-scale reactor operation will serve to guide the development of the pilotscale system.
27
6.0 Acknowledgments
This work was cofunded by the Waste Management Program of the U.S. Department of Energy, the U.S. Environmental Protection Agency, the Territorial Energy Office of the government of American Samoa, and the American Samoan tuna canneries (Star-Kist Samoa, Inc., and VCS Samoa Packing Co.). The authors thank Mr. Bert Yungen and Mr. Ian Boatwood of Pan Pacific Fisheries, Inc. for facilitating the procurement of tuna sludge.
7.0 References
1 . Municipal Solid Waste Energy Conversion Study, March 1984, Burret, Harris, and Associates, DOE Contract No. DE-AC03-83SF11958.
2. Review of Solid Waste Management in American Samoa, June 1988, Steams, Conrad, and Schmidt Consulting Engineers, Inc., American Samoa Government, Department of Public Works, Contract No. 28734.
3. Industrial and Household Waste Treatment for American Samoa, 1988, SEDEP Report.
4. Final Environmental Impact Statement for the Designation of an Ocean Disposal Site off Tutuila Island, American Samoa, for Fish Processing Wastes, February 1989, U.S. EPA Region 9, San Francisco, CA.
5. Final Report on the Economic Feasibility of Producing Methane Gas From Bioconversion of Tuna Cannery Waste, September 1980, Action Resources Inc., DOE/ American Samoa Government Contract No. CM-273-79.
6. "Development of a Novel Laboratory Scale High Solids Reactor for Anaerobic Digestion of Processed MUnicipal Solid Wastes for the Production of Methane," 1989, Rivard, C.J., M.E. Himmel, T.B. Vinzant, W.S. Adney, C.E. Wyman, and K. Grohmann, Appl. Biochem. Biotech. 20/21:461-478.
7. "Anaerobic Digestion of Processed Municipal Solid Waste Using a Novel High Solids Reactor: Maximum Solids Levels and Mixing Requirements," 1990, Rivard, C.J., M.E. Himmel, T.B. Vinzant, W.S. Adney, C.E. Wyman, and K. Grohmann, Biotech Lett. 12:235-240.
8. Anaerobic High Solids Fermentation of Feedstocks from the Western Regional States for the Production of Methane, 1990, Rivard, C.J., T.B. Vinzant, W.S. Adney, and K. Grohmann, Final Report for Western Area Power Administration, Biomass Program Office.
9. "Anaerobic Bioconversion of Municipal Solid Wastes: Effects of Total Solids Levels on Microbial Numbers and Hydrolytic Enzyme Activities," 1992, Rivard, C.J., N.J. Nagle, W.S. Adney, and M.E. Himmel, Appl. Biochem. Biotech. (in review).
10. "Anaerobic Bioconversion of Municipal Solid Wastes Using a Novel High Solids Design: Maximum Organic Loading Rate and Comparison with Low Solids Reactor Systems," 1992, Rivard, C.J., Appl. Biochem. Biotech. (in review).
28
' 1
. I \ '
. '
l_)
. ' ' '
J l )
l l
_) J
11. 'Waste to Energy: Nutrient Requirements for Aerobic and Anaerobic Digestion," 1989, Rivard, C.J., T.B. Vinzant, W.S. Adney, and K. Grohmann, J. Environ. Health 52:96-99.
8.0 Technology Transfer in Support of Research Activities
8. 1 Publications
1. Renewable Energy Plan of Action for American Samoa, 1990, Shupe, J.W., and J.W. Stevens, Sandia Report, SAND90-2804.
2. Rivard, C.J., and N.J. Nagle, 1992, "Anaerobic Bioconversion of Tuna Processing Wastes with MSW," in Proceedings of the Second United States Conference on Municipal Solid Waste Management (in press).
3. Rivard, C.J., and N.J. Nagle, 1992, "Biological Disposal of Tuna Processing Wastes Using a Novel Anaerobic Composting System," in Proceedings of the 1992 Food Industry Environmental Conference (in press).
8.2 Presentations
1 . 1992 Second United States Conference on Municipal Solid Waste Management, Arlington, VA. "Anaerobic Bioconversion of Tuna Processing Wastes with MSW," C.J. Rivard and N.J. Nagle.
2. 1992 Food Industry Environmental Conference, Atlanta, GA. "Biological Disposal of Tuna Processing Wastes Using a Novel Anaerobic Composting System," C.J. Rivard and N.J. Nagle.
29

Document Control Page
4. Title and Subtitle
1 . SERI Report No.
NREL/TP-422-5043
2. NTIS Accession No.
DE93000068
Anaerobic Digestion as a Waste Disposal Option for American Samoa
7. Author(s)
C. Rivard
9. Performing Organization Name and Address
National Renewable Energy Laboratory 1617 Cole Blvd. Golden, CO 80401
1 2. Sponsoring Organization Name and Address
U.S. Department of Energy 1000 Independence Avenue, S.W. Washington, DC 20585
1 5. Supplementary Notes
1 6. Abstract (Limit: 200 words)
3. Recipient's Accession No.
5. Publication Date
January 1993
6.
8. Performing Organization Rept. No.
1 0. Project/Task/Work Unit No.
WM213232
1 1 . Contract (C) or Grant (G) No.
(C)
(G)
1 3. Type of Report & Period Covered
Technical report
1 4.
Tuna sludge and municipal solid waste (MSW) generated on Tutuila Island, American Samoa, represent an ongoing disposal problem as well as an emerging opportunity for use in renewable fuel production. This research project focuses on the biological conversion of the organic fraction of these wastes to useful products including
methane and fertilizer-grade residue through anaerobic high solids digestion. In this preliminary study, the anaerobic bioconversion of tuna sludge with MSW appears promising.
1 7. Document Analy:c;is a. Descriptors
municipal solid waste, anaerobic bioconversion, renewable fuel production
b. Identifiers/Open-Ended Terms
c. UC Categories
320
1 8. Availability Statement
National Technical Information Service U.S. Department of Commerce 5285 Port Royal Road Springfield, VA 22161
Form No. 0069E (6-30·87)
1 9. No. of Pages
32
20. Price
A03
I )
'� l
i iL . J
b. - )