
Seismic performance evaluation of diagrid system …shb.skku.edu/_res/hibs/etc/61.pdf · Seismic...
14
Seismic performance evaluation of diagrid system buildings Jinkoo Kim 1 * ,† and Young-Ho Lee 2 1 Department of Architectural Engineering, Sungkyunkwan University, Suwon, Korea 2 CS Structural Engineering INC, Seoul, Korea SUMMARY In this study, the seismic performance of typical diagrid structures was investigated. To this end, 36-storey diagrid structures with various slopes of external braces were designed and their seismic responses were evaluated using nonlinear static and dynamic analyses. A tubular structure and a diagrid structure with buckling-restrained braces were also designed with the same design loads, and their seismic performances were compared with those of the diagrid structures. According to the analysis results, the diagrid structures showed higher overstrength with smaller ductility compared with the tubular structure. It was also observed that as the slope of braces increased the shear lag effect increased and the lateral strength decreased. Both the strength and ductility of diagrid structures increased significantly when the diagonal members were replaced by buckling-restrained braces. Copyright © 2010 John Wiley & Sons, Ltd. 1. INTRODUCTION Diagrid is composed of triangulated braces and horizontal rings that together make up an efficient structural system for a skyscraper. It is a particular form of space truss mixed with tubular system, and the perimeter diagonal grids make the structure stable even without any vertical column in the perimeter of the building. Diagrid is suitable for constructing large buildings with both regular and irregular forms. Compared with conventional framed tubular structures without diagonals, diagrid structures are more effective in minimizing shear deformation because they carry shear by axial action of the diagonal members (Moon, 2007), while conventional framed tubular structures carry shear by the bending of the vertical columns. Diagrid structures generally do not need high shear rigidity cores because shear can be carried by the diagrids located on the perimeter. It has been shown that diagrid structures have significantly higher resistance against shear lag phenomenon than equivalent tubular structures (Kim and Lee 2010). Previous research on tall buildings generally focused on wind-induced responses (Connor and Pouangaree, 1992; Koran, 1994). Recently motivated by the collapse of the World Trade Center twin towers, the progressive collapse potential of diagrid structures, composed of lateral load-resisting perimeter diagrid frames and internal pin-connected gravity frames, was evaluated. However, research on seismic performance of tall buildings is relatively rare due to the common preconception that tall buildings are not vulnerable to seismic load because their fundamental natural periods are significantly long and thus are away from the acceleration-sensitive region of response spectra. However, buildings designed with diagrid system may have higher stiffness than those designed with other structural systems and be subjected to higher seismic loads. In addition, the design seismic load level in the USA has generally increased from 10/50 events (10% probability of occurrence in 50 years) to two-thirds of 2/50 events (ICC, 2006). Also, the current trend of seismic engineering is to recommend that structural responses for various levels of seismic ground motion be checked; the guideline for * Correspondence to: Jinkoo Kim, Department of Architectural Engineering, Sungkyunkwan University, Suwon, Korea † E-mail: [email protected] Copyright © 2010 John Wiley & Sons, Ltd. THE STRUCTURAL DESIGN OF TALL AND SPECIAL BUILDINGS Published online 2010 in Wiley Online Library (wileyonlinelibrary.com ). DOI: 10.1002/tal.6 Struct. Design Tall Spec. Build. 21, 736–749 (2012) /journal/tal 18 November 43
Transcript of Seismic performance evaluation of diagrid system …shb.skku.edu/_res/hibs/etc/61.pdf · Seismic...
Seismic performance evaluation of diagrid system buildings
Jinkoo Kim1*,† and Young-Ho Lee2
1 Department of Architectural Engineering, Sungkyunkwan University, Suwon, Korea2 CS Structural Engineering INC, Seoul, Korea
SUMMARY
In this study, the seismic performance of typical diagrid structures was investigated. To this end, 36-storey diagrid structures with various slopes of external braces were designed and their seismic responses were evaluated using nonlinear static and dynamic analyses. A tubular structure and a diagrid structure with buckling-restrained braces were also designed with the same design loads, and their seismic performances were compared with those of the diagrid structures. According to the analysis results, the diagrid structures showed higher overstrength with smaller ductility compared with the tubular structure. It was also observed that as the slope of braces increased the shear lag effect increased and the lateral strength decreased. Both the strength and ductility of diagrid structures increased signifi cantly when the diagonal members were replaced by buckling-restrained braces. Copyright © 2010 John Wiley & Sons, Ltd.
1. INTRODUCTION
Diagrid is composed of triangulated braces and horizontal rings that together make up an effi cient structural system for a skyscraper. It is a particular form of space truss mixed with tubular system, and the perimeter diagonal grids make the structure stable even without any vertical column in the perimeter of the building. Diagrid is suitable for constructing large buildings with both regular and irregular forms. Compared with conventional framed tubular structures without diagonals, diagrid structures are more effective in minimizing shear deformation because they carry shear by axial action of the diagonal members (Moon, 2007), while conventional framed tubular structures carry shear by the bending of the vertical columns. Diagrid structures generally do not need high shear rigidity cores because shear can be carried by the diagrids located on the perimeter. It has been shown that diagrid structures have signifi cantly higher resistance against shear lag phenomenon than equivalent tubular structures (Kim and Lee 2010).
Previous research on tall buildings generally focused on wind-induced responses (Connor and Pouangaree, 1992; Koran, 1994). Recently motivated by the collapse of the World Trade Center twin towers, the progressive collapse potential of diagrid structures, composed of lateral load-resisting perimeter diagrid frames and internal pin-connected gravity frames, was evaluated. However, research on seismic performance of tall buildings is relatively rare due to the common preconception that tall buildings are not vulnerable to seismic load because their fundamental natural periods are signifi cantly long and thus are away from the acceleration-sensitive region of response spectra. However, buildings designed with diagrid system may have higher stiffness than those designed with other structural systems and be subjected to higher seismic loads. In addition, the design seismic load level in the USA has generally increased from 10/50 events (10% probability of occurrence in 50 years) to two-thirds of 2/50 events (ICC, 2006). Also, the current trend of seismic engineering is to recommend that structural responses for various levels of seismic ground motion be checked; the guideline for
* Correspondence to: Jinkoo Kim, Department of Architectural Engineering, Sungkyunkwan University, Suwon, Korea† E-mail: [email protected]
Copyright © 2010 John Wiley & Sons, Ltd.
THE STRUCTURAL DESIGN OF TALL AND SPECIAL BUILDINGS
Published online 2010 in Wiley Online Library (wileyonlinelibrary.com ). DOI: 10.1002/tal.6Struct. Design Tall Spec. Build. 21, 736–749 (2012)
/journal/tal18 November 43
Copyright © 2010 John Wiley & Sons, Ltd.
performance-based seismic engineering (FEMA, 2000) requires that the structure be designed to satisfy a collapse prevention limit state for 2/50 seismic events.
In this paper, the seismic performance of diagrid structural systems with various slopes of braces was investigated using nonlinear static and dynamic analyses. The seismic performance of tubular structure with the same size was also evaluated for comparison. In the later part of the paper, the seismic performances of model structures with circular plan shapes were compared with those of the structures with square plan. The performance of a diagrid structure with its braces replaced by buck-ling restrained braces was also evaluated.
2. DESIGN OF MODEL STRUCTURES AND ANALYSIS MODELLING
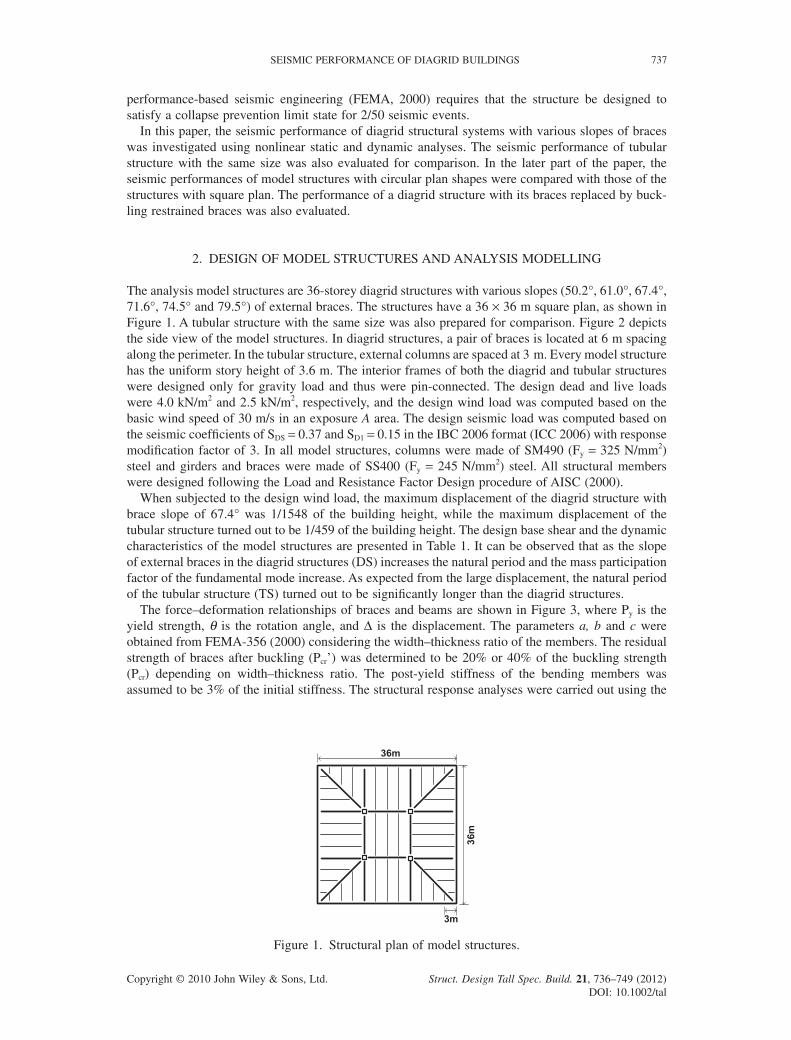
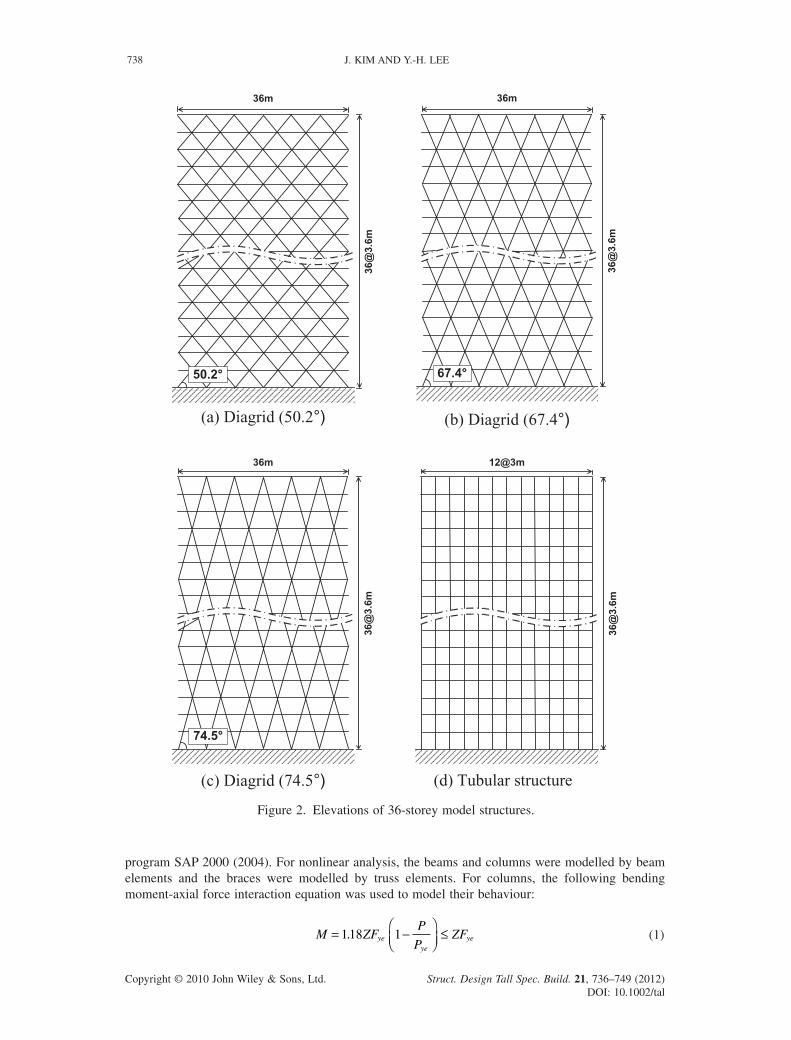
The analysis model structures are 36-storey diagrid structures with various slopes (50.2°, 61.0°, 67.4°, 71.6°, 74.5° and 79.5°) of external braces. The structures have a 36 × 36 m square plan, as shown in Figure 1. A tubular structure with the same size was also prepared for comparison. Figure 2 depicts the side view of the model structures. In diagrid structures, a pair of braces is located at 6 m spacing along the perimeter. In the tubular structure, external columns are spaced at 3 m. Every model structure has the uniform story height of 3.6 m. The interior frames of both the diagrid and tubular structures were designed only for gravity load and thus were pin-connected. The design dead and live loads were 4.0 kN/m2 and 2.5 kN/m2, respectively, and the design wind load was computed based on the basic wind speed of 30 m/s in an exposure A area. The design seismic load was computed based on the seismic coeffi cients of SDS = 0.37 and SD1 = 0.15 in the IBC 2006 format (ICC 2006) with response modifi cation factor of 3. In all model structures, columns were made of SM490 (Fy = 325 N/mm2) steel and girders and braces were made of SS400 (Fy = 245 N/mm2) steel. All structural members were designed following the Load and Resistance Factor Design procedure of AISC (2000).
When subjected to the design wind load, the maximum displacement of the diagrid structure with brace slope of 67.4° was 1/1548 of the building height, while the maximum displacement of the tubular structure turned out to be 1/459 of the building height. The design base shear and the dynamic characteristics of the model structures are presented in Table 1. It can be observed that as the slope of external braces in the diagrid structures (DS) increases the natural period and the mass participation factor of the fundamental mode increase. As expected from the large displacement, the natural period of the tubular structure (TS) turned out to be signifi cantly longer than the diagrid structures.
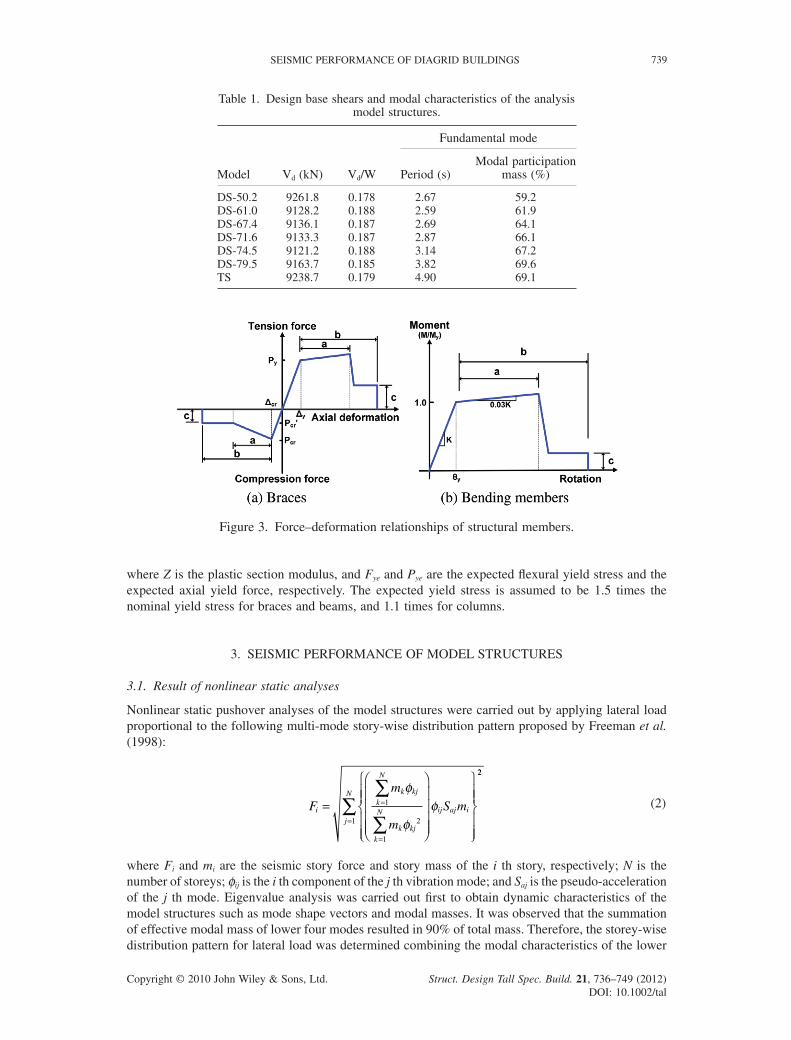
The force–deformation relationships of braces and beams are shown in Figure 3, where Py is the yield strength, θ is the rotation angle, and Δ is the displacement. The parameters a, b and c were obtained from FEMA-356 (2000) considering the width–thickness ratio of the members. The residual strength of braces after buckling (Pcr’) was determined to be 20% or 40% of the buckling strength (Pcr) depending on width–thickness ratio. The post-yield stiffness of the bending members was assumed to be 3% of the initial stiffness. The structural response analyses were carried out using the
36m
36m
3m
Figure 1. Structural plan of model structures.
SEISMIC PERFORMANCE OF DIAGRID BUILDINGS 737
Struct. Design Tall Spec. Build. 21, 736–749 (2012)DOI: 10.1002/tal
Copyright © 2010 John Wiley & Sons, Ltd.
program SAP 2000 (2004). For nonlinear analysis, the beams and columns were modelled by beam elements and the braces were modelled by truss elements. For columns, the following bending moment-axial force interaction equation was used to model their behaviour:
M ZFP
PZFye
yeye= −
⎛⎝⎜
⎞⎠⎟
≤118 1. (1)
36@
3.6m
36m
50.2°
(a) Diagrid (50.2°)
74.5°
36@
3.6m
36m
(c) Diagrid (74.5°)
36@
3.6m
36m
67.4°
(b) Diagrid (67.4°)
36@
3.6m
12@3m
(d) Tubular structure
Figure 2. Elevations of 36-storey model structures.
J. KIM AND Y.-H. LEE738
Struct. Design Tall Spec. Build. 21, 736–749 (2012)DOI: 10.1002/tal
Copyright © 2010 John Wiley & Sons, Ltd.
where Z is the plastic section modulus, and Fye and Pye are the expected fl exural yield stress and the expected axial yield force, respectively. The expected yield stress is assumed to be 1.5 times the nominal yield stress for braces and beams, and 1.1 times for columns.
3. SEISMIC PERFORMANCE OF MODEL STRUCTURES
3.1. Result of nonlinear static analyses
Nonlinear static pushover analyses of the model structures were carried out by applying lateral load proportional to the following multi-mode story-wise distribution pattern proposed by Freeman et al. (1998):
F
m
m
S mi
k kj
k
N
k kj
k
N ij aj i=
⎛
⎝
⎜⎜⎜⎜
⎞
⎠
⎟⎟⎟⎟
⎧
⎨⎪⎪
⎩⎪⎪
⎫
⎬⎪⎪
⎭⎪⎪
=
=
∑
∑
φ
φφ1
2
1
22
1j
N
=∑ (2)
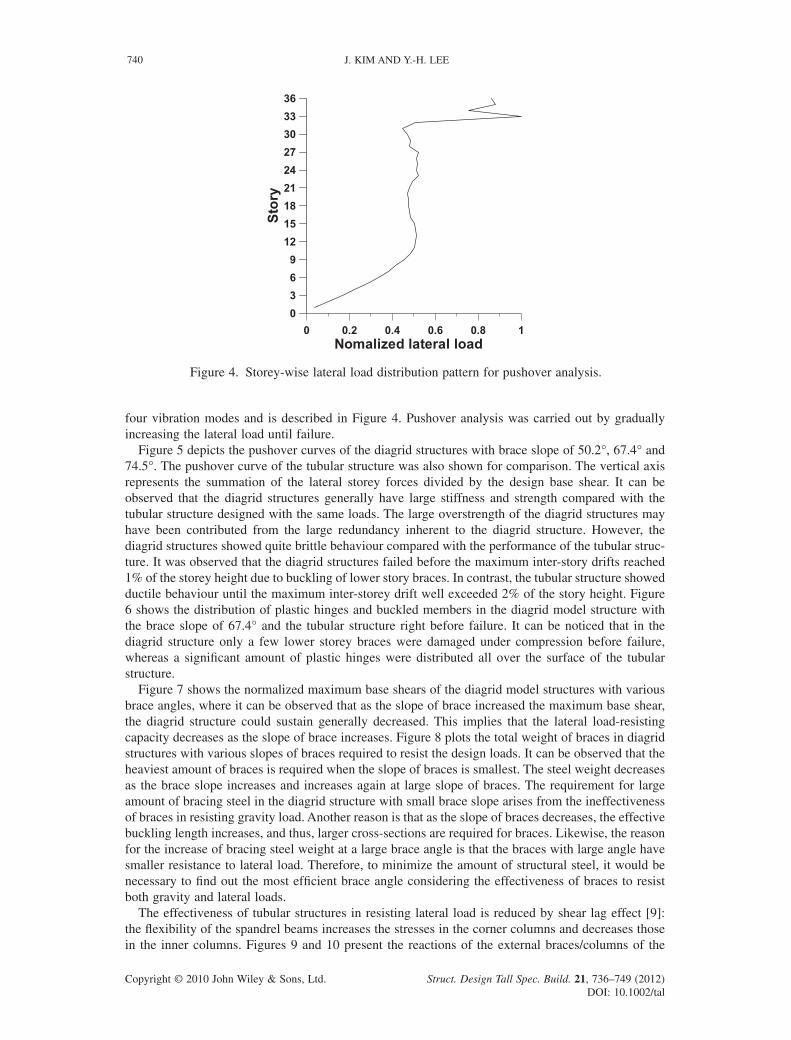
where Fi and mi are the seismic story force and story mass of the i th story, respectively; N is the number of storeys; φij is the i th component of the j th vibration mode; and Saj is the pseudo-acceleration of the j th mode. Eigenvalue analysis was carried out fi rst to obtain dynamic characteristics of the model structures such as mode shape vectors and modal masses. It was observed that the summation of effective modal mass of lower four modes resulted in 90% of total mass. Therefore, the storey-wise distribution pattern for lateral load was determined combining the modal characteristics of the lower
Table 1. Design base shears and modal characteristics of the analysis model structures.
Model Vd (kN) Vd/W
Fundamental mode
Period (s)Modal participation
mass (%)
DS-50.2 9261.8 0.178 2.67 59.2DS-61.0 9128.2 0.188 2.59 61.9DS-67.4 9136.1 0.187 2.69 64.1DS-71.6 9133.3 0.187 2.87 66.1DS-74.5 9121.2 0.188 3.14 67.2DS-79.5 9163.7 0.185 3.82 69.6TS 9238.7 0.179 4.90 69.1
Figure 3. Force–deformation relationships of structural members.
SEISMIC PERFORMANCE OF DIAGRID BUILDINGS 739
Struct. Design Tall Spec. Build. 21, 736–749 (2012)DOI: 10.1002/tal
Copyright © 2010 John Wiley & Sons, Ltd.
four vibration modes and is described in Figure 4. Pushover analysis was carried out by gradually increasing the lateral load until failure.
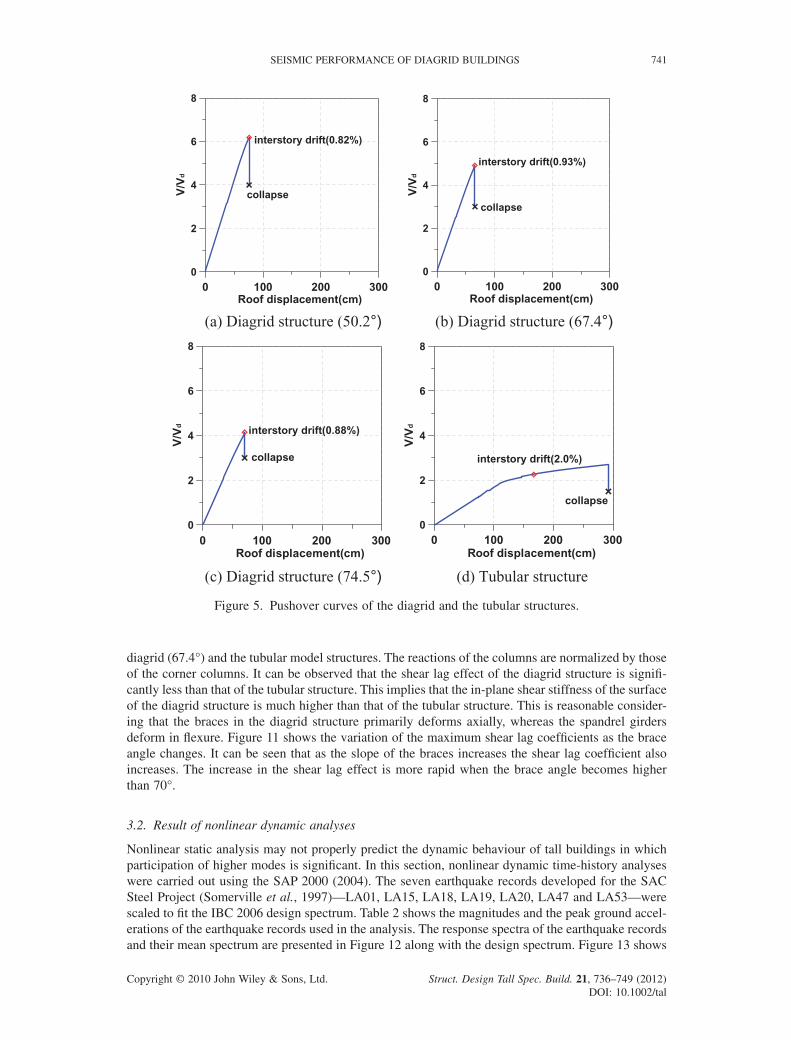
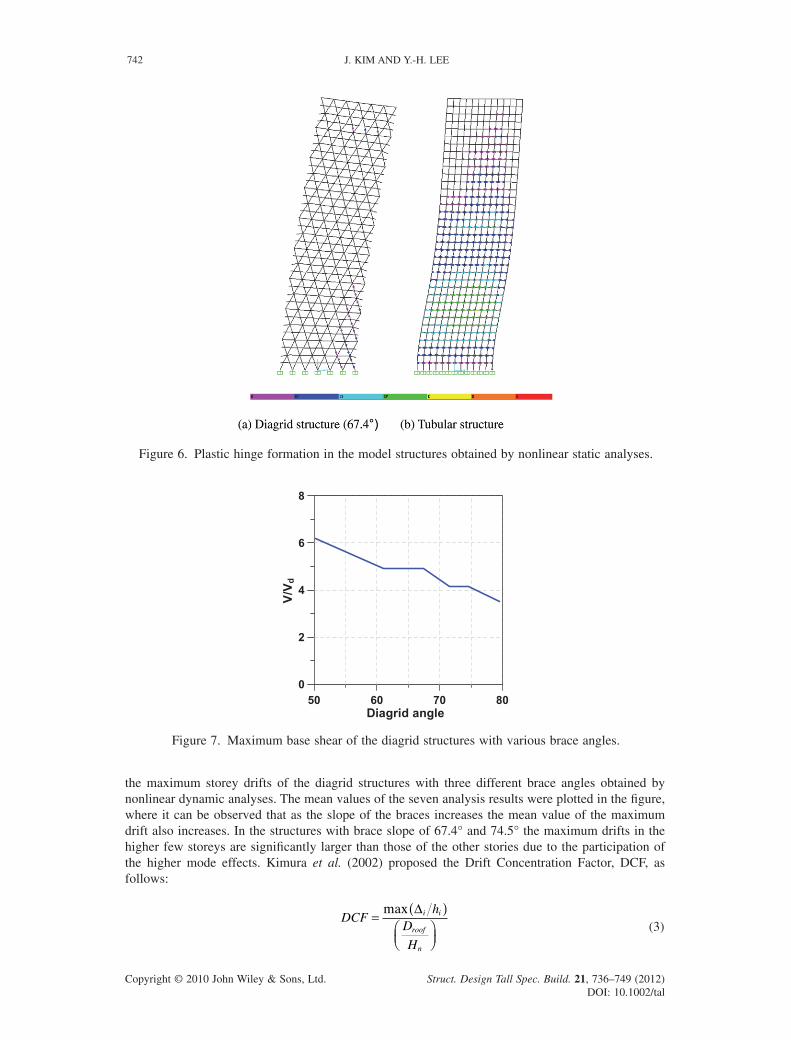
Figure 5 depicts the pushover curves of the diagrid structures with brace slope of 50.2°, 67.4° and 74.5°. The pushover curve of the tubular structure was also shown for comparison. The vertical axis represents the summation of the lateral storey forces divided by the design base shear. It can be observed that the diagrid structures generally have large stiffness and strength compared with the tubular structure designed with the same loads. The large overstrength of the diagrid structures may have been contributed from the large redundancy inherent to the diagrid structure. However, the diagrid structures showed quite brittle behaviour compared with the performance of the tubular struc-ture. It was observed that the diagrid structures failed before the maximum inter-story drifts reached 1% of the storey height due to buckling of lower story braces. In contrast, the tubular structure showed ductile behaviour until the maximum inter-storey drift well exceeded 2% of the story height. Figure 6 shows the distribution of plastic hinges and buckled members in the diagrid model structure with the brace slope of 67.4° and the tubular structure right before failure. It can be noticed that in the diagrid structure only a few lower storey braces were damaged under compression before failure, whereas a signifi cant amount of plastic hinges were distributed all over the surface of the tubular structure.
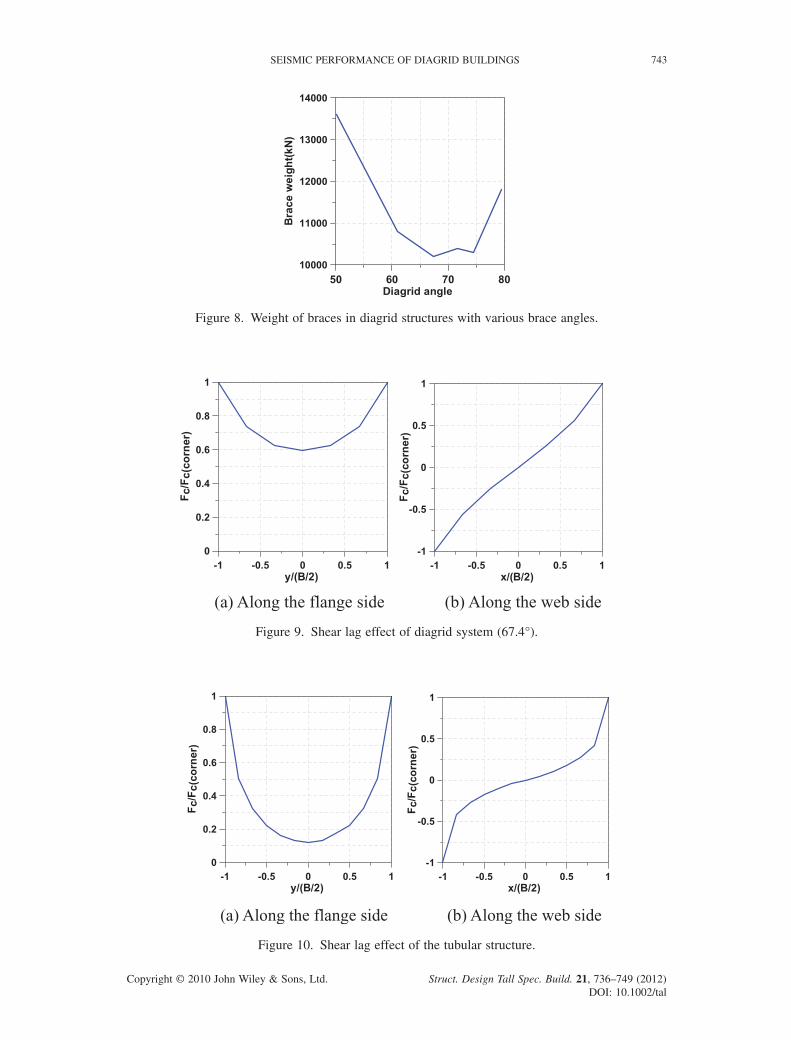
Figure 7 shows the normalized maximum base shears of the diagrid model structures with various brace angles, where it can be observed that as the slope of brace increased the maximum base shear, the diagrid structure could sustain generally decreased. This implies that the lateral load-resisting capacity decreases as the slope of brace increases. Figure 8 plots the total weight of braces in diagrid structures with various slopes of braces required to resist the design loads. It can be observed that the heaviest amount of braces is required when the slope of braces is smallest. The steel weight decreases as the brace slope increases and increases again at large slope of braces. The requirement for large amount of bracing steel in the diagrid structure with small brace slope arises from the ineffectiveness of braces in resisting gravity load. Another reason is that as the slope of braces decreases, the effective buckling length increases, and thus, larger cross-sections are required for braces. Likewise, the reason for the increase of bracing steel weight at a large brace angle is that the braces with large angle have smaller resistance to lateral load. Therefore, to minimize the amount of structural steel, it would be necessary to fi nd out the most effi cient brace angle considering the effectiveness of braces to resist both gravity and lateral loads.
The effectiveness of tubular structures in resisting lateral load is reduced by shear lag effect [9]: the fl exibility of the spandrel beams increases the stresses in the corner columns and decreases those in the inner columns. Figures 9 and 10 present the reactions of the external braces/columns of the
0 0.2 0.4 0.6 0.8 1Nomalized lateral load
0
3
6
9
12
15
18
21
24
27
30
33
36
Sto
ry
Figure 4. Storey-wise lateral load distribution pattern for pushover analysis.
J. KIM AND Y.-H. LEE740
Struct. Design Tall Spec. Build. 21, 736–749 (2012)DOI: 10.1002/tal
Copyright © 2010 John Wiley & Sons, Ltd.
0 100 200 300Roof displacement(cm)
0
2
4
6
8
V/V
d
collapse
interstory drift(0.82%)
0 100 200 300Roof displacement(cm)
0
2
4
6
8
V/V
d
collapse
interstory drift(0.93%)
(a) Diagrid structure (50.2°) (b) Diagrid structure (67.4°)
(c) Diagrid structure (74.5°) (d) Tubular structure
Roof displacement(cm)
0
2
4
6
8
V/V
d
interstory drift(2.0%)
collapse
0 100 200 3000 100 200 300Roof displacement(cm)
0
2
4
6
8
V/V
d interstory drift(0.88%)
collapse
Figure 5. Pushover curves of the diagrid and the tubular structures.
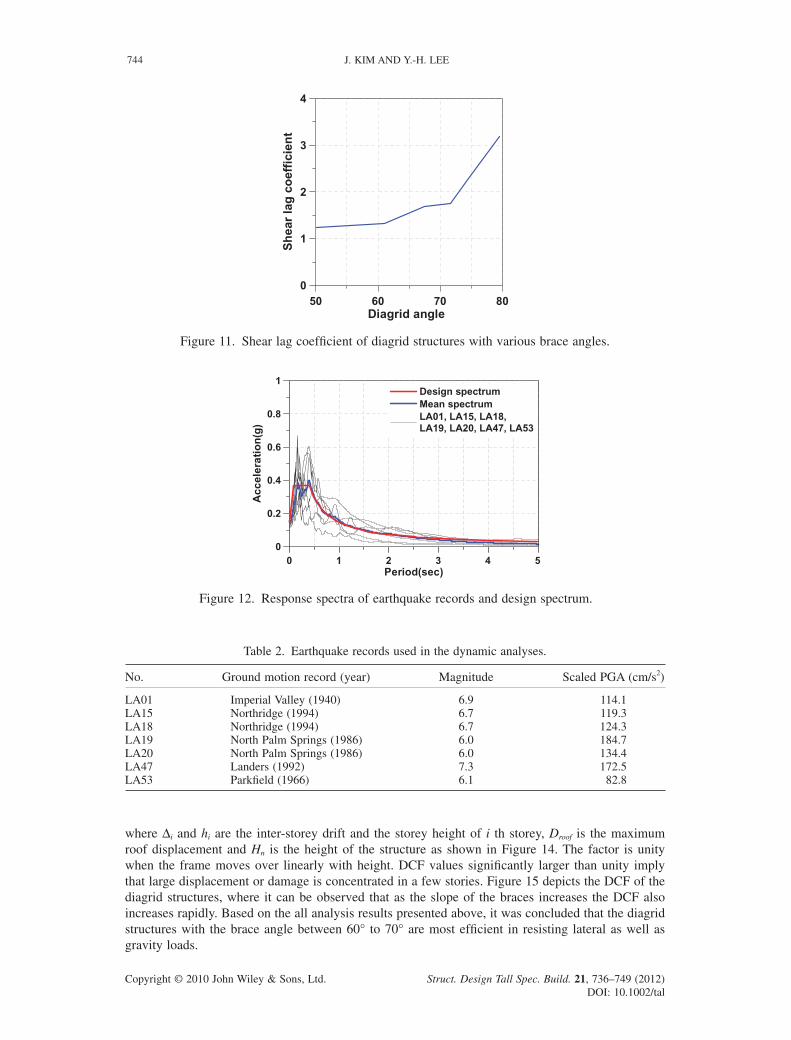
diagrid (67.4°) and the tubular model structures. The reactions of the columns are normalized by those of the corner columns. It can be observed that the shear lag effect of the diagrid structure is signifi -cantly less than that of the tubular structure. This implies that the in-plane shear stiffness of the surface of the diagrid structure is much higher than that of the tubular structure. This is reasonable consider-ing that the braces in the diagrid structure primarily deforms axially, whereas the spandrel girders deform in fl exure. Figure 11 shows the variation of the maximum shear lag coeffi cients as the brace angle changes. It can be seen that as the slope of the braces increases the shear lag coeffi cient also increases. The increase in the shear lag effect is more rapid when the brace angle becomes higher than 70°.
3.2. Result of nonlinear dynamic analyses
Nonlinear static analysis may not properly predict the dynamic behaviour of tall buildings in which participation of higher modes is signifi cant. In this section, nonlinear dynamic time-history analyses were carried out using the SAP 2000 (2004). The seven earthquake records developed for the SAC Steel Project (Somerville et al., 1997)—LA01, LA15, LA18, LA19, LA20, LA47 and LA53—were scaled to fi t the IBC 2006 design spectrum. Table 2 shows the magnitudes and the peak ground accel-erations of the earthquake records used in the analysis. The response spectra of the earthquake records and their mean spectrum are presented in Figure 12 along with the design spectrum. Figure 13 shows
SEISMIC PERFORMANCE OF DIAGRID BUILDINGS 741
Struct. Design Tall Spec. Build. 21, 736–749 (2012)DOI: 10.1002/tal
Copyright © 2010 John Wiley & Sons, Ltd.
Figure 6. Plastic hinge formation in the model structures obtained by nonlinear static analyses.
50 60 70 80Diagrid angle
0
2
4
6
8
V/V
d
Figure 7. Maximum base shear of the diagrid structures with various brace angles.
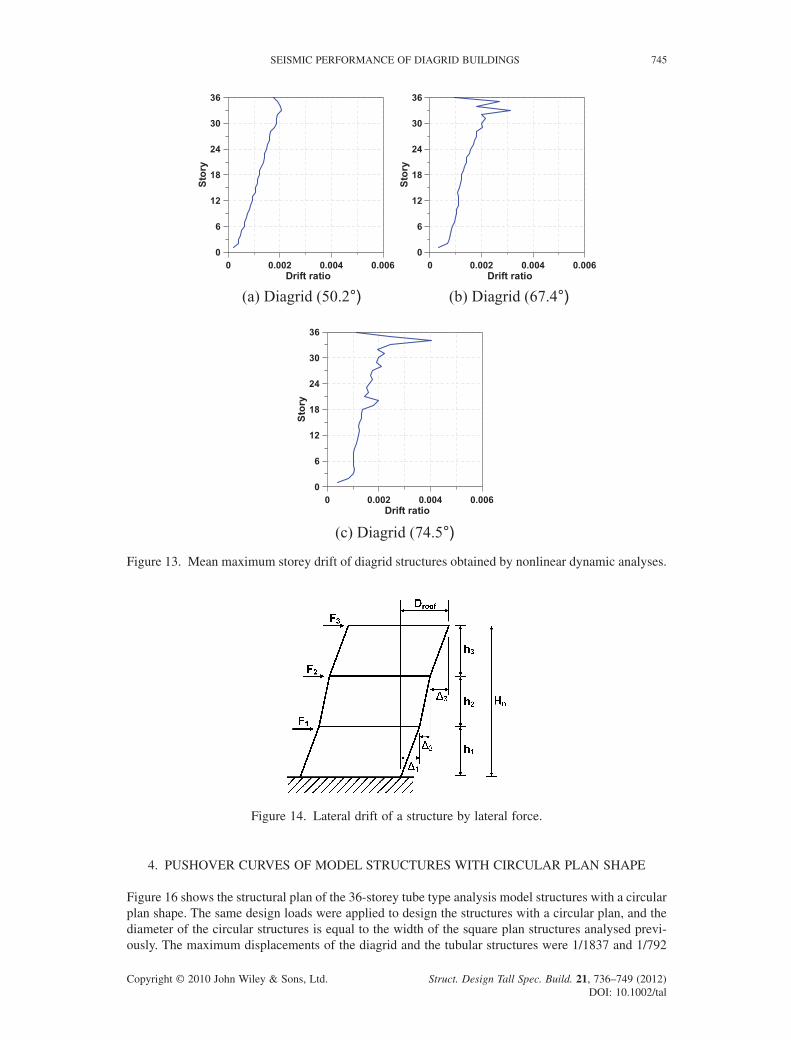
the maximum storey drifts of the diagrid structures with three different brace angles obtained by nonlinear dynamic analyses. The mean values of the seven analysis results were plotted in the fi gure, where it can be observed that as the slope of the braces increases the mean value of the maximum drift also increases. In the structures with brace slope of 67.4° and 74.5° the maximum drifts in the higher few storeys are signifi cantly larger than those of the other stories due to the participation of the higher mode effects. Kimura et al. (2002) proposed the Drift Concentration Factor, DCF, as follows:
DCF
hD
H
i i
roof
n
= ( )⎛⎝⎜
⎞⎠⎟
max Δ (3)
J. KIM AND Y.-H. LEE742
Struct. Design Tall Spec. Build. 21, 736–749 (2012)DOI: 10.1002/tal
Copyright © 2010 John Wiley & Sons, Ltd.
50 60 70 80Diagrid angle
10000
11000
12000
13000
14000
Bra
ce w
eig
ht(
kN)
Figure 8. Weight of braces in diagrid structures with various brace angles.
-1 -0.5 0 0.5 1y/(B/2)
0
0.2
0.4
0.6
0.8
1
Fc/
Fc(
corn
er)
-1 -0.5 0 0.5 1x/(B/2)
-1
-0.5
0
0.5
1
Fc/
Fc(
corn
er)
(a) Along the flange side (b) Along the web side
Figure 9. Shear lag effect of diagrid system (67.4°).
-1 -0.5 0 0.5 1y/(B/2)
0
0.2
0.4
0.6
0.8
1
Fc/
Fc(
corn
er)
-1 -0.5 0 0.5 1x/(B/2)
-1
-0.5
0
0.5
1
Fc/
Fc(
corn
er)
(a) Along the flange side (b) Along the web side
Figure 10. Shear lag effect of the tubular structure.
SEISMIC PERFORMANCE OF DIAGRID BUILDINGS 743
Struct. Design Tall Spec. Build. 21, 736–749 (2012)DOI: 10.1002/tal
Copyright © 2010 John Wiley & Sons, Ltd.
50 60 70 80Diagrid angle
0
1
2
3
4
Sh
ear
lag
co
effi
cien
t
Figure 11. Shear lag coeffi cient of diagrid structures with various brace angles.
Table 2. Earthquake records used in the dynamic analyses.
No. Ground motion record (year) Magnitude Scaled PGA (cm/s2)
LA01 Imperial Valley (1940) 6.9 114.1LA15 Northridge (1994) 6.7 119.3LA18 Northridge (1994) 6.7 124.3LA19 North Palm Springs (1986) 6.0 184.7LA20 North Palm Springs (1986) 6.0 134.4LA47 Landers (1992) 7.3 172.5LA53 Parkfi eld (1966) 6.1 82.8
0 1 2 3 4 5Period(sec)
0
0.2
0.4
0.6
0.8
1
Acc
eler
atio
n(g
)
Design spectrumMean spectrumLA01, LA15, LA18,LA19, LA20, LA47, LA53
Figure 12. Response spectra of earthquake records and design spectrum.
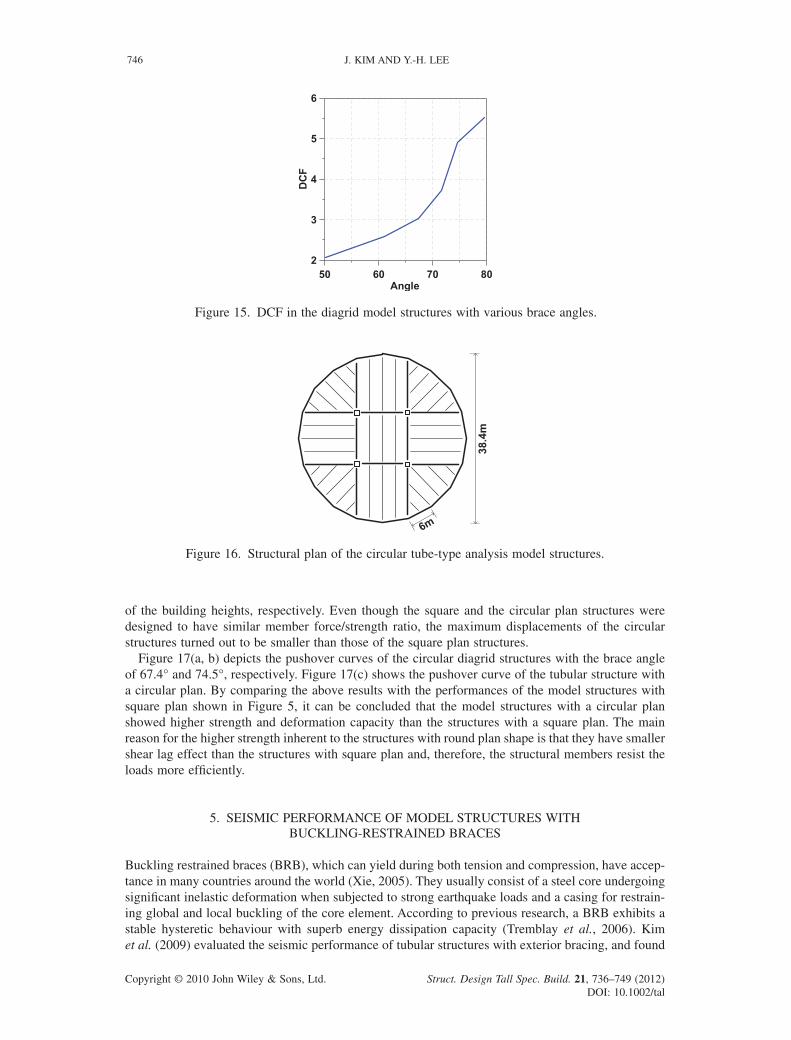
where Δi and hi are the inter-storey drift and the storey height of i th storey, Droof is the maximum roof displacement and Hn is the height of the structure as shown in Figure 14. The factor is unity when the frame moves over linearly with height. DCF values signifi cantly larger than unity imply that large displacement or damage is concentrated in a few stories. Figure 15 depicts the DCF of the diagrid structures, where it can be observed that as the slope of the braces increases the DCF also increases rapidly. Based on the all analysis results presented above, it was concluded that the diagrid structures with the brace angle between 60° to 70° are most effi cient in resisting lateral as well as gravity loads.
J. KIM AND Y.-H. LEE744
Struct. Design Tall Spec. Build. 21, 736–749 (2012)DOI: 10.1002/tal
Copyright © 2010 John Wiley & Sons, Ltd.
0 0.002 0.004 0.006Drift ratio
0
6
12
18
24
30
36
Sto
ry
0 0.002 0.004 0.006Drift ratio
0
6
12
18
24
30
36
Sto
ry
(a) Diagrid (50.2°) (b) Diagrid (67.4°)
0 0.002 0.004 0.006Drift ratio
0
6
12
18
24
30
36
Sto
ry
(c) Diagrid (74.5°)
Figure 13. Mean maximum storey drift of diagrid structures obtained by nonlinear dynamic analyses.
Figure 14. Lateral drift of a structure by lateral force.
4. PUSHOVER CURVES OF MODEL STRUCTURES WITH CIRCULAR PLAN SHAPE
Figure 16 shows the structural plan of the 36-storey tube type analysis model structures with a circular plan shape. The same design loads were applied to design the structures with a circular plan, and the diameter of the circular structures is equal to the width of the square plan structures analysed previ-ously. The maximum displacements of the diagrid and the tubular structures were 1/1837 and 1/792
SEISMIC PERFORMANCE OF DIAGRID BUILDINGS 745
Struct. Design Tall Spec. Build. 21, 736–749 (2012)DOI: 10.1002/tal
Copyright © 2010 John Wiley & Sons, Ltd.
50 60 70 80Angle
2
3
4
5
6
DC
FFigure 15. DCF in the diagrid model structures with various brace angles.
38.4
m
6m
Figure 16. Structural plan of the circular tube-type analysis model structures.
of the building heights, respectively. Even though the square and the circular plan structures were designed to have similar member force/strength ratio, the maximum displacements of the circular structures turned out to be smaller than those of the square plan structures.
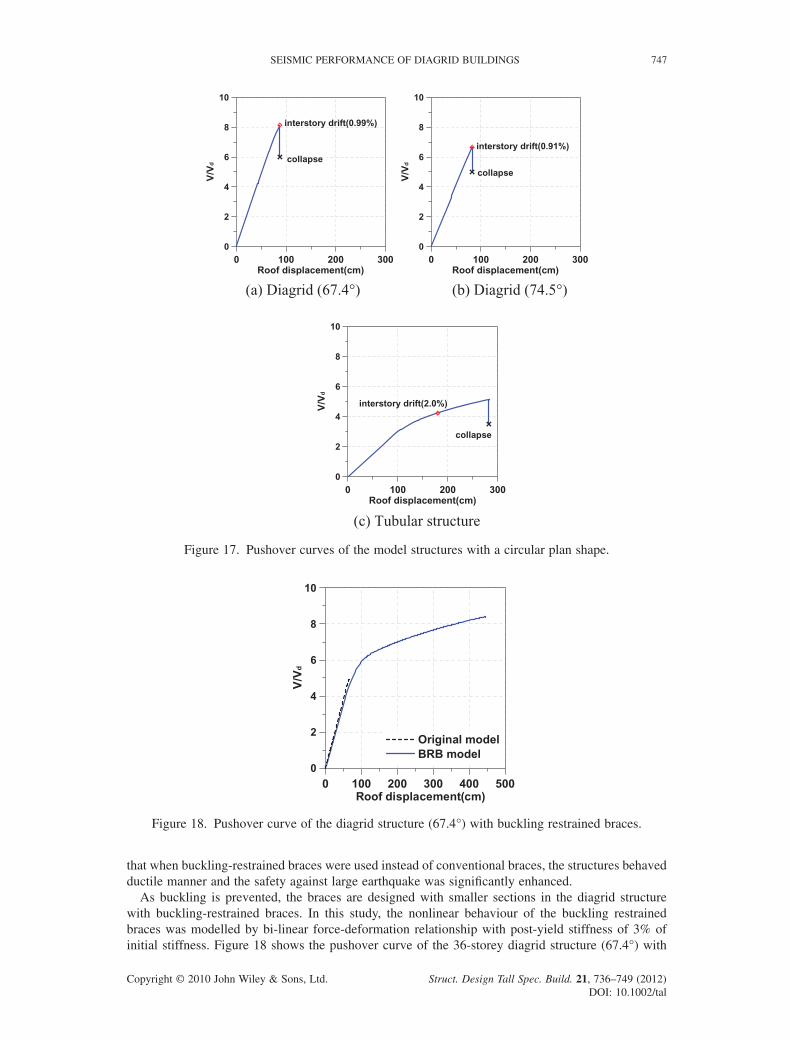
Figure 17(a, b) depicts the pushover curves of the circular diagrid structures with the brace angle of 67.4° and 74.5°, respectively. Figure 17(c) shows the pushover curve of the tubular structure with a circular plan. By comparing the above results with the performances of the model structures with square plan shown in Figure 5, it can be concluded that the model structures with a circular plan showed higher strength and deformation capacity than the structures with a square plan. The main reason for the higher strength inherent to the structures with round plan shape is that they have smaller shear lag effect than the structures with square plan and, therefore, the structural members resist the loads more effi ciently.
5. SEISMIC PERFORMANCE OF MODEL STRUCTURES WITH BUCKLING-RESTRAINED BRACES
Buckling restrained braces (BRB), which can yield during both tension and compression, have accep-tance in many countries around the world (Xie, 2005). They usually consist of a steel core undergoing signifi cant inelastic deformation when subjected to strong earthquake loads and a casing for restrain-ing global and local buckling of the core element. According to previous research, a BRB exhibits a stable hysteretic behaviour with superb energy dissipation capacity (Tremblay et al., 2006). Kim et al. (2009) evaluated the seismic performance of tubular structures with exterior bracing, and found
J. KIM AND Y.-H. LEE746
Struct. Design Tall Spec. Build. 21, 736–749 (2012)DOI: 10.1002/tal
Copyright © 2010 John Wiley & Sons, Ltd.
0 100 200 300Roof displacement(cm)
0
2
4
6
8
10
V/V
d
interstory drift(0.99%)
collapse
V/V
d
0 100 200 300Roof displacement(cm)
0
2
4
6
8
10
interstory drift(0.91%)
collapse
(a) Diagrid (67.4°) (b) Diagrid (74.5°)
0 100 200 300Roof displacement(cm)
0
2
4
6
8
10V
/Vd
interstory drift(2.0%)
collapse
(c) Tubular structure
that when buckling-restrained braces were used instead of conventional braces, the structures behaved ductile manner and the safety against large earthquake was signifi cantly enhanced.
As buckling is prevented, the braces are designed with smaller sections in the diagrid structure with buckling-restrained braces. In this study, the nonlinear behaviour of the buckling restrained braces was modelled by bi-linear force-deformation relationship with post-yield stiffness of 3% of initial stiffness. Figure 18 shows the pushover curve of the 36-storey diagrid structure (67.4°) with
Figure 17. Pushover curves of the model structures with a circular plan shape.
0 100 200 300 400 500Roof displacement(cm)
0
2
4
6
8
10
V/V
d
Original modelBRB model
Figure 18. Pushover curve of the diagrid structure (67.4°) with buckling restrained braces.
SEISMIC PERFORMANCE OF DIAGRID BUILDINGS 747
Struct. Design Tall Spec. Build. 21, 736–749 (2012)DOI: 10.1002/tal
Copyright © 2010 John Wiley & Sons, Ltd.
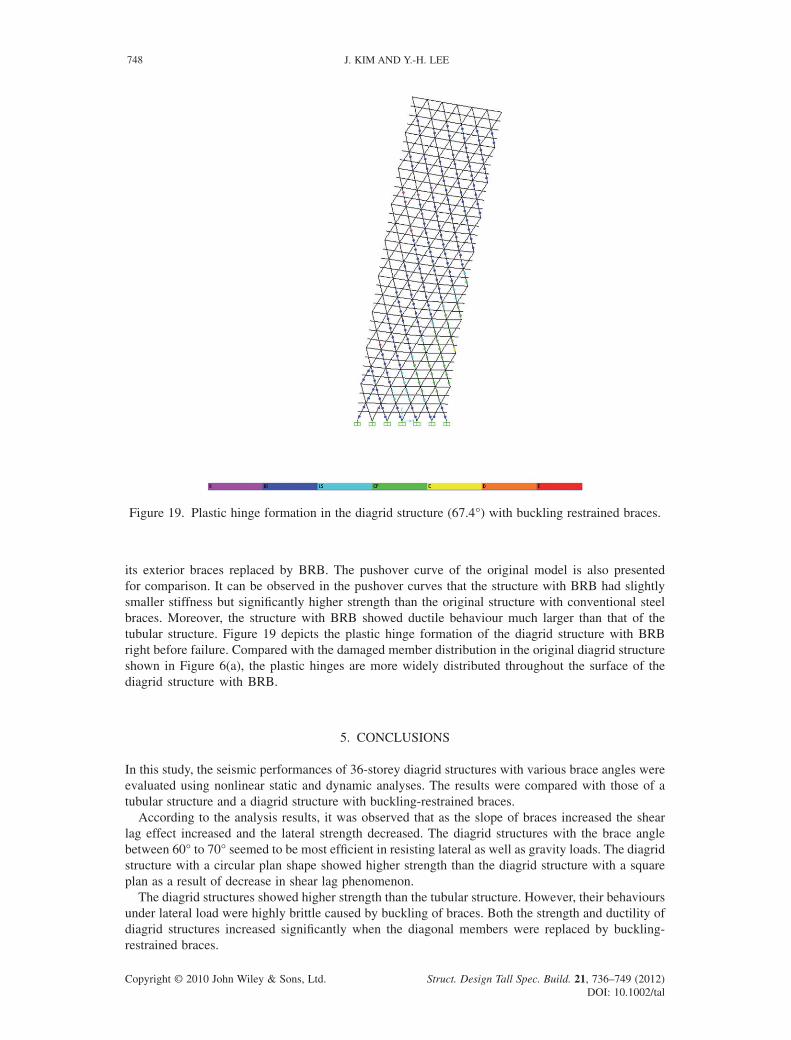
its exterior braces replaced by BRB. The pushover curve of the original model is also presented for comparison. It can be observed in the pushover curves that the structure with BRB had slightly smaller stiffness but signifi cantly higher strength than the original structure with conventional steel braces. Moreover, the structure with BRB showed ductile behaviour much larger than that of the tubular structure. Figure 19 depicts the plastic hinge formation of the diagrid structure with BRB right before failure. Compared with the damaged member distribution in the original diagrid structure shown in Figure 6(a), the plastic hinges are more widely distributed throughout the surface of the diagrid structure with BRB.
5. CONCLUSIONS
In this study, the seismic performances of 36-storey diagrid structures with various brace angles were evaluated using nonlinear static and dynamic analyses. The results were compared with those of a tubular structure and a diagrid structure with buckling-restrained braces.
According to the analysis results, it was observed that as the slope of braces increased the shear lag effect increased and the lateral strength decreased. The diagrid structures with the brace angle between 60° to 70° seemed to be most effi cient in resisting lateral as well as gravity loads. The diagrid structure with a circular plan shape showed higher strength than the diagrid structure with a square plan as a result of decrease in shear lag phenomenon.
The diagrid structures showed higher strength than the tubular structure. However, their behaviours under lateral load were highly brittle caused by buckling of braces. Both the strength and ductility of diagrid structures increased signifi cantly when the diagonal members were replaced by buckling-restrained braces.
Figure 19. Plastic hinge formation in the diagrid structure (67.4°) with buckling restrained braces.
J. KIM AND Y.-H. LEE748
Struct. Design Tall Spec. Build. 21, 736–749 (2012)DOI: 10.1002/tal
Copyright © 2010 John Wiley & Sons, Ltd.
ACKNOWLEDGEMENT
This research was fi nancially supported by the Super-Tall Building R&D Project of the Korean Ministry of Land, Transport, and Maritime Affairs (09CHUD-A053106-01-000000).
REFERENCES
AISC 2000. Load and Resistance Factor Design Specifi cation for Structural Steel Buildings. American Institute of Steel Con-struction: Chicago, IL.
Connor JJ, Pouangaree CC. 1992. Simple model for design of framed-tube structures. Journal of Structural Engineering, ASCE 117(12): 3623–3643.
FEMA 2000. Prestandard and Commentary for the Seismic Rehabilitation of Buildings, FEMA-356. Federal Emergency Man-agement Agency, Washington, DC.
Freeman S, Sasaki K, Paret T. 1998. Multi-Mode Push-over Procedure (MMP). In Proceedings of the 6th National Conference on Earthquake Engineering, EERI, Seattle, WA.
ICC. 2006. International Building Code. International Code Council: Falls Church, VA.Kim J, Lee YH. 2009. Progressive collapse resisting capacity of tube-type structures. The Structural Design of Tall and Special
Buildings Published Online: Mar 25 2009. DOI: 10.1002/tal.512.Kim J, Park J, Shin SW, Min KW. 2009. Seismic performance of tubular structures with buckling restrained braces. The
Structural Design of Tall and Special Buildings 18(4): 351–370.Kimura Y, MacRae GA, Roeder C. 2002. Column stiffness effects on braced frame seismic behavior. In Proceedings of the
7th US National Conference on Earthquake Engineering, EERI, Boston, MA, Paper No. 49.Koran AKH. 1994. Simple method for approximate analysis of framed tube structures. Journal of Structural Engineering,
ASCE 120(4): 1221–1239Moon KS. 2007. Diagrid structural systems for tall buildings, characteristics and methodology for preliminary design. The
Structural Design of Tall and Special Buildings 16(16): 205–230.SAP2000. 2004. Structural Analysis Program. Computers and Structures: Berkeley, CA.Somerville P, Smith N, Puntamurthual S, Sun J. 1997. Development of ground motion time histories for phase 2 of the FEMA/
SAC steel project. Background document, Report No. SAC/BD-97/04.Tremblay R, Bolduc P, Neville R, DeVall R. 2006. Seismic testing and performance of buckling-restrained bracing systems.
Canadian Journal of Civil Engineering 33: 183–198.Xie Q. 2005. State of the art of buckling-restrained braces in Asia. Journal of Constructional Steel Research 61: 727–748.
SEISMIC PERFORMANCE OF DIAGRID BUILDINGS 749
Struct. Design Tall Spec. Build. 21, 736–749 (2012)DOI: 10.1002/tal


![COMPARATIVE STUDY OF CONCRETE DIAGRID BUILDING …[3] Khushbu D. Jani, Paresh V. Patel. “Design of Diagrid Structural System for High Rise Steel Buildings as per Indian Standards”.](https://static.fdocuments.us/doc/165x107/5f974e01e9475970f822cac7/comparative-study-of-concrete-diagrid-building-3-khushbu-d-jani-paresh-v-patel.jpg)