SEISMIC HAZARD ZONE REPORT FOR THE WOODWARD...
41
SEISMIC HAZARD ZONE REPORT 121 SEISMIC HAZARD ZONE REPORT FOR THE WOODWARD ISLAND 7.5-MINUTE QUADRANGLE, CONTRA COSTA COUNTY, CALIFORNIA 2018 DEPARTMENT OF CONSERVATION California Geological Survey STATE OF CALIFORNIA EDMUND G. BROWN, JR. GOVERNOR THE RESOURCES AGENCY JOHN LAIRD SECRETARY FOR RESOURCES DEPARTMENT OF CONSERVATION DAVID BUNN DIRECTOR CALIFORNIA GEOLOGICAL SURVEY JOHN G. PARRISH, PH.D. STATE GEOLOGIST
Transcript of SEISMIC HAZARD ZONE REPORT FOR THE WOODWARD...

SEISMIC HAZARD ZONE REPORT 121
SEISMIC HAZARD ZONE REPORT FOR THE
WOODWARD ISLAND 7.5-MINUTE
QUADRANGLE,
CONTRA COSTA COUNTY, CALIFORNIA
2018
DEPARTMENT OF CONSERVATION
California Geological Survey
STATE OF CALIFORNIA
EDMUND G. BROWN, JR.
GOVERNOR
THE RESOURCES AGENCY
JOHN LAIRD
SECRETARY FOR RESOURCES
DEPARTMENT OF CONSERVATION
DAVID BUNN
DIRECTOR
CALIFORNIA GEOLOGICAL SURVEY
JOHN G. PARRISH, PH.D.
STATE GEOLOGIST

Copyright © 2018 by the California Department of Conservation. All rights reserved. No part of this publication may be reproduced without written consent of the Department of Conservation.
The Department of Conservation makes no warrantees as to the suitability of this product for any particular purpose.

How to view or obtain Earthquake Zones of Required Investigation
California Geological Survey (CGS) maps of Earthquake Zones of Required Investigation, which
include Seismic Hazard Zones, and Earthquake Fault Zones; their related reports, and GIS data
are available for download and online viewing on the CGS’s Information Warehouse: http://
maps.conservation.ca.gov/cgs/informationwarehouse/.
These maps and reports are also available for purchase and reference at the CGS office in
Sacramento at the address presented below, or online at: http://www.conservation.ca.gov/cgs/
information/publications/Pages/ordering.aspx.
All Earthquake Zones of Required Investigation are available as a WMS service here: https://
spatialservices.conservation.ca.gov/arcgis/rest/services/CGS_Earthquake_Hazard_Zones.
This Seismic Hazard Zone Report documents the data and methods used to construct the Seismic
Hazard Zone Map for the 7.5-minute quadrangle evaluated for earthquake-induced liquefaction
and landslide hazards. The information contained in this report should be particularly helpful to
site investigators and local government reviewers of geotechnical reports.
Information regarding the Seismic Hazard Zonation Program with links to the Seismic Hazards
Mapping Act and the Alquist-Priolo Earthquake Fault Zoning Act are available on CGS’
website: http://www.conservation.ca.gov/cgs/shzp/Pages/Index.aspx.
CALIFORNIA GEOLOGICAL SURVEY'S PUBLICATION SALES OFFICE:
Publications and Information Office
801 K Street, MS 14-34
Sacramento, CA 95814-3531
(916) 445-5716


SHZR 121 SEISMIC HAZARD ZONATION OF THE WOODWARD ISLAND QUADRANGLE i
TABLE OF CONTENTS
EXECUTIVE SUMMARY ..................................................................................................... iv THE CALIFORNIA SEISMIC HAZARDS MAPPING PROGRAM .................................... v
SECTION 1: EVALUATION REPORT FOR LIQUEFACTION HAZARD ........................ 1
INTRODUCTION ................................................................................................................ 1 Purpose .............................................................................................................................. 1 Background ........................................................................................................................ 2 Methodology ...................................................................................................................... 2 Scope and Limitations ....................................................................................................... 2
PART I: GEOGRAPHIC AND GEOLOGIC SETTING ........................................................... 3
PHYSIOGRAPHY ................................................................................................................ 3 Location ............................................................................................................................. 3 Land Use ............................................................................................................................ 4
GEOLOGY ........................................................................................................................... 4 Quaternary Sedimentary Deposits ..................................................................................... 5 Geologic Structure ............................................................................................................. 7
ENGINEERING GEOLOGY ............................................................................................... 7 Historic-High Groundwater Mapping ............................................................................... 7 Soil Testing ........................................................................................................................ 9
PART II: LIQUEFACTION HAZARD ASSESSMENT ......................................................... 10
MAPPING TECHNIQUES ................................................................................................ 10 LIQUEFACTION SUSCEPTIBILITY ............................................................................... 11 GROUND SHAKING OPPORTUNITY ............................................................................ 11 LIQUEFACTION ANALYSIS .......................................................................................... 12 ZONATION CRITERIA: LIQUEFACTION ..................................................................... 12 DELINEATION OF SEISMIC HAZARD ZONES: LIQUEFACTION ............................ 13
Areas of Past Liquefaction .............................................................................................. 13 Artificial Fills .................................................................................................................. 13 Areas with Sufficient Existing Geotechnical Data .......................................................... 14 Areas with Insufficient Existing Geotechnical Data ....................................................... 14
ACKNOWLEDGMENTS .................................................................................................. 14 REFERENCES ................................................................................................................... 15
SECTION 2: EVALUATION REPORT FOR EARTHQUAKE-INDUCED LANDSLIDE
HAZARD ............................................................................................................ 19
NO LANDSLIDE HAZARDS ZONED ............................................................................. 19
SECTION 3: GROUND SHAKING ASSESSMENT .............................................................. 20
INTRODUCTION .............................................................................................................. 20 Purpose ............................................................................................................................ 20
PROBABILISTIC SEISMIC HAZARD ANALYSIS MODEL ........................................ 21 APPLICATION TO LIQUEFACTION AND LANDSLIDE HAZARD ASSESSMENT 22 REFERENCES ................................................................................................................... 23

ii CALIFORNIA GEOLOGICAL SURVEY 2018
TABLES
Table 1.1. Correlation chart of Quaternary stratigraphic nomenclatures used in previous studies.
CGS has adopted the nomenclature of Knudsen and others (2000) for Quaternary
mapping in the San Francisco Bay Region. .................................................................. 6
Table 1.2. Liquefaction susceptibility of Quaternary units in the Woodward Island
Quadrangle…………………………………………………………………………...10
PLATES
Plate 1.1. Quaternary Geologic Materials Map and Locations of Boreholes Used in Evaluating
Liquefaction hazard, Woodward Island Quadrangle, California.
Plate 1.2. Depth to Historic-High Groundwater Levels in Quaternary Alluvial Deposits and
Groundwater Measurement Locations, Woodward Island Quadrangle, California.
Plate 3.1. Map of VS30 groups and corresponding geologic units extracted from the state-wide
VS30 map developed by Wills and others (2015), Woodward Island Quadrangle,
California. Qi, intertidal mud; af/Qi, artificial fill over intertidal mud; Qal1,
Quaternary (Holocene) alluvium in areas of low slopes (< 0:5%); Qal2, Quaternary
(Holocene) alluvium in areas of moderate slopes (0.5%–2.0; %); Qal3, Quaternary
(Holocene) alluvium in areas of steep slopes (>2%); Qs, Quaternary (Pleistocene) sand
deposits; Qoa, Quaternary (Pleistocene) alluvium; Tss, tertiary sandstone units.
Plate 3.2. Pseudo-PGA for liquefaction hazard mapping analysis, Woodward Island Quadrangle
and surrounding area, California.
Plate 3.3. Probabilistic peak ground acceleration for landslide hazard mapping analysis,
Woodward Island Quadrangle and surrounding area, California.
Plate 3.4. Modal magnitude for landslide hazard mapping analysis, Woodward Island
Quadrangle and surrounding area, California.

SHZR 121 SEISMIC HAZARD ZONATION OF THE WOODWARD ISLAND QUADRANGLE iii
Release and Revision History: Seismic Hazard Zone Map and
Evaluation Report of the Woodward Island Quadrangle,
SHZR 121
August 17, 2017 Preliminary Map Release
January 11, 2018 Official Map Release

iv CALIFORNIA GEOLOGICAL SURVEY 2018
EXECUTIVE SUMMARY
This report summarizes the methods and sources of information used to prepare the map of
Earthquake Zones of Required Investigation (EZRI) for liquefaction and earthquake-induced
landslides (also referred to as Seismic Hazard Zones) in the Woodward Island 7.5-Minute
Quadrangle, Contra Costa County, California. The topographic quadrangle map, which covers
approximately 152 square kilometers (~59 square miles) in Contra Costa and San Joaquin
Counties, California at a scale of 1:24000 (41.7 mm = 1,000 meters; 1 inch = 2,000 feet),
displays the boundaries of EZRI for liquefaction and earthquake-induced landslides. The area
subject to seismic hazard mapping includes the census designated town of Discovery Bay, parts
of the City of Oakley, unincorporated census-designated places such as Orwood, Bixler, and
Werner; and Contra Costa County and State of California land.
Seismic Hazard Zone maps are prepared by the California Geological Survey (CGS) using
geographic information system (GIS) technology, which allows the manipulation of three-
dimensional data. Information analyzed in these studies includes topography, surface and
subsurface geology, borehole log data, recorded groundwater levels, existing landslide features,
slope gradient, rock-strength measurements, geologic structure, and probabilistic earthquake
shaking estimates. Earthquake ground shaking inputs are based upon probabilistic seismic
hazard maps that depict peak ground acceleration, mode magnitude, and mode distance with a 10
percent probability of exceedance in 50 years.
About 62 square kilometers (24 square miles) of land in the Woodward Island Quadrangle has
been designated EZRI for liquefaction hazard, encompassing all of the Woodward Island delta-
alluvial plain. Borehole logs of test holes drilled in these areas indicate the widespread presence
of near-surface soil layers composed of saturated, loose sandy sediments. Geotechnical tests
indicate that these soils generally have a moderate to high likelihood of liquefying, given the
region is subject to strong ground motion
Within the Woodward Island Quadrangle, no areas have been designated as EZRI for
earthquake-induced landslides. However, the potential for landslides may exist locally,
particularly along streambanks, margins of drainage channels, and similar settings where steep
banks or slopes occur.
City, county, and state agencies are required by the California Seismic Hazards Mapping Act to
use the Seismic Hazard Zone maps in their land-use planning and permitting processes. They
must withhold building permits for sites being developed within EZRI until the geologic and soil
conditions of the project site are investigated and appropriate mitigation measures, if any, are
incorporated into development plans. The Act also requires sellers of real property within these
zones to disclose that fact at the time such property is sold.

SHZR 121 SEISMIC HAZARD ZONATION OF THE WOODWARD ISLAND QUADRANGLE v
THE CALIFORNIA SEISMIC HAZARDS MAPPING PROGRAM
The Seismic Hazards Mapping Act of 1990 (the Act) (Public Resources Code, Chapter 7.8,
Division 2) directs the State Geologist to prepare maps that delineate Seismic Hazard Zones, a
subset of Earthquake Zones of Required Investigation (EZRI), which include Earthquake Fault
Zones. The purpose of the Act is to reduce the threat to public safety and to minimize the loss of
life and property by identifying and mitigating seismic hazards. City, county, and state agencies
are directed to use the Seismic Hazard Zone maps in their land-use planning and permitting
processes. They must withhold development permits for a site within a zone until the geologic
and soil conditions of the project site are investigated and appropriate mitigation measures, if
any, are incorporated into development plans. The Act also requires sellers (and their agents) of
real property within a mapped hazard zone to disclose at the time of sale that the property lies
within such a zone. Evaluation and mitigation of seismic hazards are to be conducted under
guidelines adopted by the California State Mining and Geology Board (SMGB) (California
Geological Survey, 2008). The text of these guidelines is online at: http://www.conservation.ca.
gov/cgs/shzp/webdocs/documents/sp117.pdf.
The Act directs SMGB to appoint and consult with the Seismic Hazards Mapping Act Advisory
Committee (SHMAAC) in developing criteria for the preparation of the Seismic Hazard Zone
maps. SHMAAC consists of geologists, seismologists, civil and structural engineers,
representatives of city and county governments, the state insurance commissioner and the
insurance industry. In 1991, the SMGB adopted initial criteria for delineating Seismic Hazard
Zones to promote uniform and effective statewide implementation of the Act. These initial
criteria, which were published in 1992 as California Geological Survey (CGS) Special
Publication 118, were revised in 2004. They provide detailed standards for mapping regional
liquefaction and landslide hazards. The Act also directed the State Geologist to develop a set of
probabilistic seismic maps for California and to research methods that might be appropriate for
mapping earthquake-induced landslide hazards.
In 1996, working groups established by SHMAAC reviewed the prototype maps and the
techniques used to create them. The reviews resulted in recommendations that 1) the process for
zoning liquefaction hazards remain unchanged and 2) earthquake-induced landslide zones be
delineated using a modified Newmark analysis. In April 2004, significant revisions of
liquefaction zone mapping criteria relating to application of historic-high groundwater level data
in desert regions of the state were adopted by the SMGB. These modifications are reflected in
the revised CGS Special Publication 118, which is available on online at: http://www.
conservation.ca.gov/cgs/shzp/webdocs/documents/sp118_revised.pdf.
This Seismic Hazard Zone Report summarizes the development of the Seismic Hazard Zone for
the Woodward Island 7.5-Minute Quadrangle. The process of zonation for liquefaction hazard
involves an evaluation of Quaternary geologic maps, groundwater level records, and subsurface
geotechnical data. The process of zonation for earthquake-induced landslide hazard incorporates
evaluations of earthquake loading, existing landslides, slope gradient, rock strength, and geologic
structure. Ground motion calculations used by CGS exclusively for regional zonation
assessments are currently based on the probabilistic seismic hazard analysis (PSHA) model
developed by USGS for the 2014 Update of the United States National Seismic Hazard Maps
(NSHMs).


SHZR 121 SEISMIC HAZARD ZONATION OF THE WOODWARD ISLAND QUADRANGLE 1
SECTION 1: EVALUATION REPORT FOR
LIQUEFACTION HAZARD
in the
WOODWARD ISLAND 7.5-MINUTE QUADRANGLE,
CONTRA COSTA COUNTY, CALIFORNIA
by
Eleanor R. Spangler
P.G. 9440
DEPARTMENT OF CONSERVATION
CALIFORNIA GEOLOGICAL SURVEY
INTRODUCTION
Purpose
The Seismic Hazards Mapping Act of 1990 (the Act) (Public Resources Code, Division 2,
Chapter 7.8) directs the California State Geologist to compile maps that identify Seismic Hazard
Zones consistent with requirements and priorities established by the California State Mining and
Geology Board (SMGB) (CGS, 2004). The text of this report is available online at: http://www.
conservation.ca.gov/cgs/shzp/webdocs/documents/sp118_revised.pdf.
The Act requires that site-specific geotechnical investigations be performed for most urban
development projects situated within Seismic Hazard Zones before lead agencies can issue the
building permit. The Act also requires sellers of real property within these zones to disclose that
fact at the time such property is sold. Evaluation and mitigation of seismic hazards are to be
conducted under guidelines adopted by the California SMGB (CGS, 2008). The text of this
report is online at: http://www.conservation.ca.gov/cgs/shzp/webdocs/documents/sp117.pdf.
Following the release of the SMGB Guidelines, local government agencies in the Los Angeles
metropolitan region sought more definitive guidance in the review of geotechnical investigations
addressing liquefaction hazard. The agencies made their request through the Geotechnical
Engineering Group of the Los Angeles Section of the American Society of Civil Engineers
(ASCE). This group convened an implementation committee under the auspices of the Southern
California Earthquake Center (SCEC). The committee, which consisted of practicing
geotechnical engineers and engineering geologists, released an overview of the practice of
liquefaction analysis, evaluation, and mitigation techniques (SCEC, 1999).
This section of the evaluation report summarizes seismic hazard zone mapping for potentially
liquefiable soils in the Woodward Island Quadrangle. Section 2 (addressing earthquake-induced
landslide hazard) and Section 3 (addressing ground shaking potential) complete the evaluation
report, which is one of a series that summarizes seismic hazard zone mapping by California
Geological Survey (CGS) in developing areas of the state where there is potential for strong

2 CALIFORNIA GEOLOGICAL SURVEY 2018
ground motion (Smith, 1996). Additional information on seismic hazards zone mapping in
California can be accessed online at: http://www.conservation.ca.gov/cgs/shzp/
Background
Liquefaction-induced ground failure historically has been a major cause of earthquake damage in
northern California. During the 1989 Loma Prieta and 1906 San Francisco earthquakes,
significant damage to roads, utility pipelines, buildings, and other structures in the San Francisco
Bay area was caused by liquefaction-induced ground displacement.
Localities most susceptible to liquefaction-induced damage are underlain by loose, water-
saturated, granular sediment within 40 feet of the ground surface. These geological and
groundwater conditions are widespread in the San Francisco Bay region, most notably in some
densely populated valley regions and alluviated floodplains. In addition, the potential for strong
earthquake ground shaking is high because of the many nearby active faults. The combination of
these factors constitutes a significant seismic hazard for much of the San Francisco Bay region,
including areas within the Woodward Island Quadrangle.
Methodology
CGS’s evaluation of liquefaction potential and preparation of Seismic Hazard Zone maps require
the collection, compilation, and analysis of geotechnical information and map data. The data are
processed into a series of geographic information system (GIS) layers using commercially
available software. In brief, project geologists complete the following principal tasks to generate
a Seismic Hazard Zone map for liquefaction potential:
Compile digital geologic maps to delineate the spatial distribution of Quaternary sedimentary
deposits.
Collect geotechnical borehole log data from public agencies and engineering geologic
consultants.
Enter borehole log data into the GIS.
Generate digital cross sections to evaluate the vertical and lateral extent of Quaternary
deposits and their lithologic and engineering properties.
Evaluate and digitize historic-high groundwater levels in areas containing Quaternary
deposits.
Characterize expected earthquake ground motion, also referred to as ground-shaking
opportunity (see Section 3 of this report).
Perform quantitative analyses of geotechnical and ground motion data to assess the
liquefaction potential of Quaternary deposits.
Synthesize, analyze, and interpret above data to create maps delineating Earthquake Zones of
Required Investigation according to criteria adopted by the SMGB (CGS, 2004).
Scope and Limitations
Evaluation for potentially liquefiable soils generally is confined to areas covered by Quaternary
(less than about 2.6 million years) sedimentary deposits. Such areas within the Woodward Island
Quadrangle consist mainly of the Sacramento-San Joaquin Delta-alluvial plain. CGS’s
liquefaction hazard evaluations are based on information on earthquake ground shaking, surface

SHZR 121 SEISMIC HAZARD ZONATION OF THE WOODWARD ISLAND QUADRANGLE 3
and subsurface lithology, geotechnical soil properties, and groundwater depth, which is gathered
from various sources. Although selection of data used in this evaluation was rigorous, the
quality of the data used varies. The State of California and the Department of Conservation
make no representations or warranties regarding the accuracy of the data obtained from outside
sources.
Seismic Hazard Zones for liquefaction are intended to prompt more detailed, site-specific
geotechnical investigations, as required by the Act. As such, these zone maps identify areas
where the potential for liquefaction is relatively high. They do not predict the amount or
direction of liquefaction-related ground displacements, or the amount of damage to facilities that
may result from liquefaction. Factors that control liquefaction-induced ground failure are the
extent, depth, density, and thickness of liquefiable materials, depth to groundwater, rate of
drainage, slope gradient, proximity to free faces, and intensity and duration of ground shaking.
These factors must be evaluated on a site-specific basis to assess the potential for ground failure
at any given project site.
This section of the report is presented in two parts. Part I addresses the geographic and geologic
setting of the study area while Part II documents the data and parameters used to evaluate
liquefaction hazard and to delineate Seismic Hazard Zones for liquefaction in the Woodward
Island Quadrangle.
PART I: GEOGRAPHIC AND GEOLOGIC SETTING
PHYSIOGRAPHY
Location
The Woodward Island Quadrangle covers an area of approximately 152 square kilometers (59
square miles) in Contra Costa and San Joaquin counties, California. The center of the quadrangle
is about 65 kilometers (40 miles) northeast of the City of San Francisco Civic Center and about
71 kilometers (44 miles) south-southwest of the City of Sacramento Civic Center. The portion of
the quadrangle evaluated for this report includes approximately 69 square kilometers (26 square
miles) in the western half of the quadrangle that lies within Contra Costa County. This evaluated
area includes less than one square kilometers of the City of Oakley and 25 square kilometers (9
square miles) of the census-designated town of Discovery Bay. The remainder of the map area
consists of unincorporated census-designated places such as Orwood, Bixler, and Werner; and
Contra Costa County and State of California land.
The quadrangle is situated on the western edge of the Sacramento-San Joaquin Delta within the
western portion of the Great Valley Geomorphic Province. The study area is characterized by
Sacramento-San Joaquin Delta-alluvial plain deposits. Small, low relief, isolated sand dunes dot
the central part of the map area and transition northward into a larger northwest-southeast
oriented sand dune plain that occupies the northwestern part of the Woodward Island
Quadrangle. Most of the uninterrupted flatland in the study area is located in the southern part of
the map area and between the isolated sand dunes.
Six leveed tracts and islands occupy the map area, including Holland Tract (island), Veale Tract,
Orwood - Palm Tracts (islands), Hotchkiss Tract, and Byron Tract. These tracts and islands are
separated from each other by several delta waterways, such as rivers, sloughs, and canals. Rivers
and streams within the quadrangle include Old River and Kellogg Creek. Old River trends north-
south across the entire length of the Woodward Island Quadrangle, and defines the eastern

4 CALIFORNIA GEOLOGICAL SURVEY 2018
boundary of the study area. Kellogg Creek begins in the foothills of the Diablo range south of the
map area, and drains into Discovery Bay in the southern part of the quadrangle. Sloughs within
the Woodward Island Quadrangle include Sand Mound Slough, Rock Slough, and Indian Slough.
Man-made canals traversing the map area include, the north-south trending Werner Dredger Cut,
east-west trending Mokelumne Aqueduct, and a series of small, unnamed canals that dissect the
islands and tracts. Elevations in the map area range from -4 meters (-15 feet) along the north-
central quadrangle boundary on Holland Tract, to 7 meters (23 feet) along the western boundary
of the map area near Discovery Bay.
Land Use
Most of the Woodward Island Quadrangle is located within the Sacramento-San Joaquin River
Delta. The Sacramento-San Joaquin Delta is the largest estuarine system on the west coast of
North America and receives runoff from about 40 percent of the land area of California and 50
percent of California’s total stream flow (Ingebritsen, 2000). In the early 1800’s, most of the
Woodward Island Quadrangle consisted of marshy wetlands, channels, and delta islands with
low natural levees flanking marshy interiors that flooded intermittently with the seasons and
tides. Beginning in the 1870’s large scale efforts were undertaken to reclaim parts of the delta for
agricultural purposes. The first levees on Byron Tract, Holland Tract, Veale Tract, Orwood –
Palm Tracts, and Hotchkiss Tract were completed in 1870, 1875 1900, 1902, and 1909
respectively (Thompson, 2006) and the modern-day levee and drainage systems were largely
completed by 1930 (Ingebritsen and others, 2000).
Since the reclamation of Byron Tract, Veale Tract, Palm-Orwood Tracts, and Holland tract, land
use in the map area historically was dominated by agriculture. However, in 1968 the community
of Discovery Bay was developed in the Byron Tract and what was once rural, unincorporated
land in the southwestern part of the Woodward Island Quadrangle was developed, mainly as
homes, golf courses, and shopping centers. Since 2000, the population of Discovery Bay has
nearly doubled in size and development of rural, unincorporated areas is expected to continue in
the coming years. More than three-quarters of the study area remains undeveloped, consisting
primarily of orchards and agriculture, and recreational area.
The primary transportation route in the study area is California State Route 4, which trends east-
west across the southern part of the quadrangle and connects the town of Discovery Bay with the
cities of Stockton and Brentwood. The Atchison Topeka and Santa Fe Railroad runs east-west
through the central part of the map area. In the east-central part of the map area, Orwood Road,
Balfour Road, Marsh Creek Road, and Point of Timber Road, are major east-west rural roads
connecting the town of Discovery Bay with Knightsen and Brentwood. Bixler Road is the only
major north-south rural road in the study area, connecting Orwood Road in the north with
California State Route 4 in the south. A network of small, private roads provide access to crops,
pumping stations, and levees on Byron Tract, Veale Tract, Palm-Orwood Tracts, and Holland
Tract. Access to undeveloped areas within the quadrangle is primarily by paved county roads and
paved and unpaved private roads in the northern half of the quadrangle.
GEOLOGY
Geologic units generally susceptible to liquefaction include latest Pleistocene and Holocene
alluvial and fluvial sedimentary deposits, and artificial fill. The primary source of geologic
mapping used in the evaluation of these materials for the Woodward Island Quadrangle is the
CGS preliminary geologic map digital database of the Stockton 30’ x 60’ Quadrangle (Dawson,
SHZR 121 SEISMIC HAZARD ZONATION OF THE WOODWARD ISLAND QUADRANGLE 5
2010). This geologic map was compiled from geologic mapping by Witter and others (2006),
Knudsen and others (2000), Knudsen and Lettis (1997), Graymer and others (1994 and 1996),
and Bartow (1985). Other geologic maps and reports reviewed in this investigation include
Atwater (1982) and Helley and Graymer (1997). The Quaternary geologic unit nomenclature
used by CGS for mapping in the San Francisco Bay Region was adopted from Knudsen and
others (2000). Table 1.1 compares stratigraphic nomenclature used by CGS with nomenclature
used by several previous studies performed in northern California.
The digital geologic maps covering the Woodward Island Quadrangle were combined to form a
single, 1:24,000-scale, geologic materials map. CGS staff used DEMs, aerial photos, online
imagery, and limited field reconnaissance to modify boundaries, confirm the location of geologic
contacts, map recently modified ground surfaces, observe properties of near-surface deposits,
and characterize the surface expression of individual geologic units. Linear structural features
such as folds, faults, and anticlines are not included in the geologic materials map. The
distribution of Quaternary deposits on the final geologic materials map (summarized on Plate
1.1) was used in combination with other data, discussed below, to evaluate liquefaction
susceptibility and develop the Seismic Hazard Zone Map.
Approximately 62 km2 (24 mi 2) of the Woodward Island Quadrangle is covered by Quaternary
sediments, all of which are latest Pleistocene to Holocene in age. In total, 5 different Quaternary
units are mapped in the Woodward Island Quadrangle (Plate 1.1). These sedimentary units are
summarized in Table 1.1 and discussed below. The liquefaction susceptibility evaluation and
development of the Seismic Hazard Zone Map for the quadrangle was based on the distribution
of these deposits at a scale of 1:24,000 (Plate 1.1) and analyses of associated geotechnical data as
discussed under the Engineering Geology heading of this section.
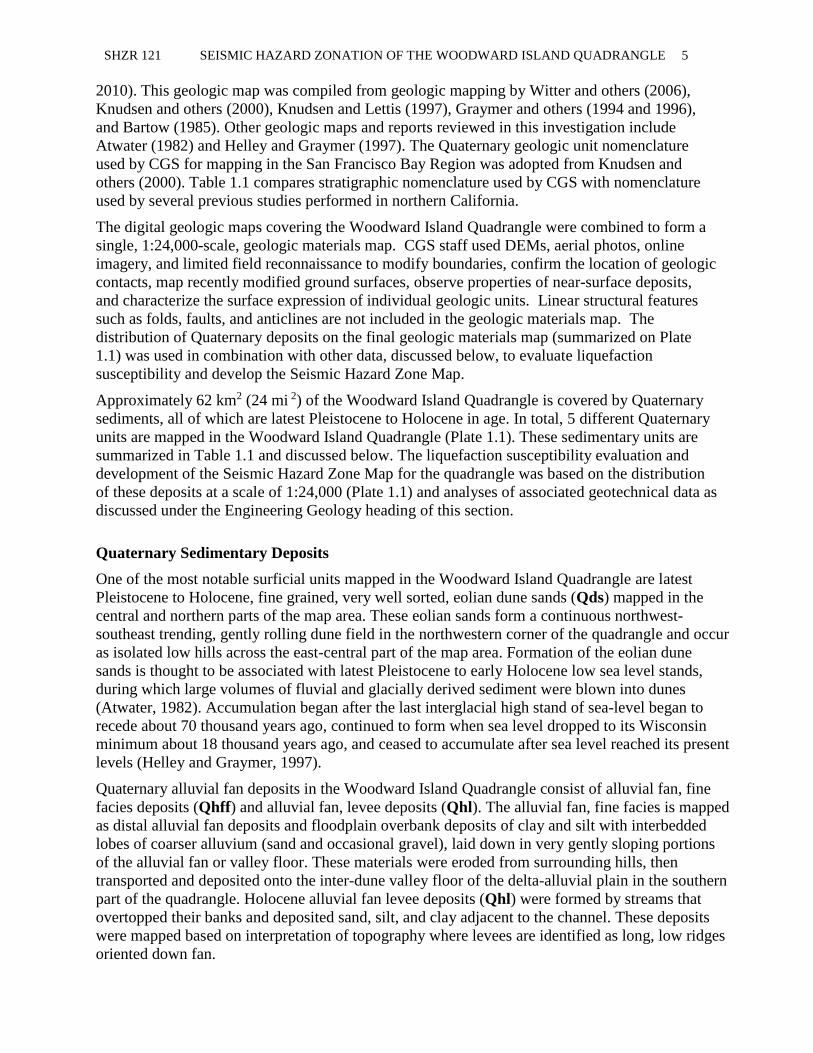
Quaternary Sedimentary Deposits
One of the most notable surficial units mapped in the Woodward Island Quadrangle are latest
Pleistocene to Holocene, fine grained, very well sorted, eolian dune sands (Qds) mapped in the
central and northern parts of the map area. These eolian sands form a continuous northwest-
southeast trending, gently rolling dune field in the northwestern corner of the quadrangle and occur
as isolated low hills across the east-central part of the map area. Formation of the eolian dune
sands is thought to be associated with latest Pleistocene to early Holocene low sea level stands,
during which large volumes of fluvial and glacially derived sediment were blown into dunes
(Atwater, 1982). Accumulation began after the last interglacial high stand of sea-level began to
recede about 70 thousand years ago, continued to form when sea level dropped to its Wisconsin
minimum about 18 thousand years ago, and ceased to accumulate after sea level reached its present
levels (Helley and Graymer, 1997).
Quaternary alluvial fan deposits in the Woodward Island Quadrangle consist of alluvial fan, fine
facies deposits (Qhff) and alluvial fan, levee deposits (Qhl). The alluvial fan, fine facies is mapped
as distal alluvial fan deposits and floodplain overbank deposits of clay and silt with interbedded
lobes of coarser alluvium (sand and occasional gravel), laid down in very gently sloping portions
of the alluvial fan or valley floor. These materials were eroded from surrounding hills, then
transported and deposited onto the inter-dune valley floor of the delta-alluvial plain in the southern
part of the quadrangle. Holocene alluvial fan levee deposits (Qhl) were formed by streams that
overtopped their banks and deposited sand, silt, and clay adjacent to the channel. These deposits
were mapped based on interpretation of topography where levees are identified as long, low ridges
oriented down fan.

6 CALIFORNIA GEOLOGICAL SURVEY 2018
Quaternary delta mud and peat deposits (Qhdm) along the western banks of Old River in the
northern part of the Woodward Island Quadrangle. These deposits consist of low bulk density silt,
clay, and peat with minor sand deposited at or near sea level in the Sacramento-San Joaquin Delta
that is presently, or was once tidal marsh. Delta mud and peat deposits generally occupy historical
lowlands (tidal wetlands and waterways) that are now dry because of the construction of sloughs
and levees. Much of the area mapped as Sacramento-San Joaquin Delta mud and peat is now
below sea level because of historical subsidence and deflation of now unsaturated marsh surfaces
(Knudsen and others, 2000). Delta mud is late Holocene in age with many areas still subject to
modern deposition and flooding if levees are breeched.
Holocene floodplain deposits (Qhfp) are mapped along the banks of Old River in the central part
of the study area and are younger than and lap onto the Holocene eolian dune sands (Qds). These
deposits include abandoned oxbows, channels and interdistributary basins, flood basins and basin
rims, distal alluvial fans, and low natural levees adjacent to the San Joaquin River. Floodplain
deposits generally slope downstream at low gradients parallel to the San Joaquin River and consist
of sandy to silty clay with lenses of silt, sand, and pebbles.
Table 1.1. Correlation chart of Quaternary stratigraphic nomenclatures used in previous
studies. CGS has adopted the nomenclature of Knudsen and others (2000) for Quaternary
mapping in the San Francisco Bay Region.
Geologic Unit CGS GIS
Database
Helley &
Graymer
(1997)
Knudsen &
Others
(2000)
Atwater
(1982)
Artificial Fill af af af
Artificial Levee Fill alf af af
Artificial Fill Over Bay
Mud afbm af afbm
Holocene Floodplain
Deposits Qhfp Qhpm Qhfp Qfp
Holocene Sacramento-San
Joaquin Delta Mud and Peat Qhdm Qhpm Qhdm Qpm
Holocene Alluvial Fan
Levee Deposits Qhl Qhl Qhl Qymc
Holocene Alluvial Fan
Deposits, Fine Facies Qhff Qhb Qhff Qymc
Latest Pleistocene to
Holocene Dune Sand Qds Qds Qds Qm2e

SHZR 121 SEISMIC HAZARD ZONATION OF THE WOODWARD ISLAND QUADRANGLE 7
Geologic Structure
The structural framework of the Woodward Island Quadrangle is governed by the series of sub-
parallel, gently northwest-striking faults ranging in age from Mesozoic to present time that
shaped the Diablo Range (Wentworth and others, 1999). Movement on these faults has resulted
in the current transpressional tectonic regime characterized by horizontal northeast-southwest
maximum compression, that has uplifted Mount Diablo and folded the surrounding rocks over
the last 4 million years into the Mount Diablo Anticline (Schemmann, Unruh and Moores, 2007).
Bedrock units on the northeast flank of the Mount Diablo anticline are exposed 2 kilometers (1.2
miles) southwest of the map area where they dip towards the northeast below the Woodward
Island Quadrangle, buried by tens to hundreds of meters of alluvial and deltaic deposits (LHSC,
2012).
One fault is mapped within the Woodward Island Quadrangle. The pre-Quaternary Midland
Fault Zone trends north-south along the western quadrangle boundary and is inferred in alluvial
deposits (Bryant and Cluett, 2002; Dawson, 2010; and Schemmann and others, 2007). No active
faults are mapped in the Woodward Island Quadrangle by the California Geological Survey
under the Alquist-Priolo Earthquake Fault Zoning Act.
ENGINEERING GEOLOGY
As stated above, soils generally susceptible to liquefaction are late Quaternary alluvial and
fluvial sedimentary deposits and non-engineered artificial fill. Deposits that contain saturated
loose sandy and silty soils are the most susceptible to liquefaction. Lithologic descriptions and
soil test results reported in geotechnical borehole logs provide valuable information regarding
subsurface geology, groundwater levels, and the engineering characteristics of sedimentary
deposits.
Historic-High Groundwater Mapping
Saturated soil conditions are required for liquefaction to occur, and the susceptibility of a soil to
liquefaction varies with the depth to groundwater. Saturation reduces the effective normal stress
of near-surface sediment, thereby increasing the likelihood of earthquake-induced liquefaction
(Youd, 1973). CGS compiles and interprets current and historical groundwater data to identify
areas characterized by, or anticipated to have in the future, near-surface saturated soils. For
purposes of seismic hazard zonation, "near-surface" means at a depth less than 40 feet.
Natural hydrologic processes and human activities can cause groundwater levels to fluctuate over
time. Therefore, it is impossible to predict depths to saturated soils during future earthquakes.
One method of addressing time-variable depth to saturated soils is to establish an anticipated
high groundwater level based on historical groundwater data. In areas where groundwater is
either currently near-surface or could return to near-surface levels within a land-use planning
interval of 50 years, CGS constructs regional contour maps that depict these anticipated historic-
high groundwater levels. Plate 1.2 depicts areas characterized by present or anticipated historic-
high groundwater elevation surface levels within the Woodward Island Quadrangle.
Groundwater Data
The study area is within the northwestern-most part of the California Department of Water
Resources (DWR) designated San Joaquin Valley Groundwater Basin, Tracy Subbasin
(Groundwater Subbasin Number 5-22.15), and is included in the San Joaquin River Hydrologic
Region (DWR, 2003). Watersheds within the Woodward Island Quadrangle include the Dutch

8 CALIFORNIA GEOLOGICAL SURVEY 2018
Slough – Big Break, Jersey Island – Taylor Slough, and Lower Kellogg Creek watersheds
(USGS, 2015). For this study, groundwater mapping was performed for the valley and flatland
regions of these watersheds that are subject to liquefaction zonation in order estimate depths to
saturated materials.
Groundwater conditions were evaluated based on first encountered water levels noted in
geotechnical boring logs, online groundwater databases, groundwater monitoring reports, and
water well drilling logs. Geotechnical borehole logs were acquired from the City of Oakley
planning department, the California Department of Transportation (CalTrans), and a previous
CGS liquefaction study in the Delta Region (Real and Knudsen, 2010). Additional water level
data were collected from the State Water Resources Control Board (SWRCB), California
Department of Water Resources (DWR), the United States Geological Survey (USGS), and local
water districts and agencies.
Groundwater data from all available records were spatially and temporally evaluated in a GIS
database to constrain the estimate of historically shallowest groundwater for the project area. CGS
created a historic-high groundwater surface map for the northwestern most part of the Tracy
Subbasin based on available well records and data from previous hydrologic studies. This map
was modified, where warranted, with input from current ground-surface water, such as active
creeks, recharge ponds, detention basins, and water impoundments. The depth to groundwater
contours depicted on Plate 1.2 do not represent present-day conditions, as usually presented on
typical groundwater contour maps, but rather the historic-high groundwater levels for the
northwestern part of the Tracy Subbasin.
Water level data evaluated in this study represents more than 150 groundwater measurements
(Plate 1.2) collected from the late 1960’s through the present, with most records representing
conditions of the 2000’s. Review of hydrographs of wells in the map area indicate that, except for
seasonal variation resulting from recharge and pumping, the majority of water levels in wells have
remained relatively stable over at least the last 10 years (DWR, 2003).
Groundwater Levels
Water-bearing materials in the northwestern Tracy Subbasin include continental deposits of late
Tertiary to Quaternary age, flood-basin deposits, and Pleistocene to Holocene alluvium (DWR,
2003). Groundwater levels in these deposits are influenced in part by natural groundwater
recharge resulting from direct precipitation and annual runoff in creeks and streams (DWR,
2003; USGS, 2015). However, groundwater levels in the Woodward Island Quadrangle are also
influenced by tides, variable rates of pumping (fresh water exports), and other artificial sources
of groundwater recharge such as canal seepage, irrigation return flows, urban landscaping runoff,
and agricultural tail water. In general, groundwater flow in the map area is towards the east-
northeast, flowing from alluvial valleys in the foothills of Mount Diablo, across the delta-alluvial
plain towards the San Joaquin River Delta. However, fresh water pumping operations can cause
the normally tidally averaged flow in Old River and other adjacent delta channels to change
course and flow towards Clifton Court Forebay and Banks Pumping Plant in the south (Arthur
and others, 1996; Monsen and others, 2007; Grimaldo and others, 2009).
Historic-high groundwater depths in the Woodward Island Quadrangle vary from 0 feet in the low
lying eastern and northern portion of the map area, to nearly 15 feet below ground surface along
the west central boundary of the quadrangle where ground surface elevation is highest. Depth to
historic-high groundwater in the Woodward Island Quadrangle is a function of its location within
the San Joaquin River Delta and low ground surface elevation.

SHZR 121 SEISMIC HAZARD ZONATION OF THE WOODWARD ISLAND QUADRANGLE 9
Prior to delta land reclamation, the delta islands and tracts in the map area flooded intermittently
with the seasons and tides. Levees constructed in the late 1800’s now protect these low lying areas
from intermittent flooding. However, reclamation and agriculture have led to subsidence of the
land surface in the delta part of the study area. The primary cause of this land subsidence is
decomposition of organic carbon in the peat deposits of the delta mud and peat surficial unit
(Qhdm). Islands that were originally near sea level are now well below sea level, and large areas
of many islands, such as Holland Tract, are now up to 15 feet below sea level. The land surface
profile of many islands in the delta is somewhat saucer-shaped, because subsidence is greater in
the thick peat soils near their interior than in the more mineral-rich soils near their perimeter
(Ingebritsen, 2000). Because of low ground surface elevation, numerous pump stations are used to
prevent flooding of the delta reclaimed land through pumping drainage returns (seepage through
levees, precipitation, unconsumed irrigation water, and surface-water withdrawals) off the land
into adjacent channels (Ingebritsen, 2000).
Due to historical records of flooding on the delta islands and tracts and water level measurements
indicating groundwater has been between 0 and 6 feet below ground surface for more than 50
years, low lying areas in the eastern and northern parts of the quadrangle have been assigned
historic-high groundwater levels of 0 feet below ground surface.
Soil Testing
For this investigation, borehole logs were collected from the files of the City of Oakley,
California Department of Transportation, and previous CGS studies. Borehole logs that report
the results of downhole standard penetration tests (SPT) in alluvial materials are of particular
value in liquefaction evaluations because the standard penetration test provides a standardized
measure of the penetration resistance of soil and, therefore, is used as an index of soil density.
For this reason, SPT results are also a critical component of the Seed-Idriss Simplified
Procedure, a method used by CGS and the geotechnical community to quantitatively analyze
liquefaction potential of sandy and silty material (see Liquefaction Analysis in Part II of this
report). SPT is an in-field test that is based on counting the number of blows required to drive a
split-spoon sampler (1.375-inch inside diameter) one foot into the soil. The driving force is
provided by dropping a 140-pound hammer weight a distance of 30 inches. The SPT method is
formally defined and specified by the American Society for Testing and Materials in test method
D1586 (American Society for Testing and Materials, 2004). Recorded blow counts for non-SPT
geotechnical sampling where the sampler diameter, hammer weight or drop distance differs from
that specified for an SPT (ASTM D1586), are converted to SPT-equivalent blow counts, if
reliable conversions can be made. The actual and converted SPT blow counts are normalized to
a common reference, effective-overburden pressure of one atmosphere (approximately 1 ton per
square foot) and a hammer efficiency of 60 percent using a method described by Seed and Idriss
(1982) and Seed and others (1985). This normalized blow count is referred to as (N1)60.
Geotechnical borehole logs provide information on lithologic and engineering characteristics of
Quaternary deposits the study area. The characteristics reported in Table 1.2 summarize
conditions in the Woodward Island Quadrangle.
Data from 5 borehole logs were entered into the CGS geotechnical GIS database and an additional
158 borehole logs from a previous CGS Sacramento-San Joaquin Delta area liquefaction study
were evaluated (Real and Knudsen, 2010) during the course of this study. Of the 163 geotechnical
borehole logs analyzed in this study (Plate 1.3), most included blow-count data from SPTs or from
penetration tests that allow reasonable blow count conversions to SPT-equivalent values. Few of
the borehole logs collected, however, include all of the information (e.g. soil density, moisture

10 CALIFORNIA GEOLOGICAL SURVEY 2018
content, sieve analysis, etc.) required for an ideal analysis using the Seed-Idriss Simplified
Procedure. For boreholes having acceptable penetration tests, liquefaction analysis is performed
using either recorded density, moisture, and sieve test values or using averaged test values of
similar materials.
The Seed-Idriss Simplified Procedure for liquefaction evaluation was developed primarily for
clean sand and silty sand. As described above, results depend greatly on accurate evaluation of
in-situ soil density as measured by the number of soil penetration blow counts using an SPT
sampler. However, borehole logs show that Holocene alluvial layers containing gravel are
present in the subsurface of the Brentwood alluvial plain. In the past, gravel and gravelly
materials were considered not to be susceptible to liquefaction because the high permeability of
these soils presumably would allow the dissipation of pore pressures before liquefaction could
occur. However, liquefaction in gravel has, in fact, been reported during earthquakes and recent
laboratory studies have confirmed the phenomenon (Ishihara, 1985; Harder and Seed, 1986;
Budiman and Mohammadi, 1995; Evans and Zhou, 1995; and Sy and others, 1995). SPT-
derived density measurements in gravelly soils are unreliable and generally artificially high.
They are likely to lead to over-estimation of the density of the soil and, therefore, result in an
underestimation of the liquefaction susceptibility. To identify potentially liquefiable units where
blow counts appear to have been affected by gravel content, correlations are made with
boreholes in the same unit where the tests do not appear to have been affected by gravel content.
Table 1.2. Liquefaction susceptibility of Quaternary units in the Woodward Island
Quadrangle.
PART II: LIQUEFACTION HAZARD ASSESSMENT
MAPPING TECHNIQUES
Liquefaction may occur in water-saturated sediment during moderate to great earthquakes.
When this occurs, sediment loses strength and may fail, causing damage to buildings, bridges,
and other structures. Many methods for mapping liquefaction hazard have been proposed. Youd
(1991) highlights the principal developments and notes some of the widely used criteria. Youd
and Perkins (1978) demonstrate the use of geologic criteria as a qualitative characterization of
liquefaction susceptibility and introduce the mapping technique of combining a liquefaction
Geologic Map
Unit Age
Sediment/Material
Type Consistency
Liquefaction
Susceptibility*
af, alf, afbm Late Holocene Sand, silt, gravel, concrete Loose to dense Yes
Qhfp Holocene Clay, silt, sand, pebbles Loose to dense Yes
Qhdm Holocene Silt, clay, peat, sand Loose to medium dense Yes
Qhff Holocene Silt, clay, sand, gravel Loose to medium dense Yes
Qhl Holocene Sand, silt, clay Loose Yes
Qds Holocene and latest
Pleistocene Sand Loose to dense Yes
*When saturated

SHZR 121 SEISMIC HAZARD ZONATION OF THE WOODWARD ISLAND QUADRANGLE 11
susceptibility map and a liquefaction opportunity map to produce a liquefaction potential map.
Liquefaction susceptibility is a function of the capacity of sediment to resist liquefaction,
whereas liquefaction opportunity is a function of potential seismic ground shaking intensity.
The method applied in this study to evaluate liquefaction potential is similar to that Tinsley and
others (1985) used to map liquefaction hazards in the Los Angeles region. These investigators,
in turn, applied a combination of the techniques developed by Seed and others (1983) and Youd
and Perkins (1978). CGS’s method combines geotechnical analyses, geologic and hydrologic
mapping, and probabilistic earthquake shaking estimates employing criteria adopted by the
California State Mining and Geology Board (CGS, 2004).
LIQUEFACTION SUSCEPTIBILITY
Liquefaction susceptibility reflects the relative resistance of a soil to loss of strength when
subjected to ground shaking. Physical properties of soil such as sediment grain-size distribution,
compaction, cementation, saturation, and depth from the surface govern the degree of resistance
to liquefaction. Some of these properties can be correlated to a sediment’s geologic age and
environment of deposition. With increasing age, relative density may increase through
cementation of the particles or compaction caused by the weight of the overlying sediment.
Grain-size characteristics of a soil also influence susceptibility to liquefaction. Sand is more
susceptible than silt or gravel, although silt of low plasticity is treated as liquefiable in this
investigation. Cohesive soils generally are not considered susceptible to liquefaction. Such soils
may be vulnerable to strength loss with remolding and represent a hazard that is not specifically
addressed in this investigation. Soil characteristics that result in higher measured penetration
resistances generally indicate lower liquefaction susceptibility. In summary, soils that lack
resistance (susceptible soils) typically are saturated, loose, and granular. Soils resistant to
liquefaction include all soil types that are dry, cohesive, or sufficiently dense.
CGS’s inventory of areas containing soils susceptible to liquefaction begins with evaluation of
historical occurrences of liquefaction, geologic maps, cross-sections, geotechnical test data,
geomorphology, and groundwater hydrology. Soil properties and soil conditions such as type,
age, texture, color, and consistency, along with historic-high depths to groundwater are used to
identify, characterize, and correlate susceptible soils. Because Quaternary geologic mapping is
based on observable similarities between soil units, liquefaction susceptibility maps typically are
often similar to Quaternary geologic maps, depending on local groundwater levels. CGS’s
qualitative relations among susceptibility, geologic map unit, and depth to groundwater are
summarized in Table 1.2.
Due to shallow historic-high groundwater levels in the Woodward Island Quadrangle, all
Holocene materials are highly susceptible to liquefaction. Such Holocene materials include
alluvial fan, fine facies deposits (Qhff), alluvial fan, levee deposits (Qhl), Sacramento-San
Joaquin Delta Mud and Peat deposits (Qhdm), eolian dune sands (Qds), and floodplain deposits
(Qhfp).
GROUND SHAKING OPPORTUNITY
Ground shaking opportunity is a calculated measure of the intensity and duration of strong
ground motion normally expressed in terms of peak horizontal ground acceleration
(PGA). Ground motion calculations used by CGS exclusively for regional liquefaction zonation
assessments are currently based on the probabilistic seismic hazard analysis (PSHA) model
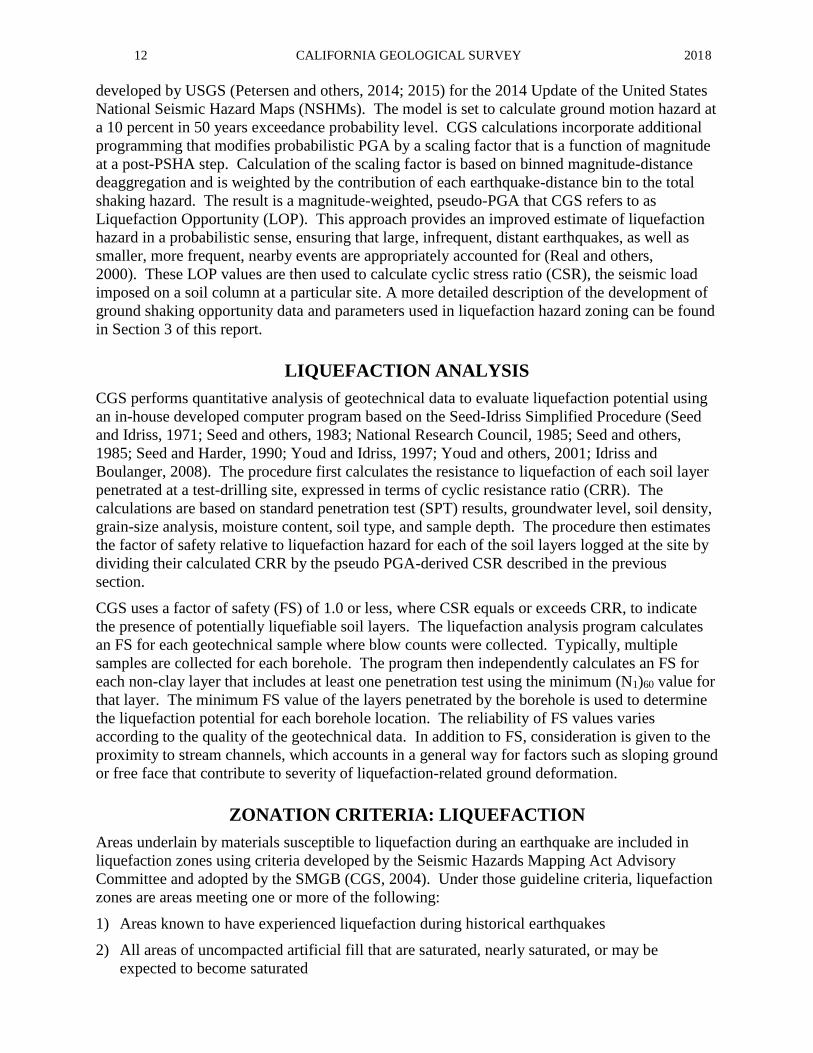
12 CALIFORNIA GEOLOGICAL SURVEY 2018
developed by USGS (Petersen and others, 2014; 2015) for the 2014 Update of the United States
National Seismic Hazard Maps (NSHMs). The model is set to calculate ground motion hazard at
a 10 percent in 50 years exceedance probability level. CGS calculations incorporate additional
programming that modifies probabilistic PGA by a scaling factor that is a function of magnitude
at a post-PSHA step. Calculation of the scaling factor is based on binned magnitude-distance
deaggregation and is weighted by the contribution of each earthquake-distance bin to the total
shaking hazard. The result is a magnitude-weighted, pseudo-PGA that CGS refers to as
Liquefaction Opportunity (LOP). This approach provides an improved estimate of liquefaction
hazard in a probabilistic sense, ensuring that large, infrequent, distant earthquakes, as well as
smaller, more frequent, nearby events are appropriately accounted for (Real and others,
2000). These LOP values are then used to calculate cyclic stress ratio (CSR), the seismic load
imposed on a soil column at a particular site. A more detailed description of the development of
ground shaking opportunity data and parameters used in liquefaction hazard zoning can be found
in Section 3 of this report.
LIQUEFACTION ANALYSIS
CGS performs quantitative analysis of geotechnical data to evaluate liquefaction potential using
an in-house developed computer program based on the Seed-Idriss Simplified Procedure (Seed
and Idriss, 1971; Seed and others, 1983; National Research Council, 1985; Seed and others,
1985; Seed and Harder, 1990; Youd and Idriss, 1997; Youd and others, 2001; Idriss and
Boulanger, 2008). The procedure first calculates the resistance to liquefaction of each soil layer
penetrated at a test-drilling site, expressed in terms of cyclic resistance ratio (CRR). The
calculations are based on standard penetration test (SPT) results, groundwater level, soil density,
grain-size analysis, moisture content, soil type, and sample depth. The procedure then estimates
the factor of safety relative to liquefaction hazard for each of the soil layers logged at the site by
dividing their calculated CRR by the pseudo PGA-derived CSR described in the previous
section.
CGS uses a factor of safety (FS) of 1.0 or less, where CSR equals or exceeds CRR, to indicate
the presence of potentially liquefiable soil layers. The liquefaction analysis program calculates
an FS for each geotechnical sample where blow counts were collected. Typically, multiple
samples are collected for each borehole. The program then independently calculates an FS for
each non-clay layer that includes at least one penetration test using the minimum (N1)60 value for
that layer. The minimum FS value of the layers penetrated by the borehole is used to determine
the liquefaction potential for each borehole location. The reliability of FS values varies
according to the quality of the geotechnical data. In addition to FS, consideration is given to the
proximity to stream channels, which accounts in a general way for factors such as sloping ground
or free face that contribute to severity of liquefaction-related ground deformation.
ZONATION CRITERIA: LIQUEFACTION
Areas underlain by materials susceptible to liquefaction during an earthquake are included in
liquefaction zones using criteria developed by the Seismic Hazards Mapping Act Advisory
Committee and adopted by the SMGB (CGS, 2004). Under those guideline criteria, liquefaction
zones are areas meeting one or more of the following:
1) Areas known to have experienced liquefaction during historical earthquakes
2) All areas of uncompacted artificial fill that are saturated, nearly saturated, or may be
expected to become saturated

SHZR 121 SEISMIC HAZARD ZONATION OF THE WOODWARD ISLAND QUADRANGLE 13
3) Areas where sufficient existing geotechnical data and analyses indicate that the soils are
potentially liquefiable
4) Areas where existing subsurface data are not sufficient for quantitative evaluation of
liquefaction hazard. Within such areas, zones may be delineated by geologic criteria as
follows:
a) Areas containing soil deposits of late Holocene age (current river channels and their
historic floodplains, marshes and estuaries), where the M7.5-weighted peak acceleration
that has a 10 percent probability of being exceeded in 50 years is greater than or equal to
0.10 g and the anticipated depth to saturated soil is less than 40 feet; or
b) Areas containing soil deposits of Holocene age (less than 11,700 years), where the M7.5-
weighted peak acceleration that has a 10 percent probability of being exceeded in 50
years is greater than or equal to 0.20 g and the anticipated depth to saturated soil is less
than 30 feet; or
c) Areas containing soil deposits of latest Pleistocene age (11,700 to 15,000 years), where
the M7.5-weighted peak acceleration that has a 10 percent probability of being exceeded
in 50 years is greater than or equal to 0.30 g and the anticipated depth to saturated soil is
less than 20 feet.
Application of the above criteria allows compilation of Earthquake Zones of Required
Investigation for liquefaction hazard, which are useful for preliminary evaluations, general land-
use planning and delineation of special studies zones (Youd, 1991).
DELINEATION OF SEISMIC HAZARD ZONES: LIQUEFACTION
Upon completion of a liquefaction hazard evaluation within a project quadrangle, CGS applies
the above criteria to its findings in order to delineate Seismic Hazard Zones for liquefaction.
Following is a description of the criteria-based factors that governed the construction of the
Seismic Hazard Zone Map for the Woodward Island Quadrangle.
Areas of Past Liquefaction
There is no documentation of historical surface liquefaction or paleoseismic liquefaction
occurrences in the Woodward Island Quadrangle.
Artificial Fills
Non-engineered fill placements are often composed of uncompacted, silty or sandy material and,
therefore, are generally considered to have a high potential for liquefaction when saturated. No
significant placements of non-engineered artificial fill were identified in the study area.
Conversely, significant amounts of engineered artificial fill, which are designed to resist
liquefaction, have been used in the construction of river levees, detention basins, and elevated
freeways within the Woodward Island Quadrangle. In these areas, seismic hazard zonation for
liquefaction does not depend on the fill, but on soil properties and groundwater levels in
underlying strata.

14 CALIFORNIA GEOLOGICAL SURVEY 2018
Areas with Sufficient Existing Geotechnical Data
All of the borehole logs entered into the geotechnical database during this study are from
boreholes located along the western margin of the quadrangle. Nearly all of the remaining 158
logs evaluated in this study are from boreholes located on levees along Old River in the
Woodward Island Quadrangle. These 158 borehole logs were acquired from URS and used in a
2010 CGS liquefaction hazard study of the Sacramento-San Joaquin Delta area (Real and
Knudsen, 2010). As part of this previous investigation, CGS performed a quantitative analysis of
the geotechnical boreholes to evaluate liquefaction potential using an earlier version of the CGS
in-house developed computer program based on the Seed-Idriss Simplified Procedure (Seed and
Idriss, 1971; Seed and others, 1983; National Research Council, 1985; Seed and others, 1985;
Seed and Harder, 1990; Youd and Idriss, 1997; Youd and others, 2001).
The results from this previous CGS quantitative borehole analysis were incorporated into this
study and evaluated. Collectively, these logs provide the level of subsurface information needed
to conduct a regional assessment of liquefaction susceptibility with a reasonable level of
certainty. Much of surface area of the delta-alluvial plain is covered by Holocene alluvium with
a thickness generally greater than 40 feet, which CGS considers to be the maximum depth at
which liquefaction can cause damaging ground failure at the surface.
Examination of geotechnical boring logs show that the Sacramento-San Joaquin Delta-alluvial
plain deposits consist of discontinuous layers of sand, gravel, silt, clay, and peat. Analysis of
blow count values and other soil property measurements reported in the logs indicate that most
of the boreholes penetrated one or more layers of liquefiable material where seismic stress ratio
(CSR) is greater than the soils’ seismic resistance ratio (CRR). Accordingly, all areas where the
identified layers of liquefiable material are saturated within 40 feet of the Seismic Hazard Zone.
Areas with Insufficient Existing Geotechnical Data
In areas with insufficient geotechnical data coverage, Quaternary sedimentary deposits were
evaluated for seismic hazard zonation on the basis of geologic factors, groundwater levels, and
extrapolation of known soil conditions in adjacent areas. Adequate geotechnical borehole
information is lacking for the central part of the map area. All of the geologic units mapped in
the central part of the Woodward Island Quadrangle extend into parts of the map area, or
adjacent quadrangles, with sufficient borehole coverage to adequately assess the liquefaction
susceptibility and lithologic character of the units. These units contain varying amounts of loose,
granular materials that are saturated because of the presence of near-surface groundwater and
proximity to delta channels. Those conditions, along with the ground motions expected to occur
in the region, combine to form a sufficient basis for including these areas in the Seismic Hazard
Zone for liquefaction.
ACKNOWLEDGMENTS
The authors thank the following individuals and organizations for their assistance in obtaining
the data necessary to complete this project: Keith Coggins of Oakley City and Loren Turner of
the CalTrans Laboratory. At CGS, Wayne Haydon provided valuable groundwater mapping
oversight. Terilee McGuire, Bob Moscovitz, Janine Bird, and Kate Thomas of CGS provided
GIS operations and database support. Kate Thomas prepared the final Seismic Hazard Zone
Map and Janine Bird prepared the graphic displays for this report. Tim McCrink and Mike Silva
provided technical review for this report.

SHZR 121 SEISMIC HAZARD ZONATION OF THE WOODWARD ISLAND QUADRANGLE 15
REFERENCES
American Society for Testing and Materials, 2004, Standard test method for penetration test and
split-barrel sampling of soils, Test Method D1586-99, in Annual Book of ASTM Standards,
v. 4.08.
Atwater, B.F., 1982, Geologic maps of the Sacramento-San Joaquin Delta, California: U.S.
Geological Survey Miscellaneous Field Studies Map MF-1401, scale 1:24,000.
Bartow, J.A., 1985, Map showing Tertiary stratigraphy and structure of the northern San Joaquin
Valley, California: U.S. Geological Survey Miscellaneous Field Studies Map MF-1761, 2
sheets, scale 1:250,000.
Bryant, W.A., and Cluett, S.E., compilers, 2002, Quaternary fault and fold database of the United
States: U.S. Geological website, http://earthquakes.usgs.gov/regional/qfaults.
Cain, J.R., Robins, J.D., Beamish, S.S., 2003, The Past and Present Condition of the Marsh
Creek Watershed, 3rd Edition. Berkeley, California: The Natural Heritage Institute.
Retrieved 2011-10-31.
California Department of Water Resources, 2003, California’s Groundwater, Bulletin 118,
http://www.groundwater.water.ca.gov/bulletin118/update2003
California Geological Survey (CGS), 2004, Recommended criteria for delineating seismic hazard
zones in California: California Geological Survey Special Publication 118, 12 p. Available
on-line at: http://www.conservation.ca.gov/cgs/shzp/webdocs/sp118_revised.pdf
California Geological Survey (CGS), 2008, Guidelines for evaluating and mitigating seismic
hazards in California: California Geological Survey Special Publication 117a, 98 p.
Available on-line at: http://www.conservation.ca.gov/cgs/shzp/webdocs/sp117.pdf
Dawson, T., 2010, Preliminary Geologic Map of the Stockton 30’x 60’ Quadrangle, California;
California Geological Survey, unpublished.
Graymer, R.W., Jones, D.L., and Brabb, E.E., 1994, Preliminary geologic map emphasizing
bedrock formations in Contra Costa County, California: A digital database: U.S.
Geological Survey Open-File Report 94-622.
Graymer, R.W., Jones, D.L., and Brabb, E. E., 1996, Preliminary geologic map emphasizing
bedrock formations in Alameda County, California: A digital database: U.S. Geological
Survey Open-File Report 96-252, scale 1:100,000 (1:750,000 digital version).
Graymer, R.W., 2000, Geologic map and map database of the Oakland metropolitan area,
Alameda, Contra Costa, and San Francisco counties, California, U.S. Geological Survey
Miscellaneous Field Studies MF-2342, scale 1:24,000, Version 1.0.
Helley, E. J., Graymer, R. W., 1997, Quaternary geology of Alameda County, and parts of
Contra Costa, Santa Clara, San Mateo, San Francisco, Stanislaus, and San Joaquin Counties,
California: A digital database: U. S. Geological Survey Open-File Report 97-97, 13 pp.,
https://pubs.usgs.gov/of/1997/0097/
Idriss, I.M. and Boulanger, R.W., 2008, Soil liquefaction during earthquakes: Monograph Series,
MNO-12, Earthquake Engineering Research Institute, Berkeley, California, 237p.
Ingebritsen, S.E., Ikehara, M.E., Galloway, D.L., and Jones, D.R., 2000, Delta subsidence in
California; the sinking heart of the state: U.S. Geological Survey Fact Sheet 005-00, 4 pp.,
https://pubs.usgs.gov/fs/2000/fs00500/pdf/fs00500.pdf
16 CALIFORNIA GEOLOGICAL SURVEY 2018
Knudsen, K.L., and Lettis, W.R., 1997, Preliminary maps showing Quaternary geology of twenty
7.5- minute quadrangles, eastern Stockton, California, 1:100,000 quadrangle: National
Earthquake Hazards Reduction Program, U.S. Geological Survey, Final Technical Report ,
Award #1434-94-G- 2499.
Knudsen, K.L., Sowers, J.M., Witter, R.C., Wentworth, C.M., and Helley, E.J., 2000,
Description of mapping of quaternary deposits and liquefaction susceptibility, nine-county
San Francisco Bay region, California: U.S. Geological Survey Open-File Report 00-444.
Luhdorff and Scalmanini, Consulting Engineers (LSCE), 1999, Investigation of Ground-Water
Resources in the East Contra Costa Area. Woodland, CA.
Luhdorff and Scalmanini, Consulting Engineers (LSCE), 2007, Diablo Water District
Groundwater Management Plan for AP 3030. Woodland, CA
Luhdorff and Scalmanini, Consulting Engineers (LSCE), 2012, Data Gap Analysis Tracy
Subbasin, San Joaquin Groundwater Basin. Woodland, CA.
National Research Council, 1985, Liquefaction of soils during earthquakes: National Research
Council Special Publication, Committee on Earthquake Engineering, National Academy
Press, Washington, D.C., 240 p.
Petersen, M.D., Moschetti, M.P., Powers, P.M., Mueller, C.S., Haller, K.M., Frankel, A.D.,
Zeng, Y., Rezaeian, S., Harmsen, S.C., Boyd, O.S., Field, N., Chen, R., Rukstales, K.S.,
Luco, N., Wheeler, R.L., Williams, R.A., and Olsen, A.H., 2014, Documentation for the
2014 update of the United States national seismic hazard maps, U.S. Geol. Survey. Open-
File Rept. 2014-1091, 243 pp., doi: 10.3133/ofr20141091.
Petersen, M.D., Moschetti, M.P., Powers, P.M., Mueller, C.S., Haller, K.M., Frankel, A.D.,
Zeng, Y., Rezaeian, S., Harmsen, S.C., Boyd, O.S., Field, N., Chen, R., Rukstales, K.S.,
Luco, N., Wheeler, R.L., Williams, R.A., and Olsen, A.H., 2015, The 2014 United States
national seismic hazard model: Earthquake Spectra, vol. 31, no. S1, p. S1–S30, doi:
10.1193/120814EQS210M.
Real, C.R., Petersen, M.D., McCrink, T.P., and Cramer, C.H., 2000, Seismic Hazard
Deaggregation in zoning earthquake-induced ground failures in southern California:
Proceedings of the Sixth International Conference on Seismic Zonation, November 12-15,
Palm Springs, California, EERI, Oakland, CA.
Real, C.R., and Knudsen, K.L., 2010, Collaborative research with URS, Corporation, California
Geological Survey: application of new liquefaction hazard mapping techniques to the
Sacramento-San Joaquin Delta area: Final Technical Report for USGS Award Numbers
08HQGR0092-93.
Schemmann, K., Unruh, J.R., and Moores, E.M., 2007, Kinematics of Franciscan Complex
exhumation: New insights from the geology of Mount Diablo, California: Geological
Society of America Bulletin, v. 120; no. 5/6; p. 543–555.
Seed, H.B., and Idriss, I.M., 1971, Simplified procedure for evaluating soil liquefaction
potential: Journal of the Soil Mechanics and Foundations Division of ASCE, v. 97: SM9, p.
1,249-1,273.
Seed, H.B., and Idriss, I.M., 1982, Ground motions and soil liquefaction during earthquakes:
Monograph Series, Earthquake Engineering Research Institute, Berkeley, California, 134 p.

SHZR 121 SEISMIC HAZARD ZONATION OF THE WOODWARD ISLAND QUADRANGLE 17
Seed, H.B., Idriss, I.M., and Arango, I., 1983, Evaluation of liquefaction potential using field
performance data: Journal of Geotechnical Engineering, v. 109, no. 3, p. 458-482.
Seed, H.B., Tokimatsu, K., Harder, L.F., and Chung, R.M., 1985, Influence of SPT procedures in
soil liquefaction resistance evaluations: Journal of Geotechnical Engineering, ASCE, v. 111,
no. 12, p. 1,425-1,445.
Seed, R.B., and Harder, L.F., 1990, SPT-based analysis of cyclic pore pressure generation and
undrained residual strength: Proceedings of the H. Bolton Seed Memorial Symposium, v. 2,
p. 351-376.
Smith, T.C., 1996, Preliminary maps of seismic hazard zones and draft guidelines for evaluating
and mitigating seismic hazards: California Geology, v. 49, no. 6, p. 147-150.
Southern California Earthquake Center, 1999, Recommended procedures for implementation of
DMG Special Publication 117 guidelines for analyzing and mitigating liquefaction in
California: Southern California Earthquake Center, University of Southern California, 63 p.
Thompson, E.P., 2006, Early reclamation and abandonment of the central Sacramento-San
Joaquin Delta: Journal of the Sacramento Historical Society, no. 1-4, p. 41-72.
Tinsley, J.C., Youd, T.L., Perkins, D.M., and Chen, A.T.F., 1985, Evaluating liquefaction
potential, in Ziony, J.I., editor, Evaluating earthquake hazards in the Los Angeles region —
An earth science perspective: U.S. Geological Survey Professional Paper 1360, p. 263-316.
Unruh, J.R., Dumitru, T.A. and Sawyer, T.L., 2007, Coupling of early Tertiary extension in the
Great Valley forearc basin with blueschist exhumation in the underlying Franciscan
accretionary wedge at Mount Diablo, California: Geological Society of America Bulletin, v.
119; no. 11/12; p. 1347–1367.
Wentworth, C.M., Blake, M.C., Jr., McLaughlin, R.J. and Graymer, R.W., 1999, Preliminary
geologic description of the San Jose 30 X 60 Minute Quadrangle, California: U. S.
Geological Survey Open File Report 98-795, scale 1:100,000.
Witter, R.C., Knudsen, K.L, Sowers, J.M., Wentworth, C.M., Koehler, R.D., Randolph, C.E.,
Brooks, S.K., and Gans, K.D., 2006, Maps of Quaternary deposits and liquefaction
susceptibility in the central San Francisco Bay region, California: U.S. Geological Survey
Open-File Report 2006-1037 [available on the World Wide Web at URL
http://pubs.usgs.gov/of/2006/1037/ ].
Youd, T.L., 1973, Liquefaction, flow and associated ground failure: U.S. Geological Survey
Circular 688, 12 p.
Youd, T.L., 1991, Mapping of earthquake-induced liquefaction for seismic zonation: Earthquake
Engineering Research Institute, Proceedings, Fourth International Conference on Seismic
Zonation, v. 1, p. 111-138.
Youd, T.L., and Idriss, I.M., 1997, editors, Proceedings of the NCEER workshop on evaluation
of liquefaction resistance of soils: National Center for Earthquake Engineering Research
Technical Report NCEER-97-0022, 276 p.

18 CALIFORNIA GEOLOGICAL SURVEY 2018
Youd, T.L., Idriss, I.M., Andrus, R.D., Arango, I., Castro, G., Christian, J.T., Dobry, R., Finn,
W.D.L., Harder, L.F. Jr., Hynes, M.E., Ishihara, K., Koester, J.P., Liao, S.S.C., Marcusson,
W.F., Martin, G.R., Mitchell, J.K., Moriwaki, Y., Power, M.S., Robertson, P.K., Seed, R.B.,
and Stokoe, K.H., 2001, Liquefaction resistance of soils; Summary report from the 1996
NCEER and 1998 NCEER/NSF workshops on evaluation of liquefaction resistance of soils:
Journal of Geotechnical and Geoenvironmental Engineering, October 2001, p. 817-833.
Youd, T.L., and Perkins, D.M., 1978, Mapping liquefaction-induced ground failure potential:
Journal of Geotechnical Engineering, v. 104, p. 433-446.

SHZR 121 SEISMIC HAZARD ZONATION OF THE WOODWARD ISLAND QUADRANGLE 19
SECTION 2: EVALUATION REPORT FOR
EARTHQUAKE-INDUCED LANDSLIDE HAZARD
in the
WOODWARD ISLAND 7.5-MINUTE QUADRANGLE,
CONTRA COSTA COUNTY, CALIFORNIA
by
Eleanor R. Spangler P.G. 9440
DEPARTMENT OF CONSERVATION
CALIFORNIA GEOLOGICAL SURVEY
NO LANDSLIDE HAZARDS ZONED
CGS staff performed a slope stability analysis using the Newmark method (Newmark, 1965) to
determine landslide hazard potential in the Woodward Island Quadrangle. The amount of
displacement predicted by the Newmark analysis provides an indication of the relative amount of
damage that could be caused by earthquake-induced landsliding. Based on the conclusions of a
pilot study performed by CGS (McCrink and Real, 1996; McCrink, 2001), earthquake-induced
landslide hazard zones encompass all areas that have calculated Newmark displacements of 5
centimeters or greater. Areas with less than 5 centimeters of calculated displacement are
excluded from landslide hazard zones.
Within the Woodward Island Quadrangle, no areas have calculated Newmark displacements of 5
centimeters or greater. Thus, no areas in the Woodward Island Quadrangle have been designated
as Earthquake Zones of Required Investigation for earthquake-induced landslides. However, the
potential for landslides may exist locally, particularly along streambanks, margins of drainage
channels, and similar settings where steep banks or slopes occur. Within the liquefaction zones,
some of these settings may be susceptible to lateral-spreading (a condition wherein low-angle
landsliding is associated with liquefaction). Also, landslide hazards can be created during
excavation and grading unless appropriate techniques are used. See plates 3.3 and 3.4 for
probabilistic PGA grid points and Modal magnitude values used in the Bouldin Island slope
stability analysis.

20 CALIFORNIA GEOLOGICAL SURVEY 2018
SECTION 3: GROUND SHAKING ASSESSMENT
for the
WOODWARD ISLAND 7.5-MINUTE QUADRANGLE,
CONTRA COSTA AND SAN JOAQUIN COUNTIES,
CALIFORNIA using the
2014 Probabilistic Seismic Hazard Assessment Model
by
Rui Chen P.G. 8598
DEPARTMENT OF CONSERVATION
CALIFORNIA GEOLOGICAL SURVEY
INTRODUCTION
Purpose
The Seismic Hazards Mapping Act of 1990 (Public Resources Code, Chapter 7.8, Division 2)
directs the California State Geologist to compile maps that identify Seismic Hazard Zones
consistent with requirements and priorities established by the California State Mining and
Geology Board (SMGB) (California Geological Survey, 2004). The text of this report is
available online at: http://www.conservation.ca.gov/cgs/shzp/webdocs/documents/sp118_
revised.pdf.
The Act requires that site-specific geotechnical investigations be performed for most urban
development projects situated within Seismic Hazard Zones before lead agencies can issue the
building permit. The Act also requires sellers of real property within these zones to disclose that
fact at the time such property is sold. Evaluation and mitigation of seismic hazards are to be
conducted under guidelines adopted by the California SMGB (California Geological Survey,
2008). The text of this report is online at: http://www.conservation.ca.gov/cgs/shzp/webdocs/
documents/sp117.pdf.
This section of the evaluation report summarizes the ground motions used to evaluate
liquefaction and earthquake-induced landslide potential for zoning purposes. Site-specific ground
motions can be calculated using U.S. Geological Survey (USGS) Unified Hazard Tool available
online at: https://earthquake.usgs.gov/hazards/interactive/.
This section and Sections 1 and 2, which address liquefaction and earthquake-induced landslide
hazards, respectively, constitute a report series that summarizes development of Seismic Hazard
Zone maps in the state. Additional information on seismic hazard zone mapping in California
can be accessed on the California Geological Survey's website: http://conservation.ca.gov/CGS/
shzp.

SHZR 121 SEISMIC HAZARD ZONATION OF THE WOODWARD ISLAND QUADRANGLE 21
PROBABILISTIC SEISMIC HAZARD ANALYSIS MODEL
Probabilistic ground motions are calculated using the USGS probabilistic seismic hazard analysis
(PSHA) model for the 2014 Update of the United States National Seismic Hazard Maps (NSHM)
(Petersen and others, 2014; 2015). This model replaces ground-motion models of Petersen and
others (2008), Frankel and others (2002), Cao and others (2003), and Petersen and others (1996)
used in previous official Seismic Hazard Zone maps. Like previous models, the 2014 USGS
PSHA model utilizes the best available science, models and data, and is the product of an
extensive effort to obtain consensus within the scientific and engineering communities regarding
earthquake sources and ground motions. In California, two earthquake source models control
ground motion hazards, namely version three of the Uniform California Earthquake Rupture
Forecast Model (UCERF3) (Field and others, 2013; 2014) and the Cascadia Subduction Zone
model (Frankel and others, 2014). For shallow crustal earthquakes, ground motions are
calculated using the Next Generation Attenuation Relations for Western U.S. (NGA-West2)
developed from a Pacific Earthquake Engineering Research Center ground motion research
project (Bozorgnia and others, 2014). The NGA-West2 includes five ground motion attenuation
equations (GMPEs): Abrahamson and others (2014), Boore and others (2014), Campbell and
Bozorgnia (2014), Chiou and Youngs (2014), and Idriss (2014). For subduction zone
earthquakes and earthquakes of other deep sources, GMPEs developed specifically for such
sources are used, including Atkinson and Boore (2003) global model, Zhao and others (2006),
Atkinson and Macias (2009), and BC Hydro (Addo and others, 2012).
In PSHA, ground motion hazards from potential earthquakes of all magnitudes and distances on
all potential seismic sources are integrated. GMPEs are used to calculate shaking level from each
earthquake based on earthquake magnitude, rupture distance, type of fault rupture (strike-slip,
reverse, normal, or subduction), and other parameters such as time-average shear-wave velocity
in the upper 30 m beneath a site (VS30). In previous applications, a uniform firm-rock site
condition was assumed in PSHA calculation and, in a separate post-PSHA step, National
Earthquake Hazard Reduction Program (NEHRP) amplification factors were applied to adjust all
sites to a uniform alluvial soil condition to approximately account for the effect of site condition
on ground motion amplitude. In the current application, site effect is directly incorporated in
PSHA via GMPE scaling. Specifically, VS30 is built into GMPEs as one of the repressors and,
therefore, it is an input parameter in PSHA calculation. VS30 value at each grid point is assigned
based on a geology and topography based VS30 map for California developed by Wills and others
(2015). The statewide VS30 map consists of fifteen VS30 groups with group mean VS30 value
ranging from 176 m/s to 733 m/s. It is to be noted that these values are not determined from site-
specific velocity data. Some group values have considerable uncertainties as indicated by a
coefficient of variation ranging from 11% in Quaternary (Pleistocene) sand deposits to 55% in
crystalline rocks.
For zoning purpose, ground motions are calculated at each grid point of a 0.005-degree grid
(approximately 500-m spacing) that adequately covers the entire quadrangle. VS30 map and grid
points in Woodward Island Quadrangle are depicted in Plate 3.1. For site investigations, it is
strongly recommended that VS30 be determined from site-specific shear wave velocity profile
data.
PSHA provides more comprehensive characterizations of ground motion hazards compared to
traditional scenario-based analysis by integrating hazards from all earthquakes above a certain
magnitude threshold. However, many applications of seismic hazard analyses, including
liquefaction and induced landslide hazard mapping analyses, still rely on scenario earthquakes or
some aspects of scenario earthquakes. Deaggregation enables identification of the most

22 CALIFORNIA GEOLOGICAL SURVEY 2018
significant scenario or scenarios in terms of magnitude and distance pair. Deaggregation is often
performed for a particular site, a chosen ground motion parameter (such as peak ground
acceleration or PGA), and a predefined exceedance probability level (i.e., hazard level). Like in
previous regulatory zone maps, ground motion hazard level for liquefaction and landslide hazard
zoning is 10% exceedance probability in 50 years or 475-year return period.
Probabilistic ground motion calculation and hazard deaggregation are performed using a new
USGS hazard codebase, nshmp-haz version 1.0.0, a Java library developed in support of the
USGS NSHM project. The Java code library is hosted in GitHub and is publically available at:
https://github.com/usgs/nshmp-haz/releases/tag/v1.0.0). It is also the codebase that support
USGS web-based site-specific ground motions calculator, the Unified Hazard Tool
(https://earthquake.usgs.gov/hazards/interactive/). The source model used for the published 2014
NSHMs is adopted in its entirety. The 2014 source model is also hosted in GitHub and publically
available at: https://github.com/usgs/nshmp-model-cous-2014/.
APPLICATION TO LIQUEFACTION AND LANDSLIDE HAZARD
ASSESSMENT
The current CGS liquefaction hazard analysis approach requires PGA be scaled by an earthquake
magnitude weighting factor (MWF) to incorporate a magnitude-correlated duration effect
(California Geological Survey, 2004; 2008). The MWF-scaled PGA is referred to as pseudo-
PGA and is used as Liquefaction Opportunity (see Section 1 of this report). MWF calculation is
straight forward for a scenario earthquake. In PSHA, however, earthquakes of different
magnitudes and distances contribute differently to the total hazard at a chosen probabilistic PGA
level. The CGS approach to MWF calculation is based on binned magnitude-distance
deaggregation. An MWF is calculated for each magnitude-distance bin and is weighted by the
contribution of that magnitude-distance bin to the total hazard. The total MWF is the sum of
probabilistic hazard-weighted MWFs from all magnitude-distance bins. This approach provides
an improved estimate of liquefaction hazard in a probabilistic sense. All magnitudes contributing
to the hazard estimate are used to weight the probabilistic calculation of PGA, effectively
causing the cyclic stress ratio liquefaction threshold curves to be scaled probabilistically when
computing factor of safety. This procedure ensures that large, distant earthquakes that occur less
frequently but contribute more, and smaller, more frequent events that contribute less to the
liquefaction hazard are appropriately accounted for (Real and others, 2000).
The current CGS landslide hazard analysis approach requires the probabilistic PGA and a
predominant earthquake magnitude to estimate cumulative Newmark displacement for a given
rock strength and slope gradient condition using a regression equation, described more fully in
Section 2 of this report. The predominant earthquake magnitude is chosen to be the modal
magnitude from deaggregation.
Pseudo-PGA and probabilistic PGA at grid points are depicted in Plates 3.2 and 3.3, respectively.
Modal magnitude is depicted in Plate 3.4. The values of PGA and pseudo-PGA increase from
northeast corner of the quadrangle to southwest corner. Ground motion hazards in the Woodward
Island Quadrangle are controlled by multiple fault sources and deaggregation is often
multimodal. Important fault sources include Greenville Fault, Mount Diablo thrust fault,
Hayward Fault, and Great Valley Fault. Other fault sources that contribute to ground motion
hazards include Calaveras Fault, San Andreas Fault, and Concord Fault. Background (gridded)
seismicity contributes significantly to the total ground motion hazards throughout the
quadrangle. Its contribution exceeds 40% in most places. Modal magnitude generally reflects the

SHZR 121 SEISMIC HAZARD ZONATION OF THE WOODWARD ISLAND QUADRANGLE 23
magnitudes of earthquakes that these contributing seismic sources are capable of producing.
Ground motion distribution also is affected by subsurface geology. In general, expected PGA is
higher where there are softer Quaternary sediments (lower VS30 values) and lower where there
are older Quaternary rocks (higher VS30 values). The table below summarizes ranges of PGA,
pseudo PGA, modal magnitude, and VS30 values expected in the quadrangle.
PGA
(g)
Pseudo-PGA
(g)
Modal Magnitude VS30
(m/s)
0.34 to 0.43 0.22 to 0.28 5.1 to 6.9 176 to 308
REFERENCES
Abrahamson, N.A., Silva, W.J., and Kamai, R., 2014, Summary of the ASK14 ground motion
relation for active crustal regions: Earthquake Spectra, vol. 30, p. 1025–1055.
Addo, K., Abrahamson, N., and Youngs, R. (BC Hydro), 2012, Probabilistic seismic hazard
analysis (PSHA) model—Ground motion characterization (GMC) model: Report E658,
published by BC Hydro.
Atkinson, G.M., and Boore, D.M., 2003, Empirical ground-motion relations for subduction-zone
earthquakes and their application to Cascadia and other regions: Bulletin of the
Seismological Society of America, vol. 93, p. 1,703–1,729.
Atkinson, G.M., and Macias, M., 2009, Predicted ground motions for great interface earthquakes
in the Cascadia subduction zone: Bulletin of the Seismological Society of America, vol. 99,
p. 1,552–1,578.
Boore, D.M., Stewart, J.P., Seyhan, E., and Atkinson, G. M., 2014. NGA-West2 equations for
predicting PGA, PGV, and 5% damped PSA for shallow crustal earthquakes: Earthquake
Spectra, vol. 30, p. 1057–1085.
Bozorgnia Y., Abrahamson, N.A., Atik, L.A., Dawson T.D., and others, 2014, NGA-West2
Research Project: Earthquake Spectra, vol 30, no. 3, p. 973 –987, DOI:
10.1193/072113EQS209M.
Campbell, K.W., and Bozorgnia, Y., 2014, NGA-West2 ground motion model for the average
horizontal components of PGA, PGV, and 5% damped linear acceleration response spectra:
Earthquake Spectra, vol. 30, p. 1087–1115.
California Geological Survey, 2004, Recommended criteria for delineating seismic hazard zones
in California: California Geological Survey Special Publication 118, 12 p. Available on-line
at: http://www.conservation.ca.gov/cgs/shzp/webdocs/documents/sp118_revised.pdf.
California Geological Survey, 2008, Guidelines for evaluating and mitigating seismic hazards in
California: California Geological Survey Special Publication 117a, 98 p. Available on-line
at: http://www.conservation.ca.gov/cgs/shzp/webdocs/documents/sp117.pdf.

24 CALIFORNIA GEOLOGICAL SURVEY 2018
Cao, T., Bryant, W.A., Rowshandel, B., Branum, D. and Wills, C.J., 2003, The Revised 2002
California Probabilistic Seismic Hazard Maps. California Geological Survey, Online Report:
http://www.conservation.ca.gov/cgs/rghm/psha/fault_parameters/pdf/Documents/2002_ca_h
azard_maps.pdf.
Chiou, B.S.J., and Youngs, R.R., 2014. Update of the Chiou and Youngs NGA model for the
average horizontal component of peak ground motion and response spectra: Earthquake
Spectra, vol. 30, p. 1117–1153.
Field, E.H., Biasi, G.P., Bird, P., Dawson, T.E., Felzer, K.R., Jackson, D.D., Johnson, K.M.,
Jordan, T.H., Madden, C., Michael, A.J., Milner, K.R., Page, M.T., Parsons, T., Powers,
P.M., Shaw, B.E., Thatcher, W.R., Weldon, II, R.J., and Zeng, Y., 2013, Uniform California
Earthquake Rupture Forecast, Version 3 (UCERF3)—The Time-Independent Model, U.S.
Geological Survey Open-File Report 2013–1165, California Geological Survey Special
Report 228, and Southern California Earthquake Center Publication 1792, 97 pp., available
at http://pubs.usgs.gov/of/2013/1165/.
Field, E.H., Arrowsmith, R.J., Biasi, G.P., Bird, P., Dawson, T.E., Felzer, K.R., Jackson, D.D.,
Johnson, K.M., Jordan, T.H., Madden, C., Michael, A.J., Milner, K.R., Page, M.T., Parsons,
T., Powers, P.M., Shaw, B.E., Thatcher, W.R., Weldon, II, R.J., and Zeng, Y., 2014,
Uniform California earthquake rupture forecast, Version 3 (UCERF3) —The time
independent model: Bulletin of Seismological Society of America, vol. 104, p. 1122–1180.
Frankel, A.D., Petersen, M.D., Muller, C.S., Haller, K.M., Wheeler, R.L., Layendecker, E.V.,
Wesson, R.L., Harmsen, S.C., Cramer, C.H., Perkins, D.M., and Rukstales, K.S., 2002,
Documentation for the 2002 Update of the National Seismic Hazard Maps: U.S. Geological
Survey, Open-File Report 02-420, 33 p.
Frankel, A., Chen, R., Petersen, M., Moschetti, M., and Sherrod, B., 2014, 2014 Update of the
Pacific Northwest Portion of the U.S. National Seismic Hazard Maps: Earthquake Spectra,
vol. 31, no. S1, p. S131–S148, DOI: 10.1193/111314EQS193M.
Idriss, I.M., 2014, An NGA-West2 empirical model for estimating the horizontal spectral values
generated by shallow crustal earthquakes: Earthquake Spectra, vol. 30, p. 1155–1177.
Petersen, M.D., Bryant, W.A., Cramer, C.H., Cao, T., Reichle, M.S., Frankel, A.D.,
Lienkaemper, J.J., McCrory, P.A. and Schwartz, D.P., 1996, Probabilistic seismic hazard
assessment for the State of California: California Department of Conservation, Division of
Mines and Geology Open-File Report 96-08; also U.S. Geological Survey Open-File Report
96-706, 33 p.
Petersen, M.D., Moschetti, M.P., Powers, P.M., Mueller, C.S., Haller, K.M., Frankel, A.D.,
Zeng, Y., Rezaeian, S., Harmsen, S.C., Boyd, O.S., Field, N., Chen, R., Rukstales, K.S.,
Luco, N., Wheeler, R.L., Williams, R.A., and Olsen, A.H., 2014, Documentation for the
2014 update of the United States national seismic hazard maps, U.S. Geol. Survey. Open-
File Rept. 2014-1091, 243 pp., doi: 10.3133/ofr20141091.

SHZR 121 SEISMIC HAZARD ZONATION OF THE WOODWARD ISLAND QUADRANGLE 25
Petersen, M.D., Moschetti, M.P., Powers, P.M., Mueller, C.S., Haller, K.M., Frankel, A.D.,
Zeng, Y., Rezaeian, S., Harmsen, S.C., Boyd, O.S., Field, N., Chen, R., Rukstales, K.S.,
Luco, N., Wheeler, R.L., Williams, R.A., and Olsen, A.H., 2015, The 2014 United States
national seismic hazard model: Earthquake Spectra, vol. 31, no. S1, p. S1–S30, doi:
10.1193/120814EQS210M.
Petersen, M.D., Moschetti, M.P., Powers, P.M., Mueller, C.S., Haller, K.M., Frankel, A.D.,
Zeng, Y., Rezaeian, S., Harmsen, S. C., Boyd, O. S. et al., 2015, The 2014 United States
national seismic hazard model: Earthquake Spectra, vol. 31, no. S1, p. S1–S30, doi:
10.1193/120814EQS210M.
Real, C.R., Petersen, M.D., McCrink, T.P. and Cramer, C.H., 2000, Seismic Hazard
Deaggregation in zoning earthquake-induced ground failures in southern California:
Proceedings of the Sixth International Conference on Seismic Zonation, November 12-15,
Palm Springs, California, EERI, Oakland, CA.
Wills, C.J., Gutierrez, C.I., Perez, F.G., and Branum, D.M., 2015, A next-generation VS30 map
for California based on geology and topography: Bulletin of Seismological Society of
America, vol. 105, no. 6, p. 3083–3091, doi: 10.1785/0120150105.
Zhao, J.X., Zhang, J., Asano, A., Ohno, Y., Oouchi, T., Takahashi, T., Ogawa, H., Irikura, K.,
Thio, H.K., Somerville, P.G., Fukushima, Y.A, and Fukushima, Y., 2006, Attenuation
relations of strong ground motion in Japan using site classification based on predominant
period: Bulletin of the Seismological Society of America, v. 96, p. 898–913.

!
!
!!!
afQds
Qds
Qds af
af
Qhdm
Qhfp
Qhdm
Qds
afbm
alf
Qds
af
Qds
Qhdm
QhdmQds
af
af
alf
Qhl
Qhff
Qhff
Qhff
Qhdm
Qhff
AREA NOT EVALUATEDFOR LIQUEFACTION
OR LANDSLIDE
WOODWARD ISLAND QUADRANGLE
!Geotechnical boring used in liquefactionevaluation
See "Geology" in Section 1 of report for descriptions of units.
N
31 0 1 20.5
Miles5,000 0 5,000 10,0002,500
Feet1 0 1 20.5
Kilometers
Topographic base map from USGS. Contour interval 20 feet. Scale 1:75,000. Map preparation by Janine Bird, CGS.
Plate 1.1 Quaternary Geologic Materials Map and Locations of Boreholes Used in Evaluating Liquefaction Hazard, Woodward Island Quadrangle, California.

!
!
!
!
!
!
!
!
!
!!
!
!!!!!!!!!
!!!!
!!!!!!!!
!
!
!!
!
!
!
!
!
!!!
!
!
!
!!
!
!
!
!
!
!
!!!
!! !
!
!
!
!!
!
!!
!
!
!!!
! !
!
!
!
!!
!!
!!
!!!
!!
!!!
!
!
!!
!!
!!
!!!
!
!
!
! !!!!
!!
!!
!
!!!
!!
10
0
0
0
afQds
Qds
Qds af
af
Qhdm
Qhfp
Qhdm
Qds
afbm
alf
Qds
af
Qds
Qhdm
Qhdm
af
af
alf
Qhff
Qhff
Qhff
Qhff
AREA NOT EVALUATEDFOR LIQUEFACTION
OR LANDSLIDE
WOODWARD ISLAND QUADRANGLE
! Groundwater measurement locationDepth to groundwater (in feet)
See "Geology" in Section 1 of report for descriptions of units.
N
31 0 1 20.5
Miles5,000 0 5,000 10,0002,500
Feet1 0 1 20.5
Kilometers
Topographic base map from USGS. Contour interval 20 feet. Scale 1:75,000. Map preparation by Janine Bird, CGS.
Plate 1.2 Depth to Historic-High Groundwater levels in Quaternary Alluvial Deposits and Groundwater Measurement Locations, Woodward Island Quadrangle, California.
10

UV4
° ° ° ° ° ° ° ° ° ° ° ° ° ° ° ° ° ° ° ° ° ° ° ° ° ° ° °° ° ° ° ° ° ° ° ° ° ° ° ° ° ° ° ° ° ° ° ° ° ° ° ° ° ° °° ° ° ° ° ° ° ° ° ° ° ° ° ° ° ° ° ° ° ° ° ° ° ° ° ° ° °° ° ° ° ° ° ° ° ° ° ° ° ° ° ° ° ° ° ° ° ° ° ° ° ° ° ° °° ° ° ° ° ° ° ° ° ° ° ° ° ° ° ° ° ° ° ° ° ° ° ° ° ° ° °° ° ° ° ° ° ° ° ° ° ° ° ° ° ° ° ° ° ° ° ° ° ° ° ° ° ° °° ° ° ° ° ° ° ° ° ° ° ° ° ° ° ° ° ° ° ° ° ° ° ° ° ° ° °° ° ° ° ° ° ° ° ° ° ° ° ° ° ° ° ° ° ° ° ° ° ° ° ° ° ° °° ° ° ° ° ° ° ° ° ° ° ° ° ° ° ° ° ° ° ° ° ° ° ° ° ° ° °° ° ° ° ° ° ° ° ° ° ° ° ° ° ° ° ° ° ° ° ° ° ° ° ° ° ° °° ° ° ° ° ° ° ° ° ° ° ° ° ° ° ° ° ° ° ° ° ° ° ° ° ° ° °° ° ° ° ° ° ° ° ° ° ° ° ° ° ° ° ° ° ° ° ° ° ° ° ° ° ° °° ° ° ° ° ° ° ° ° ° ° ° ° ° ° ° ° ° ° ° ° ° ° ° ° ° ° °° ° ° ° ° ° ° ° ° ° ° ° ° ° ° ° ° ° ° ° ° ° ° ° ° ° ° °° ° ° ° ° ° ° ° ° ° ° ° ° ° ° ° ° ° ° ° ° ° ° ° ° ° ° °° ° ° ° ° ° ° ° ° ° ° ° ° ° ° ° ° ° ° ° ° ° ° ° ° ° ° °° ° ° ° ° ° ° ° ° ° ° ° ° ° ° ° ° ° ° ° ° ° ° ° ° ° ° °° ° ° ° ° ° ° ° ° ° ° ° ° ° ° ° ° ° ° ° ° ° ° ° ° ° ° °° ° ° ° ° ° ° ° ° ° ° ° ° ° ° ° ° ° ° ° ° ° ° ° ° ° ° °° ° ° ° ° ° ° ° ° ° ° ° ° ° ° ° ° ° ° ° ° ° ° ° ° ° ° °° ° ° ° ° ° ° ° ° ° ° ° ° ° ° ° ° ° ° ° ° ° ° ° ° ° ° °° ° ° ° ° ° ° ° ° ° ° ° ° ° ° ° ° ° ° ° ° ° ° ° ° ° ° °° ° ° ° ° ° ° ° ° ° ° ° ° ° ° ° ° ° ° ° ° ° ° ° ° ° ° °° ° ° ° ° ° ° ° ° ° ° ° ° ° ° ° ° ° ° ° ° ° ° ° ° ° ° °° ° ° ° ° ° ° ° ° ° ° ° ° ° ° ° ° ° ° ° ° ° ° ° ° ° ° °° ° ° ° ° ° ° ° ° ° ° ° ° ° ° ° ° ° ° ° ° ° ° ° ° ° ° °° ° ° ° ° ° ° ° ° ° ° ° ° ° ° ° ° ° ° ° ° ° ° ° ° ° ° °° ° ° ° ° ° ° ° ° ° ° ° ° ° ° ° ° ° ° ° ° ° ° ° ° ° ° °
Brentwood
Byron HotSprings
CliftonCourt
Forebay
Holt
Jersey Island Terminous
Union Island
BouldinIsland
WOODWARD ISLAND QUADRANGLEN
31 0 1 20.5
Miles5,000 0 5,000 10,0002,500
Feet1 0 1 20.5
Kilometers
DEM base map from USGS. Roads from www.census.gov. Scale 1:100,000. Map preparation by Janine Bird, CGS.
Plate 3.1 Map of Vs30 groups and corresponding geologic units extracted from the state-wide Vs30 map developed by Wills and others (2015), Woodward Island Quadrangle and surrounding area, California.
Shear wave velocity of upper30 meters
468 (Tss)387 (Qoa)352 (Qal3)308 (Qs)294 (Qal2)
228 (Qal1)226 (af/Qi)176 (Qi)water
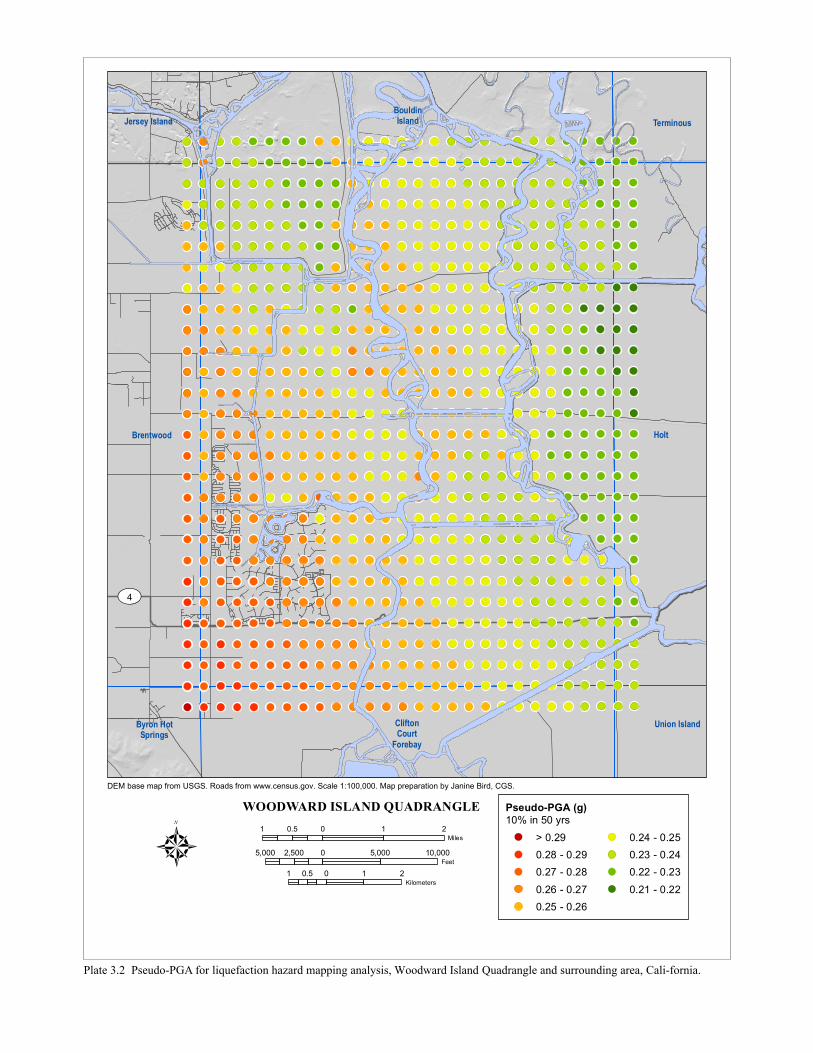
UV4
Brentwood
Byron HotSprings
CliftonCourt
Forebay
Holt
Jersey Island Terminous
Union Island
BouldinIsland
WOODWARD ISLAND QUADRANGLE Pseudo-PGA (g)10% in 50 yrs
> 0.290.28 - 0.290.27 - 0.280.26 - 0.270.25 - 0.26
0.24 - 0.250.23 - 0.240.22 - 0.230.21 - 0.22
N
31 0 1 20.5
Miles5,000 0 5,000 10,0002,500
Feet1 0 1 20.5
Kilometers
DEM base map from USGS. Roads from www.census.gov. Scale 1:100,000. Map preparation by Janine Bird, CGS.
Plate 3.2 Pseudo-PGA for liquefaction hazard mapping analysis, Woodward Island Quadrangle and surrounding area, Cali-fornia.

UV4
Brentwood
Byron HotSprings
CliftonCourt
Forebay
Holt
Jersey Island Terminous
Union Island
BouldinIsland
WOODWARD ISLAND QUADRANGLE Probabilistic PGA (g)10% in 50 yrs
> 0.440.43 - 0.440.42 - 0.430.41 - 0.420.40 - 0.410.39 - 0.40
0.38 - 0.390.37 - 0.380.36 - 0.370.35 - 0.360.34 - 0.35
N
31 0 1 20.5
Miles5,000 0 5,000 10,0002,500
Feet1 0 1 20.5
Kilometers
DEM base map from USGS. Roads from www.census.gov. Scale 1:100,000. Map preparation by Janine Bird, CGS.
Plate 3.3 Probabilistic peak ground acceleration for landslide hazard mapping analysis, Woodward Island Quadrangle and surrounding area, California.

UV4
Brentwood
Byron HotSprings
CliftonCourt
Forebay
Holt
Jersey Island Terminous
Union Island
BouldinIsland
WOODWARD ISLAND QUADRANGLE Modal Magnitude (g)10% in 50 yrs
6.916.906.896.53
6.326.316.305.10
N
31 0 1 20.5
Miles5,000 0 5,000 10,0002,500
Feet1 0 1 20.5
Kilometers
DEM base map from USGS. Roads from www.census.gov. Scale 1:100,000. Map preparation by Janine Bird, CGS.
Plate 3.4 Modal magnitude for landslide hazard mapping analysis, Woodward Island Quadrangle and surrounding area, California.