SEISMIC HAZARD ZONE REPORT FOR THE...
63
SEISMIC HAZARD ZONE REPORT 035 SEISMIC HAZARD ZONE REPORT FOR THE TORRANCE 7.5-MINUTE QUADRANGLE, LOS ANGELES COUNTY, CALIFORNIA 1998 DEPARTMENT OF CONSERVATION Division of Mines and Geology STATE OF CALIFORNIA GRAY DAVIS GOVERNOR THE RESOURCES AGENCY MARY D. NICHOLS SECRETARY FOR RESOURCES DEPARTMENT OF CONSERVATION DARRYL YOUNG DIRECTOR
Transcript of SEISMIC HAZARD ZONE REPORT FOR THE...
SEISMIC HAZARD ZONE REPORT 035
SEISMIC HAZARD ZONE REPORT FOR THE TORRANCE 7.5-MINUTE QUADRANGLE, LOS ANGELES COUNTY, CALIFORNIA
1998
DEPARTMENT OF CONSERVATION Division of Mines and Geology
STATE OF CALIFORNIA
GRAY DAVIS GOVERNOR
THE RESOURCES AGENCY MARY D. NICHOLS
SECRETARY FOR RESOURCES
DEPARTMENT OF CONSERVATION DARRYL YOUNG
DIRECTOR
DIVISION OF MINES AND GEOLOGY
JAMES F. DAVIS, STATE GEOLOGIST
Copyright © 2001 by the California Department of Conservation. All rights reserved. No part of this publication may be reproduced without written consent of the Department of Conservation.
“The Department of Conservation makes no warrantees as to the suitability of this product for any particular purpose.”
SEISMIC HAZARD ZONE REPORT 035
SEISMIC HAZARD ZONE REPORT FOR THE TORRANCE 7.5-MINUTE QUADRANGLE, LOS ANGELES COUNTY, CALIFORNIA
CALIFORNIA GEOLOGICAL SURVEY'S PUBLICATION SALES OFFICES:
Southern California Regional Office 888 South Figueroa Street, Suite 475 Los Angeles, CA 90017 (213) 239-0878
Publications and Information Office 801 K Street, MS 14-31 Sacramento, CA 95814-3531 (916) 445-5716
Bay Area Regional Office 345 Middlefield Road, MS 520 Menlo Park, CA 94025 (650) 688-6327
.
List of Revisions – Torrance SHZR 035
2001 Text updated
6/15/05 BPS address corrected, web links updated, Figure 3.5 added
1/17/06 Bay Area Regional Office and Southern California Regional Office addresses updated

CONTENTS
EXECUTIVE SUMMARY ......................................................................................................... viii
INTRODUCTION ...........................................................................................................................1
SECTION 1 LIQUEFACTION EVALUATION REPORT Liquefaction Zones in the Torrance 7.5-Minute Quadrangle, Los Angeles County, California...............................................................3
PURPOSE....................................................................................................................................3
BACKGROUND .....................................................................................................................4
METHODS SUMMARY.........................................................................................................4
SCOPE AND LIMITATIONS.................................................................................................5
PART I .........................................................................................................................................5
PHYSIOGRAPHY...................................................................................................................5
GEOLOGY ..............................................................................................................................6
ENGINEERING GEOLOGY ..................................................................................................7
Material Type...............................................................................................................................8
GROUND-WATER CONDITIONS .......................................................................................9
PART II........................................................................................................................................9
LIQUEFACTION POTENTIAL .............................................................................................9
LIQUEFACTION SUSCEPTIBILITY..................................................................................10
LIQUEFACTION OPPORTUNITY .....................................................................................11
LIQUEFACTION ZONES ....................................................................................................12
ACKNOWLEDGMENTS .........................................................................................................14
REFERENCES ..........................................................................................................................14
iii
SECTION 2 EARTHQUAKE-INDUCED LANDSLIDE EVALUATION REPORT Earthquake-Induced Landslide Zones in the Torrance 7.5-Minute Quadrangle, Los Angeles County, California..........................................................................................................................19
PURPOSE..................................................................................................................................19
BACKGROUND ...................................................................................................................20
METHODS SUMMARY.......................................................................................................20
SCOPE AND LIMITATIONS...............................................................................................21
PART I .......................................................................................................................................21
PHYSIOGRAPHY.................................................................................................................21
GEOLOGY ............................................................................................................................23
ENGINEERING GEOLOGY ................................................................................................26
PART II......................................................................................................................................29
EARTHQUAKE-INDUCED LANDSLIDE HAZARD POTENTIAL.................................29
EARTHQUAKE-INDUCED LANDSLIDE HAZARD ZONE ............................................33
ACKNOWLEDGMENTS .........................................................................................................35
REFERENCES ..........................................................................................................................35
AIR PHOTOS ............................................................................................................................38
APPENDIX A Source of Rock Strength Data...........................................................................38
SECTION 3 GROUND SHAKING EVALUATION REPORT Potential Ground Shaking in the Torrance 7.5-Minute Quadrangle, Los Angeles County, California........................................39
PURPOSE..................................................................................................................................39
EARTHQUAKE HAZARD MODEL .......................................................................................40
APPLICATIONS FOR LIQUEFACTION AND LANDSLIDE HAZARD ASSESSMENTS 44
USE AND LIMITATIONS........................................................................................................47
REFERENCES ..........................................................................................................................48
iv
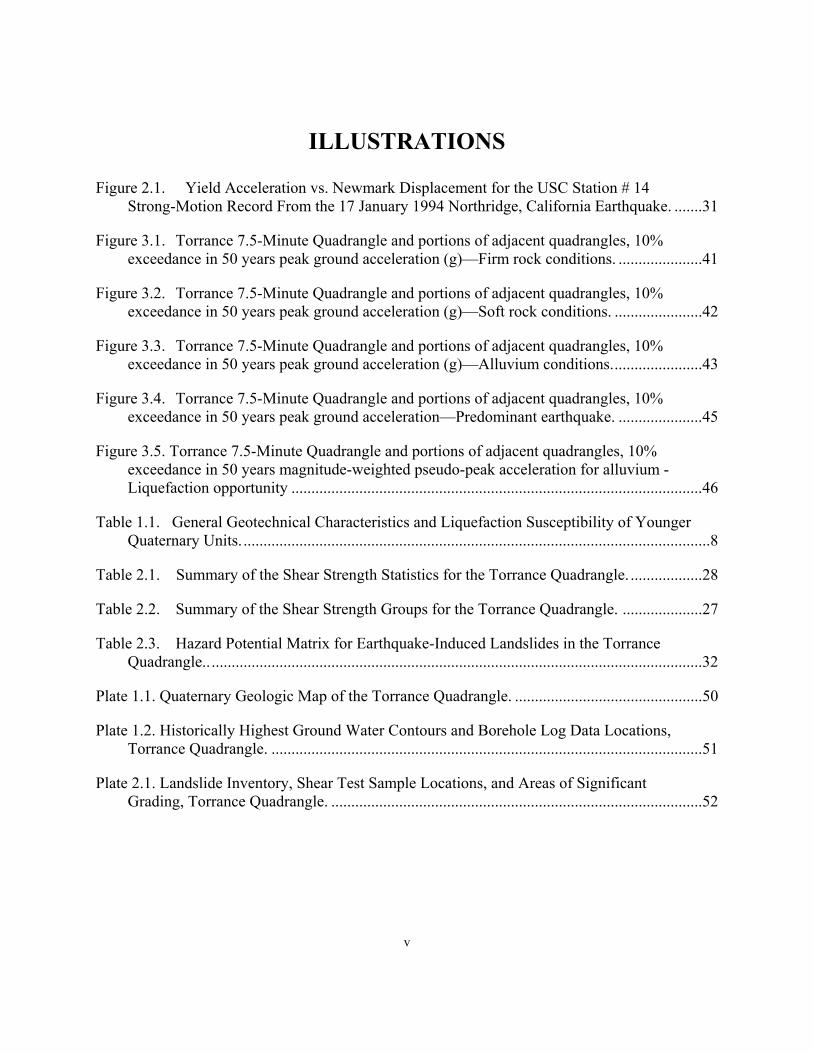
ILLUSTRATIONS
Figure 2.1. Yield Acceleration vs. Newmark Displacement for the USC Station # 14 Strong-Motion Record From the 17 January 1994 Northridge, California Earthquake. .......31
Figure 3.1. Torrance 7.5-Minute Quadrangle and portions of adjacent quadrangles, 10% exceedance in 50 years peak ground acceleration (g)—Firm rock conditions. .....................41
Figure 3.2. Torrance 7.5-Minute Quadrangle and portions of adjacent quadrangles, 10% exceedance in 50 years peak ground acceleration (g)—Soft rock conditions. ......................42
Figure 3.3. Torrance 7.5-Minute Quadrangle and portions of adjacent quadrangles, 10% exceedance in 50 years peak ground acceleration (g)—Alluvium conditions.......................43
Figure 3.4. Torrance 7.5-Minute Quadrangle and portions of adjacent quadrangles, 10% exceedance in 50 years peak ground acceleration—Predominant earthquake. .....................45
Figure 3.5. Torrance 7.5-Minute Quadrangle and portions of adjacent quadrangles, 10% exceedance in 50 years magnitude-weighted pseudo-peak acceleration for alluvium - Liquefaction opportunity .......................................................................................................46
Table 1.1. General Geotechnical Characteristics and Liquefaction Susceptibility of Younger Quaternary Units. .....................................................................................................................8
Table 2.1. Summary of the Shear Strength Statistics for the Torrance Quadrangle. ..................28
Table 2.2. Summary of the Shear Strength Groups for the Torrance Quadrangle. ....................27
Table 2.3. Hazard Potential Matrix for Earthquake-Induced Landslides in the Torrance Quadrangle.. ...........................................................................................................................32
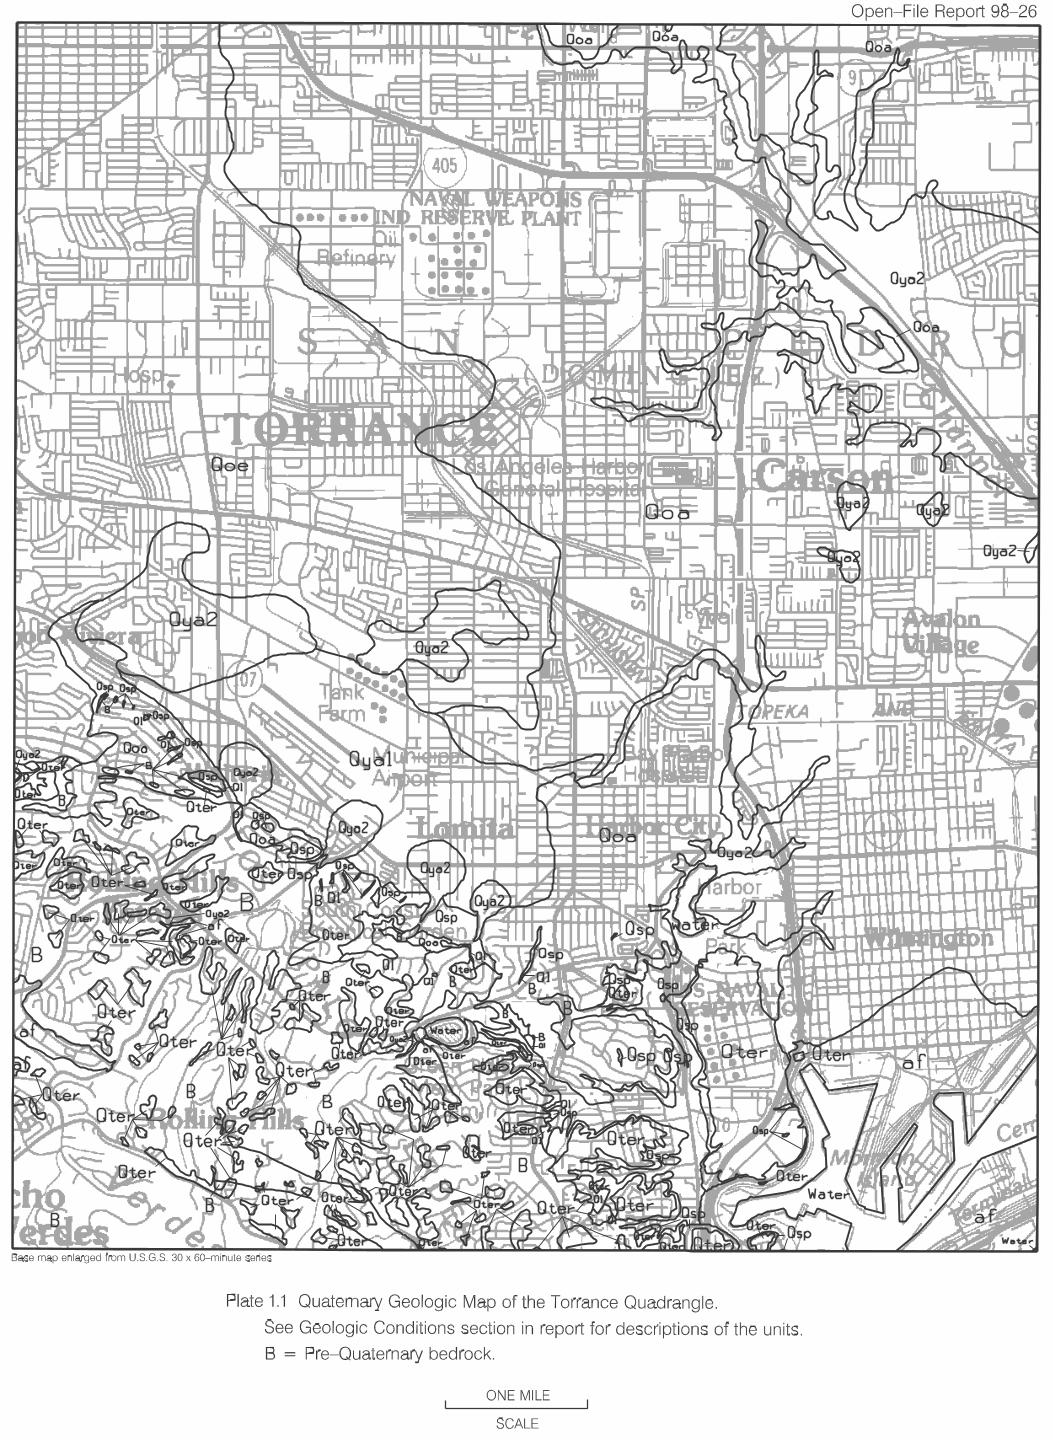
Plate 1.1. Quaternary Geologic Map of the Torrance Quadrangle. ...............................................50
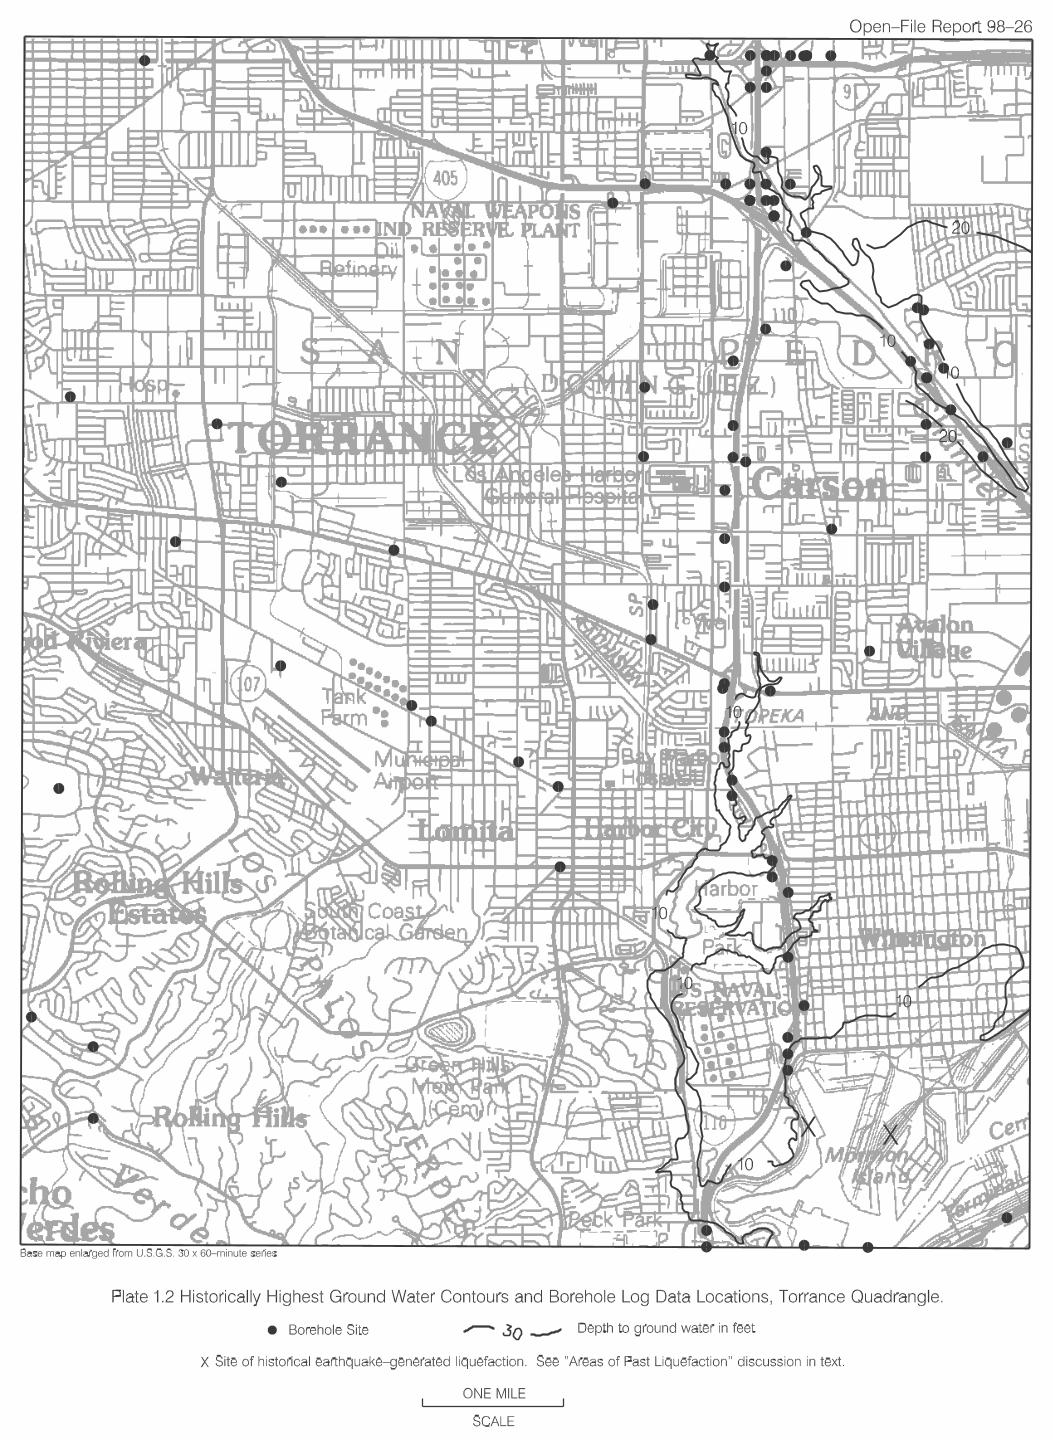
Plate 1.2. Historically Highest Ground Water Contours and Borehole Log Data Locations, Torrance Quadrangle. ............................................................................................................51
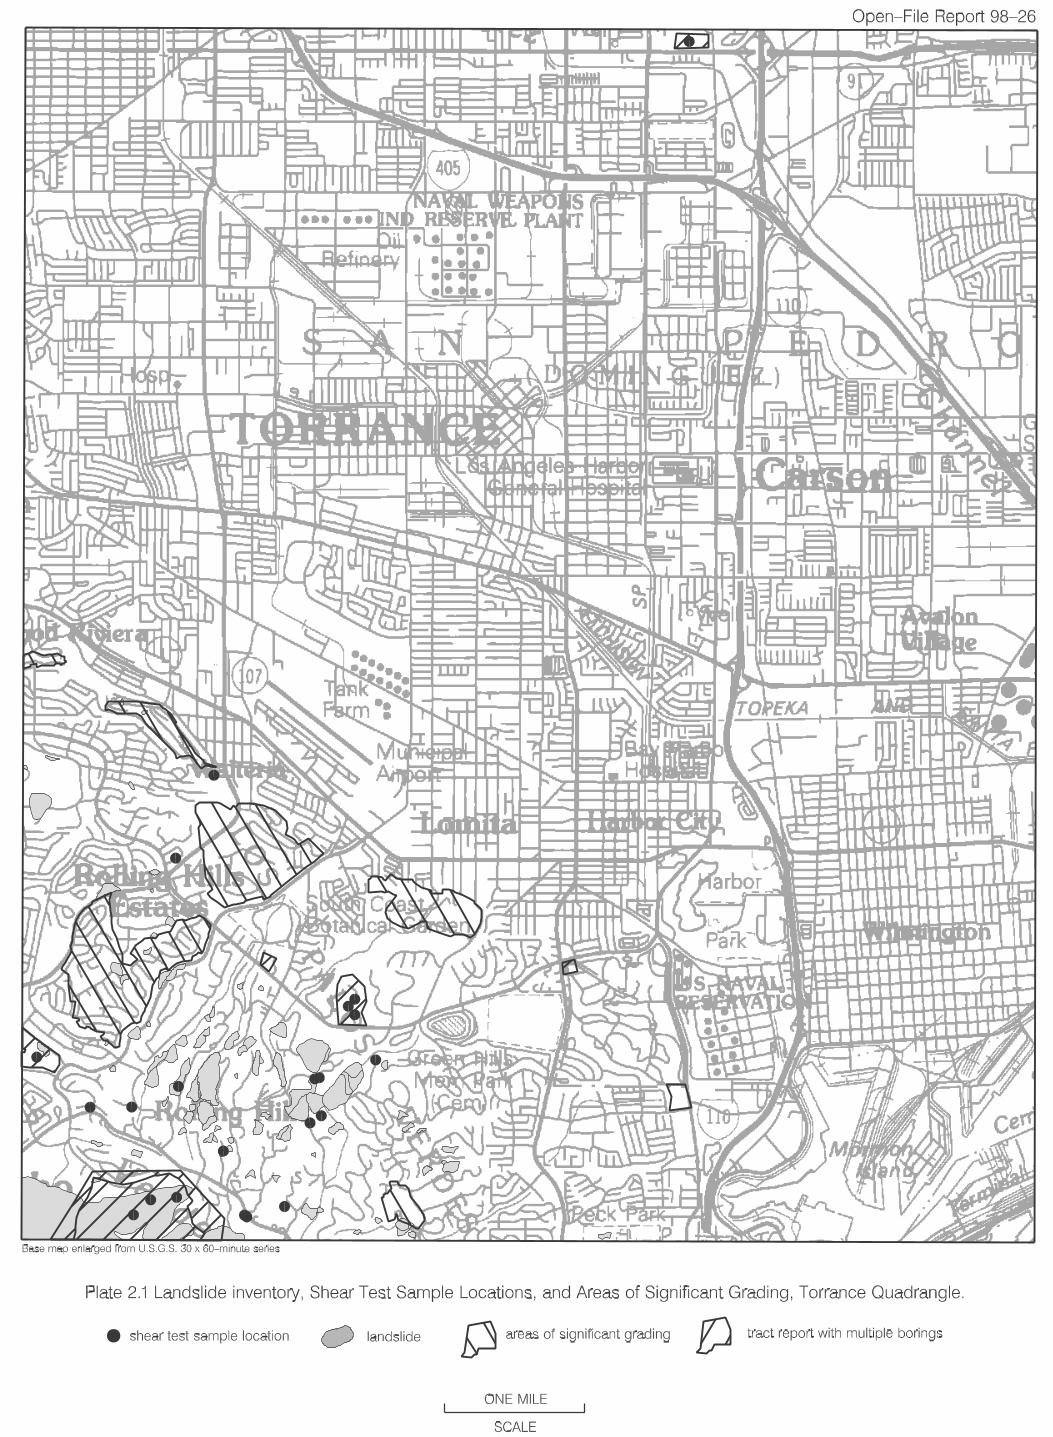
Plate 2.1. Landslide Inventory, Shear Test Sample Locations, and Areas of Significant Grading, Torrance Quadrangle. .............................................................................................52
v

EXECUTIVE SUMMARY
This report summarizes the methods and sources of information used to prepare the Seismic Hazard Zone Map for the Torrance 7.5-minute Quadrangle, Los Angeles County, California. The map displays the boundaries of Zones of Required Investigation for liquefaction and earthquake-induced landslides over an area of approximately 60 square miles at a scale of 1 inch = 2,000 feet.
The Torrance Quadrangle includes portions of the cities of Rancho Palos Verdes, Palos Verdes Estates, Rolling Hills Estates, Rolling Hills, Torrance, Redondo Beach, Carson, Gardena, Los Angeles (communities of East San Pedro, Wilmington, and Harbor City), and Lomita. The rest of the quadrangle consists of unincorporated Los Angeles County and Naval Reservation land. Much of the quadrangle is land of low relief except where the Palos Verdes Hills rise to an elevation above 1280 feet. The Dominguez Hills barely intrude into the northeastern corner of the map area. Land is at sea level in the southeastern corner, where part of Los Angeles harbor is located. Most of the quadrangle is intensely urbanized. The San Diego Freeway (I-405), the Harbor Freeway (I-110), and Pacific Coast Highway (State Highway 1) provide highway access to the area.
The map is prepared by employing geographic information system (GIS) technology, which allows the manipulation of three-dimensional data. Information considered includes topography, surface and subsurface geology, borehole data, historical ground-water levels, existing landslide features, slope gradient, rock-strength measurements, geologic structure, and probabilistic earthquake shaking estimates. The shaking inputs are based upon probabilistic seismic hazard maps that depict peak ground acceleration, mode magnitude, and mode distance with a 10% probability of exceedance in 50 years.
In the Torrance Quadrangle the liquefaction zone is concentrated in areas tributary to the Dominguez Channel, a belt along Gaffey Street in San Pedro and areas of artificial fill associated with Los Angeles Harbor. The combination of steep slopes in deeply dissected terrain, along with the presence of weak rocks has produced widespread and abundant landslides in the Palos Verdes Hills. These conditions contribute to an earthquake-induced landslide zone that covers about 17 percent (1,500 acres) of the upland, hilly portion of the Torrance Quadrangle.
vii
How to view or obtain the map
Seismic Hazard Zone Maps, Seismic Hazard Zone Reports and additional information on seismic hazard zone mapping in California are available on the Division of Mines and Geology's Internet page: http://www.conservation.ca.gov/CGS/index.htm
Paper copies of Official Seismic Hazard Zone Maps, released by DMG, which depict zones of required investigation for liquefaction and/or earthquake-induced landslides, are available for purchase from:
BPS Reprographic Services 945 Bryant Street San Francisco, California 94105 (415) 512-6550
Seismic Hazard Zone Reports (SHZR) summarize the development of the hazard zone map for each area and contain background documentation for use by site investigators and local government reviewers. These reports are available for reference at DMG offices in Sacramento, San Francisco, and Los Angeles. NOTE: The reports are not available through BPS Reprographic Services.
INTRODUCTION
The Seismic Hazards Mapping Act (the Act) of 1990 (Public Resources Code, Chapter 7.8, Division 2) directs the California Department of Conservation (DOC), Division of Mines and Geology (DMG) to delineate seismic hazard zones. The purpose of the Act is to reduce the threat to public health and safety and to minimize the loss of life and property by identifying and mitigating seismic hazards. Cities, counties, and state agencies are directed to use the seismic hazard zone maps in their land-use planning and permitting processes. They must withhold development permits for a site within a zone until the geologic and soil conditions of the project site are investigated and appropriate mitigation measures, if any, are incorporated into development plans. The Act also requires sellers (and their agents) of real property within a mapped hazard zone to disclose at the time of sale that the property lies within such a zone. Evaluation and mitigation of seismic hazards are to be conducted under guidelines established by the California State Mining and Geology Board (DOC, 1997; also available on the Internet at http://gmw.consrv.ca.gov/shmp/webdocs/sp117.pdf).
The Act also directs SMGB to appoint and consult with the Seismic Hazards Mapping Act Advisory Committee (SHMAAC) in developing criteria for the preparation of the seismic hazard zone maps. SHMAAC consists of geologists, seismologists, civil and structural engineers, representatives of city and county governments, the state insurance commissioner and the insurance industry. In 1991 SMGB adopted initial criteria for delineating seismic hazard zones to promote uniform and effective statewide implementation of the Act. These initial criteria provide detailed standards for mapping regional liquefaction hazards. They also directed DMG to develop a set of probabilistic seismic maps for California and to research methods that might be appropriate for mapping earthquake-induced landslide hazards.
In 1996, working groups established by SHMAAC reviewed the prototype maps and the techniques used to create them. The reviews resulted in recommendations that 1) the process for zoning liquefaction hazards remain unchanged and 2) earthquake-induced landslide zones be delineated using a modified Newmark analysis.
This Seismic Hazard Zone Report summarizes the development of the hazard zone map. The process of zoning for liquefaction uses a combination of Quaternary geologic mapping, historical ground-water information, and subsurface geotechnical data. The process for zoning earthquake-induced landslides incorporates earthquake loading, existing landslide features, slope gradient, rock strength, and geologic structure. Probabilistic seismic hazard maps, which are the underpinning for delineating seismic hazard zones, have been prepared for peak ground acceleration, mode magnitude, and mode distance with a 10% probability of exceedance in 50 years (Petersen and others, 1996) in accordance with the mapping criteria.
1
This report summarizes seismic hazard zone mapping for potentially liquefiable soils and earthquake-induced landslides in the Torrance 7.5-minute Quadrangle.
SECTION 1 LIQUEFACTION EVALUATION REPORT
Liquefaction Zones in the Torrance 7.5-Minute Quadrangle,
Los Angeles County, California
By Richard B. Greenwood
California Department of Conservation
Division of Mines and Geology
PURPOSE
The Seismic Hazards Mapping Act (the Act) of 1990 (Public Resources Code, Chapter 7.8, Division 2) directs the California Department of Conservation (DOC), Division of Mines and Geology (DMG) to delineate Seismic Hazard Zones. The purpose of the Act is to reduce the threat to public health and safety and to minimize the loss of life and property by identifying and mitigating seismic hazards. Cities, counties, and state agencies are directed to use seismic hazard zone maps developed by DMG in their land-use planning and permitting processes. The Act requires that site-specific geotechnical investigations be performed prior to permitting most urban development projects within seismic hazard zones. Evaluation and mitigation of seismic hazards are to be conducted under guidelines adopted by the California State Mining and Geology Board (DOC, 1997; also available on the Internet at http://gmw.consrv.ca.gov/shmp/webdocs/sp117.pdf).
This section of the evaluation report summarizes seismic hazard zone mapping for potentially liquefiable soils in the Torrance 7.5-minute Quadrangle. This section, along with Section 2 (addressing earthquake-induced landslides), and Section 3 (addressing potential ground shaking), form a report that is one of a series that summarizes production of similar seismic hazard zone maps within the state (Smith, 1996).
3
DIVISION OF MINES AND GEOLOGY SHZR 035 4
Additional information on seismic hazards zone mapping in California is on DMG’s Internet web page: http://www.conservation.ca.gov/CGS/index.htm
BACKGROUND
Liquefaction-induced ground failure historically has been a major cause of earthquake damage in southern California. During the 1971 San Fernando and 1994 Northridge earthquakes, significant damage to roads, utility pipelines, buildings, and other structures in the Los Angeles area was caused by liquefaction-induced ground displacement.
Localities most susceptible to liquefaction-induced damage are underlain by loose, water-saturated, granular sediment within 40 feet of the ground surface. These geological and ground-water conditions exist in parts of southern California, most notably in some densely populated valley regions and alluviated floodplains. In addition, the potential for strong earthquake ground shaking is high because of the many nearby active faults. The combination of these factors constitutes a significant seismic hazard in the southern California region in general, including areas in the Torrance Quadrangle.
METHODS SUMMARY
Characterization of liquefaction hazard presented in this report requires preparation of maps that delineate areas underlain by potentially liquefiable sediment. The following were collected or generated for this evaluation:
• Existing geologic maps were used to provide an accurate representation of the spatial distribution of Quaternary deposits in the study area. Geologic units that generally are susceptible to liquefaction include late Quaternary alluvial and fluvial sedimentary deposits and artificial fill
• Construction of shallow ground-water maps showing the historically highest known ground-water levels
• Quantitative analysis of geotechnical data to evaluate liquefaction potential of deposits
• Information on potential ground shaking intensity based on DMG probabilistic shaking maps
The data collected for this evaluation were processed into a series of geographic information system (GIS) layers using commercially available software. The liquefaction zone map was derived from a synthesis of these data and according to criteria adopted by the State Mining and Geology Board (DOC, 2000).
2001 SEISMIC HAZARD ZONE REPORT FOR THE TORRANCE QUADRANGLE 5
SCOPE AND LIMITATIONS
Evaluation for potentially liquefiable soils generally is confined to areas covered by Quaternary (less than about 1.6 million years) sedimentary deposits. Such areas within the Torrance Quadrangle consist mainly of alluviated floodplains and low-lying shoreline regions. DMG’s liquefaction hazard evaluations are based on information on earthquake ground shaking, surface and subsurface lithology, geotechnical soil properties, and ground-water depth, which is gathered from various sources. Although selection of data used in this evaluation was rigorous, the quality of the data used varies. The State of California and the Department of Conservation make no representations or warranties regarding the accuracy of the data obtained from outside sources.
Liquefaction zone maps are intended to prompt more detailed, site-specific geotechnical investigations, as required by the Act. As such, liquefaction zone maps identify areas where the potential for liquefaction is relatively high. They do not predict the amount or direction of liquefaction-related ground displacements, or the amount of damage to facilities that may result from liquefaction. Factors that control liquefaction-induced ground failure are the extent, depth, density, and thickness of liquefiable materials, depth to ground water, rate of drainage, slope gradient, proximity to free faces, and intensity and duration of ground shaking. These factors must be evaluated on a site-specific basis to assess the potential for ground failure at any given project site.
Information developed in the study is presented in two parts: physiographic, geologic, and hydrologic conditions in PART I, and liquefaction and zoning evaluations in PART II.
PART I
PHYSIOGRAPHY
Study Area Location and Physiography
The Torrance Quadrangle covers an area of about 60 square miles in southwestern Los Angeles County. The map area includes portions of the cities of Rancho Palos Verdes, Palos Verdes Estates, Rolling Hills Estates, Rolling Hills, Torrance, Redondo Beach, Carson, Gardena, Los Angeles (communities of East San Pedro, Wilmington, and Harbor City), and Lomita. The remainder of the quadrangle consists of unincorporated Los Angeles County and Naval Reservation lands.
Low relief characterizes the topography across much of the quadrangle, except in the southwestern quarter where the Palos Verdes Hills rise to an elevation above 1280 feet. The southwestern slope of the Dominguez Hills lies in the northeasternmost corner of the map area. Land is at sea level in the southeastern corner, where part of Los Angeles harbor is located.
DIVISION OF MINES AND GEOLOGY SHZR 035 6
Most of the map area is underlain by relatively flay-lying Quaternary deposits of the Los Angeles Basin. A strip of ancient coastal dunes lies along the western border, which is one mile from the coastline. Surface drainage is northward off the Palos Verdes Hills then southerly toward the Los Angeles Harbor, which was created by dredging and emplacement of large amounts of artificial fill.
The San Diego Freeway (I-405), the Harbor Freeway (I-110), and Pacific Coast Highway (State Highway 1) provide highway access to the area. Major streets within the quadrangle include Western Avenue, Crenshaw Boulevard, Hawthorne Boulevard (State Highway 107) and Palos Verdes Drive. Artesia Boulevard runs along the northern border of the quadrangle.
GEOLOGY
Surficial Geology
Geologic units that generally are susceptible to liquefaction include late Quaternary alluvial and fluvial sedimentary deposits and artificial fill. A digital map obtained from the U.S.Geological Survey (Tinsley, unpublished) was used as a base to prepare a geologic map of the Torrance Quadrangle for this project. Additional detail was added from a digital map prepared by the Southern California Areal Mapping Project (SCAMP, unpublished), and the California Division of Mines and Geology (Bezore, unpublished), which were compiled primarily from mapping by Poland and others (1959). Quaternary geologic contacts received minor modifications in accordance with older 1:20,000-scale topographic maps (Compton, 1930; Torrance, 1934; Wilmington, 1925), the 1:62,500-scale Redondo Quadrangle (1896; 1944), and an older regional soils map (Nelson and others, 1919). Stratigraphic nomenclature was revised to follow the format developed by SCAMP (Morton and Kennedy, 1989). The revised geologic map that was used in this study of liquefaction susceptibility is included as Plate 1.1.
Woodring and others (1946) recognized the early Pleistocene Lomita Marl (Ql), as the oldest Quaternary geologic unit in the Torrance Quadrangle. The Lomita Marl is conformably overlain by the mid-Pleistocene San Pedro Formation (Qsp), a massive, poorly consolidated, light brown marine sand deposit exposed in the Palos Verdes Hills. Woodring and others (1946) also mapped multiple levels of Pleistocene marine terraces with dense silty sand terrace deposits (Qter) in the Palos Verdes Hills. The quadrangle includes a northwest-trending coastal plain, locally recognized as the Torrance Plain (Poland and Piper, 1956). The Torrance Plain consists of elevated dense silty sand older alluvium (Qoa), which is covered, locally, with moderately dense silty sand of older eolian deposits (Qoe). The Torrance Plain is incised and filled with soft, locally derived sandy silt and sandy clay of younger alluvium (Qya1 and Qya2). A more detailed description of the bedrock geology of the Palos Verdes Hills is presented in Section 2.
Prior to the development of Los Angeles Harbor, extensive estuarine deposits were present at the mouth of Bixby Slough, Dominguez Channel, and the Los Angeles River.
2001 SEISMIC HAZARD ZONE REPORT FOR THE TORRANCE QUADRANGLE 7
These organic tidal muds were extensively dredged and have been extensively covered with artificial fill (af).
ENGINEERING GEOLOGY
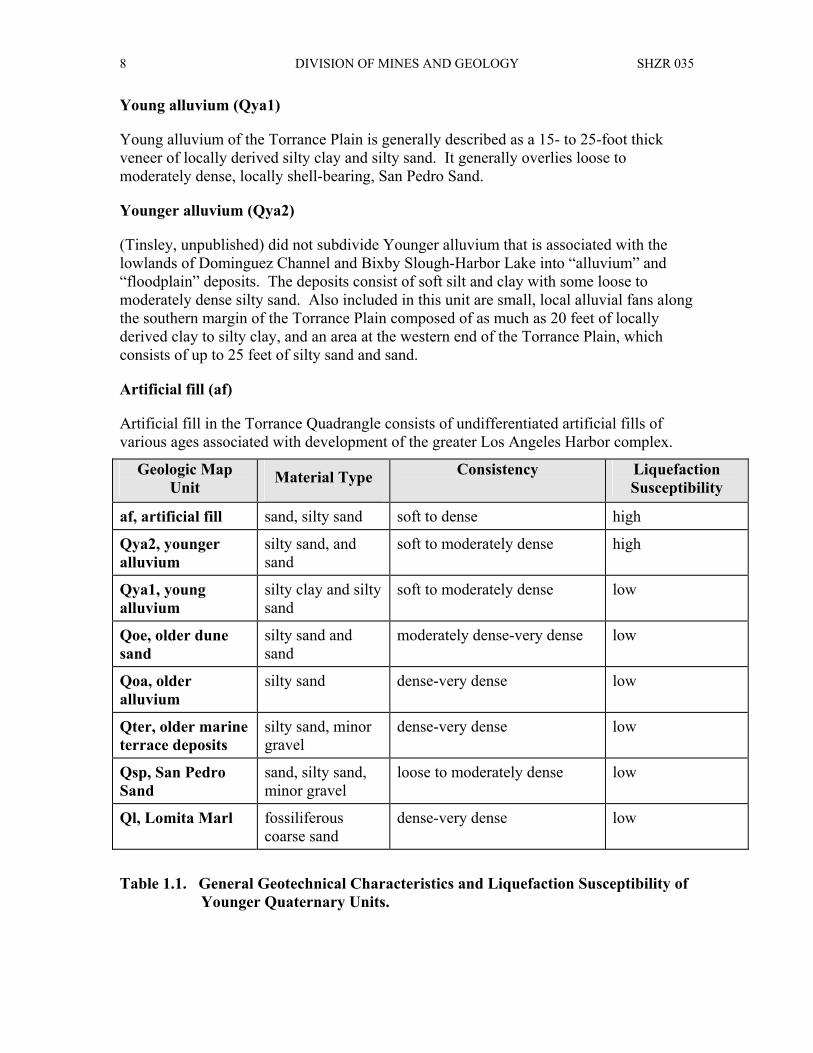
Information on subsurface geology and engineering characteristics of flatland deposits was obtained from borehole logs collected from reports on geotechnical and environmental projects. For this investigation, over 91 borehole logs from the database compiled by John Tinsley for previous liquefaction studies (Tinsley and Fumal, 1985; Tinsley and others, 1985) and additional data collected for this study. Subsurface data were collected for this study at the California Water Quality Control Board, California Department of Water Resources, and the California State Architect’s Office. Data from previous databases and additional borehole logs were entered into the DMG GIS database. Locations of all exploratory boreholes considered in this investigation are shown on Plate 1.2. Descriptions of characteristics of geologic units recorded on the borehole logs are given below. These descriptions are necessarily generalized, but give the most commonly encountered characteristics of the units (see Table 1.1).
Standard Penetration Test (SPT) data provide a standardized measure of the penetration resistance of a geologic deposit and commonly are used as an index of density. Many geotechnical investigations record SPT data, including the number of blows by a 140-pound drop weight required to drive a sampler of specific dimensions one foot into the soil. Recorded blow counts for non-SPT geotechnical sampling, where the sampler diameter, hammer weight or drop distance differ from those specified for an SPT (ASTM D1586), were converted to SPT-equivalent blow count values and entered into the DMG GIS. The actual and converted SPT blow counts were normalized to a common reference effective overburden pressure of one atmosphere (approximately one ton per square foot) and a hammer efficiency of 60% using a method described by Seed and Idriss (1982) and Seed and others (1985). This normalized blow count is referred to as (N1)60.
Lomita Marl (Ql) and San Pedro Sand (Qsp)
Woodring and others (1946) mapped the Lomita Marl and San Pedro Sand on the Palos Verdes Peninsula. The Lomita Marl is typically composed of dense, ridge-forming silty sand, sand, and clayey sand. The early Pleistocene San Pedro Sand is typically composed of cross-bedded to massive sand and silty sand.
Older alluvium (Qoa), Older eolian deposits (Qoe), and marine terrace deposits (Qter)
Late Pleistocene older alluvial and eolian deposits comprise most of the northern and eastern Torrance Quadrangle. The surface of the region typically consists of older alluvial deposits with, locally, a veneer of older, largely stabilized dune sands. Ground water is deep throughout this area, so no extensive effort was made to collect subsurface data. The deposits are generally described as dense to very dense sands and silty sands. Late Pleistocene marine terrace deposits, generally consisting of silty sand with local gravels are found throughout the Palos Verdes Peninsula.
DIVISION OF MINES AND GEOLOGY SHZR 035 8
Young alluvium (Qya1)
Young alluvium of the Torrance Plain is generally described as a 15- to 25-foot thick veneer of locally derived silty clay and silty sand. It generally overlies loose to moderately dense, locally shell-bearing, San Pedro Sand.
Younger alluvium (Qya2)
(Tinsley, unpublished) did not subdivide Younger alluvium that is associated with the lowlands of Dominguez Channel and Bixby Slough-Harbor Lake into “alluvium” and “floodplain” deposits. The deposits consist of soft silt and clay with some loose to moderately dense silty sand. Also included in this unit are small, local alluvial fans along the southern margin of the Torrance Plain composed of as much as 20 feet of locally derived clay to silty clay, and an area at the western end of the Torrance Plain, which consists of up to 25 feet of silty sand and sand.
Artificial fill (af)
Artificial fill in the Torrance Quadrangle consists of undifferentiated artificial fills of various ages associated with development of the greater Los Angeles Harbor complex.
Geologic Map Unit Material Type Consistency Liquefaction
Susceptibility
af, artificial fill sand, silty sand soft to dense high
Qya2, younger alluvium
silty sand, and sand
soft to moderately dense high
Qya1, young alluvium
silty clay and silty sand
soft to moderately dense low
Qoe, older dune sand
silty sand and sand
moderately dense-very dense low
Qoa, older alluvium
silty sand dense-very dense low
Qter, older marine terrace deposits
silty sand, minor gravel
dense-very dense low
Qsp, San Pedro Sand
sand, silty sand, minor gravel
loose to moderately dense low
Ql, Lomita Marl fossiliferous coarse sand
dense-very dense low
Table 1.1. General Geotechnical Characteristics and Liquefaction Susceptibility of Younger Quaternary Units.
2001 SEISMIC HAZARD ZONE REPORT FOR THE TORRANCE QUADRANGLE 9
GROUND-WATER CONDITIONS
Liquefaction hazard may exist in areas where depth to ground water is 40 feet or less. DMG uses the highest known ground-water levels because water levels during an earthquake cannot be anticipated because of the unpredictable fluctuations caused by natural processes and human activities. A historical-high ground-water map differs from most ground-water maps, which show the actual water table at a particular time. Plate 1.2 depicts a hypothetical ground-water table within alluviated areas.
Ground-water conditions were investigated in the Torrance Quadrangle to evaluate the depth to saturated materials. Saturated conditions reduce the effective normal stress, thereby increasing the likelihood of earthquake-induced liquefaction (Youd, 1973). The evaluation was based on first-encountered water noted in geotechnical borehole logs and selected water wells. Turn-of-the-century water-well logs and data (Mendenhall, 1905) were also reviewed but were generally found to be inadequate for the purposes of this study. As noted by Poland and others (1959, p. 90): recent topographic maps differ considerably from the land surface modeled by the 25-foot contour interval of the 1894 base map. Mendenhall (1905) contoured all available water levels--from all aquifers. The subsurface data review for the Torrance Plain included an exhaustive search of underground tank files, school permit files, and hospital permit files. The depths to first-encountered unconfined ground water were plotted onto a map (Plate 1.2) of the project area to constrain the estimate of historically shallowest ground water. Water depths from boreholes known to penetrate confined aquifers were not utilized.
PART II
LIQUEFACTION POTENTIAL
Liquefaction may occur in water-saturated sediment during moderate to great earthquakes. Liquefied sediment loses strength and may fail, causing damage to buildings, bridges, and other structures. Many methods for mapping liquefaction hazard have been proposed. Youd (1991) highlights the principal developments and notes some of the widely used criteria. Youd and Perkins (1978) demonstrate the use of geologic criteria as a qualitative characterization of liquefaction susceptibility and introduce the mapping technique of combining a liquefaction susceptibility map and a liquefaction opportunity map to produce a liquefaction potential map. Liquefaction susceptibility is a function of the capacity of sediment to resist liquefaction. Liquefaction opportunity is a function of the potential seismic ground shaking intensity.
The method applied in this study for evaluating liquefaction potential is similar to that of Tinsley and others (1985). Tinsley and others (1985) applied a combination of the techniques used by Seed and others (1983) and Youd and Perkins (1978) for their mapping of liquefaction hazards in the Los Angeles region. This method combines geotechnical analyses, geologic and hydrologic mapping, and probabilistic earthquake
DIVISION OF MINES AND GEOLOGY SHZR 035 10
shaking estimates, but follows criteria adopted by the State Mining and Geology Board (DOC, 2000).
LIQUEFACTION SUSCEPTIBILITY
Liquefaction susceptibility reflects the relative resistance of a soil to loss of strength when subjected to ground shaking. Physical properties of soil such as sediment grain-size distribution, compaction, cementation, saturation, and depth govern the degree of resistance to liquefaction. Some of these properties can be correlated to a sediment’s geologic age and environment of deposition. With increasing age, relative density may increase through cementation of the particles or compaction caused by the weight of the overlying sediment. Grain-size characteristics of a soil also influence susceptibility to liquefaction. Sand is more susceptible than silt or gravel, although silt of low plasticity is treated as liquefiable in this investigation. Cohesive soils generally are not considered susceptible to liquefaction. Such soils may be vulnerable to strength loss with remolding and represent a hazard that is not addressed in this investigation. Soil characteristics and processes that result in higher measured penetration resistances generally indicate lower liquefaction susceptibility. Thus, blow count and cone penetrometer values are useful indicators of liquefaction susceptibility.
Saturation is required for liquefaction, and the liquefaction susceptibility of a soil varies with the depth to ground water. Very shallow ground water increases the susceptibility to liquefaction (soil is more likely to liquefy). Soils that lack resistance (susceptible soils) typically are saturated, loose and sandy. Soils resistant to liquefaction include all soil types that are dry, cohesive, or sufficiently dense.
DMG’s map inventory of areas containing soils susceptible to liquefaction begins with evaluation of geologic maps and historical occurrences, cross-sections, geotechnical test data, geomorphology, and ground-water hydrology. Soil properties and soil conditions such as type, age, texture, color, and consistency, along with historical depths to ground water are used to identify, characterize, and correlate susceptible soils. Because Quaternary geologic mapping is based on similar soil observations, liquefaction susceptibility maps typically are similar to Quaternary geologic maps. A qualitative susceptible soil inventory is outlined below and summarized in Table 1.1.
Lomita Marl (Ql) and San Pedro Sand (Qsp)
The Lomita Marl is typically composed of dense, ridge-forming silty sand, sand, and clayey sand. The lower Pleistocene San Pedro Sand is typically composed of cross-bedded to massive sand and silty sand. Both of these units predate the late Pleistocene age restrictions of this program and are assigned a low liquefaction susceptibility.
Older alluvium (Qoa), Older eolian deposits (Qoe), and marine terrace deposits (Qter)
Older alluvium, older eolian, and marine terrace deposits are composed of dense to very dense sand and silty sand. Liquefaction susceptibility of these units is low.
2001 SEISMIC HAZARD ZONE REPORT FOR THE TORRANCE QUADRANGLE 11
Young alluvium (Qya1)
Young alluvium is generally described as a 15- to 25-foot thick veneer of locally derived silty clay and silty sand. Because ground water is deeper than the thickness of this unit, liquefaction susceptibility is low.
Younger alluvium (Qya2)
Younger alluvium consists of soft silt and clay with some loose to moderately dense silty sand. Also included in this unit are small, local alluvial fans composed of clay to silty clay and deposits in an area at the western end of the Torrance Plain, which consist of silty sand and sand. Where this unit is saturated, liquefaction susceptibility is high.
Artificial fill (af)
Artificial fills commonly rest upon young alluvial or estuarine deposits. Because the artificial fills are usually too thin to affect the liquefaction hazard and the underlying estuarine and alluvial deposits have a high liquefaction susceptibility, they are assumed to have a high susceptibility to liquefaction.
LIQUEFACTION OPPORTUNITY
Liquefaction opportunity is a measure, expressed in probabilistic terms, of the potential for strong ground shaking. Analyses of in-situ liquefaction resistance require assessment of liquefaction opportunity. The minimum level of seismic excitation to be used for such purposes is the level of peak ground acceleration (PGA) with a 10% probability of exceedance over a 50-year period (DOC, 2000). The earthquake magnitude used in DMG’s analysis is the magnitude that contributes most to the calculated PGA for an area.
For the Torrance Quadrangle, peak accelerations of 0.46 g to 0.59 g, resulting from earthquakes ranging in magnitude from 6.8 to 7.1, were used for liquefaction analyses. The PGA and magnitude values were based on de-aggregation of the probabilistic hazard at the 10% in 50-year hazard level (Petersen and others, 1996; Cramer and Petersen, 1996). See the ground motion section (3) of this report for further details.
Quantitative Liquefaction Analysis
DMG performs quantitative analysis of geotechnical data to evaluate liquefaction potential using the Seed-Idriss Simplified Procedure (Seed and Idriss, 1971; Seed and others, 1983; National Research Council, 1985; Seed and others, 1985; Seed and Harder, 1990; Youd and Idriss, 1997). Using the Seed-Idriss Simplified Procedure one can calculate soil resistance to liquefaction, expressed in terms of cyclic resistance ratio (CRR), based on SPT results, ground-water level, soil density, moisture content, soil type, and sample depth. CRR values are then compared to calculated earthquake-generated shear stresses expressed in terms of cyclic stress ratio (CSR). The Seed-Idriss Simplified Procedure requires normalizing earthquake loading relative to a M7.5 event for the liquefaction analysis. To accomplish this, DMG’s analysis uses the Idriss
DIVISION OF MINES AND GEOLOGY SHZR 035 12
magnitude scaling factor (MSF) (Youd and Idriss, 1997). It is convenient to think in terms of a factor of safety (FS) relative to liquefaction, where: FS = (CRR / CSR) * MSF. FS, therefore, is a quantitative measure of liquefaction potential. DMG uses a factor of safety of 1.0 or less, where CSR equals or exceeds CRR, to indicate the presence of potentially liquefiable soil. While an FS of 1.0 is considered the “trigger” for liquefaction, for a site specific analysis an FS of as much as 1.5 may be appropriate depending on the vulnerability of the site and related structures. The DMG liquefaction analysis program calculates an FS for each geotechnical sample for which blow counts were collected. Typically, multiple samples are collected for each borehole. The lowest FS in each borehole is used for that location. FS values vary in reliability according to the quality of the geotechnical data used in their calculation. FS, as well as other considerations such as slope, presence of free faces, and thickness and depth of potentially liquefiable soil, are evaluated in order to construct liquefaction potential maps, which are then used to make a map showing zones of required investigation.
Of the 91 geotechnical borehole logs reviewed in this study (Plate 1.2), 82 include blow-count data from SPTs or from penetration tests that allow reasonable blow count translations to SPT-equivalent values. Non-SPT values, such as those resulting from the use of 2-inch or 2½-inch inside-diameter ring samplers, were translated to SPT-equivalent values if reasonable factors could be used in conversion calculations. The reliability of the SPT-equivalent values varies. Therefore, they are weighted and used in a more qualitative manner. Few borehole logs, however, include all of the information (e.g. soil density, moisture content, sieve analysis, etc.) required for an ideal Seed-Idriss Simplified Procedure. For boreholes having acceptable penetration tests, liquefaction analysis is performed using recorded density, moisture, and sieve test values or using averaged test values of similar materials.
LIQUEFACTION ZONES
Criteria for Zoning
Areas underlain by materials susceptible to liquefaction during an earthquake were included in liquefaction zones using criteria developed by the Seismic Hazards Mapping Act Advisory Committee and adopted by the California State Mining and Geology Board (DOC, 2000). Under those guideline criteria, liquefaction zones are areas meeting one or more of the following:
1. Areas known to have experienced liquefaction during historical earthquakes
2. All areas of uncompacted artificial fill containing liquefaction-susceptible material that are saturated, nearly saturated, or may be expected to become saturated
3. Areas where sufficient existing geotechnical data and analyses indicate that the soils are potentially liquefiable
4. Areas where existing geotechnical data are insufficient
2001 SEISMIC HAZARD ZONE REPORT FOR THE TORRANCE QUADRANGLE 13
In areas of limited or no geotechnical data, susceptibility zones may be identified by geologic criteria as follows:
a) Areas containing soil deposits of late Holocene age (current river channels and their historic floodplains, marshes and estuaries), where the M7.5-weighted peak acceleration that has a 10% probability of being exceeded in 50 years is greater than or equal to 0.10 g and the water table is less than 40 feet below the ground surface; or
b) Areas containing soil deposits of Holocene age (less than 11,000 years), where the M7.5-weighted peak acceleration that has a 10% probability of being exceeded in 50 years is greater than or equal to 0.20 g and the historical high water table is less than or equal to 30 feet below the ground surface; or
c) Areas containing soil deposits of latest Pleistocene age (11,000 to 15,000 years), where the M7.5-weighted peak acceleration that has a 10% probability of being exceeded in 50 years is greater than or equal to 0.30 g and the historical high water table is less than or equal to 20 feet below the ground surface.
Application of SMGB criteria to liquefaction zoning in the Torrance Quadrangle is summarized below.
Areas of Past Liquefaction
In the Torrance Quadrangle, numerous effects attributed to liquefaction were noted in San Pedro area following the 1933 Long Beach earthquake including numerous leaks in gas lines, water mains broken, and a foot wide crack in the apron of the terminal at berth 156-160 (Barrows, 1974).
Part of the Port of Los Angeles is situated in the southeasternmost corner of the Torrance Quadrangle. During the 1994 Northridge earthquake significant damage occurred to facilities near Berths 121 to 126 and at Pier 300 (Stewart and others, 1994, p. 135). Features that developed at these localities, such as lateral spreading, settlement, and sand boils, manifested liquefaction.
Artificial Fills
In the Torrance Quadrangle, artificial fill includes engineered fill around the Los Angeles Harbor area and throughout the Palos Verdes Peninsula. Residential-related engineered fills are generally too thin to have an impact on liquefaction. Fills that overlie estuarine deposits, however, are more likely to be susceptible to liquefaction. Extensive low-lying areas of artificial fill have been included in liquefaction hazard zones.
Areas with Sufficient Existing Geotechnical Data
The Lomita Marl (Ql), San Pedro Sand (Qsp), marine terrace (Qter), older alluvium (Qoa), and eolian (Qoe) deposits exposed in the Torrance Quadrangle generally have a dense consistency, high fines content, or deep ground water, or exceed the latest
DIVISION OF MINES AND GEOLOGY SHZR 035 14
Pleistocene age limit of the liquefaction criteria and, accordingly, have not been included in liquefaction hazard zones.
Young alluvial deposits (Qya1) are typically very thin and unsaturated. They are not included in liquefaction hazard zones.
Younger alluvial deposits (Qya2) commonly have layers of loose silty sand or sand. Where these deposits are saturated, they are included in a liquefaction hazard zone.
ACKNOWLEDGMENTS
The author would like to thank the staff at the California Department of Transportation (Caltrans), and the Los Angeles Regional Water Quality Control Board for their assistance in the collection of subsurface borehole data. John Tinsley of the U.S. Geological Survey graciously shared information from his extensive files of subsurface geotechnical data for this area. At DMG, special thanks to Bob Moskovitz, Teri McGuire, Barbara Wanish, and Scott Shepherd for their GIS operations support, and to Barbara Wanish for designing and plotting the graphic displays associated with the liquefaction zone map and this report.
REFERENCES
American Society for Testing and Materials, 1999, Standard test method for penetration test and split-barrel sampling of soils, Test Method D1586-99, in Annual Book of ASTM Standards, v. 4.08.
Barrows, A.G., 1974, A review of the geology and earthquake history of the Newport-Inglewood structural zone, Southern California: California Division of Mines and Geology Special Report 114, 115 p., scale 1:125,000.
Bezore, S.P., Saucedo, G.J. and Greenwood, R. G., (unpublished), Geologic Map of the Long Beach 100,000-scale Quadrangle.
California Department of Conservation, Division of Mines and Geology, 1997, Guidelines for evaluating and mitigating seismic hazards in California, Special Publication 117, 74 p.
California Department of Conservation, Division of Mines and Geology, 2000, Recommended criteria for delineating seismic hazard zones in California, Special Publication 118, 12 p.
Cramer, C.H. and Petersen, M.D., 1996, Predominant seismic source distance and magnitude maps for Los Angeles, Orange, and Ventura counties, California: Bulletin of Seismological Society of America, v. 86, no. 5, p. 1,645-1,649.
2001 SEISMIC HAZARD ZONE REPORT FOR THE TORRANCE QUADRANGLE 15
Mendenhall, W.C., 1905, Development of underground waters in the western coastal plain region of southern California: U.S. Geological Survey Water-Supply Paper 139, 105 p.
Morton, D.M. and Kennedy, M.P., 1989, A southern California digital 1:100,000-scale geologic map series: The Santa Ana Quadrangle, The first release: Geological Society of America Abstracts with Programs v. 21, no. 6, p. A107-A108.
National Research Council, 1985, Liquefaction of soils during earthquakes: National Research Council Special Publication, Committee on Earthquake Engineering, National Academy Press, Washington, D.C., 240 p.
Nelson, J.W., Zinn, C.J., Strahorn, A.T., Watson, E. B. and Dunn, J.E., 1919, Soil survey of the Los Angeles area, California: U.S. Department of Agriculture, Bureau of Soils, 78 p., map scale 1:62,500.
Petersen, M.D., Bryant, W.A., Cramer, C.H., Cao, Tianqing, Reichle, M.S., Frankel, A.D., Lienkaemper, J.J., McCrory, P.A. and Schwartz, D.P., 1996, Probabilistic seismic hazard assessment for the State of California: California Department of Conservation, Division of Mines and Geology, Open File Report 96-08; U.S. Geological Survey Open File Report 96-706, 33 p.
Poland, J.E., Garrett, A.A. and Sinotte, A., 1959, Geology, hydrology, and chemical character of ground waters in the Torrance-Santa Monica area, California: U.S. Geological Survey Water Supply Paper 1461, 425 p., Plate 1, north half, map scale 1: 31,680.
Poland, J.E., Piper, A.M. and others, 1956, Ground-water geology of the coastal zone Long Beach-Santa Ana area, California: U.S. Geological Survey Water Supply Paper 1109, 162 p., Plate 2, southern half, map scale 1:31,680.
Seed, H.B. and Idriss, I.M., 1971, Simplified procedure for evaluating soil liquefaction potential: Journal of the Soil Mechanics and Foundations Division of ASCE, v. 97: SM9, p. 1,249-1,273.
Seed, H.B. and Idriss, I.M., 1982, Ground motions and soil liquefaction during earthquakes: Monograph Series, Earthquake Engineering Research Institute, Berkeley, California, 134 p.
Seed, H.B., Idriss, I.M. and Arango, Ignacio, 1983, Evaluation of liquefaction potential using field performance data: Journal of Geotechnical Engineering, v. 109, no. 3, p. 458-482.
Seed, H.B., Tokimatsu, Kohji, Harder, L.F., and Chung, R.M., 1985, Influence of SPT procedures in soil liquefaction resistance evaluations: Journal of Geotechnical Engineering, ASCE, v. 111, no. 12, p. 1,425-1,445.
DIVISION OF MINES AND GEOLOGY SHZR 035 16
Seed, R.B. and Harder, L.F., 1990, SPT-based analysis of cyclic pore pressure generation and undrained residual strength: Proceedings of the H. Bolton Seed Memorial Symposium, v. 2, p. 351-376.
Smith, T.C., 1996, Preliminary maps of seismic hazard zones and draft guidelines for evaluating and mitigating seismic hazards: California Geology, v. 49, no. 6, p. 147-150.
Southern California Areal Mapping Project, unpublished, Digital geologic map of the Torrance 7.5-minute Quadrangle, scale 1:24,000.
Stewart, J.P., Bray, J.D., Seed, R.B. and Sitar, Nicholas, editors, 1994, Preliminary report on the principal geotechnical aspects of the January 17, 1994 Northridge earthquake: University of California at Berkeley, College of Engineering Report No. UCB/EERC - 94-08, 245 p.
Tinsley, J.C., unpublished, Digital Quaternary geologic map of the Torrance 7.5-minute Quadrangle, California: U. S. Geological Survey: compilation scale 1:24,000.
Tinsley, J.C. and Fumal, T.E., 1985, Mapping Quaternary sedimentary deposits for areal variations in shaking response, in Ziony, J.I., editor, Evaluating earthquake hazards in the Los Angeles Region -- An earth-science perspective: U.S. Geological Survey Professional Paper 1360, p. 101 - 125.
Tinsley, J.C., Youd, T.L., Perkins, D.M. and Chen, A.T.F., 1985, Evaluating liquefaction potential, in Ziony, J.I., editor, Evaluating earthquake hazards in the Los Angeles region — An earth science perspective: U.S. Geological Survey Professional Paper 1360, p. 263-316.
USGS (U.S. Geological Survey), 1896 edition, Topographic map of the Redondo 15-minute Quadrangle, scale 1:62,500, contour interval 25 feet.
USGS (U.S. Geological Survey), 1944 edition, Topographic map of the Redondo 15-minute Quadrangle, scale 1:62,500, contour interval 25 feet.
USGS (U.S. Geological Survey), 1934 edition, Topographic map of the Torrance 6-minute Quadrangle, scale 1:24,000, contour interval 5 feet.
USGS (U.S. Geological Survey), 1930edition, Topographic map of the Compton 6-minute Quadrangle, scale 1:24,000, contour interval 5 feet.
USGS (U.S. Geological Survey), 1925 edition, Topographic map of the Wilmington 6-minute Quadrangle, scale 1:24,000, contour interval 5 feet.
Youd, T.L., 1973, Liquefaction, flow and associated ground failure: U.S. Geological Survey Circular 688, 12 p.
2001 SEISMIC HAZARD ZONE REPORT FOR THE TORRANCE QUADRANGLE 17
Youd, T.L., 1991, Mapping of earthquake-induced liquefaction for seismic zonation: Earthquake Engineering Research Institute, Proceedings, Fourth International Conference on Seismic Zonation, v. 1, p. 111-138.
Youd, T.L. and Idriss, I.M., 1997, editors, Proceedings of the NCEER workshop on evaluation of liquefaction resistance of soils: National Center for Earthquake Engineering Research Technical Report NCEER-97-0022, 276 p.
Youd, T.L. and Perkins, D.M., 1978, Mapping liquefaction-induced ground failure potential: Journal of Geotechnical Engineering, v. 104, p. 433-446.

2001 SEISMIC HAZARD ZONE REPORT FOR THE TORRANCE QUADRANGLE 19
SECTION 2 EARTHQUAKE-INDUCED LANDSLIDE
EVALUATION REPORT
Earthquake-Induced Landslide Zones in the Torrance 7.5-Minute Quadrangle,
Los Angeles County, California
By Jack R. McMillan and Wayne D. Haydon
California Department of Conservation
Division of Mines and Geology
PURPOSE
The Seismic Hazards Mapping Act (the Act) of 1990 (Public Resources Code, Chapter 7.8, Division 2) directs the California Department of Conservation (DOC), Division of Mines and Geology (DMG) to delineate Seismic Hazard Zones. The purpose of the Act is to reduce the threat to public health and safety and to minimize the loss of life and property by identifying and mitigating seismic hazards. Cities, counties, and state agencies are directed to use seismic hazard zone maps prepared by DMG in their land-use planning and permitting processes. The Act requires that site-specific geotechnical investigations be performed prior to permitting most urban development projects within the hazard zones. Evaluation and mitigation of seismic hazards are to be conducted under guidelines established by the California State Mining and Geology Board (DOC, 1997; also available on the Internet at http://gmw.consrv.ca.gov/shmp/webdocs/sp117.pdf).
This section of the evaluation report summarizes seismic hazard zone mapping for earthquake-induced landslides in the Torrance 7.5-minute Quadrangle. This section, along with Section 1 (addressing liquefaction), and Section 3 (addressing earthquake shaking), form a report that is one of a series that summarizes the preparation of seismic hazard zone maps within the state (Smith, 1996). Additional information on seismic
DIVISION OF MINES AND GEOLOGY SHZR 035 20
hazard zone mapping in California can be accessed on DMG’s Internet web page: http://www.conservation.ca.gov/CGS/index.htm.
BACKGROUND
Landslides triggered by earthquakes historically have been a significant cause of earthquake damage. In California, large earthquakes such as the 1971 San Fernando, 1989 Loma Prieta, and 1994 Northridge earthquakes triggered landslides that were responsible for destroying or damaging numerous structures, blocking major transportation corridors, and damaging life-line infrastructure. Areas that are most susceptible to earthquake-induced landslides are steep slopes in poorly cemented or highly fractured rocks, areas underlain by loose, weak soils, and areas on or adjacent to existing landslide deposits. These geologic and terrain conditions exist in many parts of California, including numerous hillside areas that have already been developed or are likely to be developed in the future. The opportunity for strong earthquake ground shaking is high in many parts of California because of the presence of numerous active faults. The combination of these factors constitutes a significant seismic hazard throughout much of California, including the hillside areas of the Torrance Quadrangle.
METHODS SUMMARY
The mapping of earthquake-induced landslide hazard zones presented in this report is based on the best available terrain, geologic, geotechnical, and seismological data. If unavailable or significantly outdated, new forms of these data were compiled or generated specifically for this project. The following were collected or generated for this evaluation:
• Digital terrain data were used to provide an up-to-date representation of slope gradient and slope aspect in the study area
• Geologic mapping was used to provide an accurate representation of the spatial distribution of geologic materials in the study area. In addition, a map of existing landslides, whether triggered by earthquakes or not, was prepared
• Geotechnical laboratory test data were collected and statistically analyzed to quantitatively characterize the strength properties and dynamic slope stability of geologic materials in the study area
• Seismological data in the form of DMG probabilistic shaking maps and catalogs of strong-motion records were used to characterize future earthquake shaking within the mapped area
The data collected for this evaluation were processed into a series of GIS layers using commercially available software. A slope stability analysis was performed using the Newmark method of analysis (Newmark, 1965), resulting in a map of landslide hazard potential. The earthquake-induced landslide hazard zone was derived from the landslide
2001 SEISMIC HAZARD ZONE REPORT FOR THE TORRANCE QUADRANGLE 21
hazard potential map according to criteria developed in a DMG pilot study (McCrink and Real, 1996) and adopted by the State Mining and Geology Board (DOC, 2000).
SCOPE AND LIMITATIONS
The methodology used to make this map is based on earthquake ground-shaking estimates, geologic material-strength characteristics and slope gradient. These data are gathered from a variety of outside sources. Although the selection of data used in this evaluation was rigorous, the quality of the data is variable. The State of California and the Department of Conservation make no representations or warranties regarding the accuracy of the data gathered from outside sources.
Earthquake-induced landslide zone maps are intended to prompt more detailed, site-specific geotechnical investigations as required by the Act. As such, these zone maps identify areas where the potential for earthquake-induced landslides is relatively high. Due to limitations in methodology, it should be noted that these zone maps do not necessarily capture all potential earthquake-induced landslide hazards. Earthquake-induced ground failures that are not addressed by this map include those associated with ridge-top spreading and shattered ridges. It should also be noted that no attempt has been made to map potential run-out areas of triggered landslides. It is possible that such run-out areas may extend beyond the zone boundaries. The potential for ground failure resulting from liquefaction-induced lateral spreading of alluvial materials, considered by some to be a form of landsliding, is not specifically addressed by the earthquake-induced landslide zone or this report. See Section 1, Liquefaction Evaluation Report for the Torrance Quadrangle, for more information on the delineation of liquefaction zones.
The remainder of this report describes in more detail the mapping data and processes used to prepare the earthquake-induced landslide zone map for the Torrance Quadrangle. The information is presented in two parts. Part I covers physiographic, geologic and engineering geologic conditions in the study area. Part II covers the preparation of landslide hazard potential and landslide zone maps.
PART I
PHYSIOGRAPHY
Study Area Location and Physiography
The Torrance Quadrangle covers an area of about 60 square miles in southwestern Los Angeles County. The map area includes portions of the cities of Rancho Palos Verdes, Palos Verdes Estates, Rolling Hills Estates, Rolling Hills, Torrance, Redondo Beach, Carson, Gardena, Los Angeles (communities of East San Pedro, Wilmington, and Harbor
DIVISION OF MINES AND GEOLOGY SHZR 035 22
City), and Lomita. The remainder of the quadrangle consists of unincorporated Los Angeles County and Naval Reservation lands.
Low relief characterizes the topography across much of the quadrangle, except in the southwestern quarter where the Palos Verdes Hills rise to an elevation above 1280 feet. The southwestern slope of the Dominguez Hills lies in the northeasternmost corner of the map area. Land is at sea level in the southeastern corner, where part of Los Angeles harbor is located.
Most of the map area is underlain by relatively flay-lying Quaternary deposits of the Los Angeles Basin. A strip of ancient coastal dunes lies along the western border, which is one mile from the coastline. Surface drainage is northward off the Palos Verdes Hills then southerly toward the Los Angeles Harbor, which was created by dredging and emplacement of large amounts of artificial fill.
The San Diego Freeway (I-405), the Harbor Freeway (I-110), and Pacific Coast Highway (State Highway 1) provide highway access to the area. Major streets within the quadrangle include Western Avenue, Crenshaw Boulevard, Hawthorne Boulevard (State Highway 107) and Palos Verdes Drive. Artesia Boulevard runs along the northern border of the quadrangle.
Digital Terrain Data
The calculation of slope gradient is an essential part of the evaluation of slope stability under earthquake conditions. An accurate slope gradient calculation begins with an up-to-date map representation of the earth’s surface. Within the Torrance Quadrangle, a Level 2 digital elevation model (DEM) was obtained from the USGS (U.S. Geological Survey, 1993). This DEM, which was prepared from the 7.5-minute quadrangle topographic contours that are based on 1963 aerial photography, has a 10-meter horizontal resolution and a 7.5-meter vertical accuracy.
Areas that have undergone large-scale grading since 1963 as part of residential development were identified (see Plate 2.1) on 1: 40,000-scale aerial photography flown in 1994 and 1995 (NAPP, 1994). Photogrammetric DEM’s covering the graded areas were prepared by the U.S. Bureau of Reclamation with ground control points established by DMG. The photogrammetric DEM’s were then merged into the USGS DEM, replacing the areas of out-dated elevation data. Surrounding quadrangle DEM’s were merged with the Torrance DEM to avoid the loss of data at the quadrangle edges when the slope calculations were performed.
A slope map was made from both sets of DEM’s using a third-order, finite difference, center-weighted algorithm (Horn, 1981). The DEM was also used to make a slope aspect map. The manner in which the slope and aspect maps were used to prepare the zone map will be described in subsequent sections of this report.
2001 SEISMIC HAZARD ZONE REPORT FOR THE TORRANCE QUADRANGLE 23
GEOLOGY
Bedrock and Surficial Geology
For the Torrance Quadrangle, Woodring and others (1946) published a bedrock geologic map at a scale of 1:24,000. Cleveland (1976) also published geologic maps covering portions of the Palos Verdes Hills at 1:12,000 scale. These sources were compiled, digitized and presented at 1:100,000 scale in Bezore and others (unpublished). This digitized compilation formed the basis of the geologic map used in this investigation. The northern section was taken from Tinsley and others, (1985). The digital geologic map was modified to reflect the most recent mapping in the area and to include interpretations of observations made during the aerial photograph landslide inventory and field reconnaissance. In the field, observations were made of exposures, aspects of weathering, and general surface expression of the geologic units. In addition, the relation of the various geologic units to development and abundance of slope failures was noted.
The bedrock geologic units mapped within the Torrance Quadrangle include: the Mesozoic Catalina Schist; the Monterey Formation (Tm) and its three members -- Malaga Mudstone(Tmal), Valmonte Diatomite (Tmv), and Altimira Shale (Tma); the San Pedro Formation (Qsp), and intrusive basalt (Tb). Quaternary units include marine and non-marine terrace deposits (Qter), talus deposits (Qtb), beach sand (Qm/a), dune deposits (Qe), landslide deposits (Qls) and artificial fill (af).
The oldest rock exposed in the study area is the Mesozoic Catalina Schist, which consists of quartz-chlorite schist, quartz-sericite schist and quartz-glaucophane-schist. The Catalina Schist forms the basement complex for the entire Palos Verdes Peninsula and it is exposed in faulted outcrops in the Torrance Quadrangle just east of Rolling Hills.
The predominant rock unit exposed in the uplands of the Palos Verdes Hills is the middle to upper Miocene Altimira Shale Member (Tma) of the Monterey Formation. All members of the Monterey Formation rest unconformably on the Catalina Schist. The Altimira Shale consists of siliceous shale, silty and sandy shale, chert shale, chert, siltstone, bituminous shale, diatomaceous shale, diatomite, phosphatic shale, tuffaceous shale, limestone, sandstone, conglomerate, breccia, and silicified limestone and shale. Intrusive basaltic rocks (Tb) occur in the lower and middle parts of the Altimira Shale. The basaltic rocks consist of basalt, andesite, volcanic breccia and tuff breccia that forms sills, which are more or less concordant with bedding. The basaltic rocks crop out in faulted terrain just south of Rolling Hills, near the exposures of the Catalina Schist.
The upper Miocene Valmonte Diatomite Member (Tmv) of the Monterey Formation overlies the Altimira Shale and consists of diatomaceous shale and diatomite. This unit crops out as a northwest-southeast trending band north of Rolling Hills, passing through the Palos Verdes Reservoir. It also is found as scattered outcrops protruding through the Holocene alluvium west of Walteria (west of the Torrance Airport), and underlies a portion of the crest of the Palos Verdes Hills along the western margin of the Torrance Quadrangle in the central portion of the Palos Verdes Peninsula.
DIVISION OF MINES AND GEOLOGY SHZR 035 24
The upper Miocene Malaga Mudstone Member (Tmal) of the Monterey Formation overlies the Valmonte Diatomite and crops out as a band adjacent to and north of the Valmonte Diatomite from about north of the Palos Verdes Reservoir to Rolling Hills Estates and as scattered exposures protruding through the Holocene alluvium west of Walteria. The unit consists of radiolarian mudstone and diatomite.
The lower Pliocene Repetto Formation (Tr) siltstone locally overlies the Malaga Mudstone Member of the Monterey Formation and forms limited outcrops north of the Palos Verdes Reservoir. The unit consists of glauconite and foraminiferal siltstone.
The early Pleistocene Lomita Marl (Ql) unconformably overlies the Malaga Mudstone Member where the Repetto Formation siltstone is missing and forms a discontinuous band of exposures adjacent to and north of the Malaga Mudstone southeast, east, and northwest of the Palos Verdes Reservoir. The Lomita Marl consists of marl and calcareous sand and gravel. Early Pleistocene San Pedro Sand (Qsp) overlies the Lomita Marl where that unit is exposed. Otherwise it overlies the Malaga Mudstone directly. This unit consists of sand, silty sand, silt, and gravel and crops out as a band to the northeast of and adjacent to the Lomita Marl or Malaga Mudstone along the northeastern margin of the uplands, and forms the bluff above the alluviated flatland channel south of Harbor Lake occupied by Gaffey Street.
A flight of 13 main emergent marine terraces was mapped in the Palos Verdes Hills by Woodring and others (1946), who numbered the terraces 1 through 13 in ascending order. Intermediate terraces mapped by Woodring and others (1946) include 5a, 7a. The terraces are discontinuous and not all the numbered terraces are exposed everywhere. Cleveland (1976) remapped the terrace distribution in portions of the Torrance Quadrangle and the remapped distribution is included in the DMG geologic map used for this project. More recent work, as reported in Bryant (1987), designates several additional intermediate terraces 2a, 2b, 3a, 3b, 4a and 4b. The wavecut platforms of the terraces are typically capped with marine sediments, a nonmarine cover, or, locally, are simply geomorphic benches without significant sedimentary cover.
Terraces 1 through 12 of the Woodring and others (1946) designation are exposed in the Torrance Quadrangle. Generally, terraces 1 through 10 are capped with upper Pleistocene to Holocene nonmarine terrace deposits (Qter) as mapped by Cleveland (1976). Throughout the Palos Verdes Peninsula, terraces 6 through 10 have generally lost much or virtually all of their original cover through erosion. The upper Pleistocene to recent nonmarine terrace deposits consist of, on the lowest terrace, a thin discontinuous basal marine strata of Palos Verdes Sand overlain by nonmarine deposits. The Palos Verdes Sand is undifferentiated from the overlying nonmarine terrace deposits on the geologic map and consists of a few inches to 15 feet of calcareous sand, shell fragments and scattered small pebbles and cobbles. The overlying nonmarine terrace deposits consist of poorly sorted or unsorted, crudely stratified sand, rubble and gravel. Throughout the Palos Verdes Peninsula, this unit is as much as 100 feet thick toward the landward part of the terrace, although the exposed thickness is generally less than 50 feet.
2001 SEISMIC HAZARD ZONE REPORT FOR THE TORRANCE QUADRANGLE 25
The nearly level, gently sloping and undulating flatlands to the north, northeast and east of the uplands of the Palos Verdes Peninsula are underlain by Pleistocene and Holocene alluvial and eolian deposits. Pleistocene older alluvium (Qoa), consisting of sand, silt, clay and gravel, is exposed on the northwest-southeast-trending tract of gently sloping and moderately dissected land in the eastern half of the Torrance Quadrangle. Holocene older eolian dune deposits (Qoe), consisting of sand and silty sand, are exposed on the undulating land in the northwest quarter of the quadrangle.
Alluvial fan deposits (Qyf1) form the gently sloping, slightly dissected alluvial apron just northeast of the uplands of the Palos Verdes Peninsula and underlie the Torrance Municipal Airport and Lomita. Younger (?) Holocene alluvial fan deposits (Qyf2) form four distinct gently sloping and convex-outward fan-shaped deposits on the older (?) Holocene alluvial fan deposits. Younger (?) Holocene alluvial deposits (Qya2) form the level to gently sloping flatlands along the modern drainages that drain into the Dominquez Channel in the northeast quarter of the study area. Holocene undifferentiated alluvium (Qal) underlies the alluviated flatland channel south of Harbor Lake. A more detailed description of the late Quaternary geologic units is presented in the Liquefaction portion (Section 1) of this report. Modern artificial fills (af) are mapped extensively throughout the Los Angeles Harbor facilities, and, locally, at large schools.
Landslide deposits (Qls) are relatively abundant in the upland portion of the southwestern quarter of the quadrangle, above the lowest terrace and Palos Verdes Drive. The landslides are typically small to moderate in size on the slopes of drainage areas underlain by the Altimira Shale or basaltic rocks. The northern, upslope extent of the very large Portuguese Bend Landslide and the Flying Triangle Landslide extend into the southwestern corner of the quadrangle.
Structural Geology
The geologic structure of the Palos Verdes Peninsula is dominated by the Palos Verdes Fault and a large, broad northwest-southeast-trending doubly plunging anticline (Ehlig, 1982a; Bryant, 1987; Yerkes and others, 1965; Rowell, 1982). The anticlinal form of the peninsula has been uplifted as a horst between the Palos Verdes fault on the northeast and faults on the sea floor to the southwest. The Palos Verdes Fault is a steep, southwest-dipping reverse fault, upthrown on the southwest, that is exposed along the northeast margin of the Palos Verdes Hills and separates the upland area from the flatlands of the Central Plain of the Los Angeles Basin on the northeast. The axis of the anticline forms a concave-to-the-south arc from the northwest corner of the Palos Verdes Peninsula, in the area of Flatrock Point, extending toward the southeast to the vicinity of Whites Point (south of the Torrance Quadrangle). In most places within the anticline the strata are tilted less than 20 degrees.
In the Torrance Quadrangle, Woodring and others (1946) mapped a number of other structures. Those workers mapped a series of broad, approximately northwest-southeast-trending anticlines and adjacent synclines, including the Gaffey syncline and anticline, in the uplands of the southwest quarter of the quadrangle. These folds are likely undulations in the general anticlinal structure of the Palos Verdes Peninsula. Bedding in
DIVISION OF MINES AND GEOLOGY SHZR 035 26
the geologic units strikes approximately parallel to the trend of the structures with dips that range between 5 and 35.
Landslide Inventory
As a part of the geologic data compilation, an inventory of existing landslides in the Torrance Quadrangle was prepared using interpretation of stereo-paired aerial photographs of the study area and limited field reconnaissance (Haydon, unpublished). All areas containing landslides identified in the previous work of Woodring and others (1946), Cleveland (1976) and Ehlig (1982b) where re-evaluated during the aerial photograph interpretation conducted for this investigation. Some of the landslides identified in the previous work were not included in the landslide inventory because in our reevaluation it was concluded the feature was not a landslide, whereas many additional landslides were identified and the boundaries of many of the landslides were modified from the previous work. Landslides were mapped and digitized at a scale of 1:24,000. For each landslide included on the map a number of characteristics (attributes) were compiled. These characteristics include the confidence of interpretation (definite, probable and questionable) and other properties, such as activity, thickness, and associated geologic unit(s). Landslides rated as definite and probable were carried into the slope stability analysis. Landslides rated as questionable were not carried into the slope stability analysis due to the uncertainty of their existence. The completed hand-drawn landslide map was scanned, digitized, and the attributes were compiled in a database. A version of this landslide inventory is included with Plate 2.1.
ENGINEERING GEOLOGY
Geologic Material Strength
To evaluate the stability of geologic materials under earthquake conditions, the geologic map units described above were ranked and grouped on the basis of their shear strength. Generally, the primary source for rock shear-strength measurements is geotechnical reports prepared by consultants on file with local government permitting departments. Shear-strength data for the rock units identified on the Torrance Quadrangle geologic map were obtained from geotechnical reports prepared by consultants and on file with the local government permitting departments, (see Appendix A). The locations of rock and soil samples taken for shear testing by consultants are shown on Plate 2.1.
Shear strength data gathered from the above sources were compiled for each geologic map unit. Geologic units were grouped on the basis of average angle of internal friction (average phi) and lithologic character. Average (mean and median) phi values for each geologic map unit and corresponding strength group are summarized in Table 2.1. For most of the geologic strength groups in the map area, a single shear strength value was assigned and used in our slope stability analysis. A geologic material strength map was made based on the groupings presented in Tables 2.1 and 2.2, and this map provides a spatial representation of material strength for use in the slope stability analysis.
2001 SEISMIC HAZARD ZONE REPORT FOR THE TORRANCE QUADRANGLE 27
Adverse Bedding Conditions
Adverse bedding conditions are an important consideration in slope stability analyses. Adverse bedding conditions occur where the dip direction of bedded sedimentary rocks is roughly the same as the slope aspect, and where the dip magnitude is less than the slope gradient. Under these conditions, landslides can slip along bedding surfaces due to a lack of lateral support.
To account for adverse bedding in our slope stability evaluation, we used geologic structural data in combination with digital terrain data to identify areas with potentially adverse bedding, using methods similar to those of Brabb (1983). The structural data, derived from the geologic map database, was used to categorize areas of common bedding dip direction and magnitude. The dip direction was then compared to the slope aspect and, if the same, the dip magnitude and slope gradient categories were compared. If the dip magnitude was less than or equal to the slope gradient category but greater than 25% (4:1 slope), the area was marked as a potential adverse bedding area.
The Altamira Shale Member of the Monterey Formation, which contains interbedded sandstone and shale, was subdivided based on shear strength differences between coarse-grained (higher strength) and fine-grained (lower strength) lithologies. Shear strength values for the fine- and coarse-grained lithologies were then applied to areas of favorable and adverse bedding orientation, which were determined from structural and terrain data as discussed above. It was assumed that coarse-grained material (higher strength) dominates where bedding dips into a slope (favorable bedding) while fine-grained (lower strength) material dominates where bedding dips out of a slope (adverse bedding). The geologic material strength map was modified by assigning the lower, fine-grained shear strength values to areas where potential adverse bedding conditions were identified. The favorable and adverse bedding shear strength parameters for the Monterey Formation is included in Table 2.1.
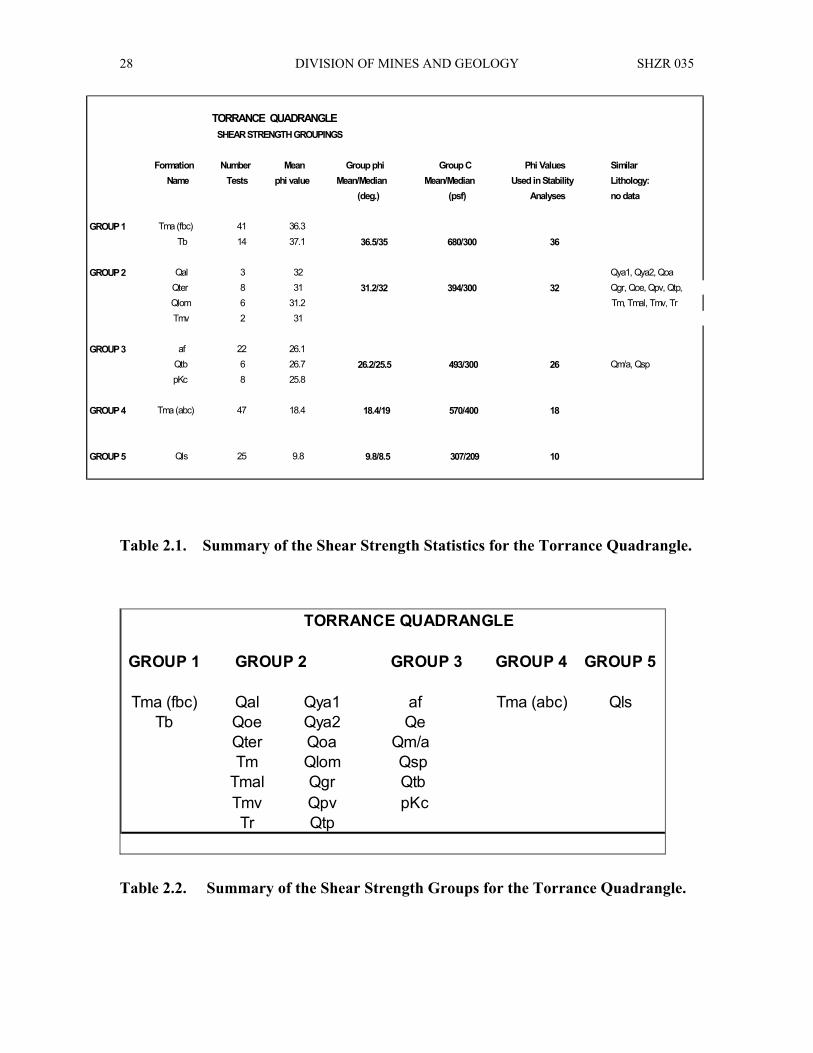
DIVISION OF MINES AND GEOLOGY SHZR 035
28
TORRANCE QUADRANGLESHEAR STRENGTH GROUPINGS
Formation Number Mean Group phi Group C Phi Values SimilarName Tests phi value Mean/Median Mean/Median Used in Stability Lithology:
(deg.) (psf) Analyses no data
GROUP 1 Tma (fbc) 41 36.3Tb 14 37.1 36.5/35 680/300 36
GROUP 2 Qal 3 32 Qya1, Qya2, QoaQter 8 31 31.2/32 394/300 32 Qgr, Qoe, Qpv, Qtp,Qlom 6 31.2 Tm, Tmal, Tmv, TrTmv 2 31
GROUP 3 af 22 26.1Qtb 6 26.7 26.2/25.5 493/300 26 Qm/a, QsppKc 8 25.8
GROUP 4 Tma (abc) 47 18.4 18.4/19 570/400 18
GROUP 5 Qls 25 9.8 9.8/8.5 307/209 10
Table 2.1. Summary of the Shear Strength Statistics for the Torrance Quadrangle.
TORRANCE QUADRANGLE
GROUP 1 GROUP 2 GROUP 3 GROUP 4 GROUP 5
Tma (fbc) Qal Qya1 af Tma (abc) QlsTb Qoe Qya2 Qe
Qter Qoa Qm/aTm Qlom Qsp
Tmal Qgr QtbTmv Qpv pKcTr Qtp
Table 2.2. Summary of the Shear Strength Groups for the Torrance Quadrangle.
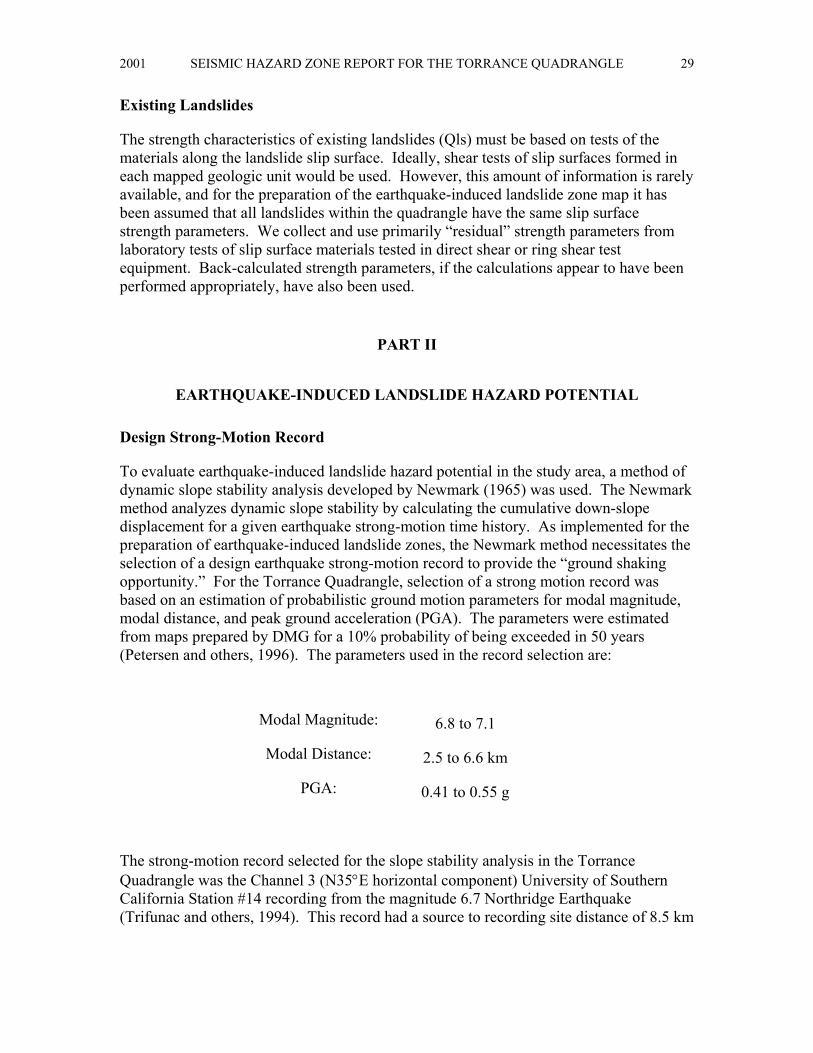
2001 SEISMIC HAZARD ZONE REPORT FOR THE TORRANCE QUADRANGLE 29
Existing Landslides
The strength characteristics of existing landslides (Qls) must be based on tests of the materials along the landslide slip surface. Ideally, shear tests of slip surfaces formed in each mapped geologic unit would be used. However, this amount of information is rarely available, and for the preparation of the earthquake-induced landslide zone map it has been assumed that all landslides within the quadrangle have the same slip surface strength parameters. We collect and use primarily “residual” strength parameters from laboratory tests of slip surface materials tested in direct shear or ring shear test equipment. Back-calculated strength parameters, if the calculations appear to have been performed appropriately, have also been used.
PART II
EARTHQUAKE-INDUCED LANDSLIDE HAZARD POTENTIAL
Design Strong-Motion Record
To evaluate earthquake-induced landslide hazard potential in the study area, a method of dynamic slope stability analysis developed by Newmark (1965) was used. The Newmark method analyzes dynamic slope stability by calculating the cumulative down-slope displacement for a given earthquake strong-motion time history. As implemented for the preparation of earthquake-induced landslide zones, the Newmark method necessitates the selection of a design earthquake strong-motion record to provide the “ground shaking opportunity.” For the Torrance Quadrangle, selection of a strong motion record was based on an estimation of probabilistic ground motion parameters for modal magnitude, modal distance, and peak ground acceleration (PGA). The parameters were estimated from maps prepared by DMG for a 10% probability of being exceeded in 50 years (Petersen and others, 1996). The parameters used in the record selection are:
Modal Magnitude: 6.8 to 7.1
Modal Distance: 2.5 to 6.6 km
PGA: 0.41 to 0.55 g
The strong-motion record selected for the slope stability analysis in the Torrance Quadrangle was the Channel 3 (N35°E horizontal component) University of Southern California Station #14 recording from the magnitude 6.7 Northridge Earthquake (Trifunac and others, 1994). This record had a source to recording site distance of 8.5 km
DIVISION OF MINES AND GEOLOGY SHZR 035 30
and a peak ground acceleration (PGA) of 0.59 g. The selected strong-motion record was not scaled or otherwise modified prior to its use in the analysis.
Displacement Calculation
The design strong-motion record was used to develop a relationship between landslide displacement and yield acceleration (ay), defined as the earthquake horizontal ground acceleration above which landslide displacements take place. This relationship was prepared by integrating the design strong-motion record twice for a given acceleration value to find the corresponding displacement, and the process was repeated for a range of acceleration values (Jibson, 1993). The resulting curve in Figure 2.1 represents the full spectrum of displacements that can be expected for the design strong-motion record. This curve provides the required link between anticipated earthquake shaking and estimates of displacement for different combinations of geologic materials and slope gradient, as described in the Slope Stability Analysis section below.
The amount of displacement predicted by the Newmark analysis provides an indication of the relative amount of damage that could be caused by earthquake-induced landsliding. Displacements of 30, 15 and 5 cm were used as criteria for rating levels of earthquake-induced landslide hazard potential based on the work of Youd (1980), Wilson and Keefer (1983), and a DMG pilot study for earthquake-induced landslides (McCrink and Real, 1996). Applied to the curve in Figure 2.1, these displacements correspond to yield accelerations of 0.076, 0.129 and 0.232 g. Because these yield acceleration values are derived from the design strong-motion record, they represent the ground shaking opportunity thresholds that are significant in the Torrance Quadrangle.
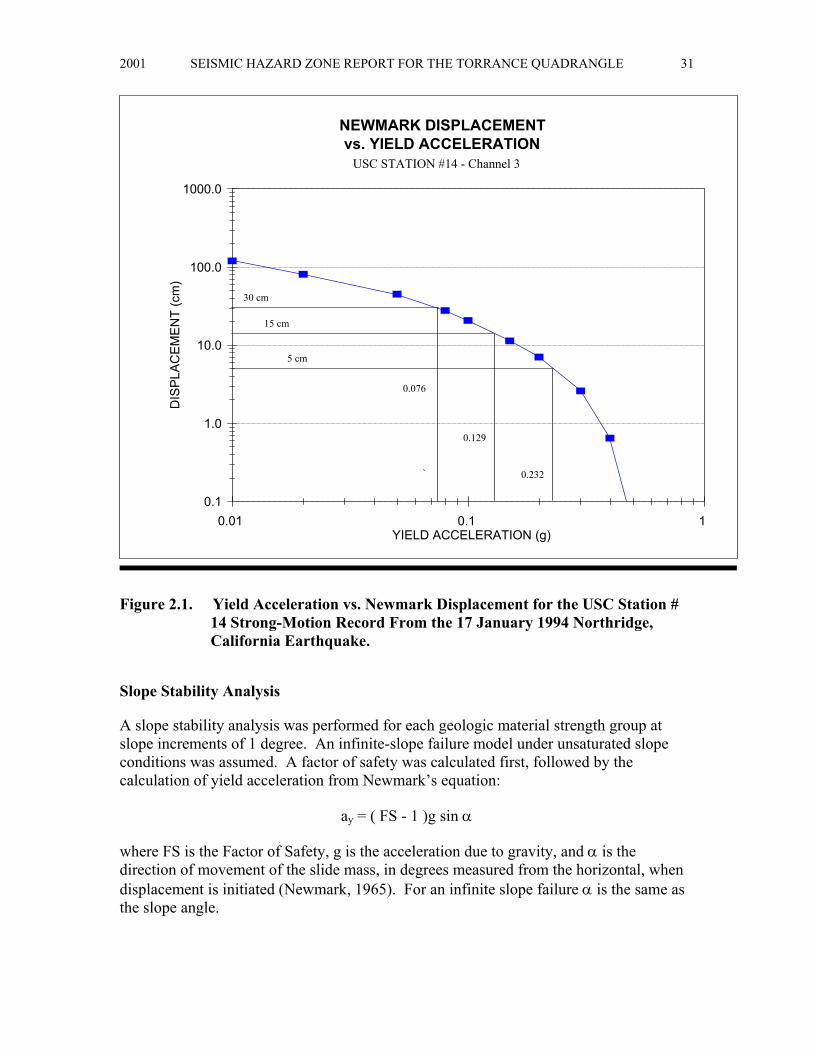
2001 SEISMIC HAZARD ZONE REPORT FOR THE TORRANCE QUADRANGLE 31
0.1
1.0
10.0
100.0
1000.0 D
ISP
LAC
EM
EN
T (c
m)
0.01 0.1 1 YIELD ACCELERATION (g)
NEWMARK DISPLACEMENTvs. YIELD ACCELERATION
30 cm
15 cm
5 cm
0.076
0.129
0.232
USC STATION #14 - Channel 3
Figure 2.1. Yield Acceleration vs. Newmark Displacement for the USC Station # 14 Strong-Motion Record From the 17 January 1994 Northridge, California Earthquake.
Slope Stability Analysis
A slope stability analysis was performed for each geologic material strength group at slope increments of 1 degree. An infinite-slope failure model under unsaturated slope conditions was assumed. A factor of safety was calculated first, followed by the calculation of yield acceleration from Newmark’s equation:
ay = ( FS - 1 )g sin α
where FS is the Factor of Safety, g is the acceleration due to gravity, and α is the direction of movement of the slide mass, in degrees measured from the horizontal, when displacement is initiated (Newmark, 1965). For an infinite slope failure α is the same as the slope angle.
DIVISION OF MINES AND GEOLOGY SHZR 035 32
The yield accelerations resulting from Newmark’s equations represent the susceptibility to earthquake-induced failure of each geologic material strength group for a range of slope gradients. Based on the relationship between yield acceleration and Newmark displacement shown in Figure 2.1, hazard potentials were assigned as follows:
1. If the calculated yield acceleration was less than 0.076g, Newmark displacement greater than 30 cm is indicated, and a HIGH hazard potential was assigned (H on Table 2.3)
2. If the calculated yield acceleration fell between 0.076g and 0.129g, Newmark displacement between 15 cm and 30 cm is indicated, and a MODERATE hazard potential was assigned (M on Table 2.3)
3. If the calculated yield acceleration fell between 0.129g and 0.232g, Newmark displacement between 5 cm and 15 cm is indicated, and a LOW hazard potential was assigned (L on Table 2.3)
4. If the calculated yield acceleration was greater than 0.129g, Newmark displacement of less than 5 cm is indicated, and a VERY LOW potential was assigned (VL on Table 2.3)
Table 2.3 summarizes the results of the stability analyses. The earthquake-induced landslide hazard potential map was prepared by combining the geologic material-strength map and the slope map according to this table.
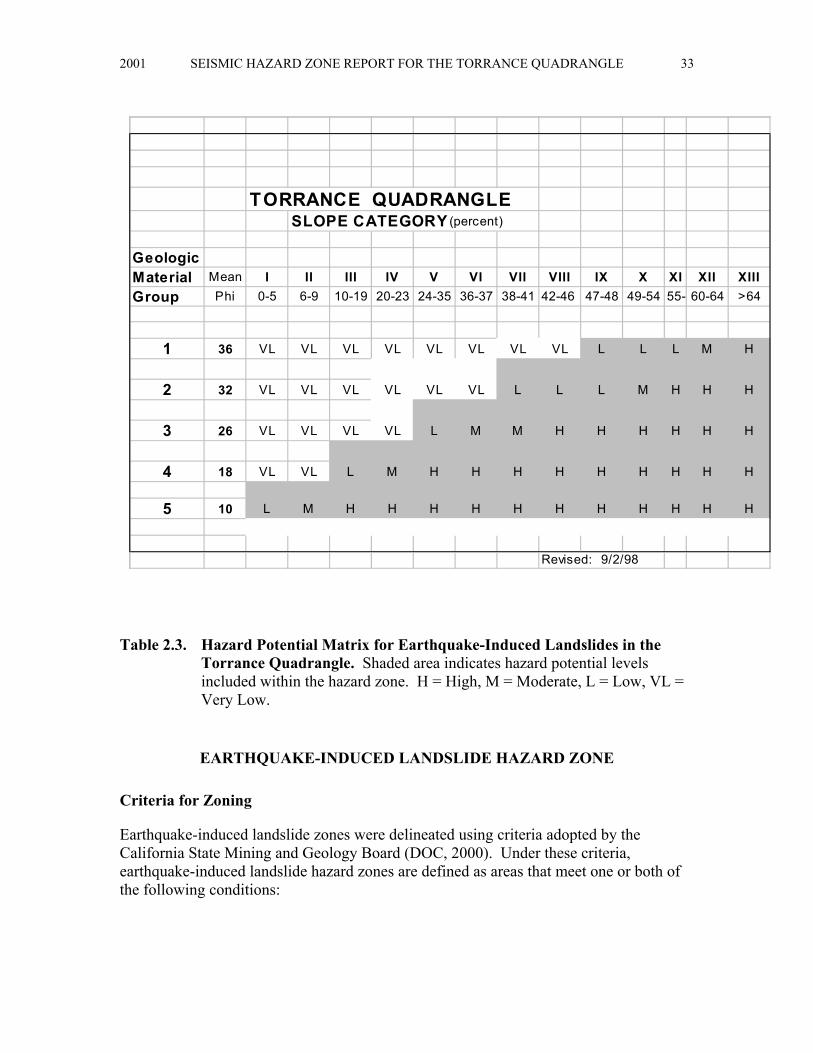
2001 SEISMIC HAZARD ZONE REPORT FOR THE TORRANCE QUADRANGLE 33
TORRANCE QUADRANGLESLOPE CATEGORY (percent)
GeologicMaterial Mean I II III IV V VI VII VIII IX X XI XII XIIIGroup Phi 0-5 6-9 10-19 20-23 24-35 36-37 38-41 42-46 47-48 49-54 55- 60-64 >64
1 36 VL VL VL VL VL VL VL VL L L L M H
2 32 VL VL VL VL VL VL L L L M H H H
3 26 VL VL VL VL L M M H H H H H H
4 18 VL VL L M H H H H H H H H H
5 10 L M H H H H H H H H H H H
Revised: 9/2/98
Table 2.3. Hazard Potential Matrix for Earthquake-Induced Landslides in the Torrance Quadrangle. Shaded area indicates hazard potential levels included within the hazard zone. H = High, M = Moderate, L = Low, VL = Very Low.
EARTHQUAKE-INDUCED LANDSLIDE HAZARD ZONE
Criteria for Zoning
Earthquake-induced landslide zones were delineated using criteria adopted by the California State Mining and Geology Board (DOC, 2000). Under these criteria, earthquake-induced landslide hazard zones are defined as areas that meet one or both of the following conditions:
DIVISION OF MINES AND GEOLOGY SHZR 035 34
1. Areas that have been identified as having experienced landslide movement in the past, including all mappable landslide deposits and source areas as well as any landslide that is known to have been triggered by historic earthquake activity.
2. Areas where the geologic and geotechnical data and analyses indicate that the earth materials may be susceptible to earthquake-induced slope failure.
These conditions are discussed in further detail in the following sections.
Existing Landslides
Existing landslides typically consist of disrupted soils and rock materials that are generally weaker than adjacent undisturbed rock and soil materials. Previous studies indicate that existing landslides can be reactivated by earthquake movements (Keefer, 1984). Earthquake-triggered movement of existing landslides is most pronounced in steep head scarp areas and at the toe of existing landslide deposits. Although reactivation of deep-seated landslide deposits is less common (Keefer, 1984), a significant number of deep-seated landslide movements have occurred during, or soon after, several recent earthquakes. Based on these observations, all existing landslides with a definite or probable confidence rating are included within the earthquake-induced landslide hazard zone.
Geologic and Geotechnical Analysis
Based on the conclusions of a pilot study performed by DMG (McCrink and Real, 1996), it has been concluded that earthquake-induced landslide hazard zones should encompass all areas that have a High, Moderate or Low level of hazard potential (see Table 2.3). This would include all areas where the analyses indicate earthquake displacements of 5 centimeters or greater. Areas with a Very Low hazard potential, indicating less than 5 centimeters displacement, are excluded from the zone.
As summarized in Table 2.3, all areas characterized by the following geologic strength group and slope gradient conditions are included in the earthquake-induced landslide hazard zone:
1. Geologic Strength Group 5 is included for all slope gradient categories. (Note: Geologic Strength Group 5 includes all mappable landslides with a definite or probable confidence rating).
2. Geologic Strength Group 4 is included for all slopes steeper than 9 percent.
3. Geologic Strength Group 3 is included for all slopes steeper than 23 percent.
4. Geologic Strength Group 2 is included for all slopes steeper than 37 percent.
5. Geologic Strength Group 1 is included for all slopes greater than 46 percent.
2001 SEISMIC HAZARD ZONE REPORT FOR THE TORRANCE QUADRANGLE 35
This results in roughly 17% (1,500 acres) of the upland, hilly portion of the Torrance Quadrangle lying within the earthquake-induced landslide zone.
ACKNOWLEDGMENTS
The authors thank staff from the City of Rancho Palos Verdes and County of Los Angeles, Department of Public Works, Material Engineering Division for their assistance in obtaining geotechnical information used in the preparation of this report. Technical review of the methodology was provided by Bruce Clark, Randy Jibson, Robert Larson, Scott Lindvall, and J. David Rogers, who are members of the State Mining and Geology Board’s Seismic Hazards Mapping Act Advisory Committee Landslides Working Group. At DMG, special thanks to Bob Moskovitz, Teri McGuire, Scott Shepherd and Barbara Wanish for their Geographic Information System operations support. Thanks also to the Bureau of Reclamation staff who built the DEM’s, Tim McCrink and Rick Wilson for providing assistance with digitizing terrain in graded areas, Joy Arthur for designing and plotting the graphic displays associated with the earthquake-induced landslide zone map, and to Lisa Chisholm for preparing the landslide attribute tables for input into this report.
REFERENCES
Bezore, S.P., Saucedo, G.J. and Greenwood, R. G., (unpublished), Geologic Map of the Long Beach 100,000-scale Quadrangle.
Brabb, E.E., 1983, Map showing direction and amount of bedding dip of sedimentary rocks in San Mateo County, California: U.S. Geological Survey Miscellaneous Investigations Series Map I-1257C, 1 sheet, scale 1:62,500.
Bryant, M.E., 1982, Geomorphology, neotectonics, and ages of marine terraces, Palos Verdes Peninsula: in Cooper, J.D., compiler, Landslides and landslide abatement, Palos Verdes Peninsula, Southern California, Association of Engineering Geologist, Southern California Section, Guidebook and Volume, Field Trip Number 10.
Bryant, M.E., 1987, Emergent marine terraces and Quaternary tectonics, Palos Verdes Peninsula, California, in Fischer, P.J., editor, Geology of the Palos Verdes Peninsula and San Pedro Bay, Society of Economic Paleontologists and Mineralogists & American Association of Petroleum Geologists Field Trip Guidebook, June 7.
California Department of Conservation, Division of Mines and Geology, 1997, Guidelines for evaluating and mitigating seismic hazards in California: California Department of Conservation, Division of Mines and Geology, Special Publication 117, 74 p.
DIVISION OF MINES AND GEOLOGY SHZR 035 36
California Department of Conservation, Division of Mines and Geology, 2000, Recommended criteria for delineating seismic hazard zones: California Department of Conservation, Division of Mines and Geology, Special Publication 118, 12 p.
Cleveland, G.B., 1976, Geology of the northeast part of the Palos Verdes Hills, Los Angeles County, California: California Division of Mines and Geology, Map Sheet 27, map scale - 1:12,000.
Ehlig, P.L., 1982a, The Palos Verdes Peninsula: It’s physiography, land use and geologic setting, in Cooper, J.D., compiler, Landslides and landslide abatement, Palos Verdes Peninsula, Southern California, Association of Engineering Geologist, Southern California Section, Guidebook and Volume, Field Trip Number 10.
Ehlig, P.L., 1982b, Mechanics of the Abalone Cove Landslide including the role of ground water in landslide stability and a model for development of large landslides in the Palos Verdes Hills, in Cooper, J.D., compiler, Landslides and landslide abatement, Palos Verdes Peninsula, Southern California, Association of Engineering Geologist, Southern California Section, Guidebook and Volume, Field Trip Number 10.
Haydon, W.D., 1998, unpublished, Landslide inventory map of the Torrance 7.5-minute Quadrangle, Los Angeles County, California.
Horn, B.K.P., 1981, Hill shading and the reflectance map: Proceedings of the IEEE, v. 69, no. 1, p. 14-47.
Jibson, R.W., 1993, Predicting earthquake-induced landslide displacements using Newmark’s sliding block analysis: Transportation Research Board, National Research Council, Transportation Research Record 1411, 17 p.
Keefer, D.K., 1984, Landslides caused by earthquakes: Geological Society of America Bulletin, v. 95, no. 4, p. 406-421.
Leighton & Associates, 1990, Technical Appendix to the Safety Element of the Los Angeles County General Plan, Hazard Reduction in Los Angeles County, Volumes 1 and 2.
McCrink, T.P. and Real, C.R., 1996, Evaluation of the Newmark method for mapping earthquake-induced landslide hazards in the Laurel 7-1/2 minute Quadrangle, Santa Cruz County, California: California Division of Mines and Geology Final Technical Report for U.S. Geological Survey Contract 143-93-G-2334, U.S. Geological Survey, Reston, Virginia, 31 p.
Newmark, N.M., 1965, Effects of earthquakes on dams and embankments: Geotechnique, v. 15, no. 2, p. 139-160.
Petersen, M.D., Bryant, W.A., Cramer, C.H., Cao. T., Reichle, M.S., Frankel, A.D., Lienkaemper, J.J., McCrory, P.A. and Schwartz, D.P., 1996, Probabilistic seismic
2001 SEISMIC HAZARD ZONE REPORT FOR THE TORRANCE QUADRANGLE 37
hazard assessment for the State of California: California Department of Conservation, Division of Mines and Geology, Open File Report 96-08; U.S. Geological Survey Open File Report 96-706, 33 p.
Rowell, H.C., 1982, Chronostratigraphy of the Monterey Formation of the Palos Verdes Hills, in Cooper, J.D., compiler, Landslides and landslide abatement, Palos Verdes Peninsula, Southern California, Association of Engineering Geologist, Southern California Section, Guidebook and Volume, Field Trip Number 10.
Smith, T.C., 1996, Preliminary maps of seismic hazard zones and draft guidelines for evaluating and mitigating seismic hazards: California Geology, v. 49, no. 6, p. 147-150.
Tinsley, J.C., Youd, T.L., Perkins, D.M. and Chen, A.T.F., 1985, Evaluating liquefaction potential, in Ziony, J.I., editor, Evaluating earthquake hazards in the Los Angeles region–An earth-science perspective: U.S. Geological Survey Professional Paper 1360, p. 263-315.
Trifunac, M.D., Todorovska, M.I. and Ivanovic, S.S., 1994, A note on distribution of uncorrected peak ground accelerations during the Northridge, California earthquake of 17 January 1994: Soil Dynamics and Earthquake Engineering, v. 13, no. 3, p. 187-196.
U.S. Geological Survey, 1993, Digital Elevation Models: National Mapping Program, Technical Instructions, Data Users Guide 5, 48 p.
Wilson, R.C. and Keefer, D.K., 1983, Dynamic analysis of a slope failure from the 1979 Coyote Lake, California, earthquake: Bulletin of the Seismological Society of America, v. 73, p. 863-877.
Woodring, W.P., Bramlette, M.N. and Kew, W.S.W., 1946, Geology and paleontology of Palos Verdes Hills, California: U.S. Geological Survey Professional Paper 207, maps - 1:24,000.
Yerkes, R.F., McCulloh, T.H., Schoellhamer, J.E. and Vedder, J.G., 1965, Geology of the Los Angeles basin, California -- An introduction: U. S. Geological Survey Professional Paper 420-A, 57 p.
Youd, T.L., 1980, Ground failure displacement and earthquake damage to buildings: American Society of Civil Engineers Conference on Civil Engineering and Nuclear Power, 2d, Knoxville, Tennessee, 1980, v. 2, p. 7-6-2 to 7-6-26.
DIVISION OF MINES AND GEOLOGY SHZR 035 38
AIR PHOTOS
NAPP, 1994, U.S. Geological Survey-National Aerial Photography Program (NAPP), flight 6862, frames 1-5, 71-73, flown 6/1/94, black and white, vertical, approximate scale 1:40,000.
United States Department of Agriculture (USDA), dated 8-31-54, Flight or Serial number AXJ, Photo numbers 19K-18-23, scale 1:20,000±.
United States Department of Agriculture (USDA), dated 6-4-59, Flight or Serial number AXJ, Photo numbers 13K-104-107, scale 1:20,000±.
United States Department of Agriculture (USDA), dated 12-4-52, Flight or Serial number AXJ, Photo numbers 7K-129-144, scale 1:20,000±.
APPENDIX A SOURCE OF ROCK STRENGTH DATA
SOURCE NUMBER OF TESTS SELECTED Division of Mines and Geology,
Environmental Impact Reports File 64
City of Rancho Palos Verdes, Planning Department
27
County of Los Angeles, Department of Public Works, Materials Engineering
Division
77
Total Number of Shear Tests 168
2001 SEISMIC HAZARD ZONE REPORT FOR THE TORRANCE QUADRANGLE 39
SECTION 3 GROUND SHAKING EVALUATION REPORT
Potential Ground Shaking in the
Torrance 7.5-Minute Quadrangle, Los Angeles County, California
By
Mark D. Petersen*, Chris H. Cramer*, Geoffrey A. Faneros, Charles R. Real, and Michael S. Reichle
California Department of Conservation
Division of Mines and Geology *Formerly with DMG, now with U.S. Geological Survey
PURPOSE
The Seismic Hazards Mapping Act (the Act) of 1990 (Public Resources Code, Chapter 7.8, Division 2) directs the California Department of Conservation (DOC), Division of Mines and Geology (DMG) to delineate Seismic Hazard Zones. The purpose of the Act is to reduce the threat to public health and safety and to minimize the loss of life and property by identifying and mitigating seismic hazards. Cities, counties, and state agencies are directed to use the Seismic Hazard Zone Maps in their land-use planning and permitting processes. The Act requires that site-specific geotechnical investigations be performed prior to permitting most urban development projects within the hazard zones. Evaluation and mitigation of seismic hazards are to be conducted under guidelines established by the California State Mining and Geology Board (DOC, 1997; also available on the Internet at http://gmw.consrv.ca.gov/shmp/webdocs/sp117.pdf).
This section of the evaluation report summarizes the ground motions used to evaluate liquefaction and earthquake-induced landslide potential for zoning purposes. Included are ground motion and related maps, a brief overview on how these maps were prepared, precautionary notes concerning their use, and related references. The maps provided
DIVISION OF MINES AND GEOLOGY SHZR 035 40
herein are presented at a scale of approximately 1:150,000 (scale bar provided on maps), and show the full 7.5-minute quadrangle and portions of the adjacent eight quadrangles. They can be used to assist in the specification of earthquake loading conditions for the analysis of ground failure according to the “Simple Prescribed Parameter Value” method (SPPV) described in the site investigation guidelines (California Department of Conservation, 1997). Alternatively, they can be used as a basis for comparing levels of ground motion determined by other methods with the statewide standard.
This section and Sections 1 and 2 (addressing liquefaction and earthquake-induced landslide hazards) constitute a report series that summarizes development of seismic hazard zone maps in the state. Additional information on seismic hazard zone mapping in California can be accessed on DMG’s Internet homepage: http://www.conservation.ca.gov/CGS/index.htm
EARTHQUAKE HAZARD MODEL
The estimated ground shaking is derived from the statewide probabilistic seismic hazard evaluation released cooperatively by the California Department of Conservation, Division of Mines and Geology, and the U.S. Geological Survey (Petersen and others, 1996). That report documents an extensive 3-year effort to obtain consensus within the scientific community regarding fault parameters that characterize the seismic hazard in California. Fault sources included in the model were evaluated for long-term slip rate, maximum earthquake magnitude, and rupture geometry. These fault parameters, along with historical seismicity, were used to estimate return times of moderate to large earthquakes that contribute to the hazard.
The ground shaking levels are estimated for each of the sources included in the seismic source model using attenuation relations that relate earthquake shaking with magnitude, distance from the earthquake, and type of fault rupture (strike-slip, reverse, normal, or subduction). The published hazard evaluation of Petersen and others (1996) only considers uniform firm-rock site conditions. In this report, however, we extend the hazard analysis to include the hazard of exceeding peak horizontal ground acceleration (PGA) at 10% probability of exceedance in 50 years on spatially uniform conditions of rock, soft rock, and alluvium. These soil and rock conditions approximately correspond to site categories defined in Chapter 16 of the Uniform Building Code (ICBO, 1997), which are commonly found in California. We use the attenuation relations of Boore and others (1997), Campbell (1997), Sadigh and others (1997), and Youngs and others (1997) to calculate the ground motions.
The seismic hazard maps for ground shaking are produced by calculating the hazard at sites separated by about 5 km. Figures 3.1 through 3.3 show the hazard for PGA at 10% probability of exceedance in 50 years assuming the entire map area is firm rock, soft rock, or alluvial site conditions respectively. The sites where the hazard is calculated are represented as dots and ground motion contours as shaded regions. The quadrangle of interest is outlined by bold lines and centered on the map. Portions of the eight adjacent
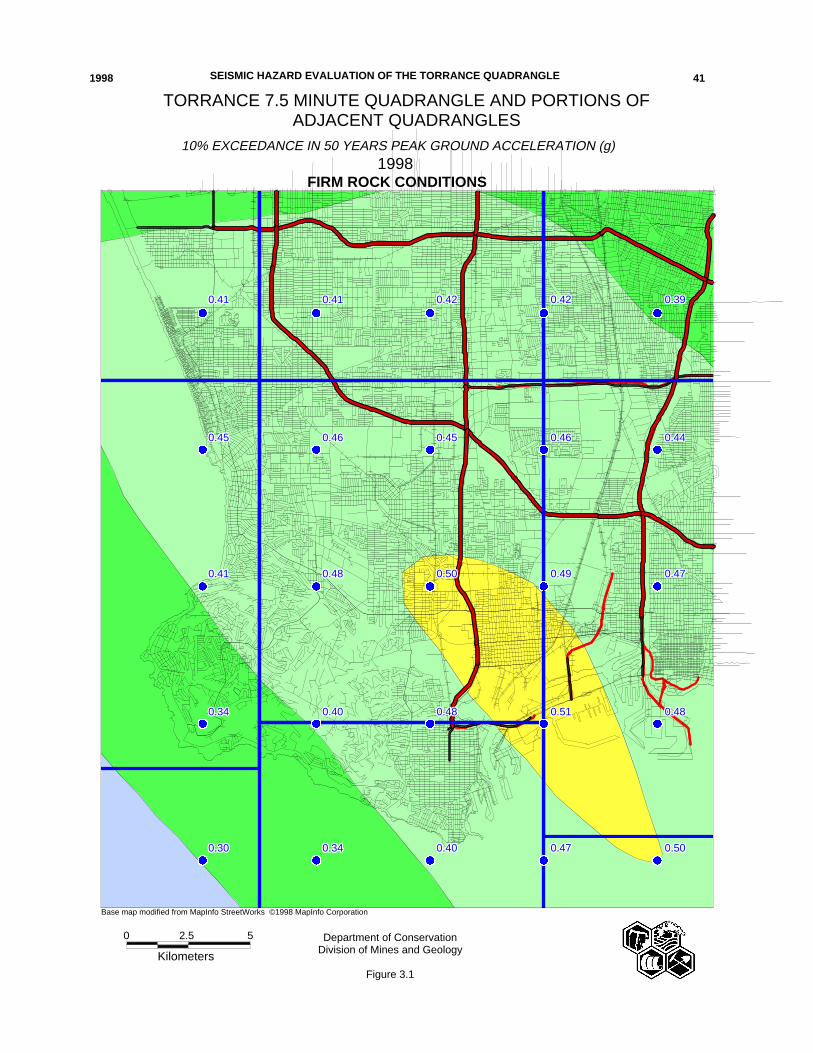
))))))))))))))))))))))))))))))))))))))))))))))))) ))))))))))))))))))))))))))))))))))))))))))))))))))))))))))))))))))))))))))))))))))))))))))))))))))))))))))))))))))))))))))))))))))))))))))))))))))) )))))))))))))))))))))))))))))))))))))))))))))))))
))))))))))))))))))))))))))))))))))))))))))))))))) ))))))))))))))))))))))))))))))))))))))))))))))))) ))))))))))))))))))))))))))))))))))))))))))))))))) ))))))))))))))))))))))))))))))))))))))))))))))))) )))))))))))))))))))))))))))))))))))))))))))))))))
))))))))))))))))))))))))))))))))))))))))))))))))) ))))))))))))))))))))))))))))))))))))))))))))))))) ))))))))))))))))))))))))))))))))))))))))))))))))) ))))))))))))))))))))))))))))))))))))))))))))))))) )))))))))))))))))))))))))))))))))))))))))))))))))
)))))))))))))))))))))))))))))))))))))))))))))))))))))))))))))))))))))))))))))))))))))))))))))))))) ))))))))))))))))))))))))))))))))))))))))))))))))) ))))))))))))))))))))))))))))))))))))))))))))))))) )))))))))))))))))))))))))))))))))))))))))))))))))
)))))))))))))))))))))))))))))))))))))))))))))))))))))))))))))))))))))))))))))))))))))))))))))))))) ))))))))))))))))))))))))))))))))))))))))))))))))) ))))))))))))))))))))))))))))))))))))))))))))))))) )))))))))))))))))))))))))))))))))))))))))))))))))
0.300.300.300.300.300.300.300.300.30 0.340.340.340.340.340.340.340.340.34 0.400.400.400.400.400.400.400.400.40 0.470.470.470.470.470.470.470.470.47 0.500.500.500.500.500.500.500.500.50
0.340.340.340.340.340.340.340.340.34 0.400.400.400.400.400.400.400.400.40 0.480.480.480.480.480.480.480.480.48 0.510.510.510.510.510.510.510.510.51 0.480.480.480.480.480.480.480.480.48
0.410.410.410.410.410.410.410.410.41 0.480.480.480.480.480.480.480.480.48 0.500.500.500.500.500.500.500.500.50 0.490.490.490.490.490.490.490.490.49 0.470.470.470.470.470.470.470.470.47
0.450.450.450.450.450.450.450.450.45 0.460.460.460.460.460.460.460.460.46 0.450.450.450.450.450.450.450.450.45 0.460.460.460.460.460.460.460.460.46 0.440.440.440.440.440.440.440.440.44
0.410.410.410.410.410.410.410.410.41 0.410.410.410.410.410.410.410.410.41 0.420.420.420.420.420.420.420.420.42 0.420.420.420.420.420.420.420.420.42 0.390.390.390.390.390.390.390.390.39
TORRANCE 7.5 MINUTE QUADRANGLE AND PORTIONS OFADJACENT QUADRANGLES
10% EXCEEDANCE IN 50 YEARS PEAK GROUND ACCELERATION (g)1998
FIRM ROCK CONDITIONS
Department of ConservationDivision of Mines and Geology
Figure 3.1
Kilometers
0 2.5 5
Base map modified from MapInfo StreetWorks ©1998 MapInfo Corporation
SEISMIC HAZARD EVALUATION OF THE TORRANCE QUADRANGLE 411998
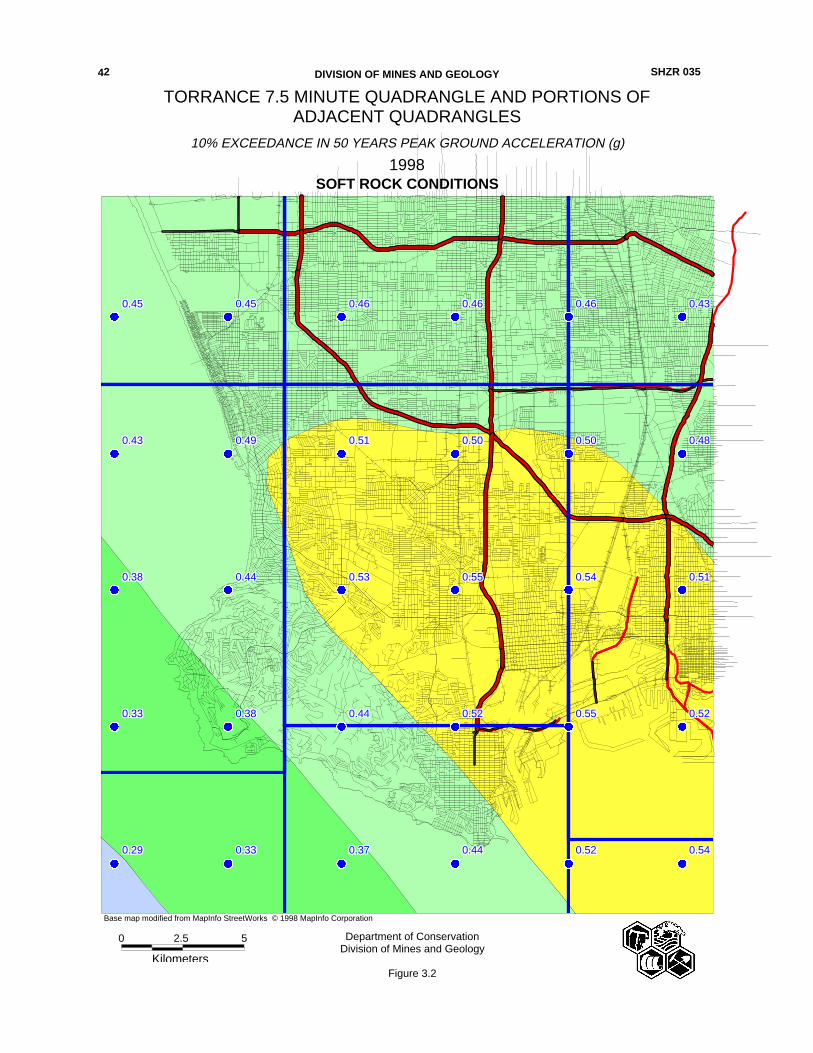
))))))))))))))))))))))))))))))))))))))))))))))))) ))))))))))))))))))))))))))))))))))))))))))))))))) ))))))))))))))))))))))))))))))))))))))))))))))))))))))))))))))))))))))))))))))))))))))))))))))))))))))))))))))))))))))))))))))))))))))))))))))))))) )))))))))))))))))))))))))))))))))))))))))))))))))
)))))))))))))))))))))))))))))))))))))))))))))))))))))))))))))))))))))))))))))))))))))))))))))))))) ))))))))))))))))))))))))))))))))))))))))))))))))) ))))))))))))))))))))))))))))))))))))))))))))))))) ))))))))))))))))))))))))))))))))))))))))))))))))) )))))))))))))))))))))))))))))))))))))))))))))))))
))))))))))))))))))))))))))))))))))))))))))))))))) ))))))))))))))))))))))))))))))))))))))))))))))))) ))))))))))))))))))))))))))))))))))))))))))))))))) ))))))))))))))))))))))))))))))))))))))))))))))))) ))))))))))))))))))))))))))))))))))))))))))))))))) )))))))))))))))))))))))))))))))))))))))))))))))))
0.290.290.290.290.290.290.290.290.29 0.330.330.330.330.330.330.330.330.33 0.370.370.370.370.370.370.370.370.37 0.440.440.440.440.440.440.440.440.44 0.520.520.520.520.520.520.520.520.52 0.540.540.540.540.540.540.540.540.54
0.330.330.330.330.330.330.330.330.33 0.380.380.380.380.380.380.380.380.38 0.440.440.440.440.440.440.440.440.44 0.520.520.520.520.520.520.520.520.52 0.550.550.550.550.550.550.550.550.55 0.520.520.520.520.520.520.520.520.52
0.380.380.380.380.380.380.380.380.38 0.440.440.440.440.440.440.440.440.44 0.530.530.530.530.530.530.530.530.53 0.550.550.550.550.550.550.550.550.55 0.540.540.540.540.540.540.540.540.54 0.510.510.510.510.510.510.510.510.51
0.430.430.430.430.430.430.430.430.43 0.490.490.490.490.490.490.490.490.49 0.510.510.510.510.510.510.510.510.51 0.500.500.500.500.500.500.500.500.50 0.500.500.500.500.500.500.500.500.50 0.480.480.480.480.480.480.480.480.48
0.450.450.450.450.450.450.450.450.45 0.450.450.450.450.450.450.450.450.45 0.460.460.460.460.460.460.460.460.46 0.460.460.460.460.460.460.460.460.46 0.460.460.460.460.460.460.460.460.46 0.430.430.430.430.430.430.430.430.43
TORRANCE 7.5 MINUTE QUADRANGLE AND PORTIONS OFADJACENT QUADRANGLES
10% EXCEEDANCE IN 50 YEARS PEAK GROUND ACCELERATION (g)
1998SOFT ROCK CONDITIONS
Department of ConservationDivision of Mines and Geology
Figure 3.2
0 2.5
Kilometers
5
Base map modified from MapInfo StreetWorks © 1998 MapInfo Corporation
DIVISION OF MINES AND GEOLOGY 42 SHZR 035
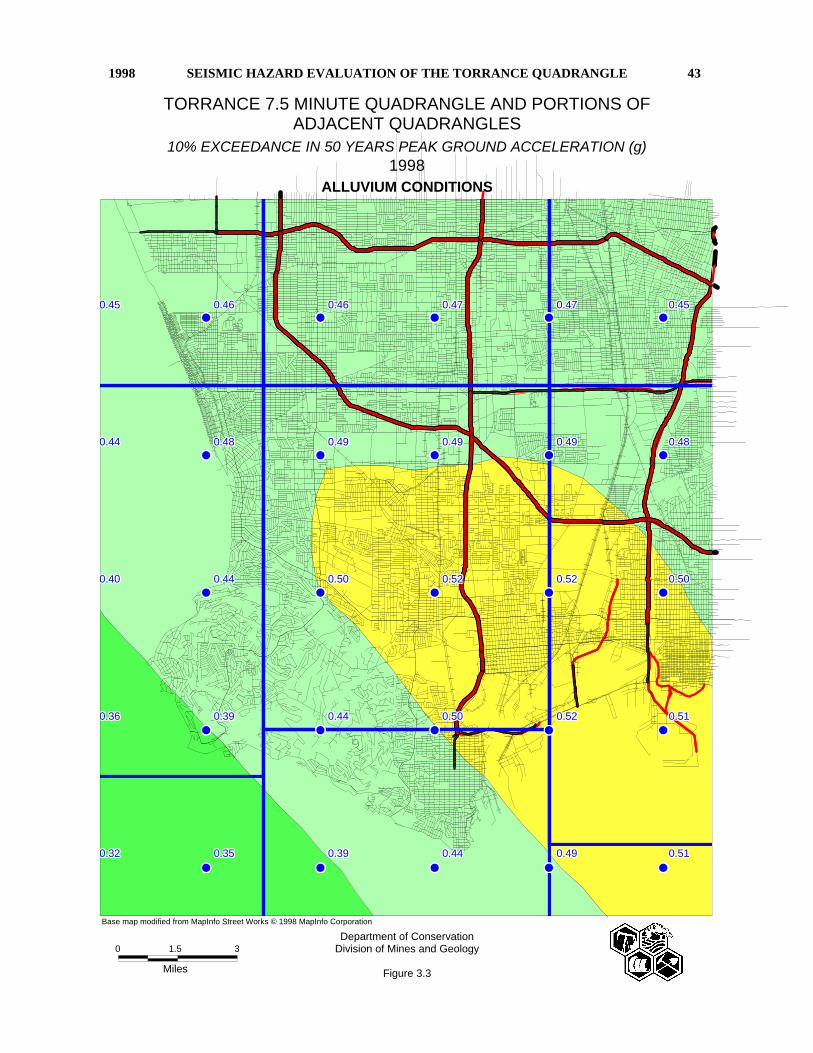
((((((((((((((((((((((((((((((((((((((((((((((((( ((((((((((((((((((((((((((((((((((((((((((((((((( ((((((((((((((((((((((((((((((((((((((((((((((((( ((((((((((((((((((((((((((((((((((((((((((((((((( (((((((((((((((((((((((((((((((((((((((((((((((((
((((((((((((((((((((((((((((((((((((((((((((((((( ((((((((((((((((((((((((((((((((((((((((((((((((( ((((((((((((((((((((((((((((((((((((((((((((((((( ((((((((((((((((((((((((((((((((((((((((((((((((( (((((((((((((((((((((((((((((((((((((((((((((((((
(((((((((((((((((((((((((((((((((((((((((((((((((((((((((((((((((((((((((((((((((((((((((((((((((( ((((((((((((((((((((((((((((((((((((((((((((((((( ((((((((((((((((((((((((((((((((((((((((((((((((( (((((((((((((((((((((((((((((((((((((((((((((((((
(((((((((((((((((((((((((((((((((((((((((((((((((((((((((((((((((((((((((((((((((((((((((((((((((( ((((((((((((((((((((((((((((((((((((((((((((((((( ((((((((((((((((((((((((((((((((((((((((((((((((( (((((((((((((((((((((((((((((((((((((((((((((((((
(((((((((((((((((((((((((((((((((((((((((((((((((((((((((((((((((((((((((((((((((((((((((((((((((( ((((((((((((((((((((((((((((((((((((((((((((((((( ((((((((((((((((((((((((((((((((((((((((((((((((( (((((((((((((((((((((((((((((((((((((((((((((((((
0.320.320.320.320.320.320.320.320.32 0.350.350.350.350.350.350.350.350.35 0.390.390.390.390.390.390.390.390.39 0.440.440.440.440.440.440.440.440.44 0.490.490.490.490.490.490.490.490.49 0.510.510.510.510.510.510.510.510.51
0.360.360.360.360.360.360.360.360.36 0.390.390.390.390.390.390.390.390.39 0.440.440.440.440.440.440.440.440.44 0.500.500.500.500.500.500.500.500.50 0.520.520.520.520.520.520.520.520.52 0.510.510.510.510.510.510.510.510.51
0.400.400.400.400.400.400.400.400.40 0.440.440.440.440.440.440.440.440.44 0.500.500.500.500.500.500.500.500.50 0.520.520.520.520.520.520.520.520.52 0.520.520.520.520.520.520.520.520.52 0.500.500.500.500.500.500.500.500.50
0.440.440.440.440.440.440.440.440.44 0.480.480.480.480.480.480.480.480.48 0.490.490.490.490.490.490.490.490.49 0.490.490.490.490.490.490.490.490.49 0.490.490.490.490.490.490.490.490.49 0.480.480.480.480.480.480.480.480.48
0.450.450.450.450.450.450.450.450.45 0.460.460.460.460.460.460.460.460.46 0.460.460.460.460.460.460.460.460.46 0.470.470.470.470.470.470.470.470.47 0.470.470.470.470.470.470.470.470.47 0.450.450.450.450.450.450.450.450.45
TORRANCE 7.5 MINUTE QUADRANGLE AND PORTIONS OFADJACENT QUADRANGLES
10% EXCEEDANCE IN 50 YEARS PEAK GROUND ACCELERATION (g)1998
ALLUVIUM CONDITIONS
Department of ConservationDivision of Mines and Geology
Figure 3.3
0 1.5
Miles
3
Base map modified from MapInfo Street Works © 1998 MapInfo Corporation
SEISMIC HAZARD EVALUATION OF THE TORRANCE QUADRANGLE1998 43
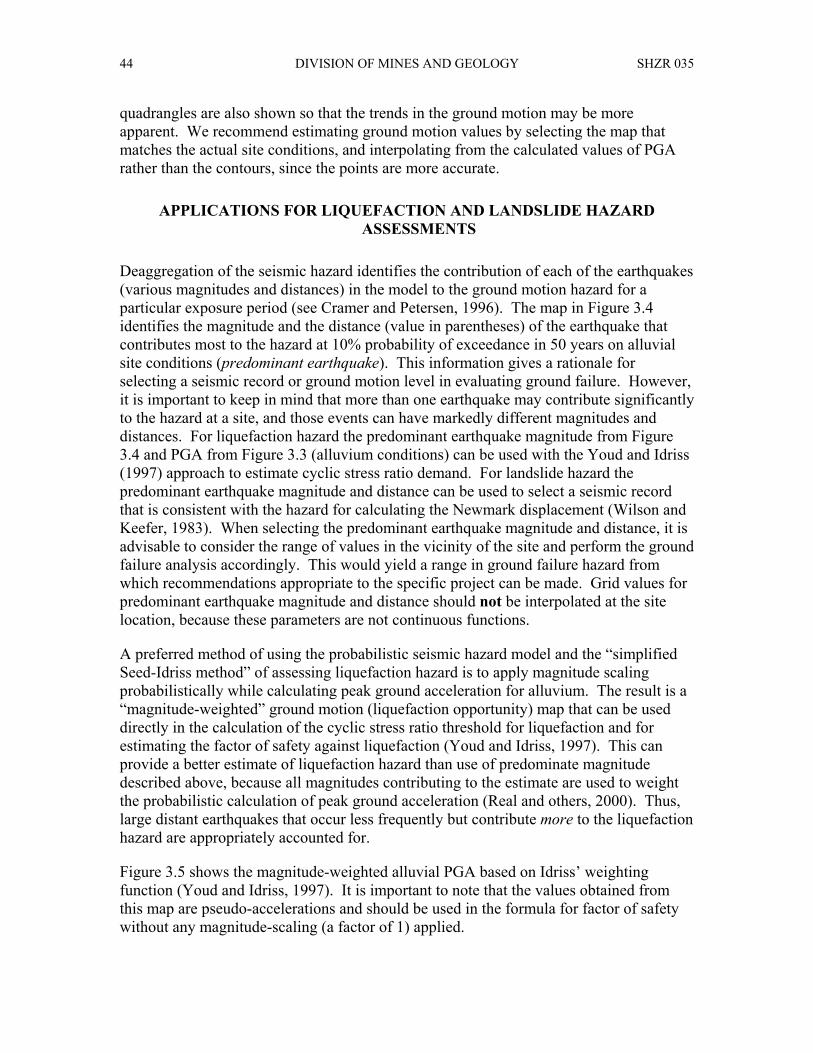
DIVISION OF MINES AND GEOLOGY SHZR 035 44
quadrangles are also shown so that the trends in the ground motion may be more apparent. We recommend estimating ground motion values by selecting the map that matches the actual site conditions, and interpolating from the calculated values of PGA rather than the contours, since the points are more accurate.
APPLICATIONS FOR LIQUEFACTION AND LANDSLIDE HAZARD ASSESSMENTS
Deaggregation of the seismic hazard identifies the contribution of each of the earthquakes (various magnitudes and distances) in the model to the ground motion hazard for a particular exposure period (see Cramer and Petersen, 1996). The map in Figure 3.4 identifies the magnitude and the distance (value in parentheses) of the earthquake that contributes most to the hazard at 10% probability of exceedance in 50 years on alluvial site conditions (predominant earthquake). This information gives a rationale for selecting a seismic record or ground motion level in evaluating ground failure. However, it is important to keep in mind that more than one earthquake may contribute significantly to the hazard at a site, and those events can have markedly different magnitudes and distances. For liquefaction hazard the predominant earthquake magnitude from Figure 3.4 and PGA from Figure 3.3 (alluvium conditions) can be used with the Youd and Idriss (1997) approach to estimate cyclic stress ratio demand. For landslide hazard the predominant earthquake magnitude and distance can be used to select a seismic record that is consistent with the hazard for calculating the Newmark displacement (Wilson and Keefer, 1983). When selecting the predominant earthquake magnitude and distance, it is advisable to consider the range of values in the vicinity of the site and perform the ground failure analysis accordingly. This would yield a range in ground failure hazard from which recommendations appropriate to the specific project can be made. Grid values for predominant earthquake magnitude and distance should not be interpolated at the site location, because these parameters are not continuous functions.
A preferred method of using the probabilistic seismic hazard model and the “simplified Seed-Idriss method” of assessing liquefaction hazard is to apply magnitude scaling probabilistically while calculating peak ground acceleration for alluvium. The result is a “magnitude-weighted” ground motion (liquefaction opportunity) map that can be used directly in the calculation of the cyclic stress ratio threshold for liquefaction and for estimating the factor of safety against liquefaction (Youd and Idriss, 1997). This can provide a better estimate of liquefaction hazard than use of predominate magnitude described above, because all magnitudes contributing to the estimate are used to weight the probabilistic calculation of peak ground acceleration (Real and others, 2000). Thus, large distant earthquakes that occur less frequently but contribute more to the liquefaction hazard are appropriately accounted for.
Figure 3.5 shows the magnitude-weighted alluvial PGA based on Idriss’ weighting function (Youd and Idriss, 1997). It is important to note that the values obtained from this map are pseudo-accelerations and should be used in the formula for factor of safety without any magnitude-scaling (a factor of 1) applied.
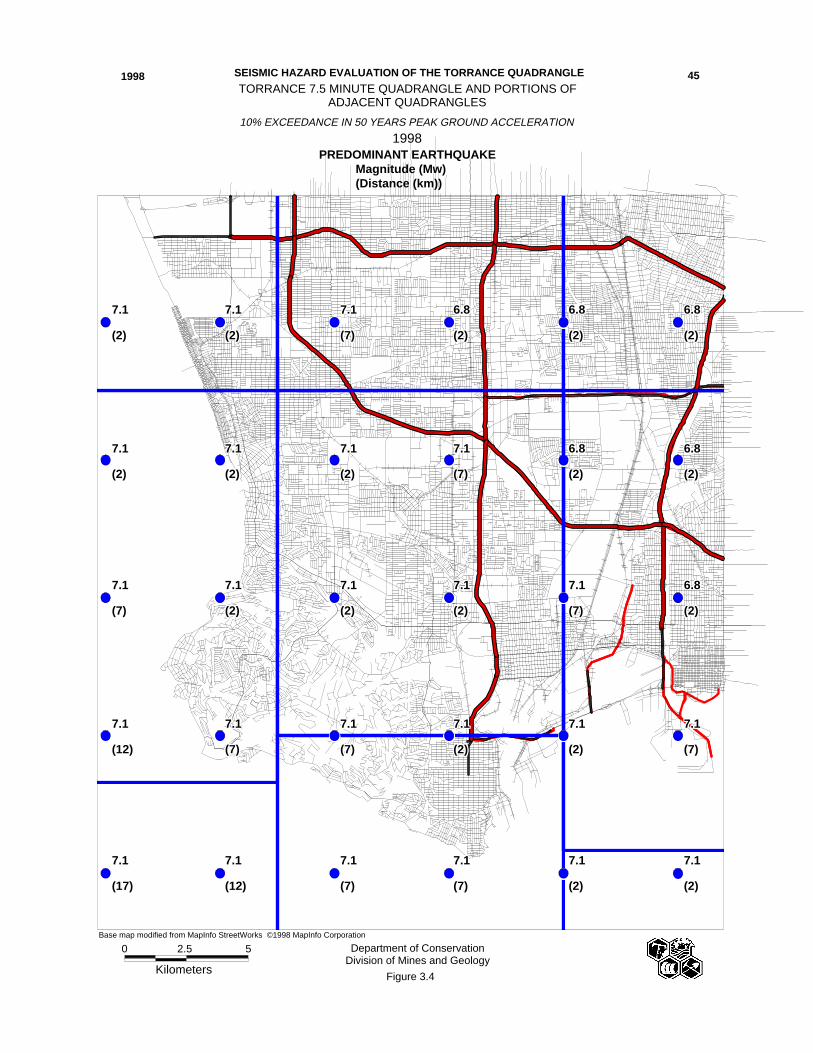
))))))))))))))))))))))))))))))))))))))))))))))))) ))))))))))))))))))))))))))))))))))))))))))))))))) ))))))))))))))))))))))))))))))))))))))))))))))))) ))))))))))))))))))))))))))))))))))))))))))))))))) )))))))))))))))))))))))))))))))))))))))))))))))))
))))))))))))))))))))))))))))))))))))))))))))))))) )))))))))))))))))))))))))))))))))))))))))))))))))
))))))))))))))))))))))))))))))))))))))))))))))))) ))))))))))))))))))))))))))))))))))))))))))))))))) ))))))))))))))))))))))))))))))))))))))))))))))))) ))))))))))))))))))))))))))))))))))))))))))))))))) ))))))))))))))))))))))))))))))))))))))))))))))))) )))))))))))))))))))))))))))))))))))))))))))))))))
))))))))))))))))))))))))))))))))))))))))))))))))) ))))))))))))))))))))))))))))))))))))))))))))))))) ))))))))))))))))))))))))))))))))))))))))))))))))) )))))))))))))))))))))))))))))))))))))))))))))))))
)))))))))))))))))))))))))))))))))))))))))))))))))))))))))))))))))))))))))))))))))))))))))))))))))) ))))))))))))))))))))))))))))))))))))))))))))))))) ))))))))))))))))))))))))))))))))))))))))))))))))) ))))))))))))))))))))))))))))))))))))))))))))))))) )))))))))))))))))))))))))))))))))))))))))))))))))
))))))))))))))))))))))))))))))))))))))))))))))))) ))))))))))))))))))))))))))))))))))))))))))))))))) ))))))))))))))))))))))))))))))))))))))))))))))))) ))))))))))))))))))))))))))))))))))))))))))))))))) ))))))))))))))))))))))))))))))))))))))))))))))))) )))))))))))))))))))))))))))))))))))))))))))))))))
)))))))))))))))))))))))))))))))))))))))))))))))))7.17.17.17.17.17.17.17.17.1 7.17.17.17.17.17.17.17.17.1 7.17.17.17.17.17.17.17.17.1 7.17.17.17.17.17.17.17.17.1 7.17.17.17.17.17.17.17.17.1 7.17.17.17.17.17.17.17.17.1
7.17.17.17.17.17.17.17.17.1 7.17.17.17.17.17.17.17.17.1 7.17.17.17.17.17.17.17.17.1 7.17.17.17.17.17.17.17.17.1 7.17.17.17.17.17.17.17.17.1 7.17.17.17.17.17.17.17.17.1
7.17.17.17.17.17.17.17.17.1 7.17.17.17.17.17.17.17.17.1 7.17.17.17.17.17.17.17.17.1 7.17.17.17.17.17.17.17.17.1 7.17.17.17.17.17.17.17.17.1 6.86.86.86.86.86.86.86.86.8
7.17.17.17.17.17.17.17.17.1 7.17.17.17.17.17.17.17.17.1 7.17.17.17.17.17.17.17.17.1 7.17.17.17.17.17.17.17.17.1 6.86.86.86.86.86.86.86.86.8 6.86.86.86.86.86.86.86.86.8
7.17.17.17.17.17.17.17.17.1 7.17.17.17.17.17.17.17.17.1 7.17.17.17.17.17.17.17.17.1 6.86.86.86.86.86.86.86.86.8 6.86.86.86.86.86.86.86.86.8 6.86.86.86.86.86.86.86.86.8
(17)(17)(17)(17)(17)(17)(17)(17)(17) (12)(12)(12)(12)(12)(12)(12)(12)(12) (7)(7)(7)(7)(7)(7)(7)(7)(7) (7)(7)(7)(7)(7)(7)(7)(7)(7) (2)(2)(2)(2)(2)(2)(2)(2)(2) (2)(2)(2)(2)(2)(2)(2)(2)(2)
(12)(12)(12)(12)(12)(12)(12)(12)(12) (7)(7)(7)(7)(7)(7)(7)(7)(7) (7)(7)(7)(7)(7)(7)(7)(7)(7) (2)(2)(2)(2)(2)(2)(2)(2)(2) (2)(2)(2)(2)(2)(2)(2)(2)(2) (7)(7)(7)(7)(7)(7)(7)(7)(7)
(7)(7)(7)(7)(7)(7)(7)(7)(7) (2)(2)(2)(2)(2)(2)(2)(2)(2) (2)(2)(2)(2)(2)(2)(2)(2)(2) (2)(2)(2)(2)(2)(2)(2)(2)(2) (7)(7)(7)(7)(7)(7)(7)(7)(7) (2)(2)(2)(2)(2)(2)(2)(2)(2)
(2)(2)(2)(2)(2)(2)(2)(2)(2) (2)(2)(2)(2)(2)(2)(2)(2)(2) (2)(2)(2)(2)(2)(2)(2)(2)(2) (7)(7)(7)(7)(7)(7)(7)(7)(7) (2)(2)(2)(2)(2)(2)(2)(2)(2) (2)(2)(2)(2)(2)(2)(2)(2)(2)
(2)(2)(2)(2)(2)(2)(2)(2)(2) (2)(2)(2)(2)(2)(2)(2)(2)(2) (7)(7)(7)(7)(7)(7)(7)(7)(7) (2)(2)(2)(2)(2)(2)(2)(2)(2) (2)(2)(2)(2)(2)(2)(2)(2)(2) (2)(2)(2)(2)(2)(2)(2)(2)(2)
TORRANCE 7.5 MINUTE QUADRANGLE AND PORTIONS OFADJACENT QUADRANGLES
10% EXCEEDANCE IN 50 YEARS PEAK GROUND ACCELERATION
1998PREDOMINANT EARTHQUAKE Magnitude (Mw) (Distance (km))
Department of ConservationDivision of Mines and Geology
0 2.5
Kilometers
5
Figure 3.4
Base map modified from MapInfo StreetWorks ©1998 MapInfo Corporation
SEISMIC HAZARD EVALUATION OF THE TORRANCE QUADRANGLE1998 45
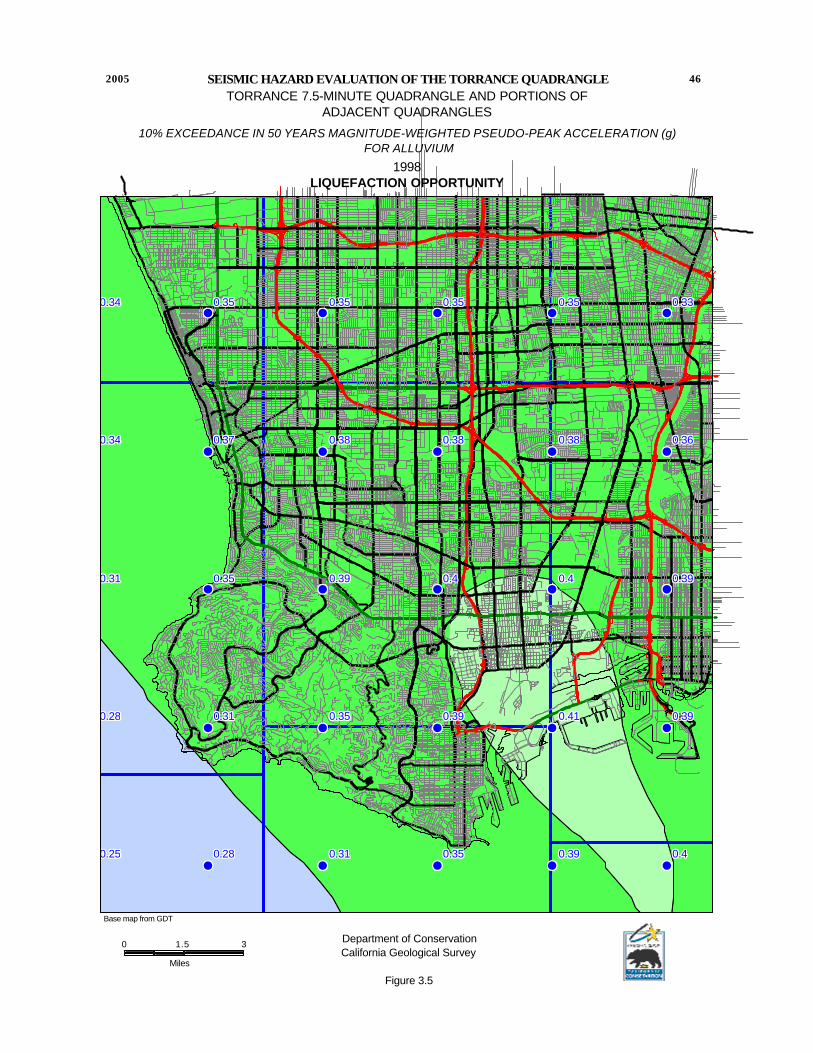
(((((((((((((((((( ((((((((( ((((((((( (((((((((
(((((((((((((((((( ((((((((( ((((((((( (((((((((
(((((((((((((((((( ((((((((( ((((((((( (((((((((
((((((((( ((((((((( ((((((((( ((((((((( (((((((((
((((((((( ((((((((( ((((((((( ((((((((( (((((((((
0.250.250.250.250.250.250.250.250.25 0.280.280.280.280.280.280.280.280.28 0.310.310.310.310.310.310.310.310.31 0.350.350.350.350.350.350.350.350.35 0.390.390.390.390.390.390.390.390.39 0.40.40.40.40.40.40.40.40.4
0.280.280.280.280.280.280.280.280.28 0.310.310.310.310.310.310.310.310.31 0.350.350.350.350.350.350.350.350.35 0.390.390.390.390.390.390.390.390.39 0.410.410.410.410.410.410.410.410.41 0.390.390.390.390.390.390.390.390.39
0.310.310.310.310.310.310.310.310.31 0.350.350.350.350.350.350.350.350.35 0.390.390.390.390.390.390.390.390.39 0.40.40.40.40.40.40.40.40.4 0.40.40.40.40.40.40.40.40.4 0.390.390.390.390.390.390.390.390.39
0.340.340.340.340.340.340.340.340.34 0.370.370.370.370.370.370.370.370.37 0.380.380.380.380.380.380.380.380.38 0.380.380.380.380.380.380.380.380.38 0.380.380.380.380.380.380.380.380.38 0.360.360.360.360.360.360.360.360.36
0.340.340.340.340.340.340.340.340.34 0.350.350.350.350.350.350.350.350.35 0.350.350.350.350.350.350.350.350.35 0.350.350.350.350.350.350.350.350.35 0.350.350.350.350.350.350.350.350.35 0.330.330.330.330.330.330.330.330.33
TORRANCE 7.5-MINUTE QUADRANGLE AND PORTIONS OFADJACENT QUADRANGLES
10% EXCEEDANCE IN 50 YEARS MAGNITUDE-WEIGHTED PSEUDO-PEAK ACCELERATION (g) FOR ALLUVIUM
1998LIQUEFACTION OPPORTUNITY
Department of ConservationCalifornia Geological Survey
Figure 3.5
0 1.5
Miles
3
Base map from GDT
SEISMIC HAZARD EVALUATION OF THE TORRANCE QUADRANGLE 462005
2001 SEISMIC HAZARD ZONE REPORT FOR THE TORRANCE QUADRANGLE 47
USE AND LIMITATIONS
The statewide map of seismic hazard has been developed using regional information and is not appropriate for site specific structural design applications. Use of the ground motion maps prepared at larger scale is limited to estimating earthquake loading conditions for preliminary assessment of ground failure at a specific location. We recommend consideration of site-specific analyses before deciding on the sole use of these maps for several reasons.
1. The seismogenic sources used to generate the peak ground accelerations were digitized from the 1:750,000-scale fault activity map of Jennings (1994). Uncertainties in fault location are estimated to be about 1 to 2 kilometers (Petersen and others, 1996). Therefore, differences in the location of calculated hazard values may also differ by a similar amount. At a specific location, however, the log-linear attenuation of ground motion with distance renders hazard estimates less sensitive to uncertainties in source location.
2. The hazard was calculated on a grid at sites separated by about 5 km (0.05 degrees). Therefore, the calculated hazard may be located a couple kilometers away from the site. We have provided shaded contours on the maps to indicate regional trends of the hazard model. However, the contours only show regional trends that may not be apparent from points on a single map. Differences of up to 2 km have been observed between contours and individual ground acceleration values. We recommend that the user interpolate PGA between the grid point values rather than simply using the shaded contours.
3. Uncertainties in the hazard values have been estimated to be about +/- 50% of the ground motion value at two standard deviations (Cramer and others, 1996).
4. Not all active faults in California are included in this model. For example, faults that do not have documented slip rates are not included in the source model. Scientific research may identify active faults that have not been previously recognized. Therefore, future versions of the hazard model may include other faults and omit faults that are currently considered.
5. A map of the predominant earthquake magnitude and distance is provided from the deaggregation of the probabilistic seismic hazard model. However, it is important to recognize that a site may have more than one earthquake that contributes significantly to the hazard. Therefore, in some cases earthquakes other than the predominant earthquake should also be considered.
Because of its simplicity, it is likely that the SPPV method (DOC, 1997) will be widely used to estimate earthquake shaking loading conditions for the evaluation of ground failure hazards. It should be kept in mind that ground motions at a given distance from an earthquake will vary depending on site-specific characteristics such as geology, soil properties, and topography, which may not have been adequately accounted for in the regional hazard analysis. Although this variance is represented to some degree by the
DIVISION OF MINES AND GEOLOGY SHZR 035 48
recorded ground motions that form the basis of the hazard model used to produce Figures 3.1, 3.2, and 3.3, extreme deviations can occur. More sophisticated methods that take into account other factors that may be present at the site (site amplification, basin effects, near source effects, etc.) should be employed as warranted. The decision to use the SPPV method with ground motions derived from Figures 3.1, 3.2, or 3.3 should be based on careful consideration of the above limitations, the geotechnical and seismological aspects of the project setting, and the “importance” or sensitivity of the proposed building with regard to occupant safety.
REFERENCES
Boore, D.M., Joyner, W.B. and Fumal, T.E., 1997, Empirical near-source attenuation relationships for horizontal and vertical components of peak ground acceleration, peak ground velocity, and pseudo-absolute acceleration response spectra: Seismological Research Letters, v. 68, p. 154-179.
California Department of Conservation, Division of Mines and Geology, 1997, Guidelines for evaluating and mitigating seismic hazards in California: Special Publication 117, 74 p.
Campbell, K.W., 1997, Attenuation relationships for shallow crustal earthquakes based on California strong motion data: Seismological Research Letters, v. 68, p. 180-189.
Cramer, C.H. and Petersen, M.D., 1996, Predominant seismic source distance and magnitude maps for Los Angeles, Orange and Ventura counties, California: Bulletin of the Seismological Society of America, v. 85, no. 5, p. 1645-1649.
Cramer, C.H., Petersen, M.D. and Reichle, M.S., 1996, A Monte Carlo approach in estimating uncertainty for a seismic hazard assessment of Los Angeles, Ventura, and Orange counties, California: Bulletin of the Seismological Society of America, v. 86, p. 1681-1691.
International Conference of Building Officials (ICBO), 1997, Uniform Building Code: v. 2, Structural engineering and installation standards, 492 p.
Jennings, C.W., compiler, 1994, Fault activity map of California and adjacent areas: California Department of Conservation, Division of Mines and Geology, California Geologic Data Map Series, map no. 8.
Petersen, M.D., Bryant, W.A., Cramer, C.H., Cao, T., Reichle, M.S., Frankel, A.D., Lienkaemper, J.J., McCrory, P.A. and Schwartz, D.P., 1996, Probabilistic seismic hazard assessment for the State of California: California Department of Conservation, Division of Mines and Geology Open-File Report 96-08; also U.S. Geological Survey Open-File Report 96-706, 33 p.
2001 SEISMIC HAZARD ZONE REPORT FOR THE TORRANCE QUADRANGLE 49
Real, C.R., Petersen, M.D., McCrink, T.P. and Cramer, C.H., 2000, Seismic Hazard Deaggregation in zoning earthquake-induced ground failures in southern California: Proceedings of the Sixth International Conference on Seismic Zonation, November 12-15, Palm Springs, California, EERI, Oakland, CA.
Sadigh, K., Chang, C.-Y., Egan, J.A., Makdisi, F. and Youngs, R.R., 1997, SEA96- A new predictive relation for earthquake ground motions in extensional tectonic regimes: Seismological Research Letters, v. 68, p. 190-198.
Wilson, R.C. and Keefer, D.K., 1983, Dynamic analysis of a slope failure from the 1979 Coyote Lake, California, Earthquake: Bulletin of the Seismological Society of America, v. 73, p. 863-877.
Youd, T.L. and Idriss I.M., 1997, Proceedings of the NCEER workshop on evaluation of liquefaction resistance of soils: Technical Report NCEER-97-0022, 40 p.
Youngs, R.R., Chiou, S.-J., Silva, W.J. and Humphrey, J.R., 1997, Stochastic point-source modeling of ground motions in the Cascadia Region: Seismological Research Letters, v. 68, p. 74-85.