Seismic Hazard Analysis for Phoenix /...
7
Seismic Hazard Analysis for Phoenix / Scottsdale J Ramón Arrowsmith Associate Professor of Geology at Arizona State University School of Earth and Space Exploration Arizona State University Tempe, AZ 85287-1404, U.S.A. (480) 965-3541 OFFICE (480) 965-8102 FAX [email protected] May 20, 2007 Introduction By most measures, central Arizona is in a low to moderate earthquake hazard setting. The largest historic earthquake felt in Phoenix was the 1887 Pitaycachi event in northern Sonora. Between 1906 and 1912, 3 M6 events occurred in the Flagstaff area (Figure 1). In this report, I combine several datasets relevant to earthquake recurrence in the Phoenix/Scottsdale area to identify the instrumental and historic events that have occurred within 50 and 100 km and the active faults in the area. All of the analyses were performed in ArcMap 9.2. Datasets Aside from the underlying roads, railroads, city boundaries, and digital elevation model, I used the following datasets: Dataset: ARIZONA EARTHQUAKES 1830-1998 ARIZONA EARTHQUAKE INFORMATION CENTER (AEIC) Building 12, Room 205 Tel: (928) 523-7196 or Department of Geology P.O. Box 4099 Flagstaff, Arizona 86011 Dave Brumbaugh, Director and Professor Building 12, Room 217 (928)523-7191 Download Data from Website: http://www4.nau.edu/geology/aeic/EQhistory.html Data Manipulation: Downloaded text file catalog, brought into ArcView as tab-delimited text, converted to shapefile, projected to UTM NAD27. This dataset has both the instrumentally located events as well as the compiled historical catalogue as defined by analysis of felt reports. Dataset: Quaternary Fault and Fold Database of the United States U.S. Geological Survey and Arizona Geological Survey, Quaternary fault and fold database for the United States, from USGS web site: http://earthquake.usgs.gov/regional/qfaults/ .
-
Upload
truongmien -
Category
Documents
-
view
223 -
download
0
Transcript of Seismic Hazard Analysis for Phoenix /...

Seismic Hazard Analysis for Phoenix / Scottsdale J Ramón Arrowsmith Associate Professor of Geology at Arizona State University School of Earth and Space Exploration Arizona State University Tempe, AZ 85287-1404, U.S.A. (480) 965-3541 OFFICE (480) 965-8102 FAX [email protected] May 20, 2007 Introduction By most measures, central Arizona is in a low to moderate earthquake hazard setting. The largest historic earthquake felt in Phoenix was the 1887 Pitaycachi event in northern Sonora. Between 1906 and 1912, 3 M6 events occurred in the Flagstaff area (Figure 1). In this report, I combine several datasets relevant to earthquake recurrence in the Phoenix/Scottsdale area to identify the instrumental and historic events that have occurred within 50 and 100 km and the active faults in the area. All of the analyses were performed in ArcMap 9.2. Datasets Aside from the underlying roads, railroads, city boundaries, and digital elevation model, I used the following datasets: Dataset: ARIZONA EARTHQUAKES 1830-1998 ARIZONA EARTHQUAKE INFORMATION CENTER (AEIC) Building 12, Room 205 Tel: (928) 523-7196 or Department of Geology P.O. Box 4099 Flagstaff, Arizona 86011 Dave Brumbaugh, Director and Professor Building 12, Room 217 (928)523-7191 Download Data from Website: http://www4.nau.edu/geology/aeic/EQhistory.html Data Manipulation: Downloaded text file catalog, brought into ArcView as tab-delimited text, converted to shapefile, projected to UTM NAD27. This dataset has both the instrumentally located events as well as the compiled historical catalogue as defined by analysis of felt reports. Dataset: Quaternary Fault and Fold Database of the United States U.S. Geological Survey and Arizona Geological Survey, Quaternary fault and fold database for the United States, from USGS web site: http://earthquake.usgs.gov/regional/qfaults/.
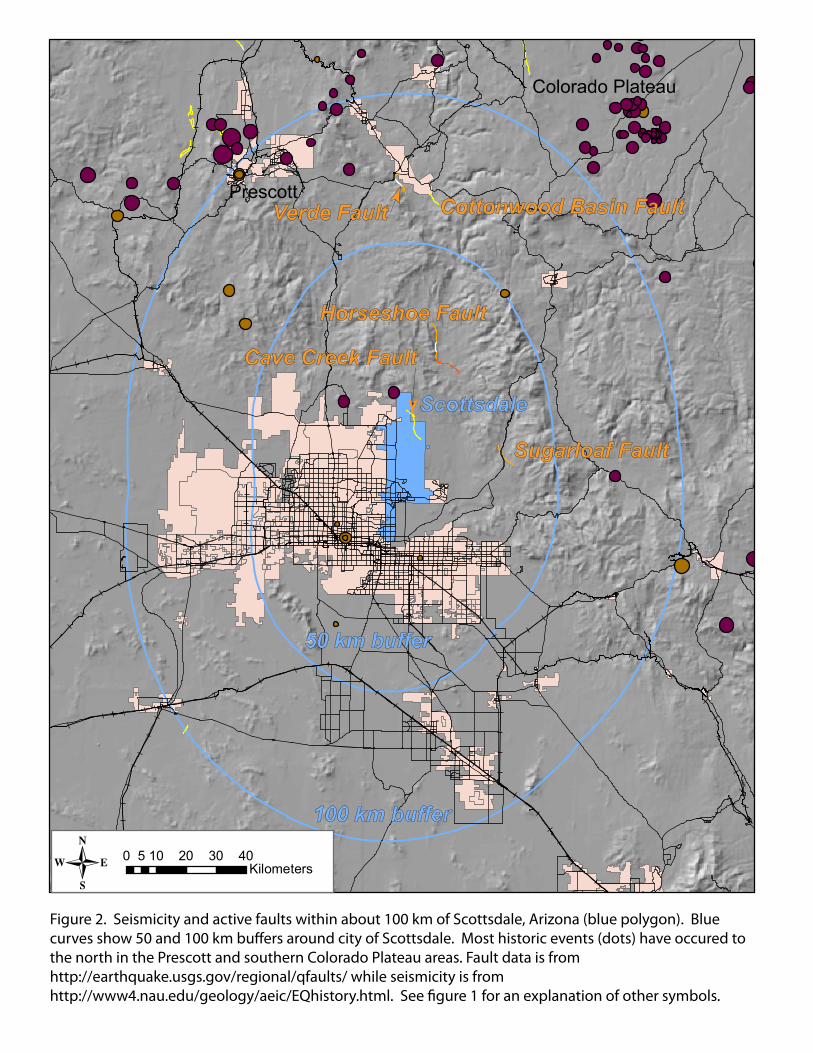
Results Seismicity near Phoenix/Scottsdale Table 1 and Figure 2 show the earthquakes that have occurred within 50 and 100 km of Scottsdale. I used a location-based query to find all events in the seismicity database that were completely within the 50 and 100 km buffers around Scottsdale (Figure 2). No events with local magnitudes > 3 have occurred in the area. The maximum intensities are 5 (light shaking). Maximum intensity of 5 probably correlates to magnitude of 3-4 (e.g., http://www.ees.nmt.edu/Geop/nmquakes/R86.HTM). Active faults near Phoenix/Scottsdale Table 2 and Figure 2 show the active faults within 50 and 100 km of Scottsdale. I also used a location-based query to find all faults in the active fault database that were contained by the 50 and 100 km buffers around Scottsdale (Figure 2). None of the faults have slip rates > 0.2 mm per year. The closest active fault to Scottsdale is the Carefree fault. It is 11 km long in total and is exposed, shows middle and late Quaternary activity. The Horseshoe Fault zone is as much as 20 km long and the Horseshoe Reservoir section apparently shows Holocene activity. The Sugarloaf fault zone is only about 7.5 km long in total and shows late Quaternary activity. Other faults between 50 and 100 km from Scottsdale include the Verde and Cottonwood Basin faults. Using the empirical relations of Wells and Coppersmith (1994) relating surface rupture length (SRL) to earthquake magnitude (M = 5.08 + 1.16*log(SRL)), these maximum fault lengths (assuming all fault segments rupture together) give maximum magnitudes of M6.3 (Carefree Fault), M6.6 (Horseshoe Fault), M6.1 (Sugarloaf Fault), M6.2 (Verde Fault), and M5.9 (Cottonwood Basin Fault). Note that individual segments would produce events much smaller (~M4-5). Again using Wells and Coppersmith (1994) and the above M estimates, M = 6.69 + 0,74*log(MD) where MD is maximum displacement. Thus the maximum displacement for the largest magnitude (Horseshoe Fault at M6.6) is 0.8 m, while the minimum would be 0.08 m for the M5.9 Cottonwood Basin Fault event. Given a maximum slip rate of 0.2 mm/yr, we would expect minimum earthquake recurrence intervals of 400 to 4000 years.
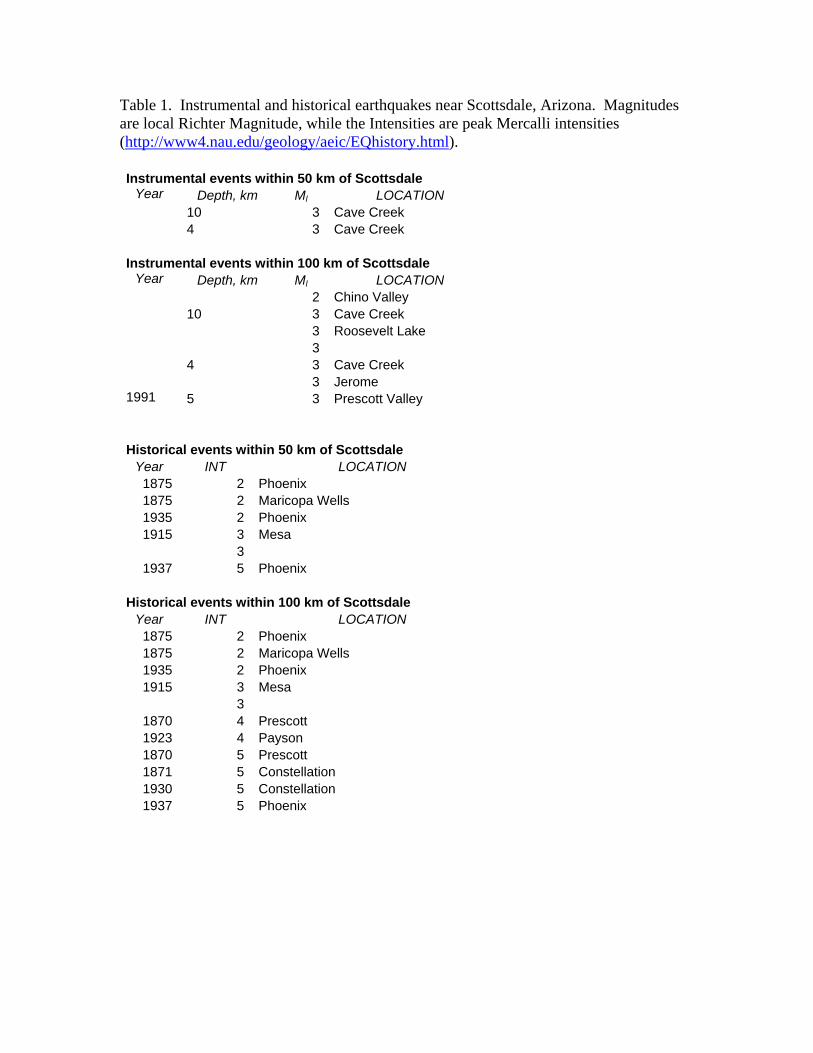
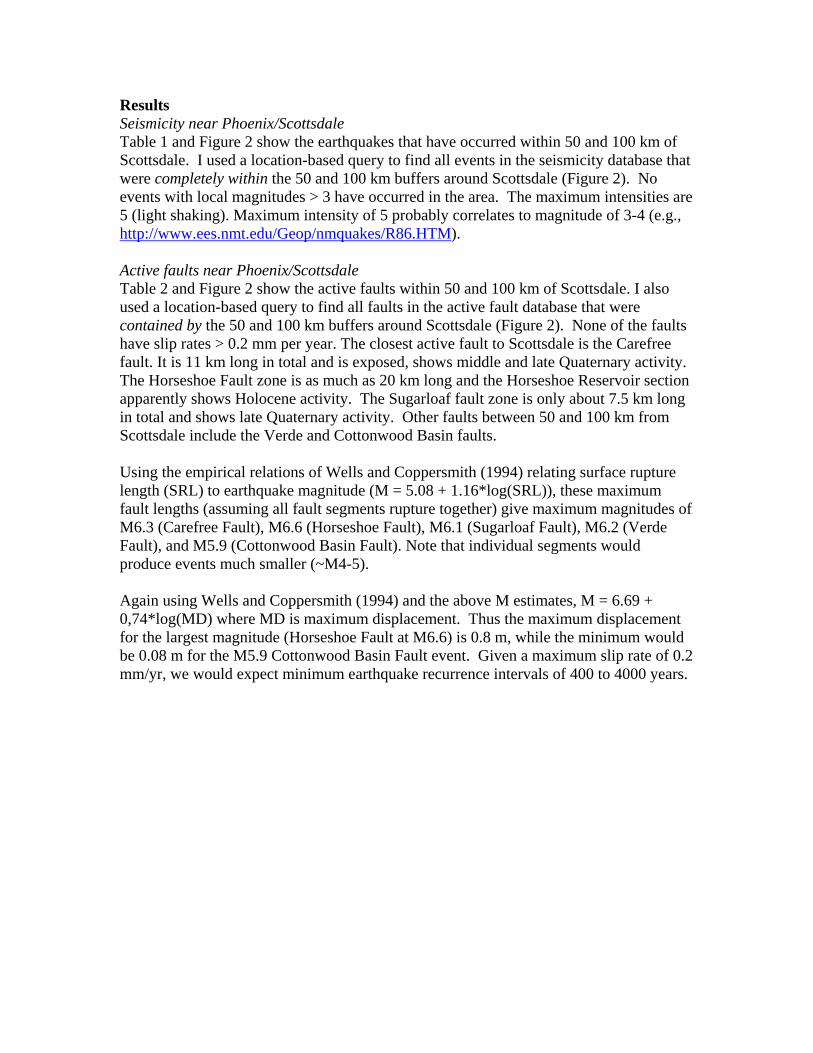
Table 1. Instrumental and historical earthquakes near Scottsdale, Arizona. Magnitudes are local Richter Magnitude, while the Intensities are peak Mercalli intensities (http://www4.nau.edu/geology/aeic/EQhistory.html). Instrumental events within 50 km of Scottsdale
Year Depth, km Ml LOCATION 10 3 Cave Creek 4 3 Cave Creek Instrumental events within 100 km of Scottsdale
Year Depth, km Ml LOCATION 2 Chino Valley 10 3 Cave Creek 3 Roosevelt Lake 3 4 3 Cave Creek 3 Jerome 1991 5 3 Prescott Valley Historical events within 50 km of Scottsdale
Year INT LOCATION 1875 2 Phoenix 1875 2 Maricopa Wells 1935 2 Phoenix 1915 3 Mesa
3 1937 5 Phoenix
Historical events within 100 km of Scottsdale
Year INT LOCATION 1875 2 Phoenix 1875 2 Maricopa Wells 1935 2 Phoenix 1915 3 Mesa
3 1870 4 Prescott 1923 4 Payson 1870 5 Prescott 1871 5 Constellation 1930 5 Constellation 1937 5 Phoenix
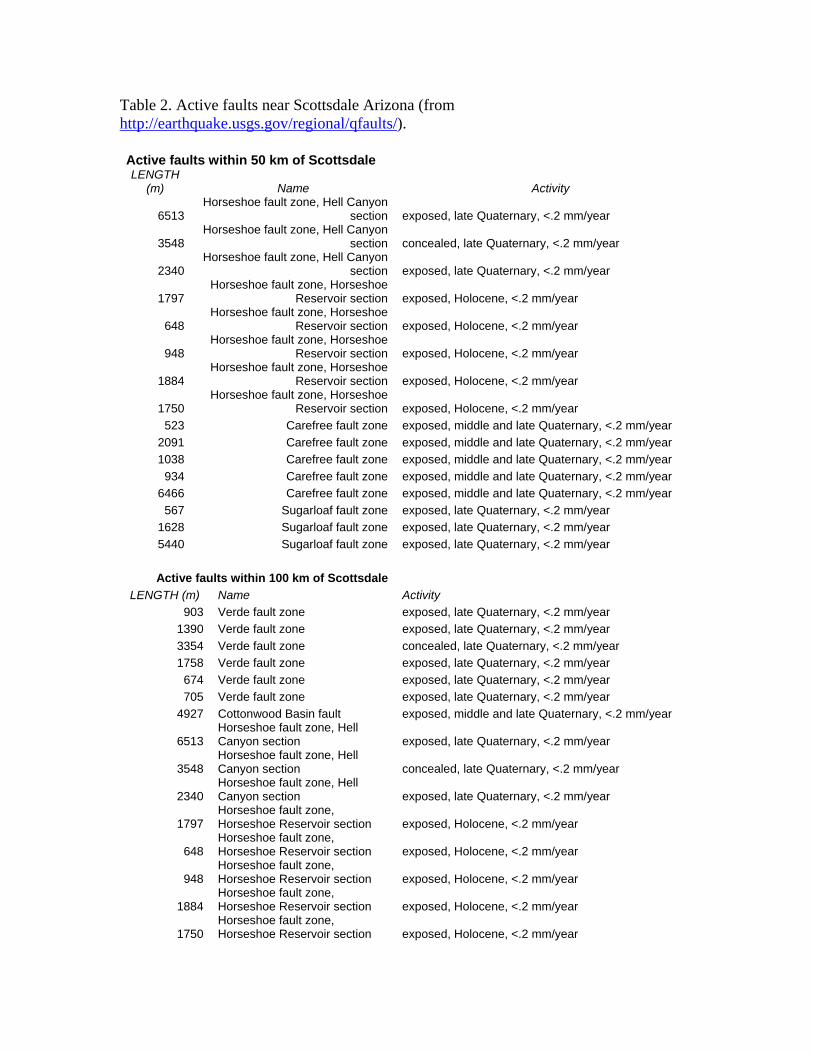
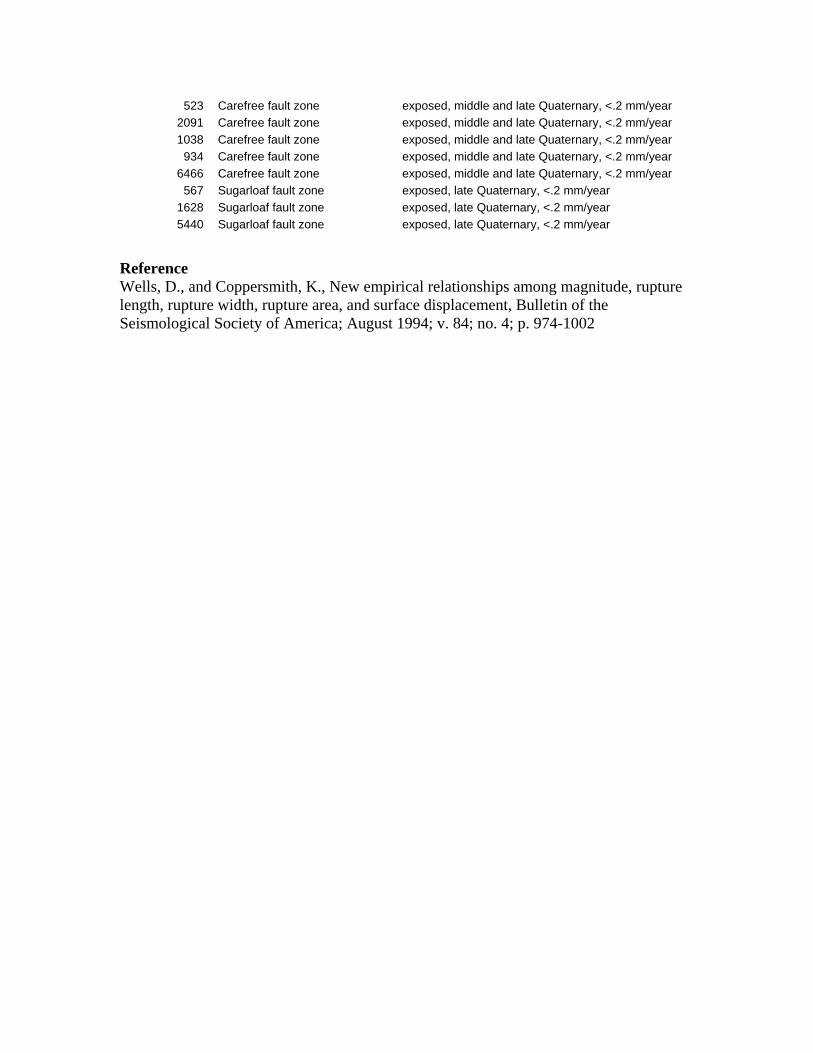
Table 2. Active faults near Scottsdale Arizona (from http://earthquake.usgs.gov/regional/qfaults/). Active faults within 50 km of Scottsdale LENGTH
(m) Name Activity
6513 Horseshoe fault zone, Hell Canyon
section exposed, late Quaternary, <.2 mm/year
3548 Horseshoe fault zone, Hell Canyon
section concealed, late Quaternary, <.2 mm/year
2340 Horseshoe fault zone, Hell Canyon
section exposed, late Quaternary, <.2 mm/year
1797 Horseshoe fault zone, Horseshoe
Reservoir section exposed, Holocene, <.2 mm/year
648 Horseshoe fault zone, Horseshoe
Reservoir section exposed, Holocene, <.2 mm/year
948 Horseshoe fault zone, Horseshoe
Reservoir section exposed, Holocene, <.2 mm/year
1884 Horseshoe fault zone, Horseshoe
Reservoir section exposed, Holocene, <.2 mm/year
1750 Horseshoe fault zone, Horseshoe
Reservoir section exposed, Holocene, <.2 mm/year 523 Carefree fault zone exposed, middle and late Quaternary, <.2 mm/year
2091 Carefree fault zone exposed, middle and late Quaternary, <.2 mm/year 1038 Carefree fault zone exposed, middle and late Quaternary, <.2 mm/year
934 Carefree fault zone exposed, middle and late Quaternary, <.2 mm/year 6466 Carefree fault zone exposed, middle and late Quaternary, <.2 mm/year
567 Sugarloaf fault zone exposed, late Quaternary, <.2 mm/year 1628 Sugarloaf fault zone exposed, late Quaternary, <.2 mm/year 5440 Sugarloaf fault zone exposed, late Quaternary, <.2 mm/year
Active faults within 100 km of Scottsdale
LENGTH (m) Name Activity 903 Verde fault zone exposed, late Quaternary, <.2 mm/year
1390 Verde fault zone exposed, late Quaternary, <.2 mm/year 3354 Verde fault zone concealed, late Quaternary, <.2 mm/year 1758 Verde fault zone exposed, late Quaternary, <.2 mm/year
674 Verde fault zone exposed, late Quaternary, <.2 mm/year 705 Verde fault zone exposed, late Quaternary, <.2 mm/year
4927 Cottonwood Basin fault exposed, middle and late Quaternary, <.2 mm/year
6513 Horseshoe fault zone, Hell Canyon section exposed, late Quaternary, <.2 mm/year
3548 Horseshoe fault zone, Hell Canyon section concealed, late Quaternary, <.2 mm/year
2340 Horseshoe fault zone, Hell Canyon section exposed, late Quaternary, <.2 mm/year
1797 Horseshoe fault zone, Horseshoe Reservoir section exposed, Holocene, <.2 mm/year
648 Horseshoe fault zone, Horseshoe Reservoir section exposed, Holocene, <.2 mm/year
948 Horseshoe fault zone, Horseshoe Reservoir section exposed, Holocene, <.2 mm/year
1884 Horseshoe fault zone, Horseshoe Reservoir section exposed, Holocene, <.2 mm/year
1750 Horseshoe fault zone, Horseshoe Reservoir section exposed, Holocene, <.2 mm/year
523 Carefree fault zone exposed, middle and late Quaternary, <.2 mm/year 2091 Carefree fault zone exposed, middle and late Quaternary, <.2 mm/year 1038 Carefree fault zone exposed, middle and late Quaternary, <.2 mm/year
934 Carefree fault zone exposed, middle and late Quaternary, <.2 mm/year 6466 Carefree fault zone exposed, middle and late Quaternary, <.2 mm/year
567 Sugarloaf fault zone exposed, late Quaternary, <.2 mm/year 1628 Sugarloaf fault zone exposed, late Quaternary, <.2 mm/year 5440 Sugarloaf fault zone exposed, late Quaternary, <.2 mm/year
Reference Wells, D., and Coppersmith, K., New empirical relationships among magnitude, rupture length, rupture width, rupture area, and surface displacement, Bulletin of the Seismological Society of America; August 1994; v. 84; no. 4; p. 974-1002
0 40 80 120 16020Kilometers
0 30 60 90 12015Kilometers
concealed
exposed, Holocene <0.2 mm/yr
exposed, Quaternary, <0.2 mm/yr
inferred
Explanation
White
II-IIIIVVVIVII-IX
0-1 2345-6
Intensity M
Active faults (Machette USGS) Arizona Earthquake Information Center seismicity data
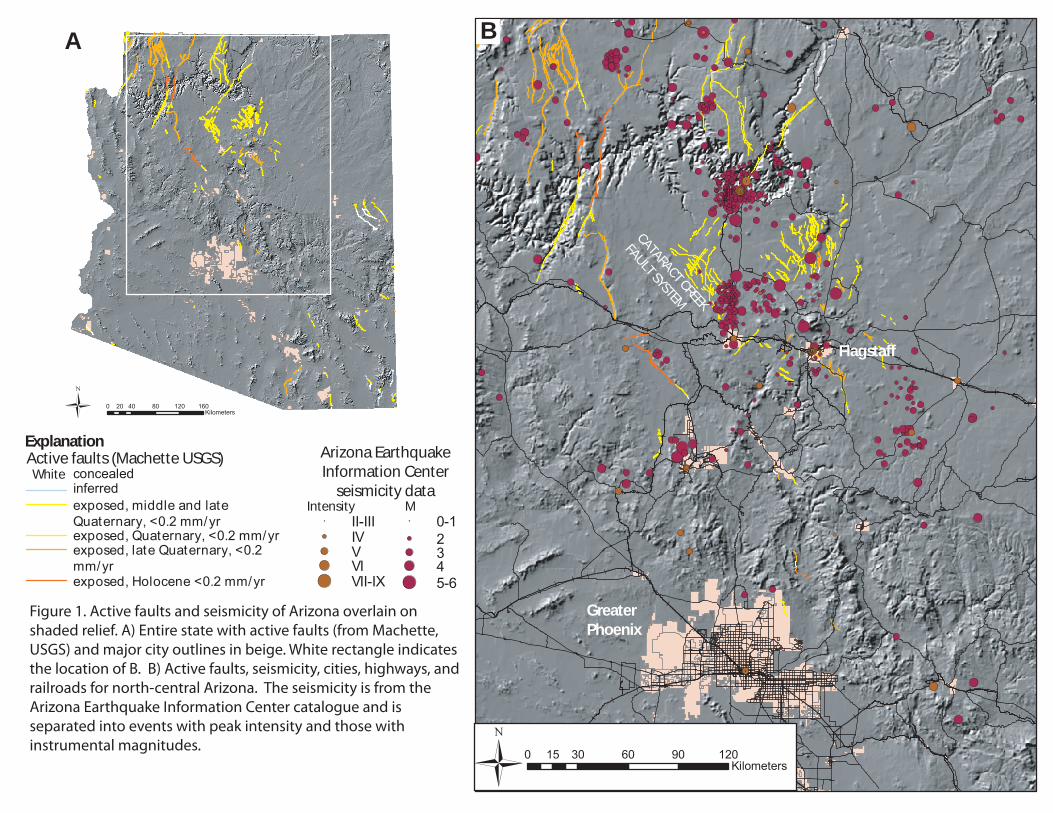
Figure 1. Active faults and seismicity of Arizona overlain on shaded relief. A) Entire state with active faults (from Machette, USGS) and major city outlines in beige. White rectangle indicates the location of B. B) Active faults, seismicity, cities, highways, and railroads for north-central Arizona. The seismicity is from the Arizona Earthquake Information Center catalogue and is separated into events with peak intensity and those with instrumental magnitudes.
exposed, middle and late Quaternary, <0.2 mm/yr
exposed, late Quaternary, <0.2 mm/yr
A B
GreaterPhoenix
Flagstaff
CATARACT CREEK
FAULT SYSTEM
- 0 10 20 30 405Kilometers
Figure 2. Seismicity and active faults within about 100 km of Scottsdale, Arizona (blue polygon). Blue curves show 50 and 100 km bu�ers around city of Scottsdale. Most historic events (dots) have occured to the north in the Prescott and southern Colorado Plateau areas. Fault data is from http://earthquake.usgs.gov/regional/qfaults/ while seismicity is from http://www4.nau.edu/geology/aeic/EQhistory.html. See �gure 1 for an explanation of other symbols.
Colorado Plateau
Prescott
Scottsdale
100 km buffer
50 km buffer
Cave Creek Fault
Sugarloaf Fault
Horseshoe Fault
Cottonwood Basin FaultVerde Fault