SEDIMENT CHARACTERIZATION REPORT - … 12, 2008 · Sediment Characterization Report Terminal 6, ......
232
Sediment Characterization Report Terminal 6, Berths 601 and 607 Portland, Oregon Prepared for Port of Portland June 12, 2008 15667-00
Transcript of SEDIMENT CHARACTERIZATION REPORT - … 12, 2008 · Sediment Characterization Report Terminal 6, ......
Sediment Characterization Report Terminal 6, Berths 601 and 607 Portland, Oregon Prepared for Port of Portland June 12, 2008 15667-00
Sediment Characterization Report Terminal 6, Berths 601 and 607 Portland, Oregon Prepared for Port of Portland June 12, 2008 15667-00 Prepared by Hart Crowser, Inc. Richard D. Ernst, RG Principal
Five Centerpointe Drive, Suite 240 Lake Oswego, Oregon 97035-8652 Fax 503.620.6918 Tel 503.620.7284
CONTENTS Page ACRONYMS iii
1.0 INTRODUCTION 1
1.1 Terminal 6 and Berth Description 1 1.2 Sediment Characterization Activities 1 1.3 Project Description 2
2.0 SEDIMENT CHARACTERIZATION OBJECTIVES 2
3.0 SAMPLING AND ANALYSIS ACTIVITEIS 3
3.1 Sediment Sampling 3 3.2 Analytical Program 4 3.3 Modifications to the SAP 5
4.0 SEDIMENT QUALITY 5
4.1 Data Quality Review 5 4.2 Grain Size Characteristics 6 4.3 Comparison to SEF Screening Levels 6 4.4 Data Evaluation 7
5.0 SUMMARY 8
6.0 REFERENCES 8
TABLES 1 Sampling Locations and Elevations 2 Sample Compositing Scheme 3 Grain Size Distributions 4 Analytical Results for Sediment Samples FIGURES 1 Site Location Map 2 Berth 601 and Core Sampling Locations 3 Berth 607 and Core Sampling Locations
Hart Crowser Page i 15667-00 June 12, 2008
APPENDIX A SEDIMENT CORE LOGS APPENDIX B QUALITY ASSURANCE REVIEW APPENDIX C ANALYTICAL LABORATORY REPORTS
APPENDIX D ADDITIONAL SCREENING CRITERIA TABLE
Hart Crowser Page ii 15667-00 June 12, 2008
ACRONYMS
ARI Analytical Resources, Inc. COC chemical of concern Corps U.S. Army Corps of Engineers CRD Columbia River Datum cy cubic yard DMMU Dredge material management unit EPA Environmental Protection Agency JPA joint permit application LCS laboratory control sample MDL method detection limit MRL method reporting limit MS matrix spike NOAA National Oceanic and Atmospheric Administration NSM new surface material NUC Northwest Underwater Construction PAHs polynuclear aromatic hydrocarbons PCBs polychlorinated biphenyls Port Port of Portland QA/QC quality assurance/quality control RSET Regional Sediment Evaluation Team SAP Sampling and Analysis Plan SEF Northwest Regional Sediment Evaluation Framework SL screening level SVOC semivolatile organic compound TBT tributyltin TOC total organic carbon
Hart Crowser Page iii 15667-00 June 12, 2008
SEDIMENT CHARACTERIZATION REPORT TERMINAL 6, BERTHS 601 AND 607 PORTLAND, OREGON
1.0 INTRODUCTION
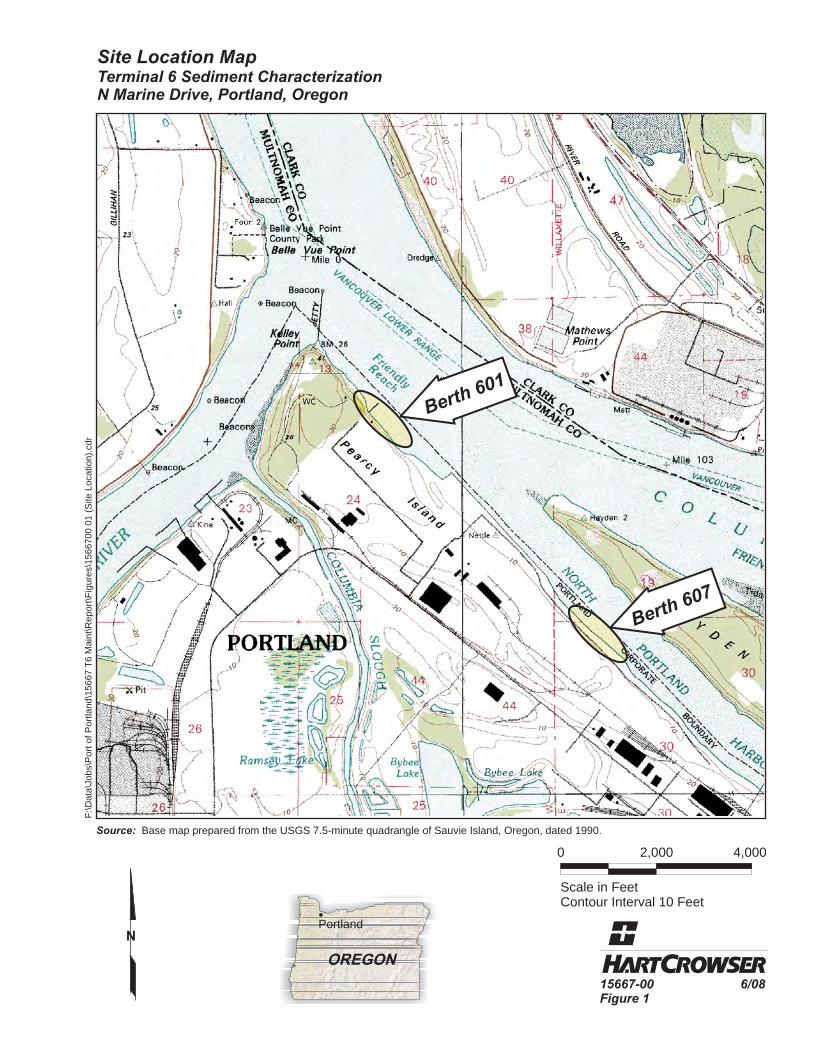
The Port of Portland (Port) is proposing to conduct maintenance dredging at Berths 601 and 607 at Terminal 6 along the south bank of the Columbia River on the Oregon Slough in Portland, Oregon (Figure 1). To provide chemical quality data on sediment to be dredged and the future “leave surface” or new surface material (NSM), sediment characterization activities were completed in accordance with the Northwest Regional Sediment Evaluation Framework (SEF) Interim Final (U.S. Army Corps of Engineers [Corps] et al., 2006) and our Sampling and Analysis Plan (SAP) (Hart Crowser, 2008) as modified by comments from the Regional Sediment Evaluation Team (RSET). This report presents the results and findings of these activities.
1.1 Terminal 6 and Berth Description
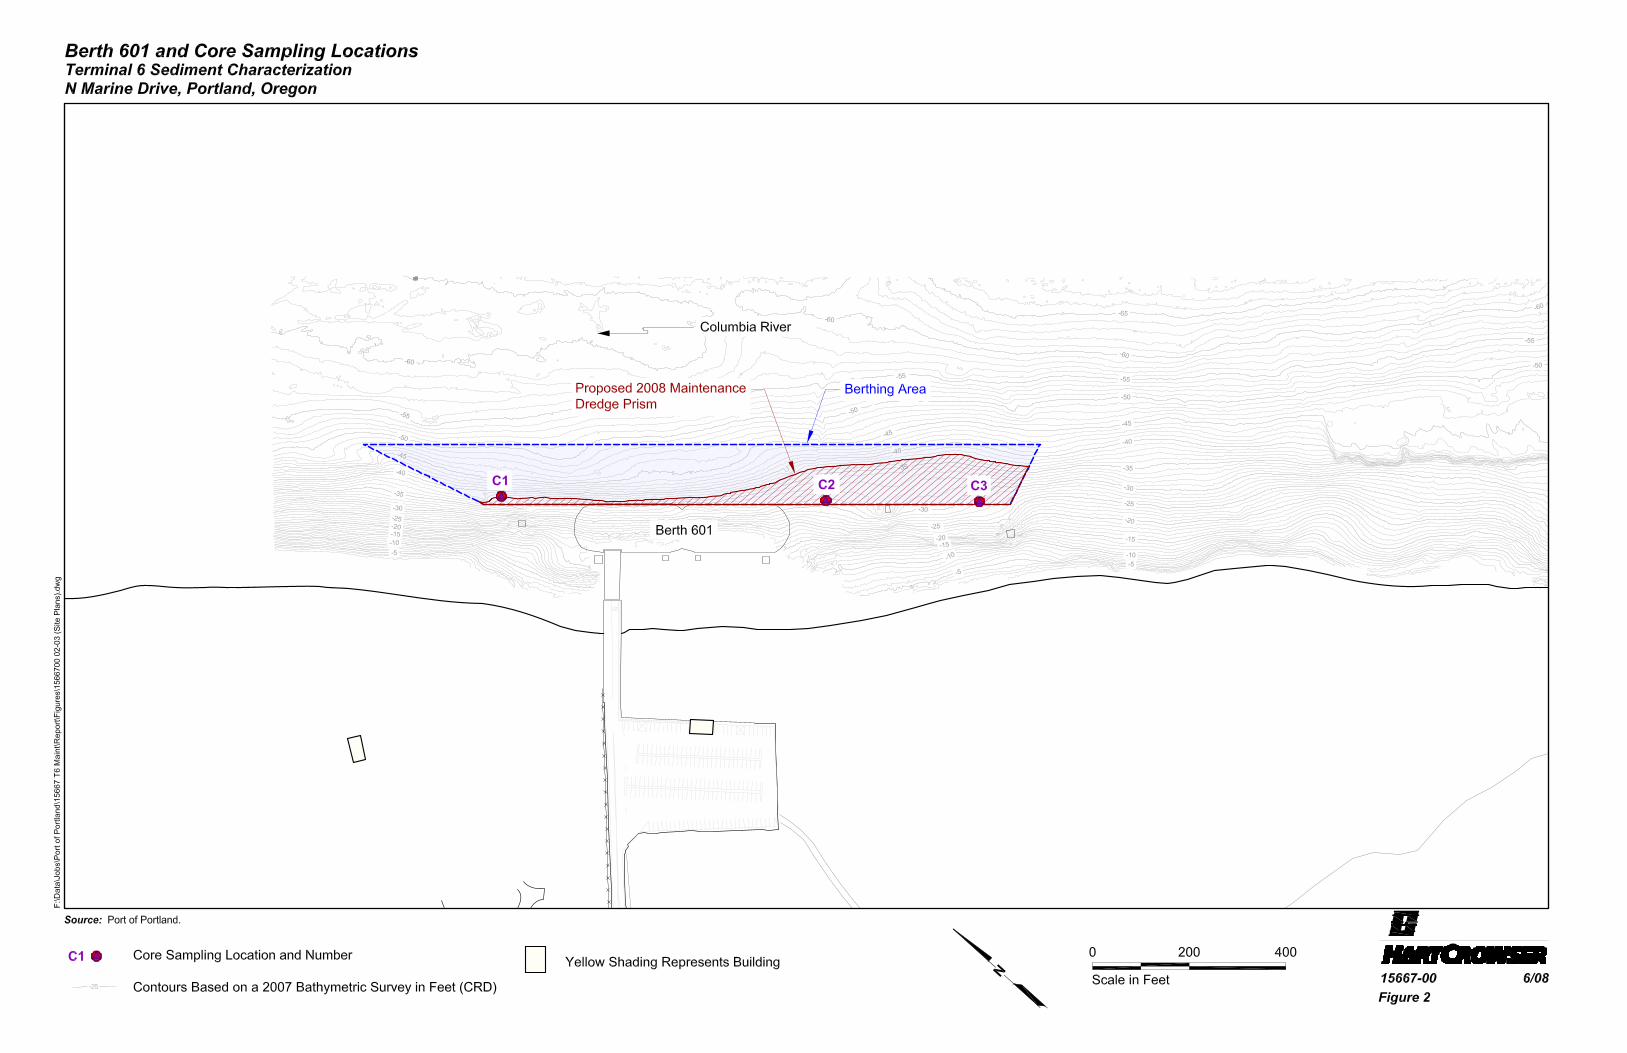
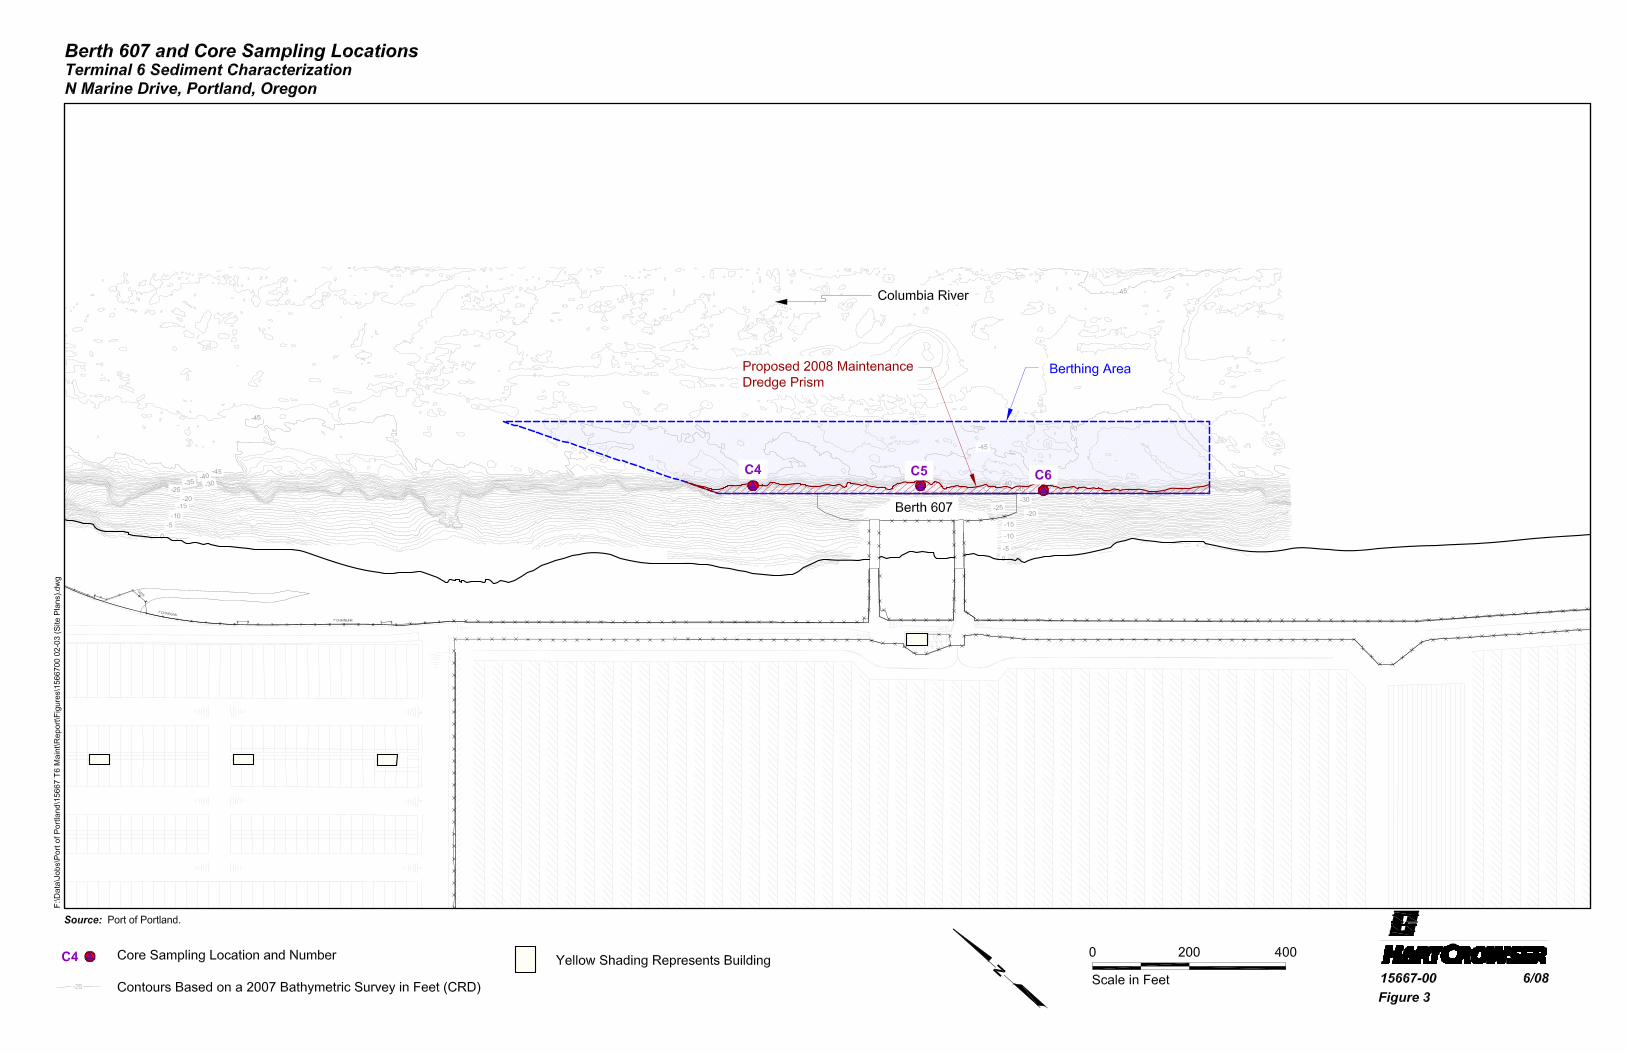
Terminal 6 is located at 7201 N. Marine Drive in Portland, Oregon, along the south bank of the Columbia River on the Oregon Slough. The terminal spans approximately 1.5 miles beginning at river mile (RM) 102 on the Columbia River and ending upstream at RM1 on the Oregon Slough (Figure 1). Terminal 6 has five berths (Berths 601, 603, 604, 605, and 607). The project site is Berths 601 and 607, which are used for the unloading of Hyundai and Honda automobiles, respectively. Figures 2 and 3 show Berths 601 and 607, along with June 2007 bathymetric surveys conducted by the Port. Sediment contours are relative to the Columbia River Datum (CRD). The berthing area for Berth 601 is approximately 1,350 feet long and 120 feet wide (Figure 2). Berth 607 is approximately 1,400 feet long and 145 feet wide. Based on a 2007 bathymetric survey, the river bottom ranges from -27 to -51 feet CRD at Berth 601 and from -30 to -46 feet CRD at Berth 607. The design depth for both berths is -35 feet CRD.
1.2 Previous Sediment Characterization Activities
Maintenance dredging was last performed in 1989 at Berth 601 and in 1982 at Berth 607. Sediment characterization data are not available for these berths.
Hart Crowser Page 1 15667-00 June 12, 2008
1.3 Project Description
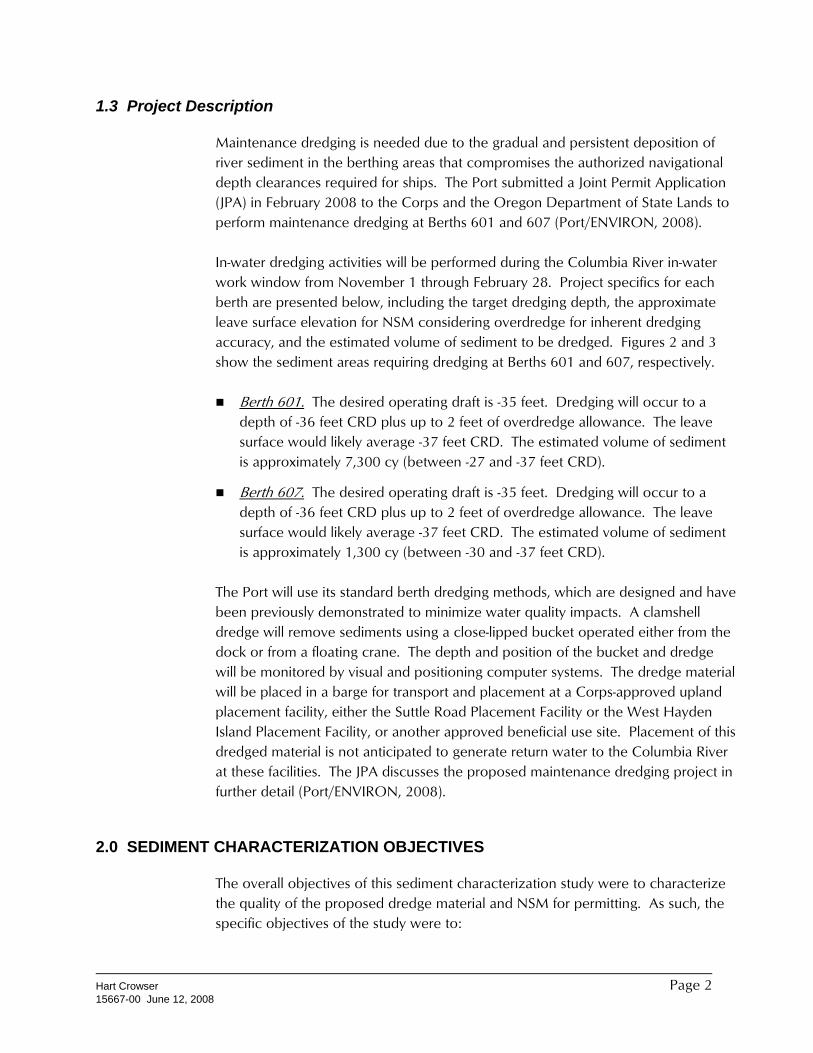
Maintenance dredging is needed due to the gradual and persistent deposition of river sediment in the berthing areas that compromises the authorized navigational depth clearances required for ships. The Port submitted a Joint Permit Application (JPA) in February 2008 to the Corps and the Oregon Department of State Lands to perform maintenance dredging at Berths 601 and 607 (Port/ENVIRON, 2008).
In-water dredging activities will be performed during the Columbia River in-water work window from November 1 through February 28. Project specifics for each berth are presented below, including the target dredging depth, the approximate leave surface elevation for NSM considering overdredge for inherent dredging accuracy, and the estimated volume of sediment to be dredged. Figures 2 and 3 show the sediment areas requiring dredging at Berths 601 and 607, respectively.
Berth 601. The desired operating draft is -35 feet. Dredging will occur to a depth of -36 feet CRD plus up to 2 feet of overdredge allowance. The leave surface would likely average -37 feet CRD. The estimated volume of sediment is approximately 7,300 cy (between -27 and -37 feet CRD).
Berth 607. The desired operating draft is -35 feet. Dredging will occur to a depth of -36 feet CRD plus up to 2 feet of overdredge allowance. The leave surface would likely average -37 feet CRD. The estimated volume of sediment is approximately 1,300 cy (between -30 and -37 feet CRD).
The Port will use its standard berth dredging methods, which are designed and have been previously demonstrated to minimize water quality impacts. A clamshell dredge will remove sediments using a close-lipped bucket operated either from the dock or from a floating crane. The depth and position of the bucket and dredge will be monitored by visual and positioning computer systems. The dredge material will be placed in a barge for transport and placement at a Corps-approved upland placement facility, either the Suttle Road Placement Facility or the West Hayden Island Placement Facility, or another approved beneficial use site. Placement of this dredged material is not anticipated to generate return water to the Columbia River at these facilities. The JPA discusses the proposed maintenance dredging project in further detail (Port/ENVIRON, 2008).
2.0 SEDIMENT CHARACTERIZATION OBJECTIVES
The overall objectives of this sediment characterization study were to characterize the quality of the proposed dredge material and NSM for permitting. As such, the specific objectives of the study were to:
Hart Crowser Page 2 15667-00 June 12, 2008
Characterize sediment affected by proposed dredging activities along the berths (i.e., the dredge prisms) to document the chemical quality of the sediments;
Additionally, characterize the underlying NSM (a.k.a. leave surface) along the berths to document the chemical quality of these remaining sediments;
Collect, handle, and analyze samples representative of the dredge prisms and NSM sediments in accordance with the SEF;
Compare the sediment analytical results to SEF screening levels (SLs) to evaluate the nature of the dredge prisms and NSM sediments; and
Evaluate and report the results of the analytical sediment testing in a complete and timely manner to support the permitting process.
Sediment characterization activities were conducted in accordance with our SAP (Hart Crowser, 2008), the SEF, and an EPA technical manual for sediment sampling (EPA, 2001). Quality assurance/quality control (QA/QC) procedures described in our Quality Assurance Project Plan in the SAP were followed. RSET approved the SAP in February 2008 (RSET, 2008), but requested that all six NSM samples be analyzed instead of the two samples proposed in the SAP (one at each berth).
3.0 SAMPLING AND ANALYSIS ACTIVITIES
This section summarizes these sampling activities and presents the analytical program for the dredge prism and NSM samples. This scope of work was conducted in accordance with the SAP (Hart Crowser, 2008).
3.1 Sediment Sampling
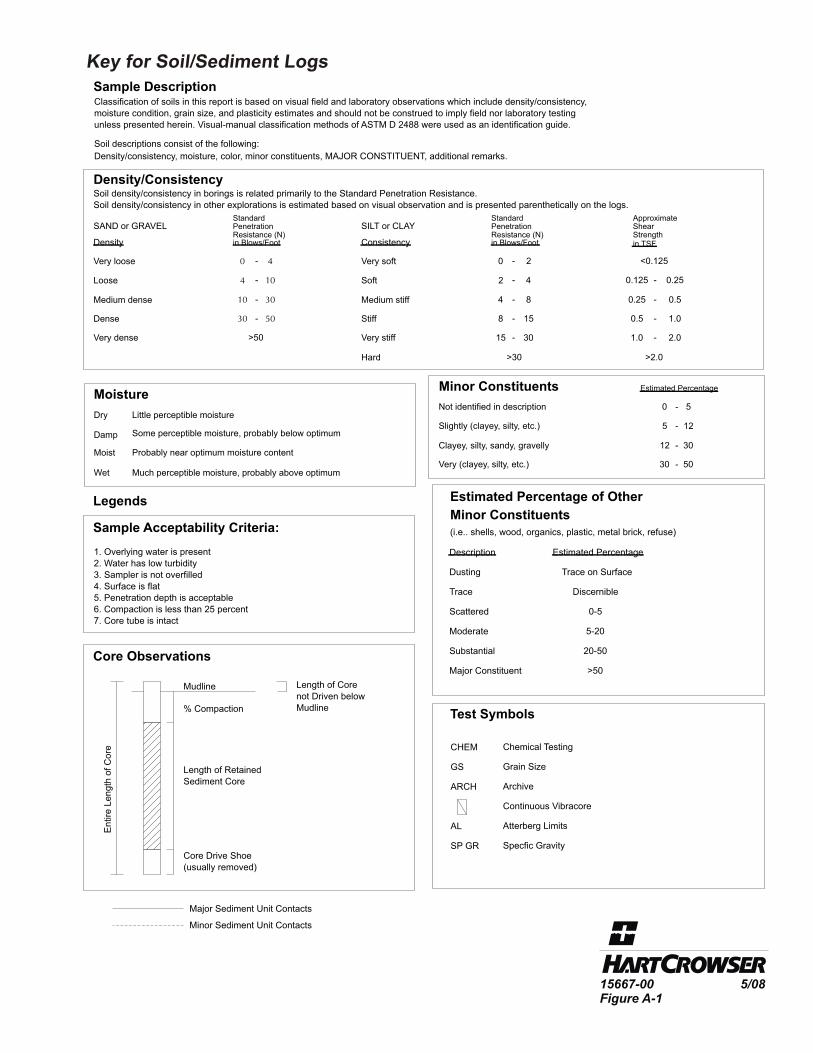
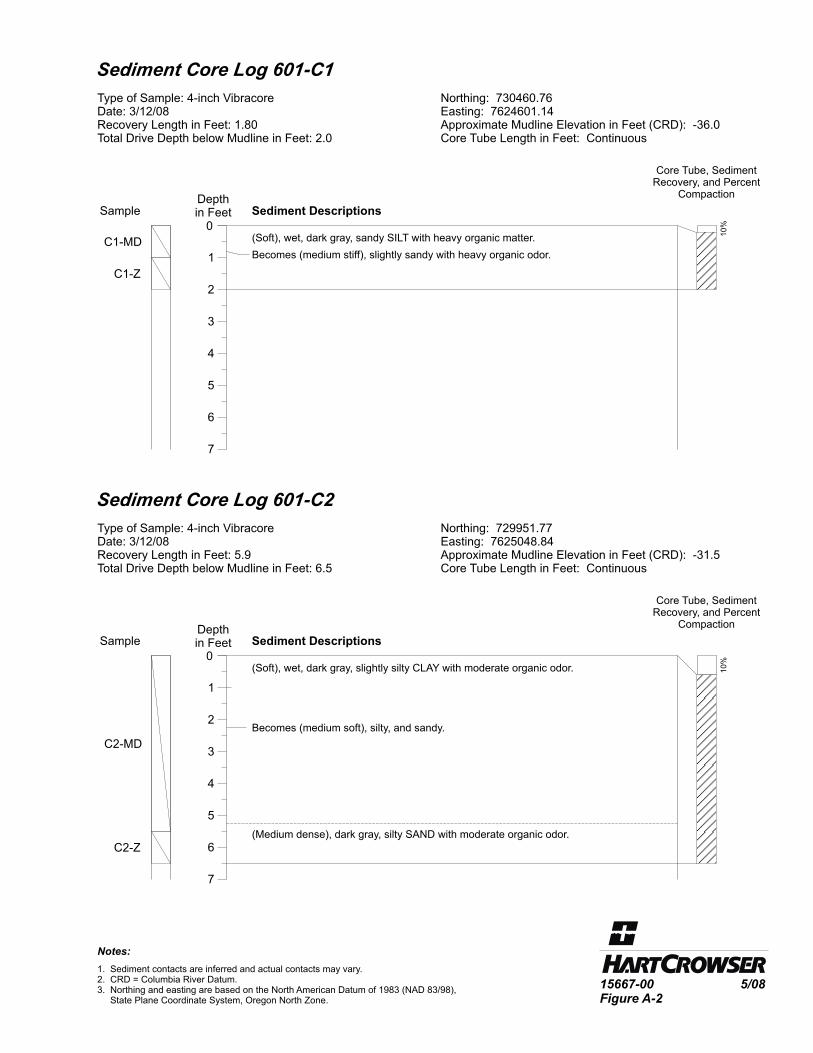
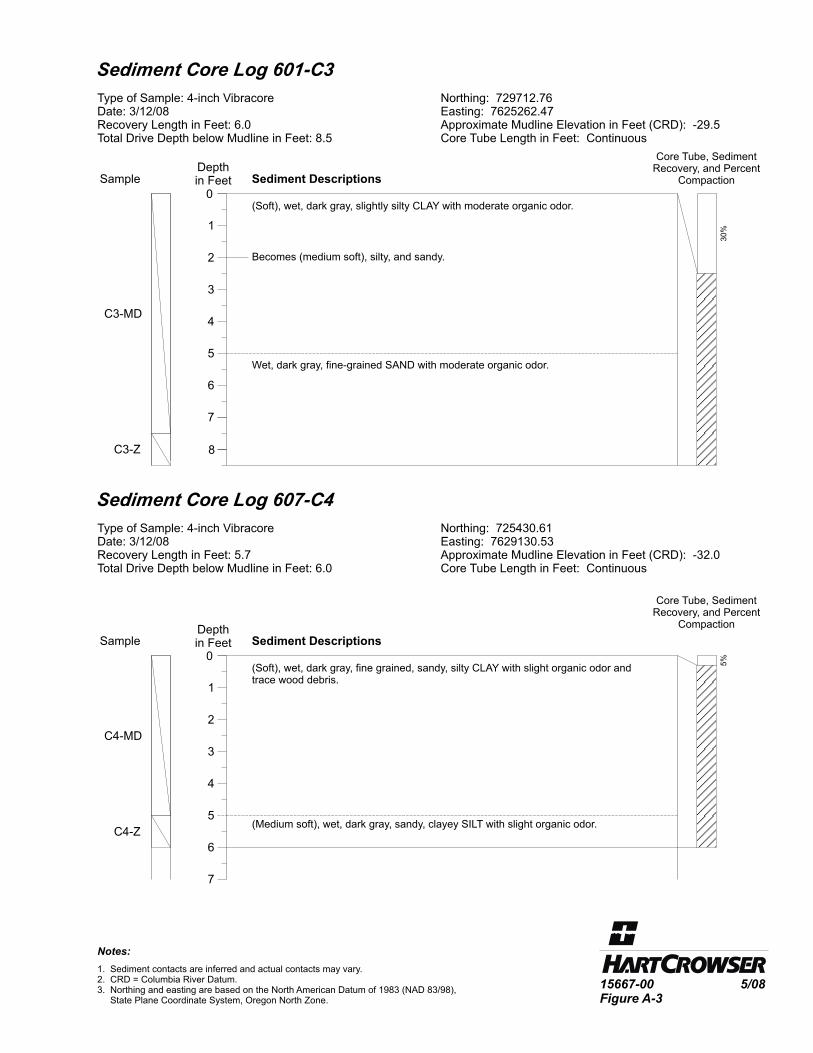
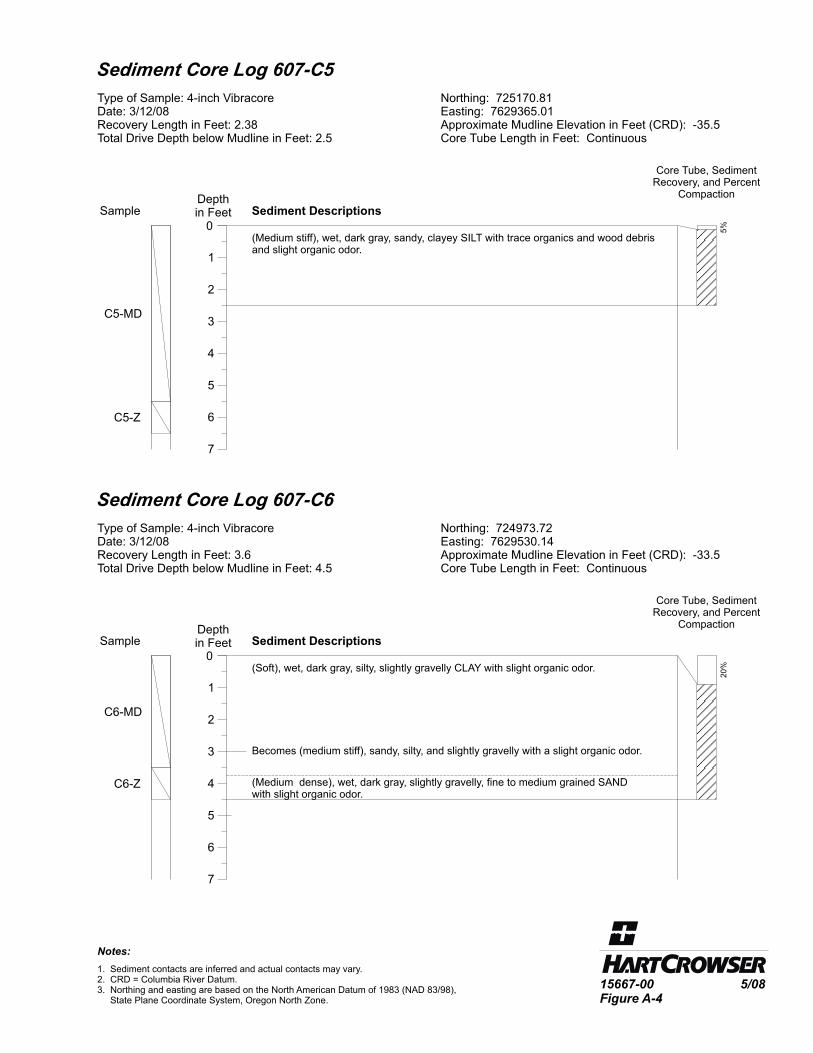
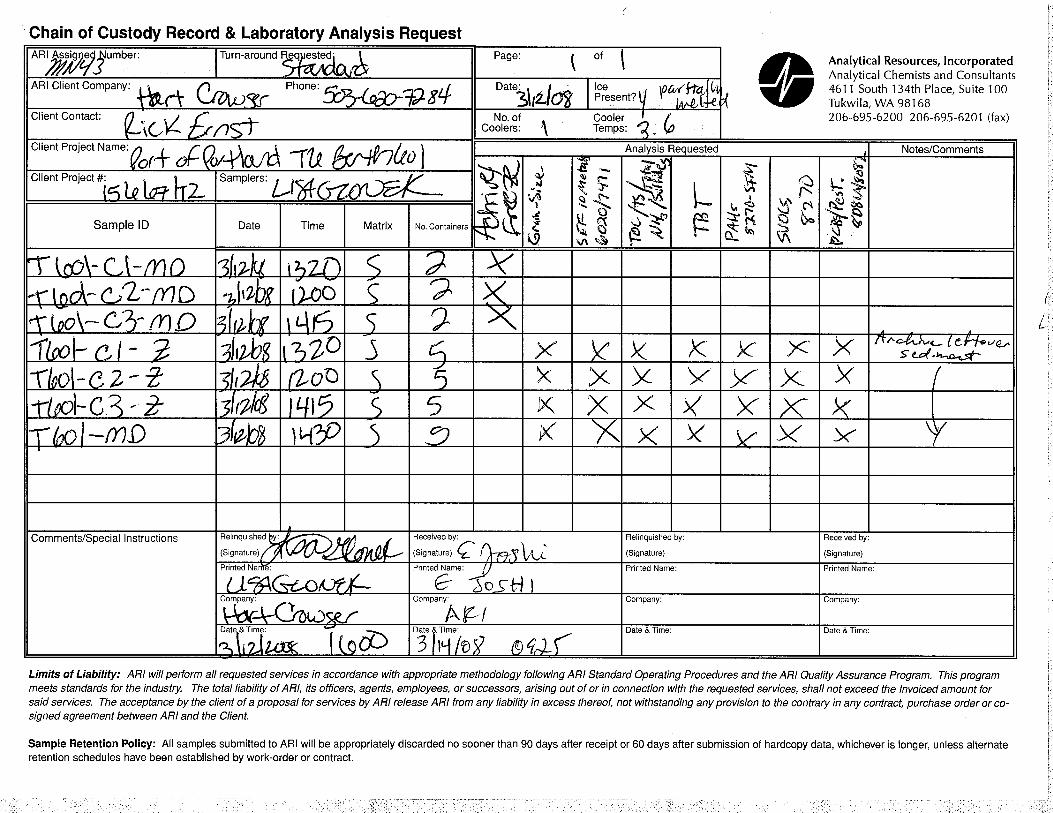
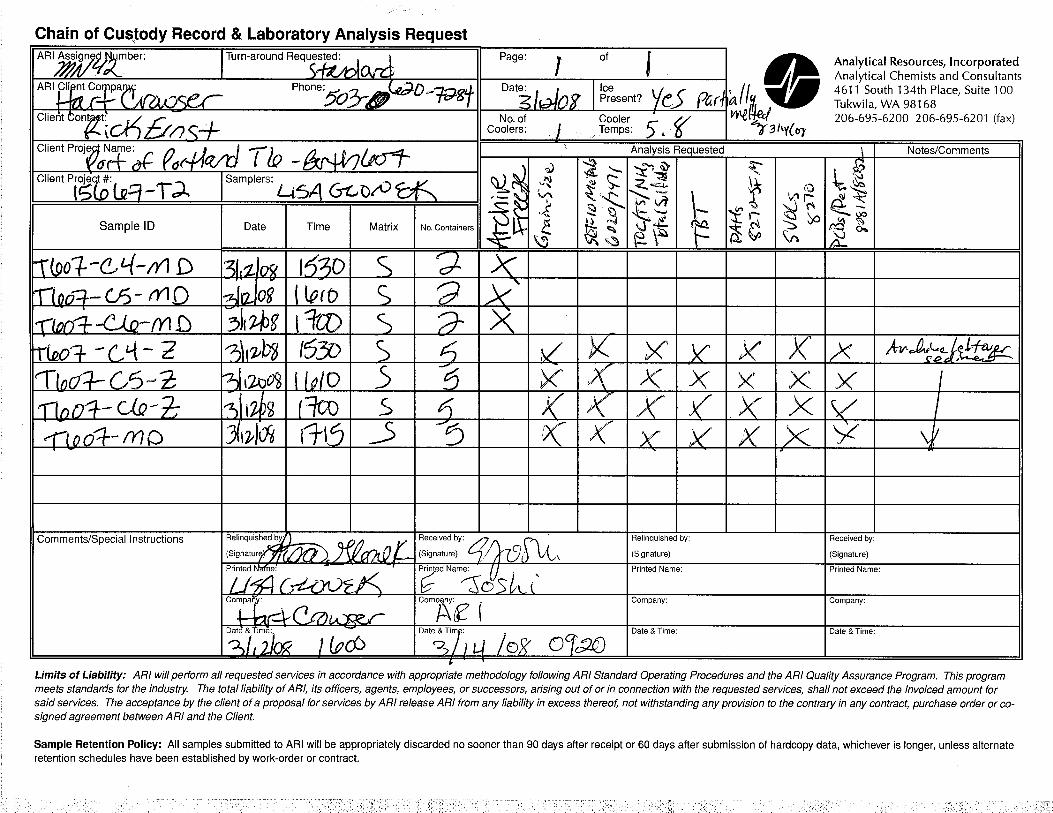
On March 12, 2008, Northwest Underwater Construction (NUC) of Vancouver, Washington (under subcontract to Hart Crowser) obtained sediment cores C-1 through C-6 from along Berths 601 and 607 (Figure 2). A representative of Hart Crowser was present to observe and document the coring activities and to collect dredge prism and NSM samples for analysis. Logs of the cores are included in Appendix A. Field Coring Procedures. Positioning over each core location was performed using a global positioning system (GPS). Cores were obtained using a vibracorer with a 4-inch-diameter core barrel deployed from a sampling vessel operated by NUC. Cores were advanced from 2 to 8.5 feet, penetrating through the proposed dredge prism and the uppermost 1-foot of NSM that will remain after dredging. Sediment was contained in a polycarbonate liner inside of the core barrel.
Hart Crowser Page 3 15667-00 June 12, 2008
Upon retrieval of the vibracorer, the liner with core was removed from the core barrel, and the ends sealed with caps. The sediment core was examined for acceptance. Core recoveries ranged from 70 to 95 percent. Core C-3 had slightly less than the preferred minimum recovery of 75 percent; but was deemed acceptable as this core was the best of three attempts retrieved from this location, the lower recovery appeared to be due to core compaction and the settling of the upper portion of the core, and the dredge prism and NSM were well represented. Table 1 presents the sediment sample identification, core coordinates, mudline elevations, and target sample intervals. The sediment cores were then transported to our office for processing.
Core Processing for Samples. In the processing area, the core liners were split lengthwise and sediment photographed and described (including, as appropriate, physical description, odor, visual stratification, debris, and biological activity). As described further below, two samples were collected from the dredge prism and NSM from each core. The samples were labeled with the berth designation (T601 or T607), core location (C1 to C6), and the depth of the sample horizon (e.g. suffix MD for maintenance dredge prism, and suffix Z for the NSM sample [a.k.a. a Z-sample]). A separate dredge material management unit (DMMU) was designed at each berth for dredge prism material. A composite sample of the dredge prism was collected from cores within each DMMU, and labeled simply as T601-MD and T607-MD. Dredge Prism Samples. After logging, sediment representing the entire depth of the dredge prism from each core was placed into a stainless steel bowl and homogenized with a stainless steel spoon until both color and texture were uniform. A discrete sample (e.g., T601-C1-MD) was obtained for archival purposes (these samples were frozen at the laboratory). The homogenized contents from the core were then combined (composited) with other sample cores from the same DMMU. The compositing of sediment for each DMMU yields a sample representative of the sediment of the dredge prism, which is being removed and placed at an upland placement site. For the DMMU at Berth 601, sediment from cores C1, C2, and C3 were composited (e.g., T601-MD). For the DMMU at Berth 607, sediment from cores C4, C5, and C6 were composited. These two composite samples were submitted for analysis. Table 2 summarizes sampling scheme used for the dredge prism. NSM Samples. A discrete sample of the NSM from the anticipated leave surface from each core was collected (i.e., -37 to -38 feet CRD at Berth 601 and 607). All these NSM samples were submitted for analysis (Table 2).
Hart Crowser Page 4 15667-00 June 12, 2008
3.2 Analytical Program
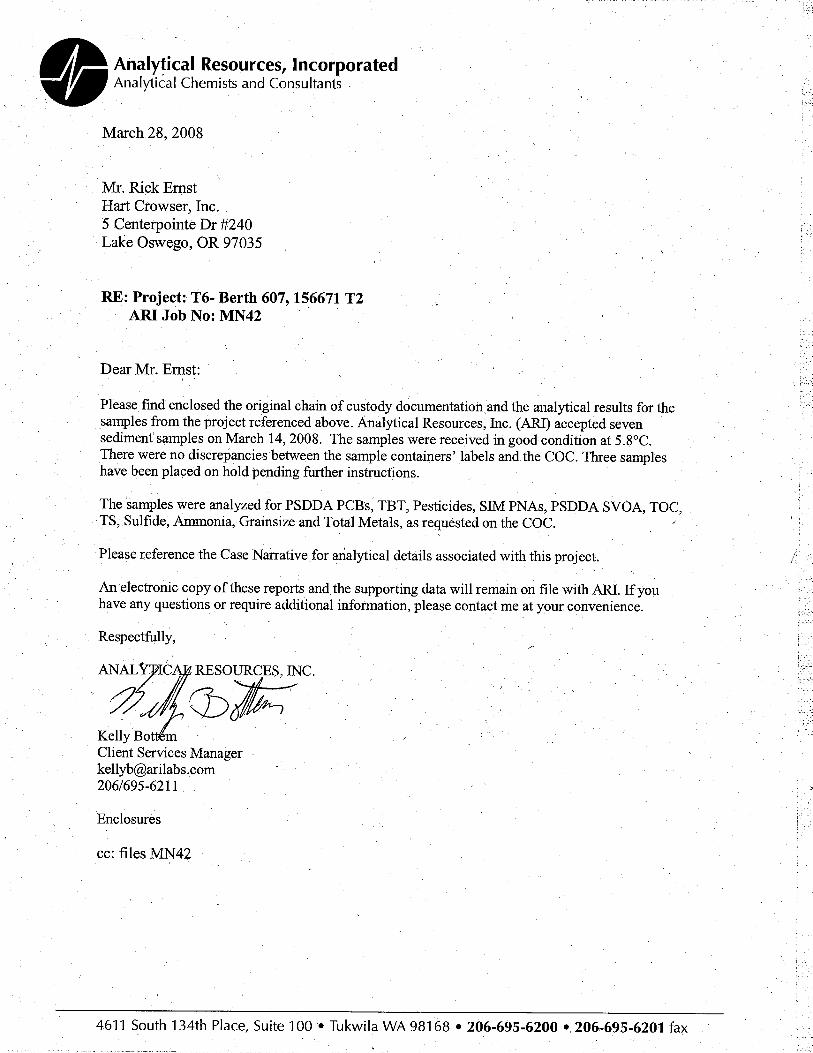
All samples were submitted under chain of custody to Analytical Resources, Inc. (ARI), of Tukwila, Washington (under subcontract to Hart Crowser). Dredge prism and NSM samples selected in Section 3.1 above were analyzed for the physical and chemical analyses listed below.
Grain size by ASTM D 422M;
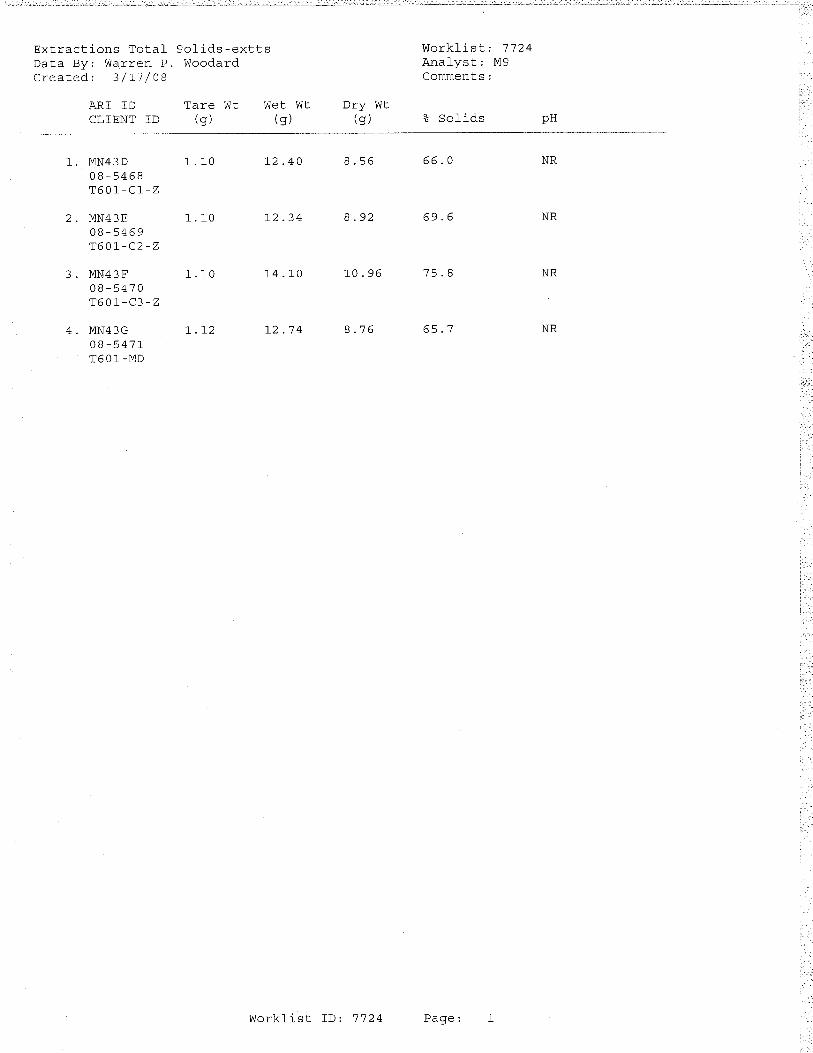
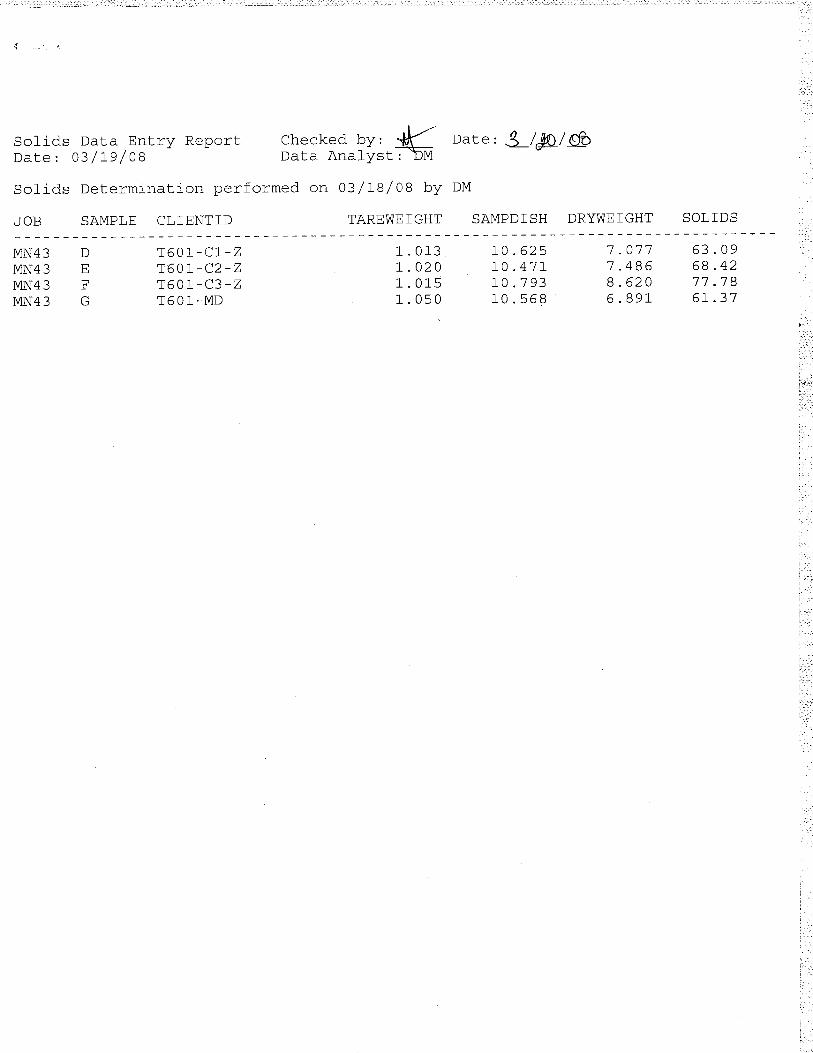
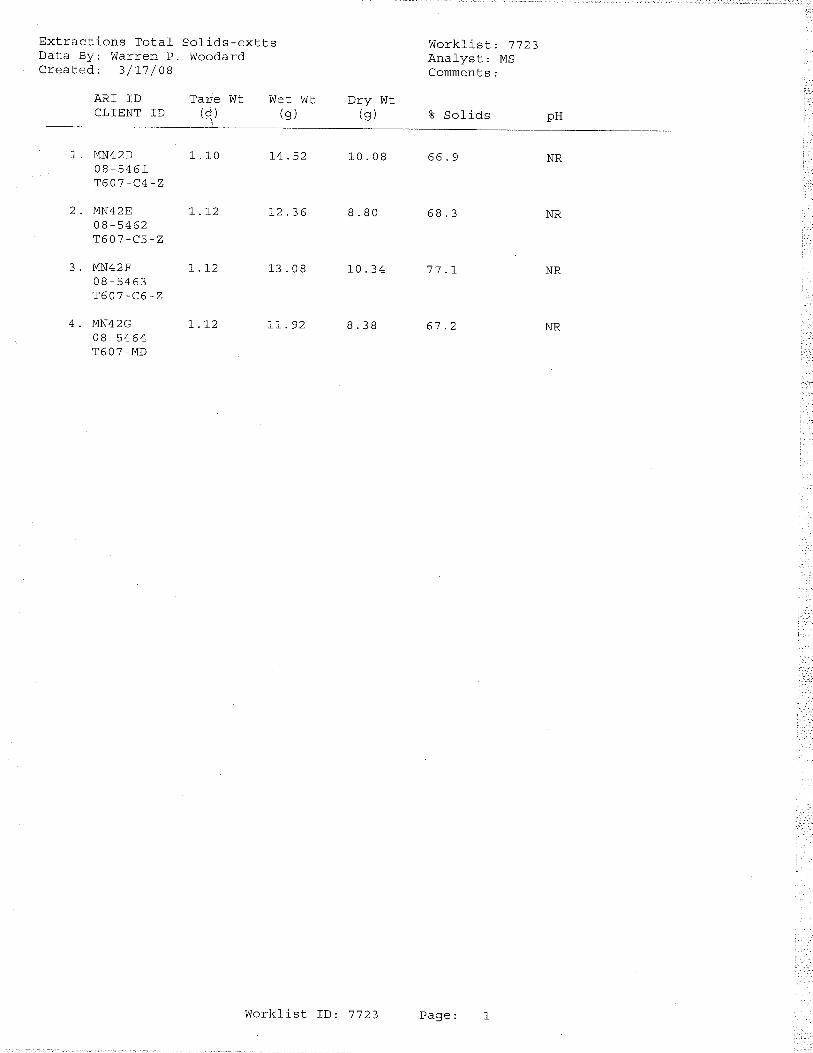
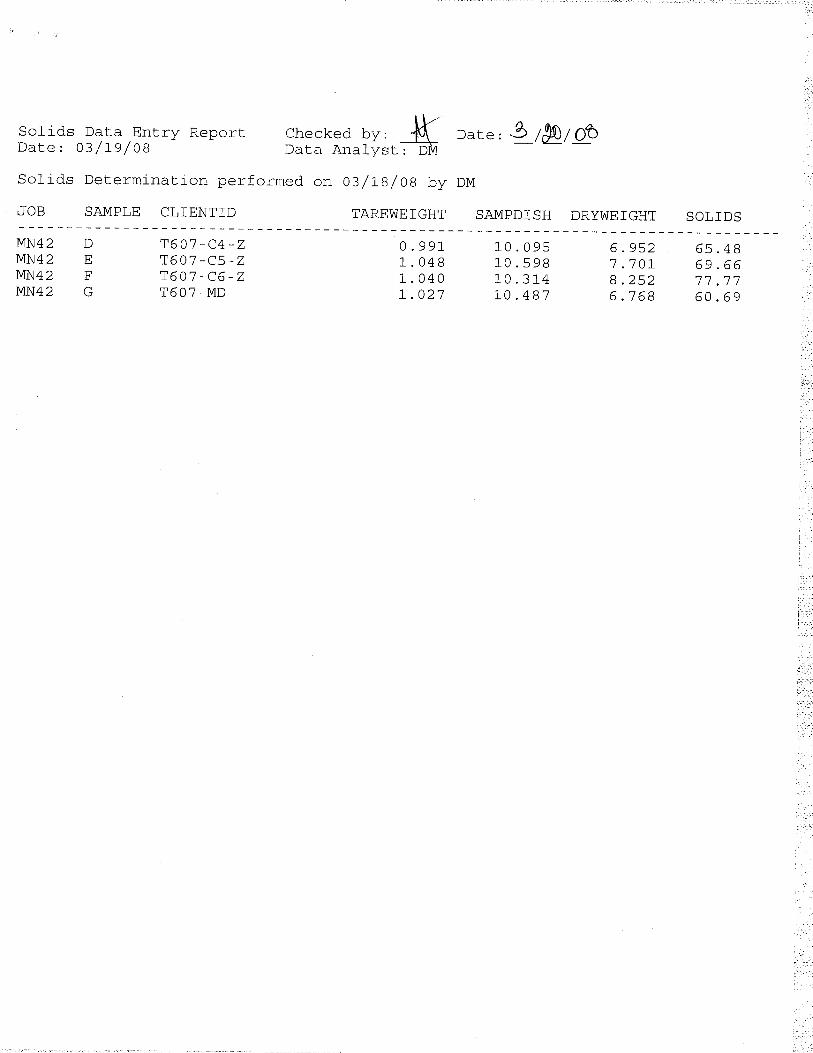
Total solids by EPA Method 160.3;
Total organic carbon (TOC) by Plumb (1981);
Ammonia by EPA Method 350.1M;
Sulfide by EPA Method 376.2;
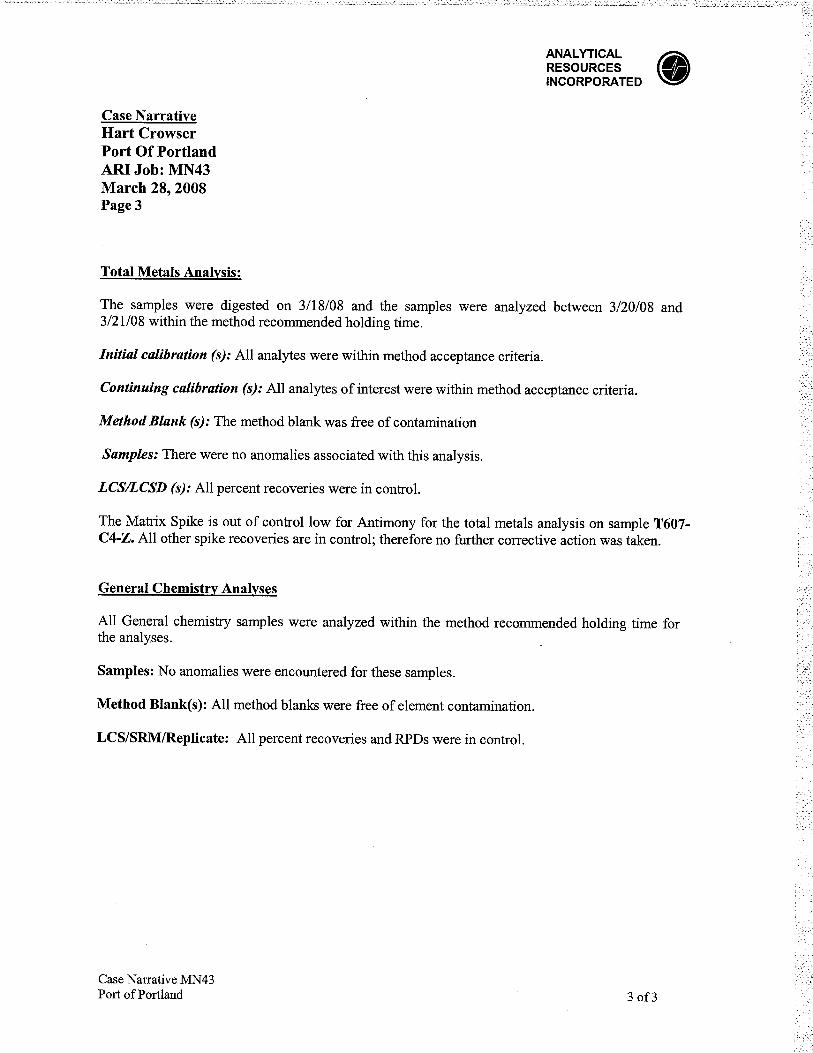
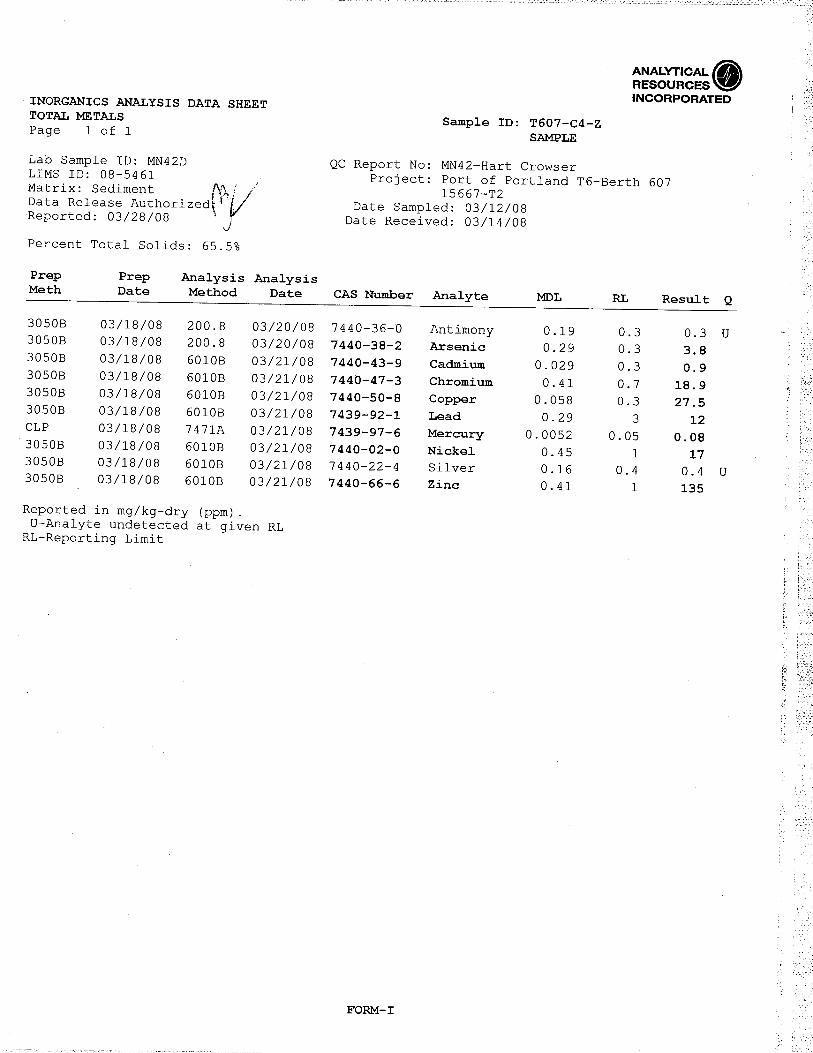
Total metals (antimony, arsenic, cadmium, chromium, copper, lead, mercury, nickel, silver, and zinc) by EPA Method 200.8/6010B/7471A;
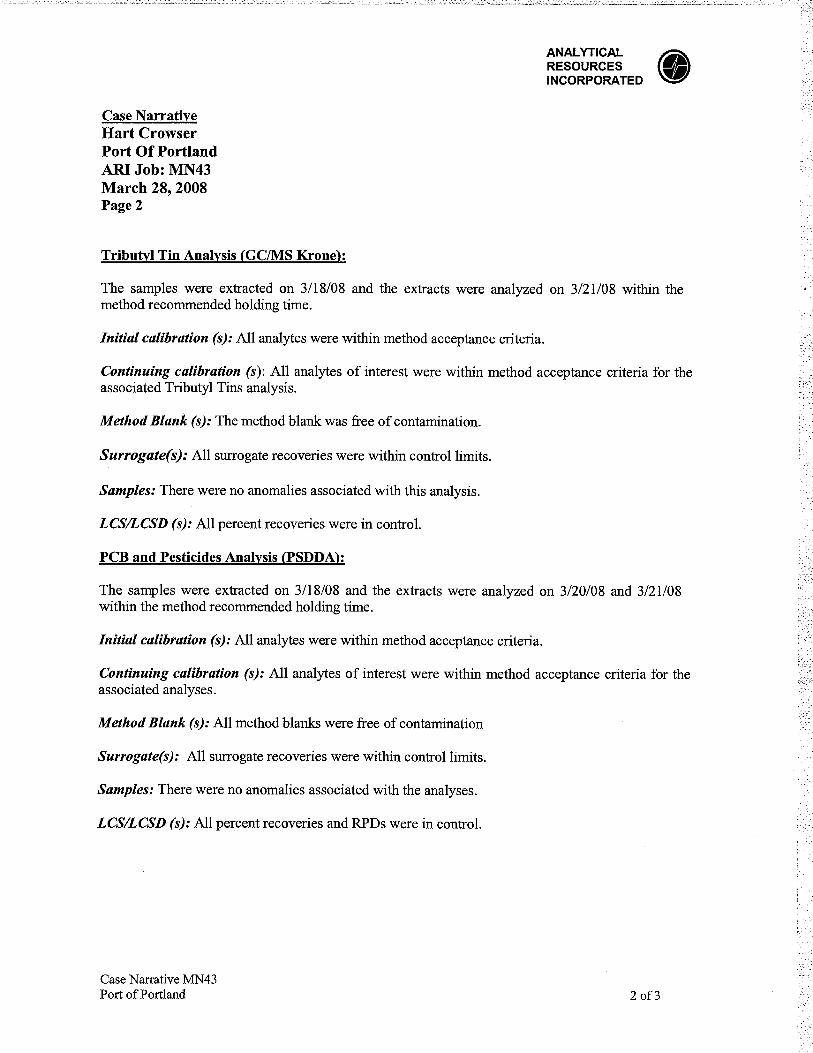
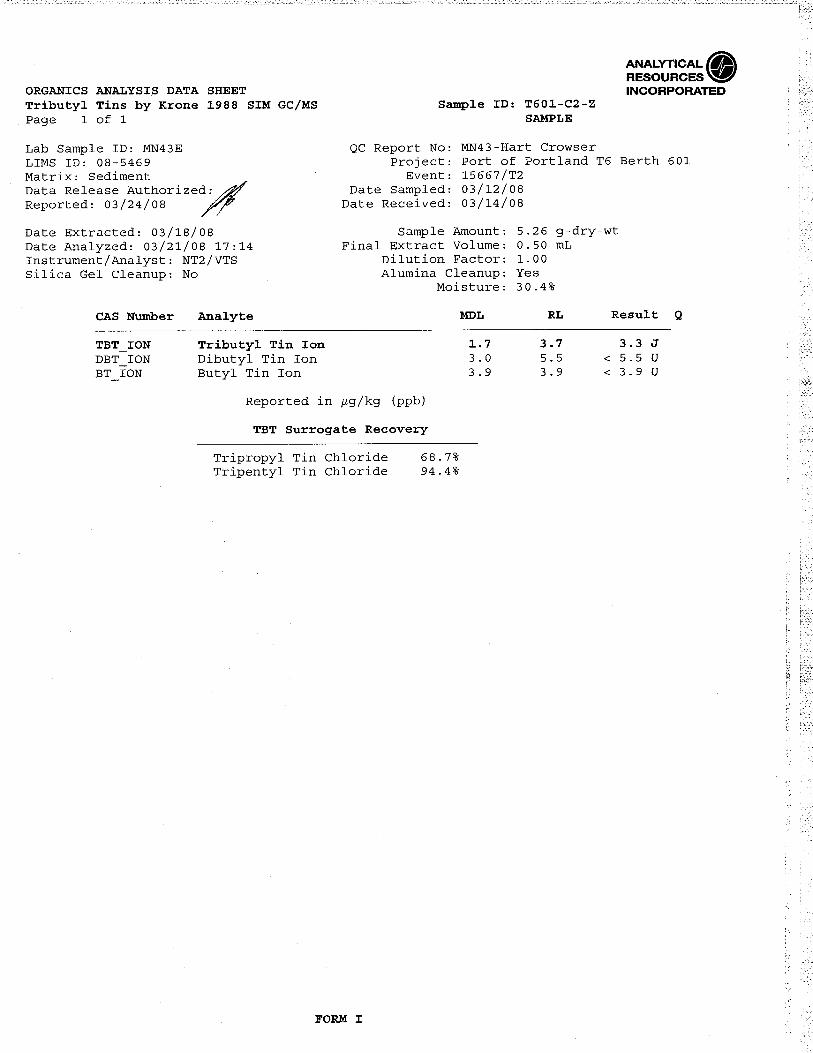
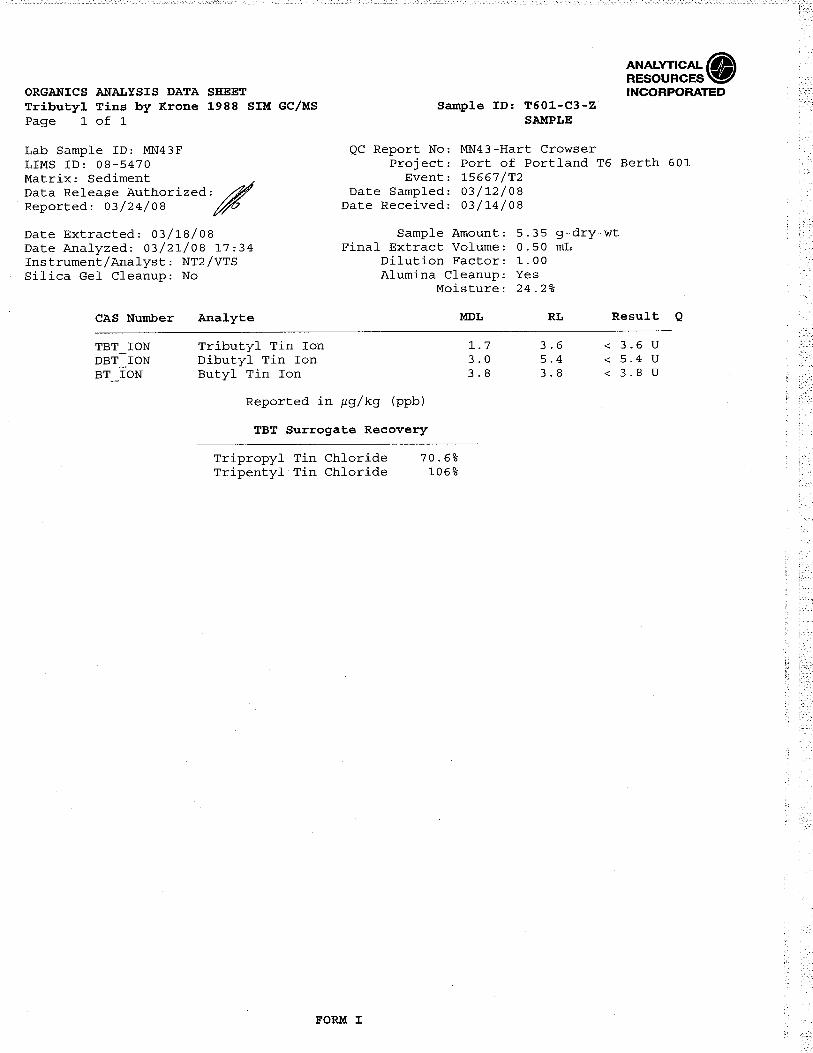
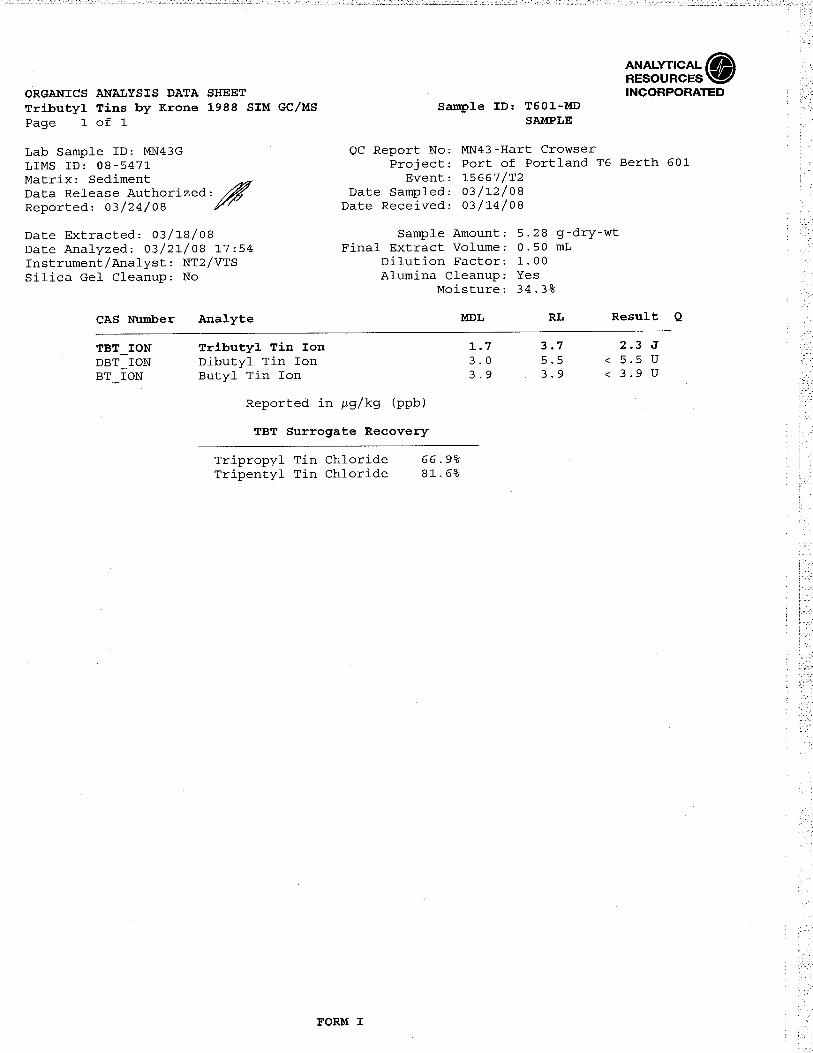
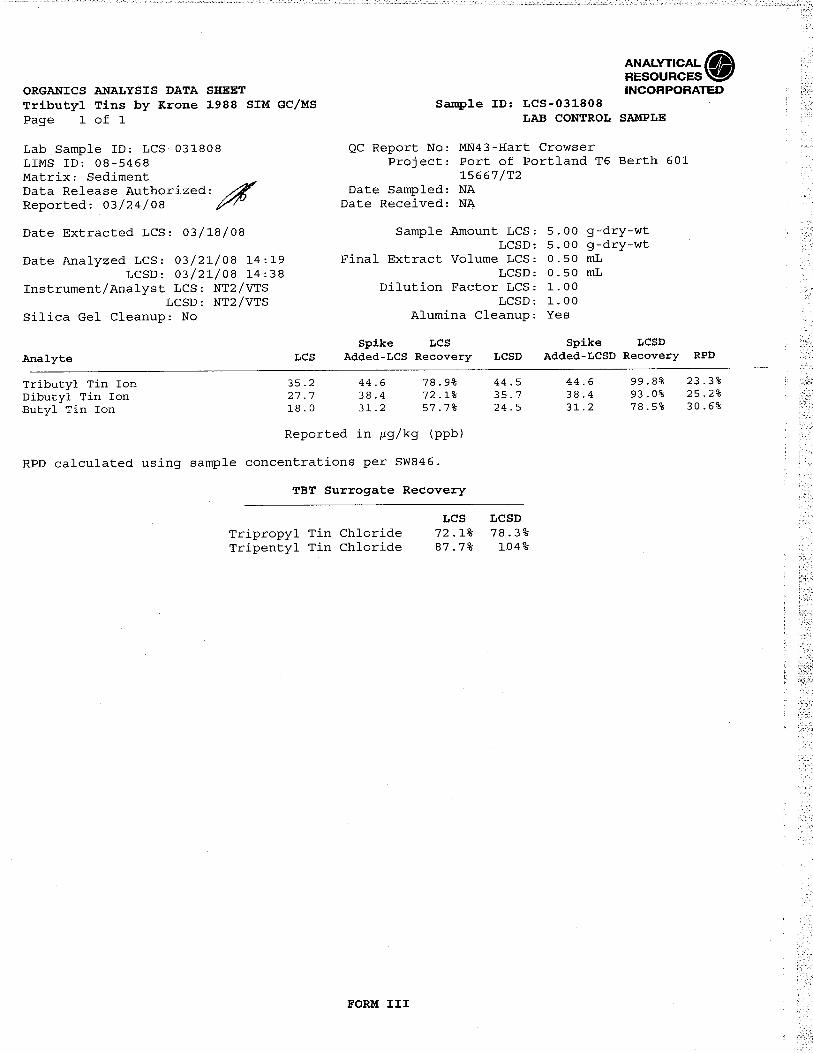
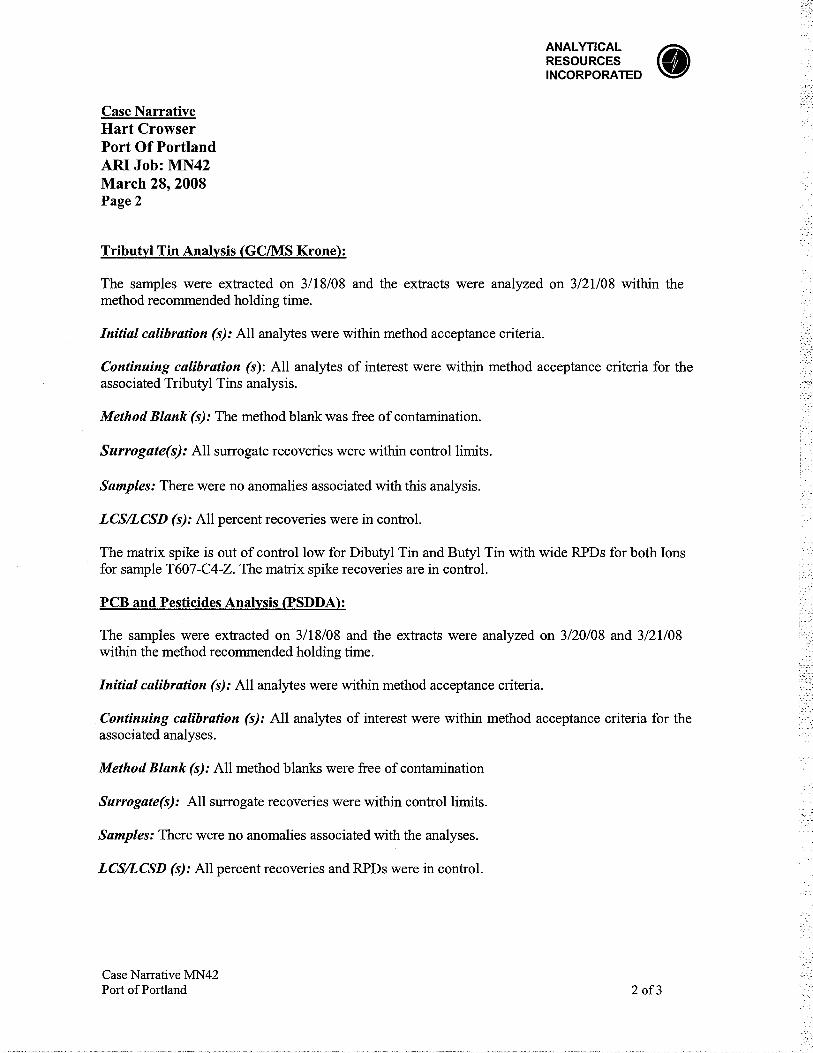
Tributyltin (TBT) by Krone, et al. (written 1988; published 1989);
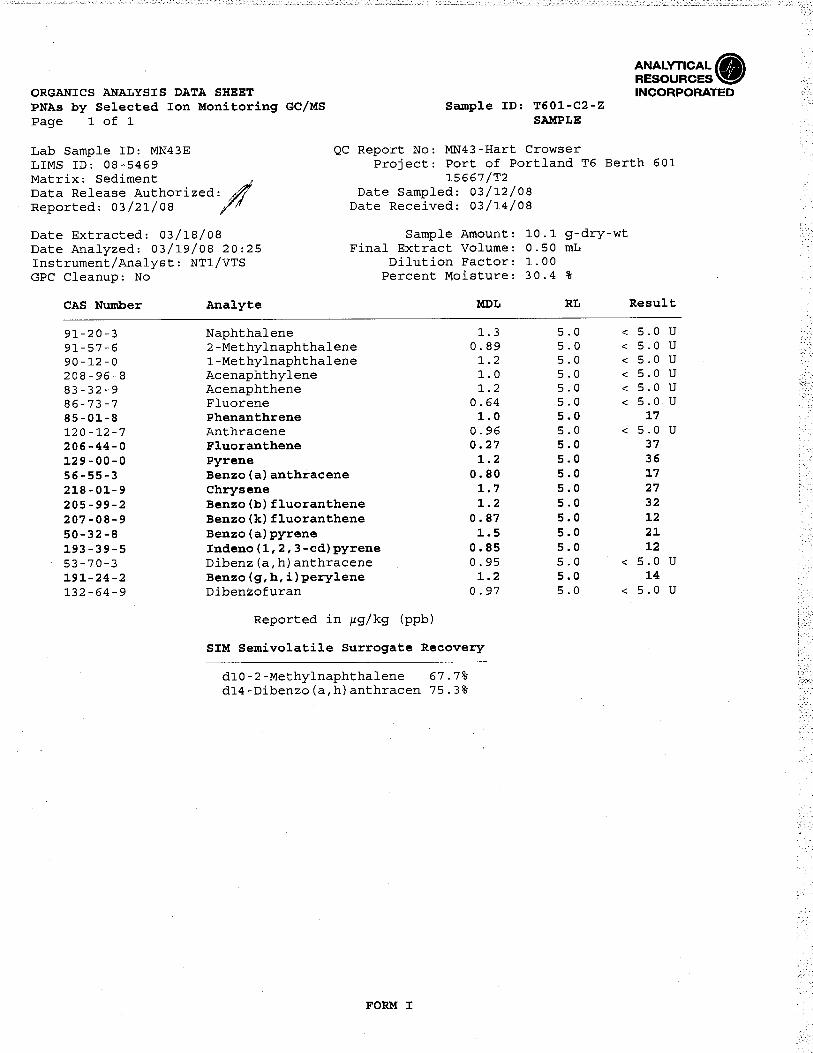
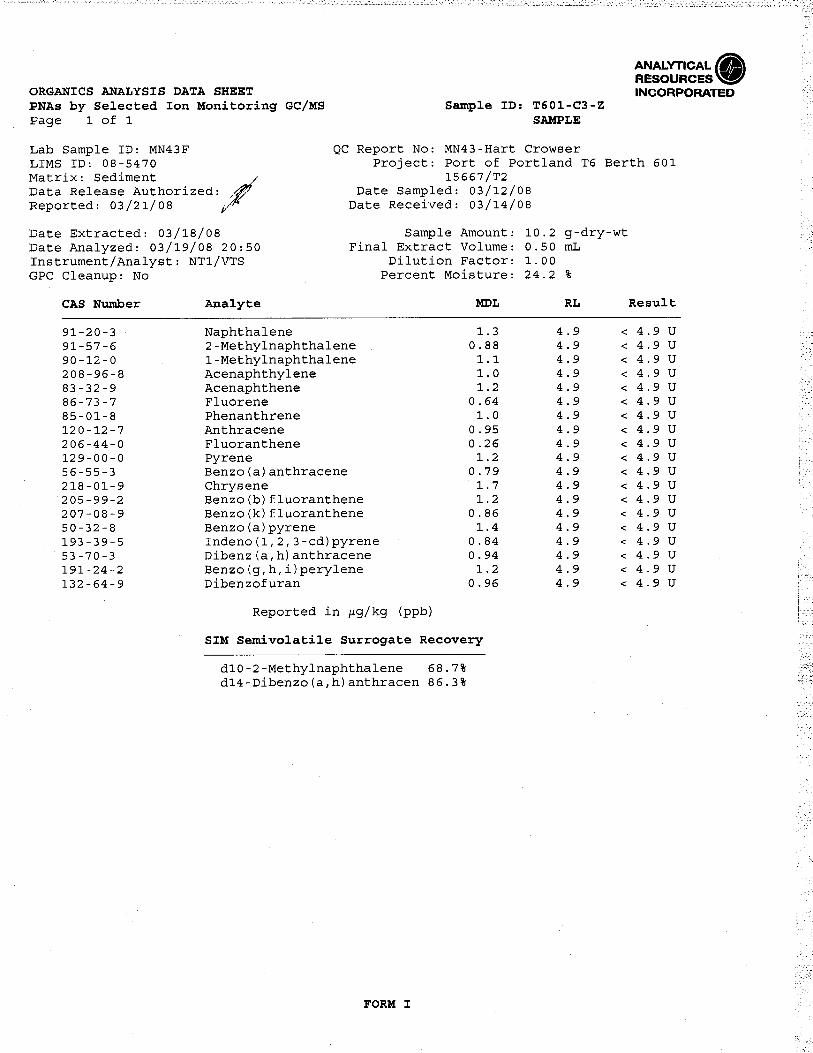
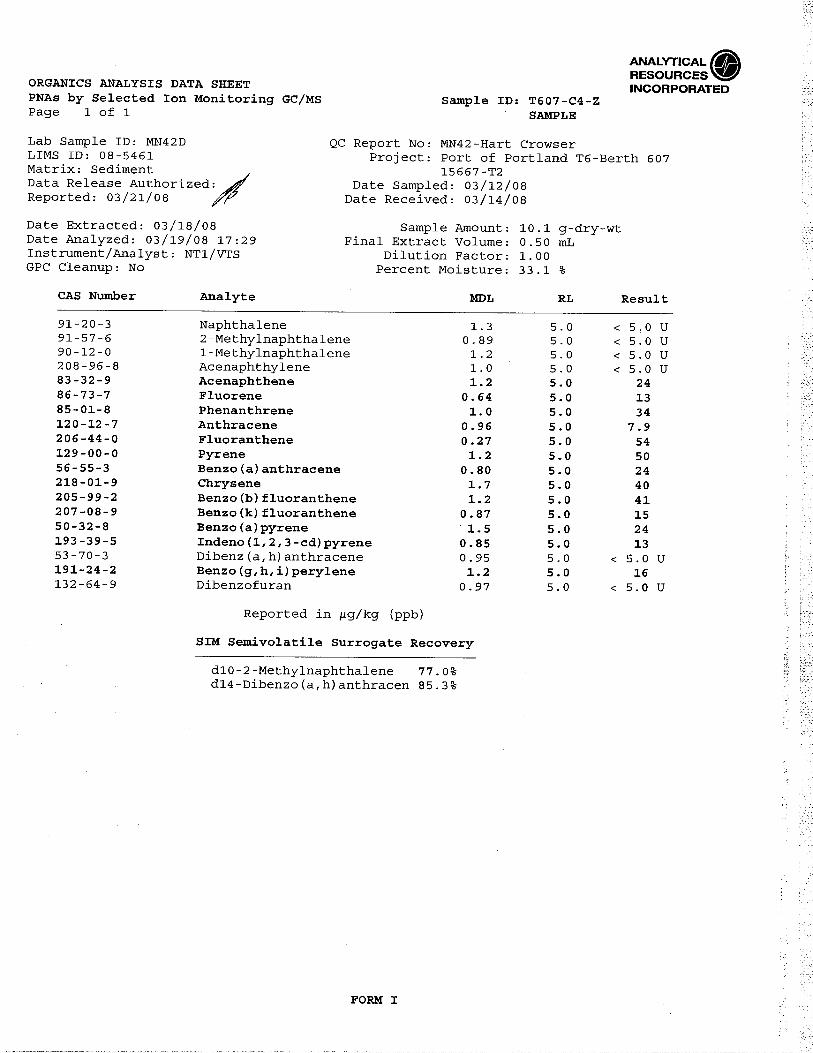
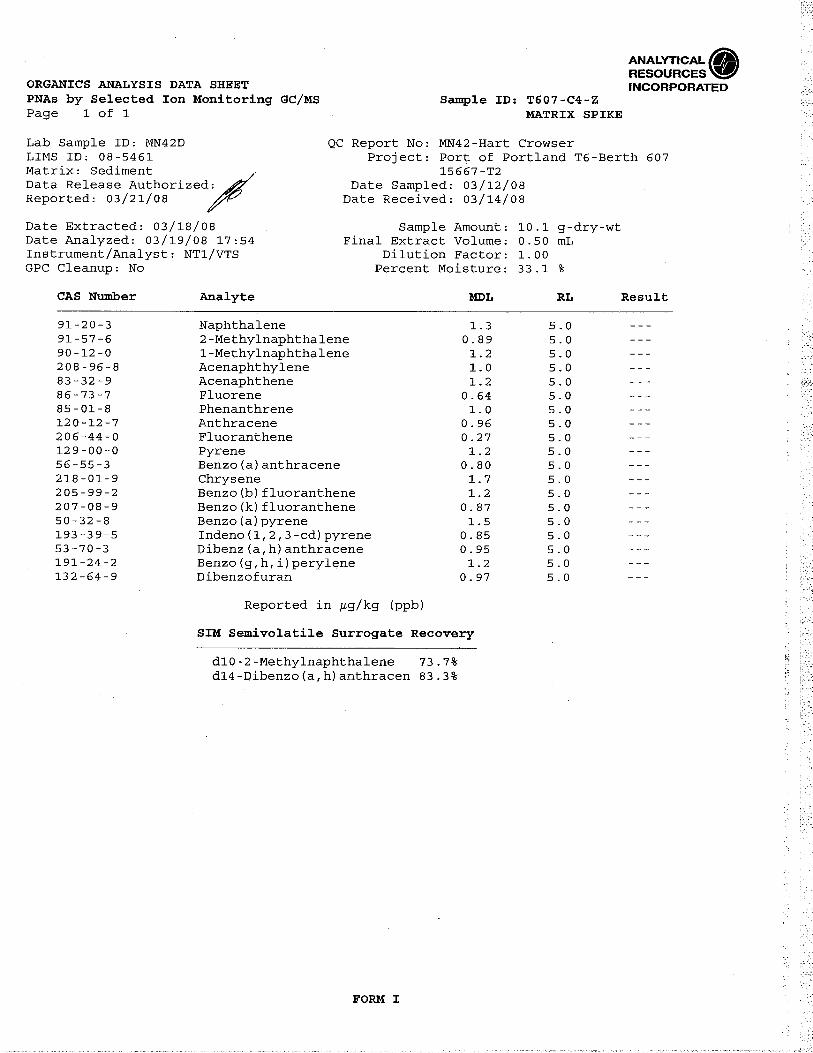
Polynuclear aromatic hydrocarbon (PAHs) by EPA Method 8270D-SIM;
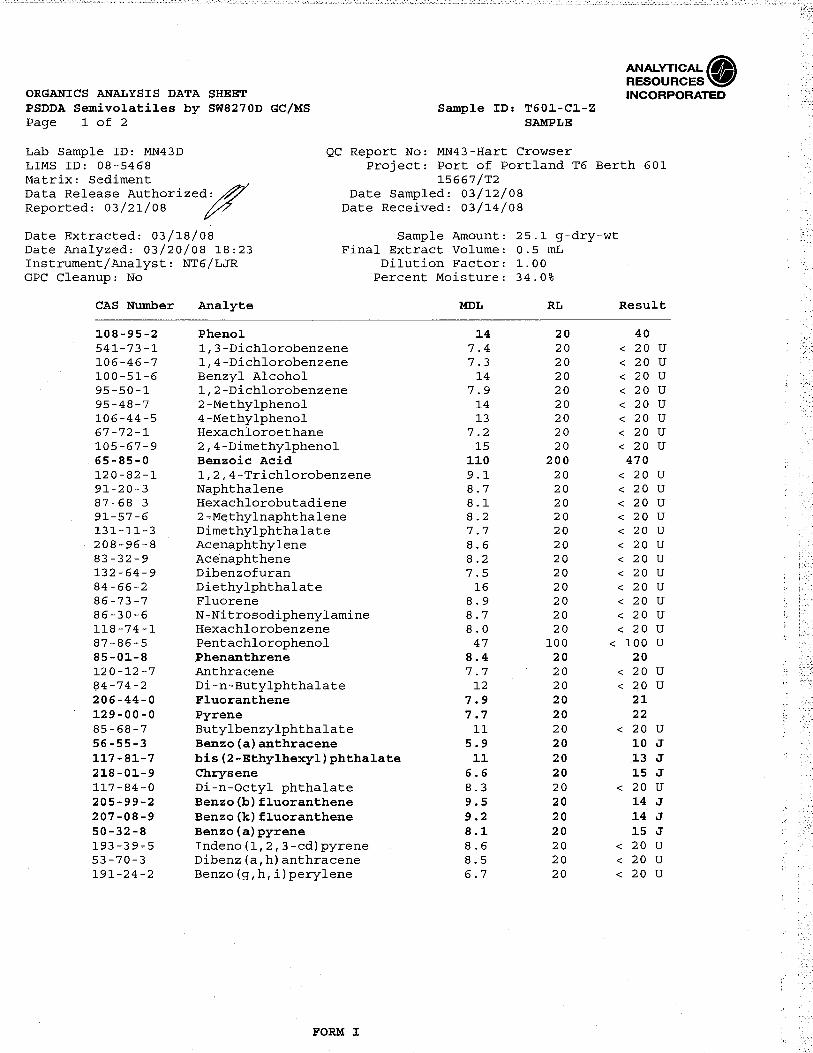
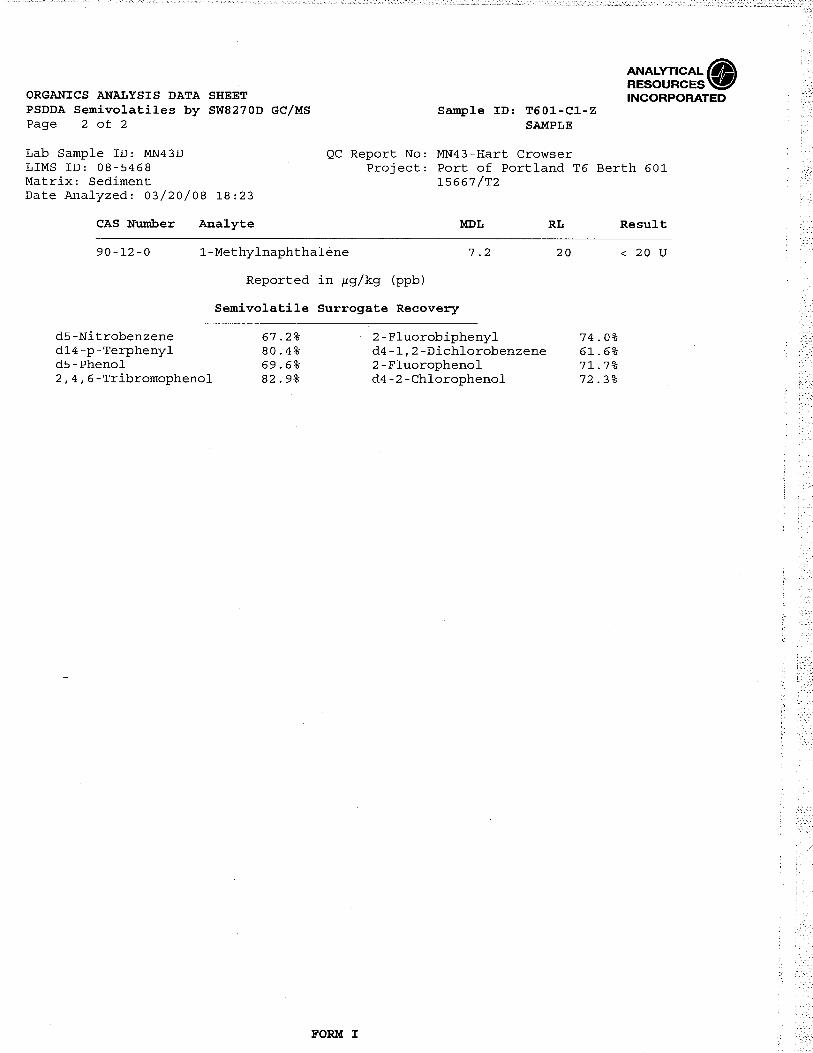
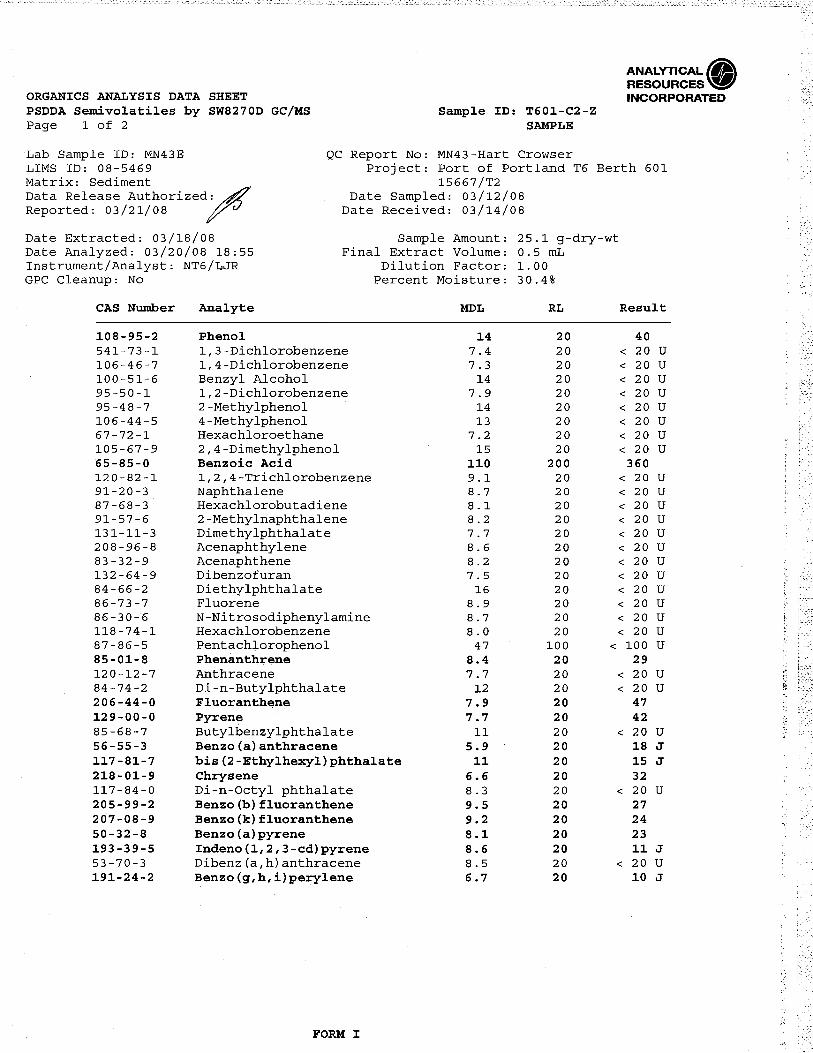
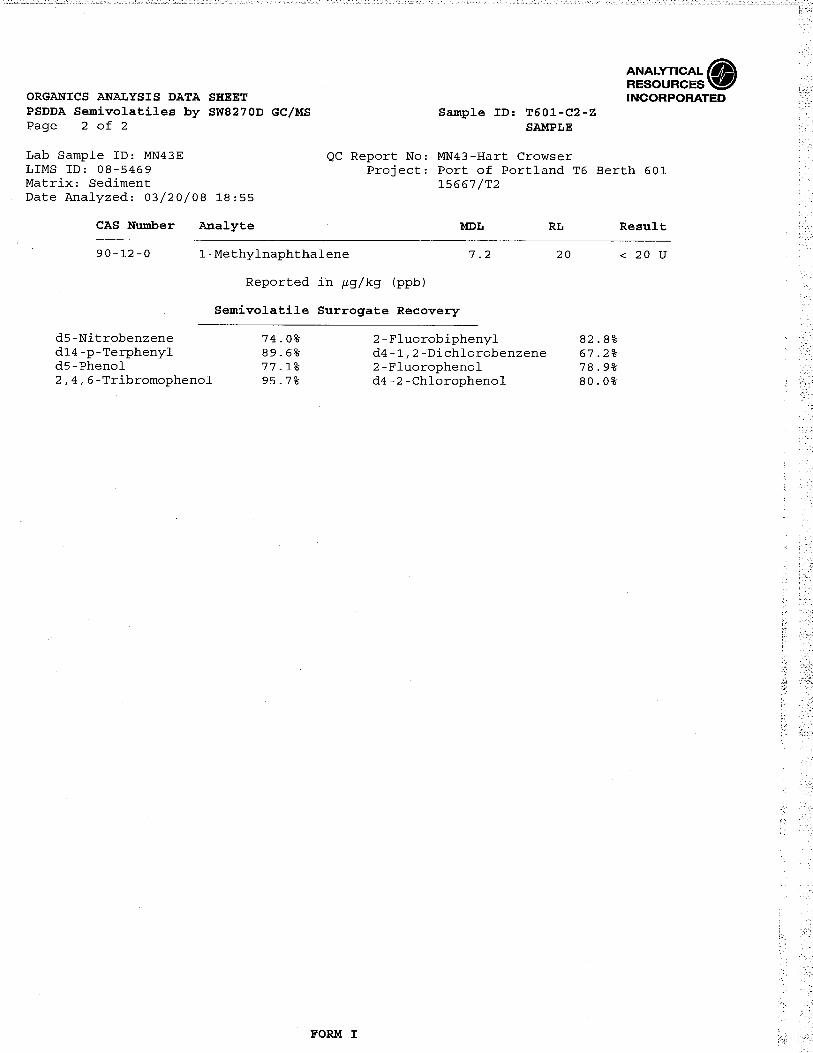
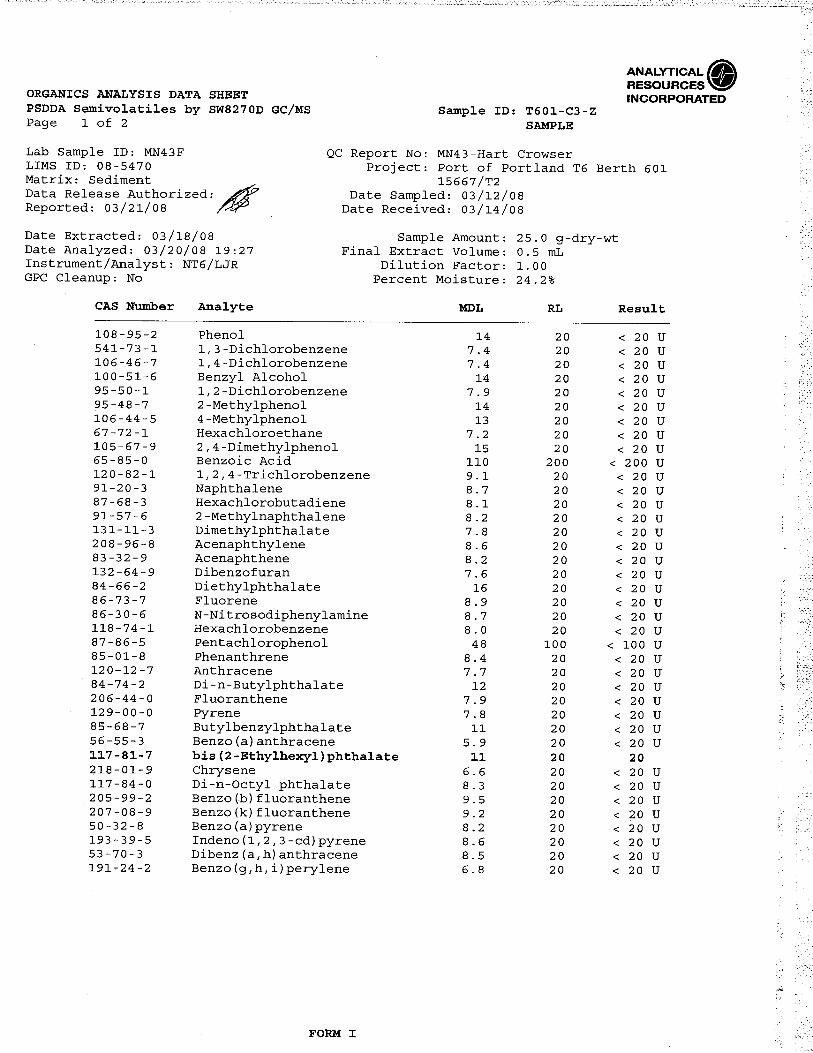
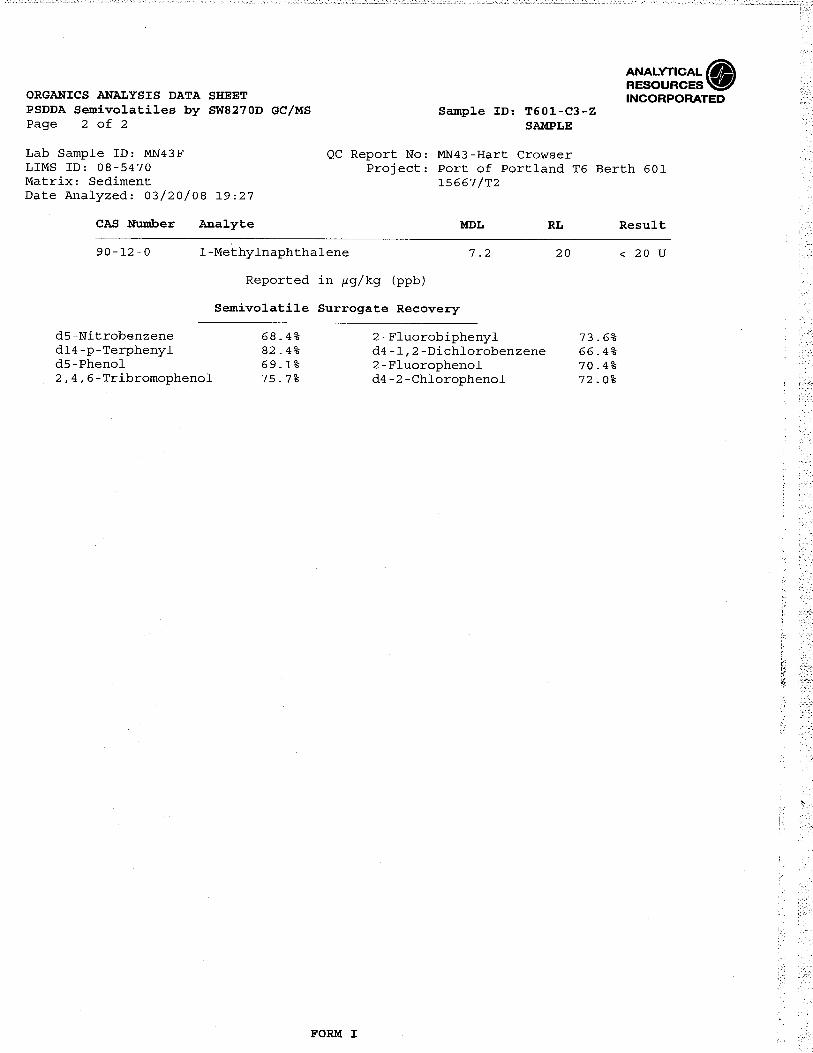
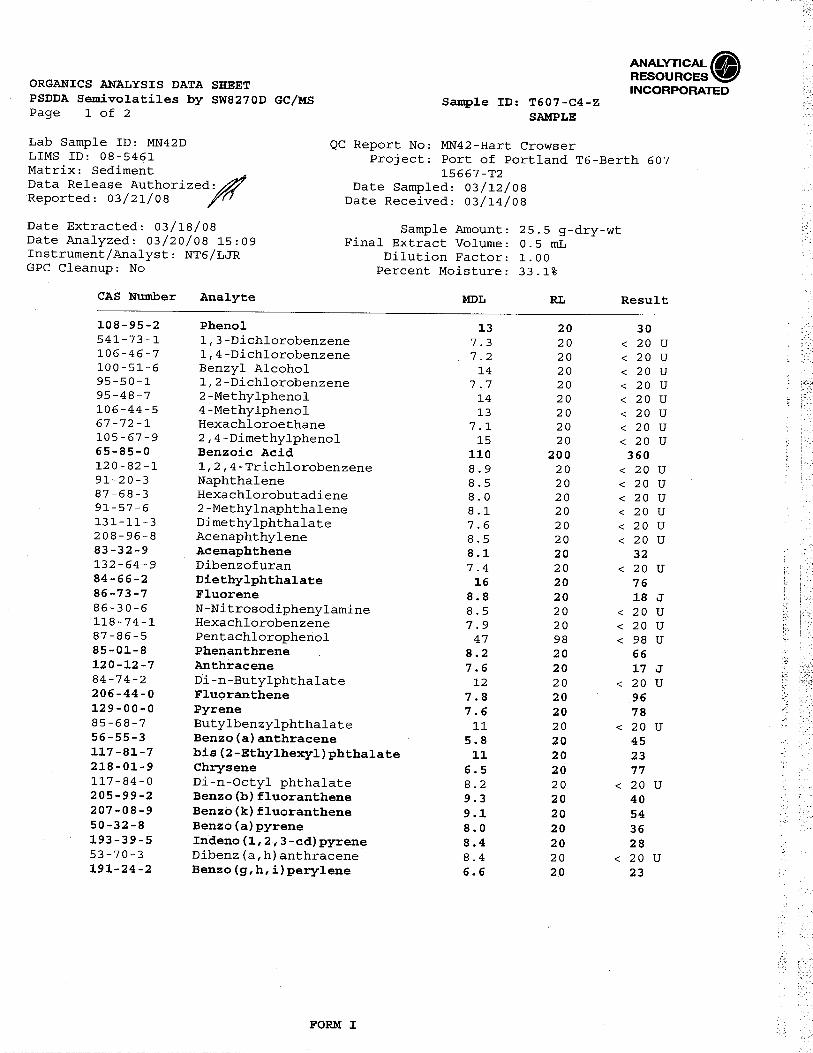
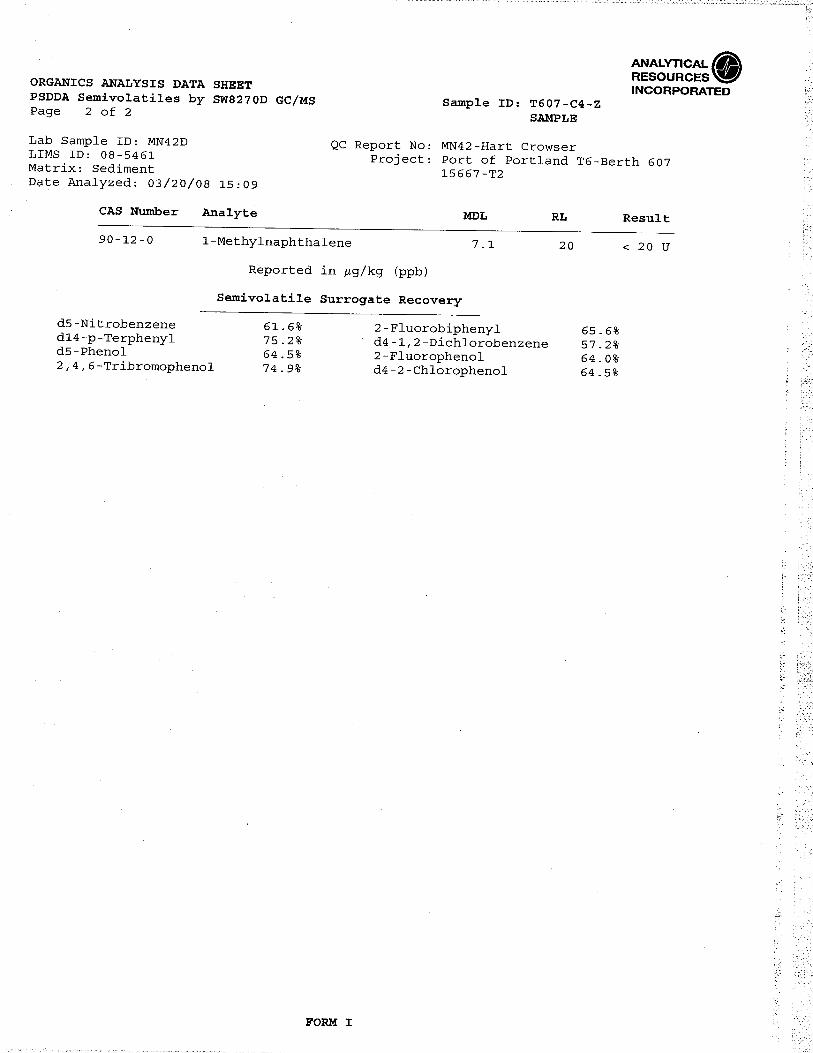
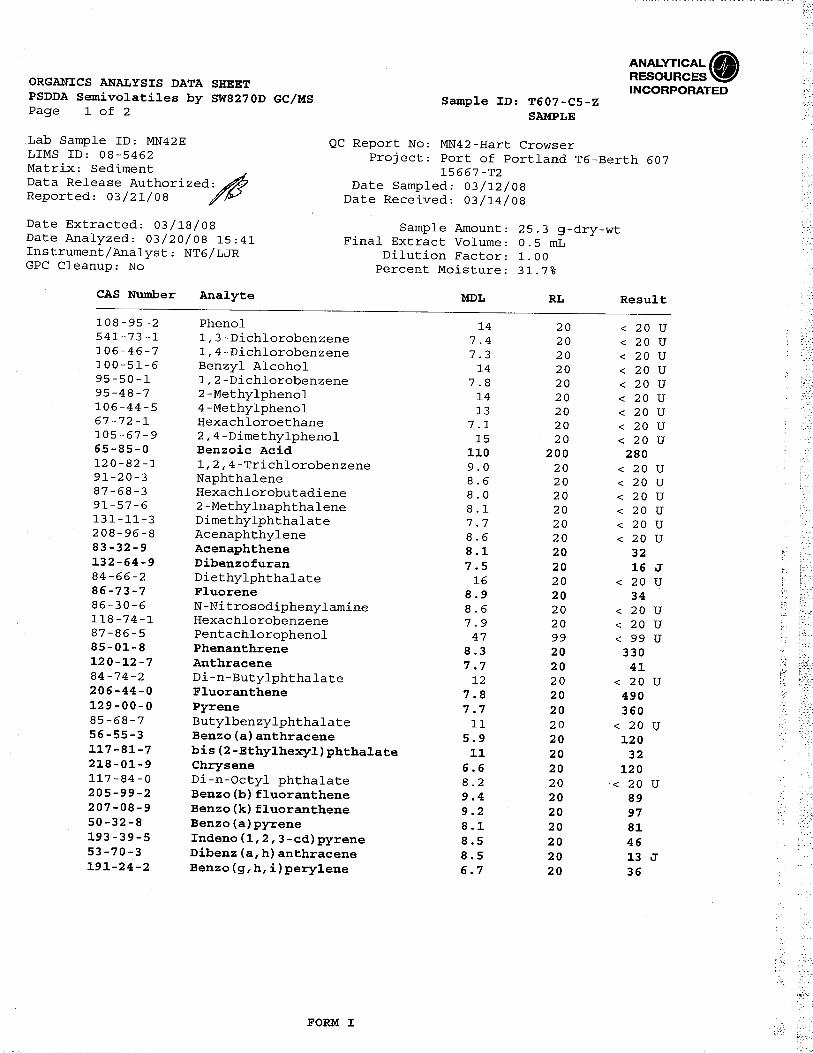
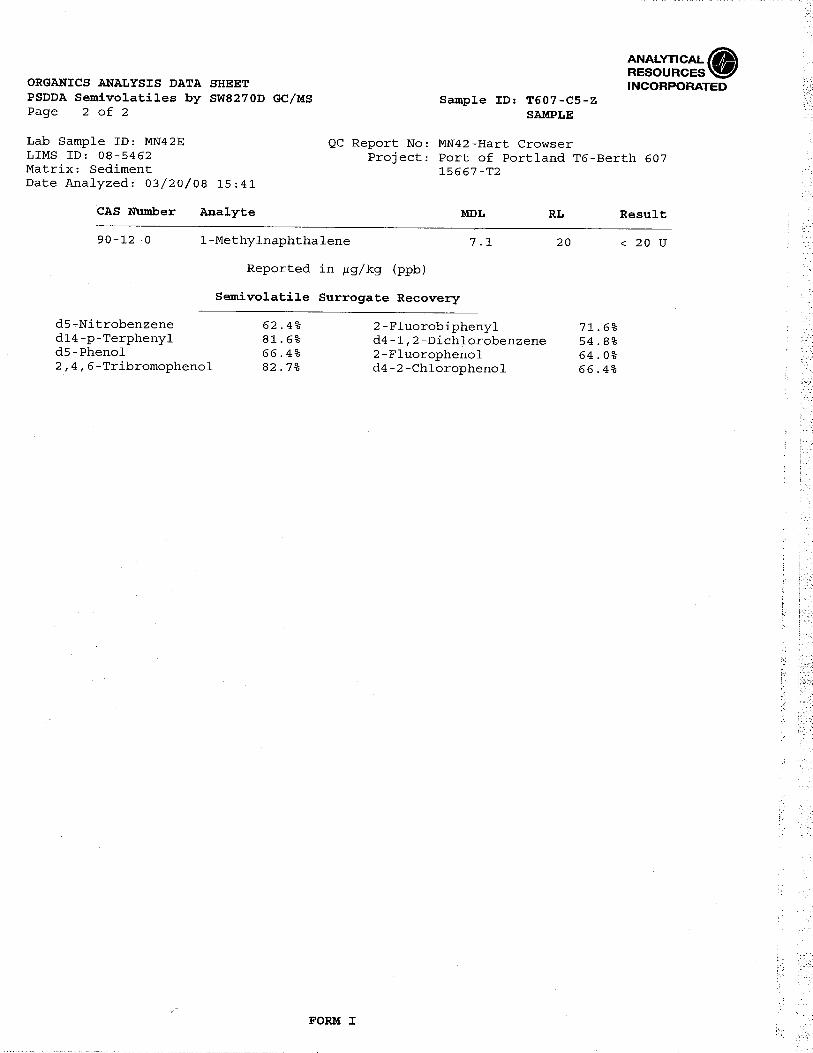
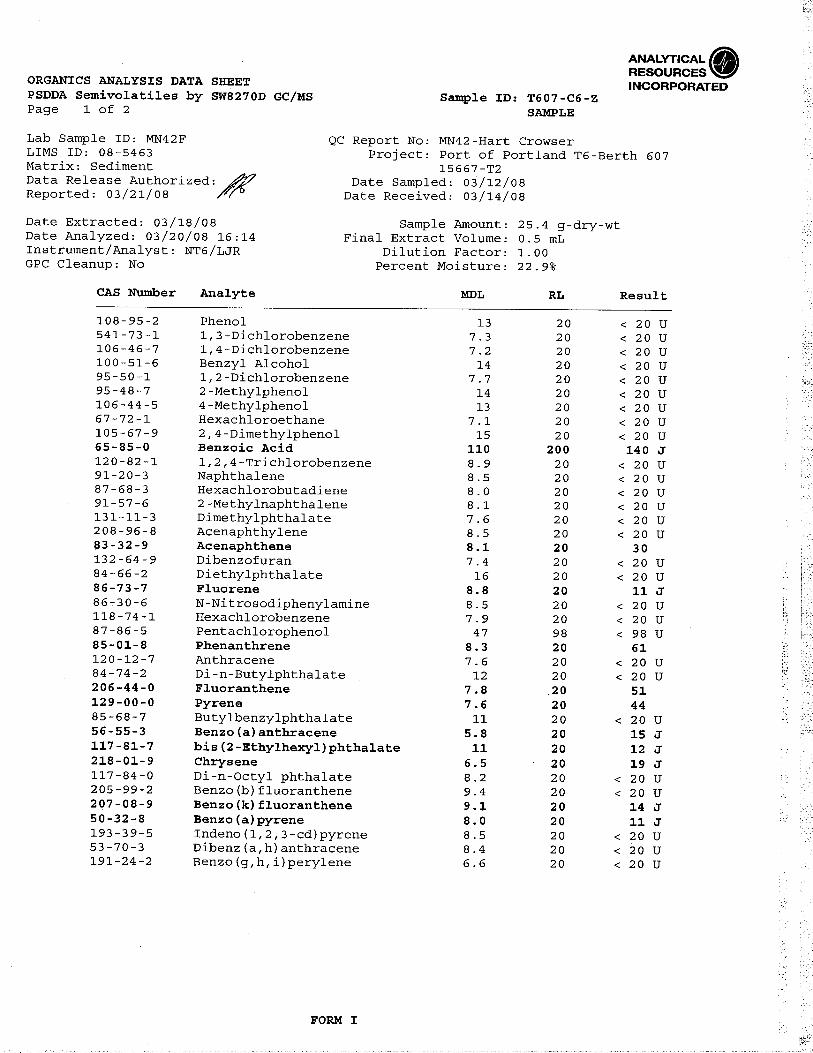
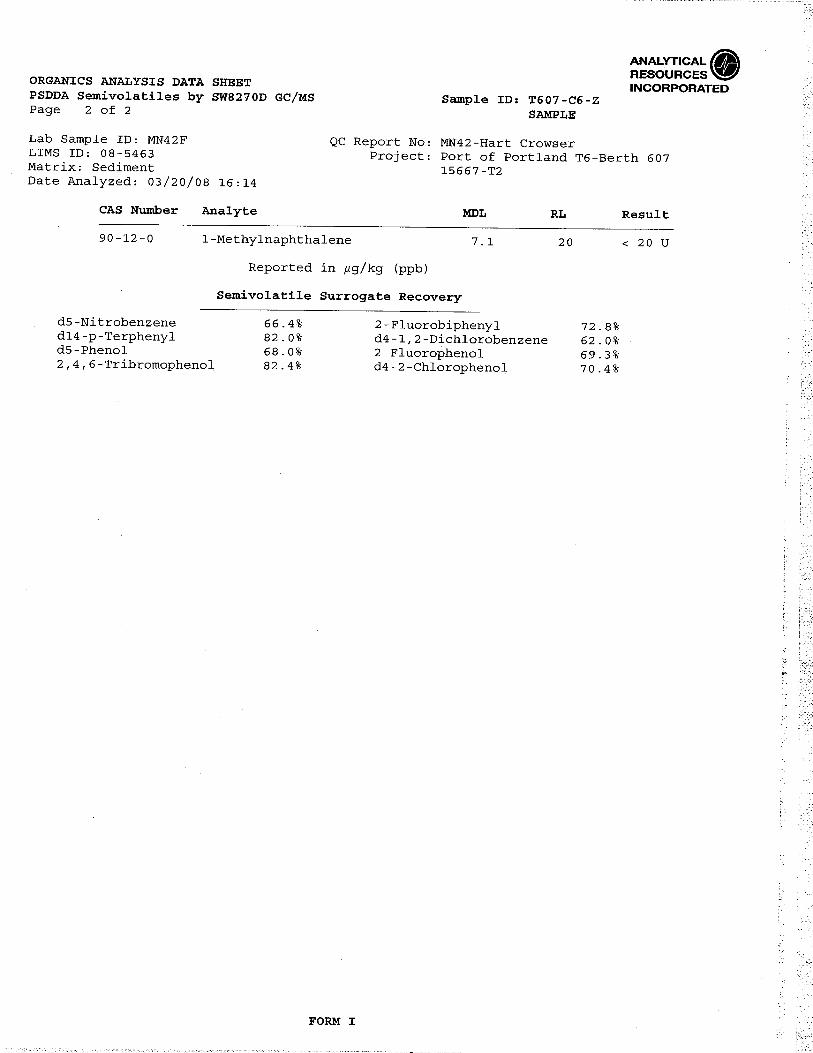
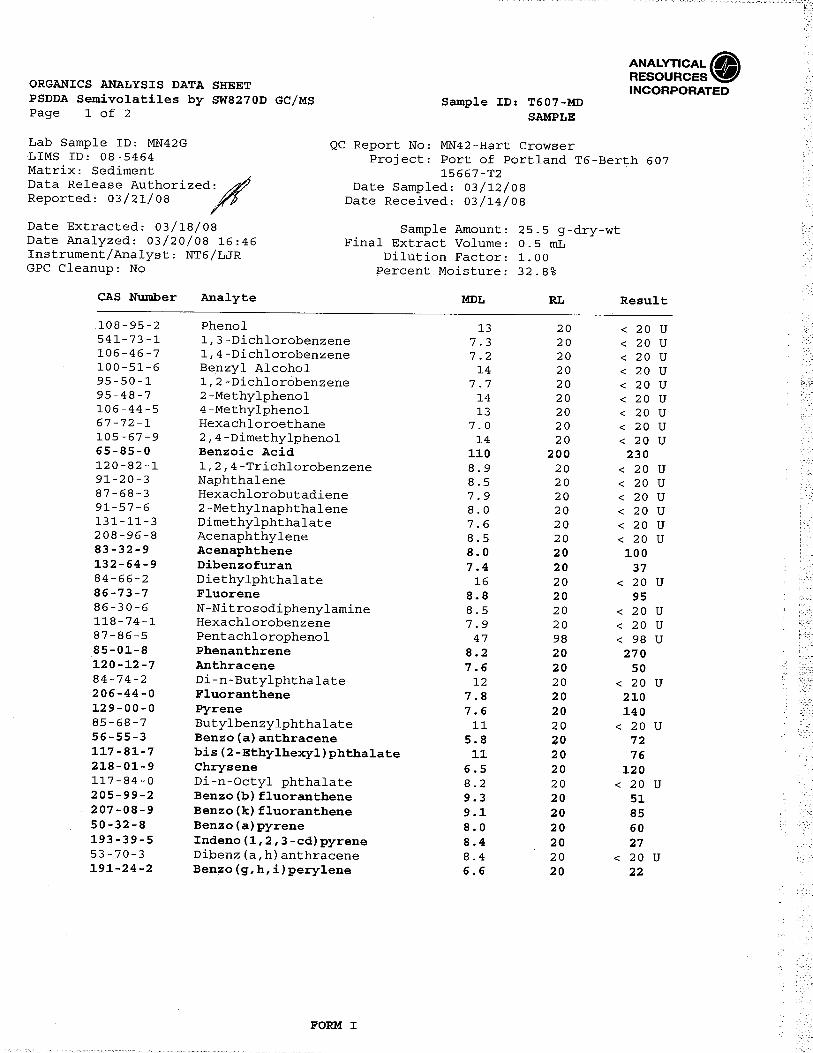
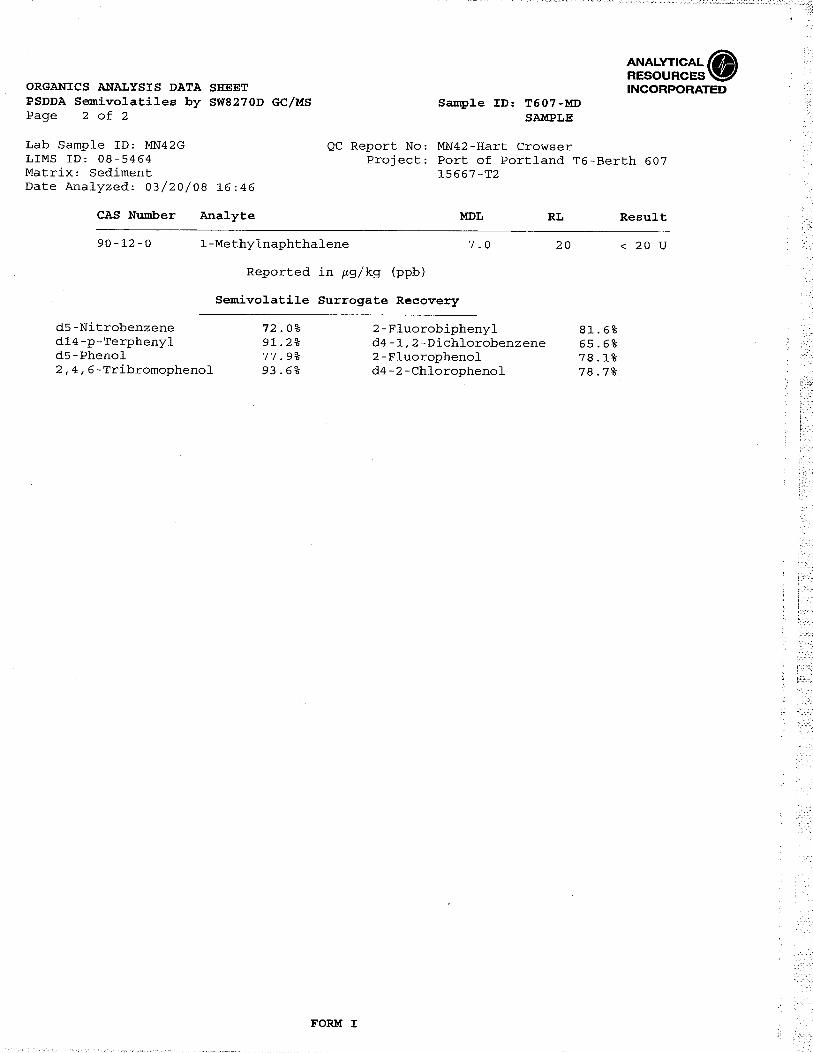
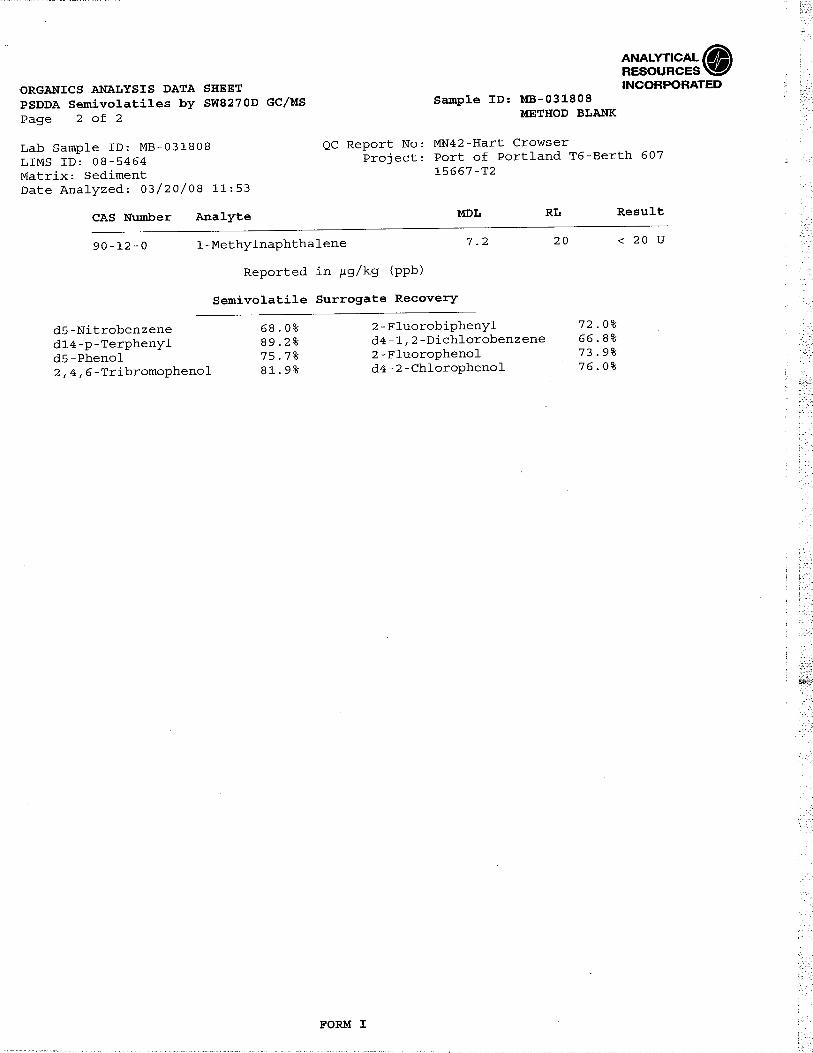
Semivolatile organic compounds (SVOCs) by EPA Method 8270D;
Organochlorine pesticides by EPA Method 8081A; and
Polychlorinated biphenyls (PCBs) by EPA Method 8082. 3.3 Modifications to the SAP
Sample protocols were conducted in accordance with the SAP (Hart Crowser, 2008). No modifications to the SAP were prompted by field conditions. The analytical program followed the SAP, except for the following.
As requested by RSET (2008), all six NSM samples were analyzed instead of the two samples proposed in the SAP (one at each berth).
Antimony and arsenic were analyzed by EPA Method 200.8 to obtain lower method reporting limits (MRLs) for comparison to screening levels.
4.0 SEDIMENT QUALITY
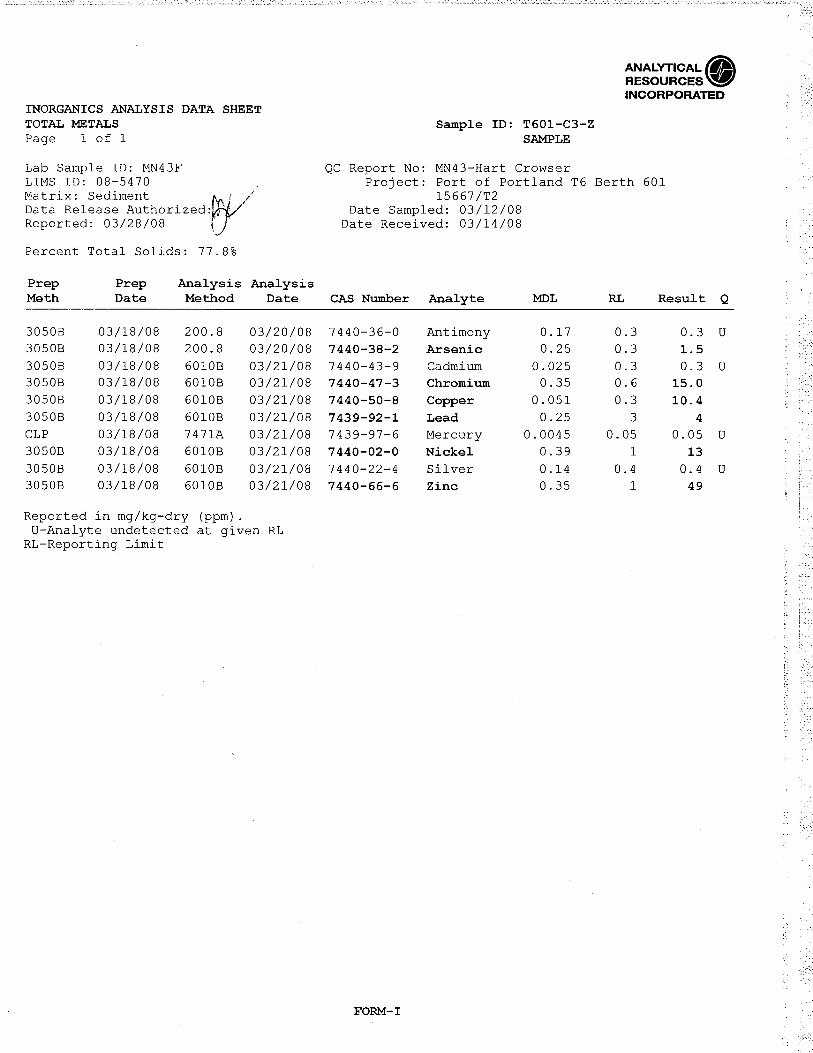
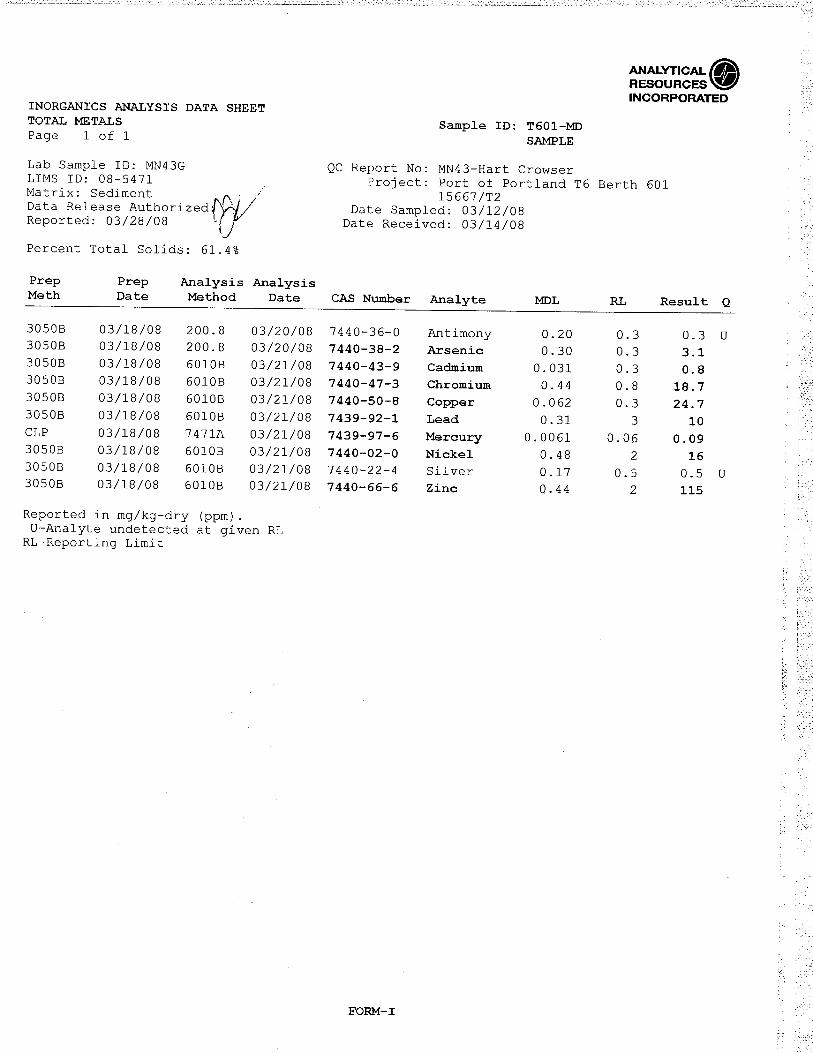
ARI completed analyses on two dredge prism composite samples and six NSM samples from Berths 601 and 607. Tables 3 and 4 list the physical and chemical results, respectively. Chemical results were compared to SEF SLs to assess the
Hart Crowser Page 5 15667-00 June 12, 2008
chemical quality of the dredge prism and NSM sediments. This section presents the results and provides an evaluation of them.
4.1 Data Quality Review
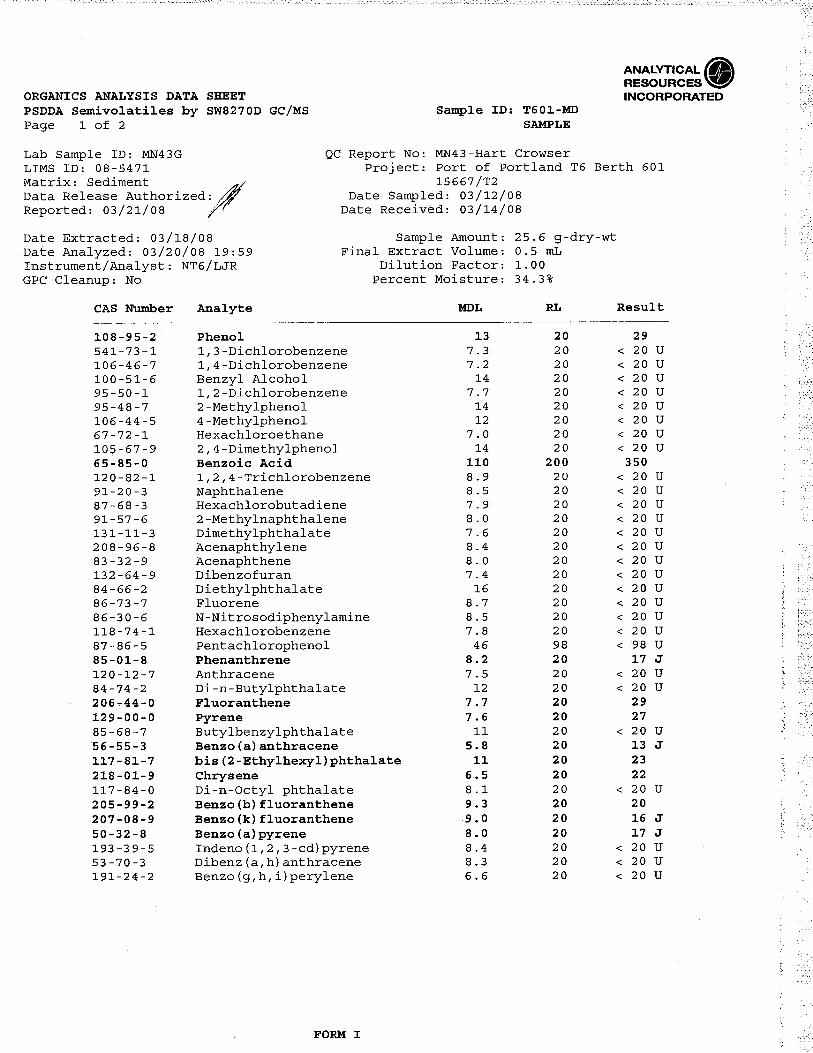
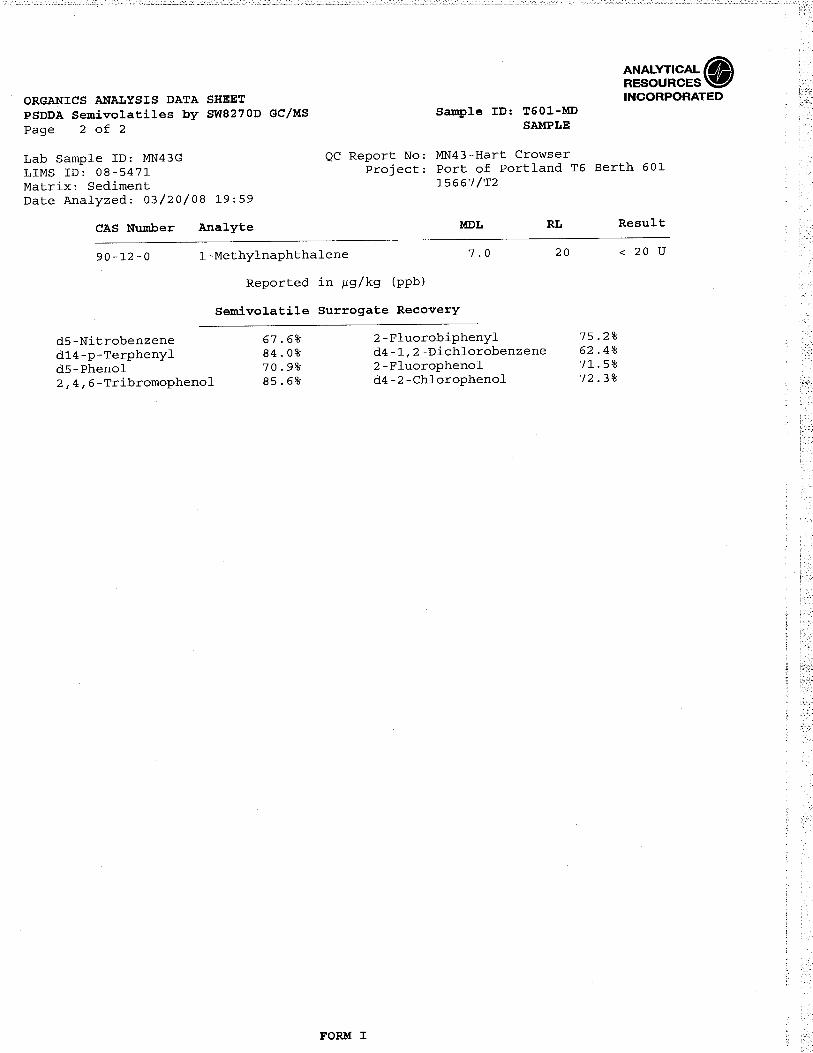
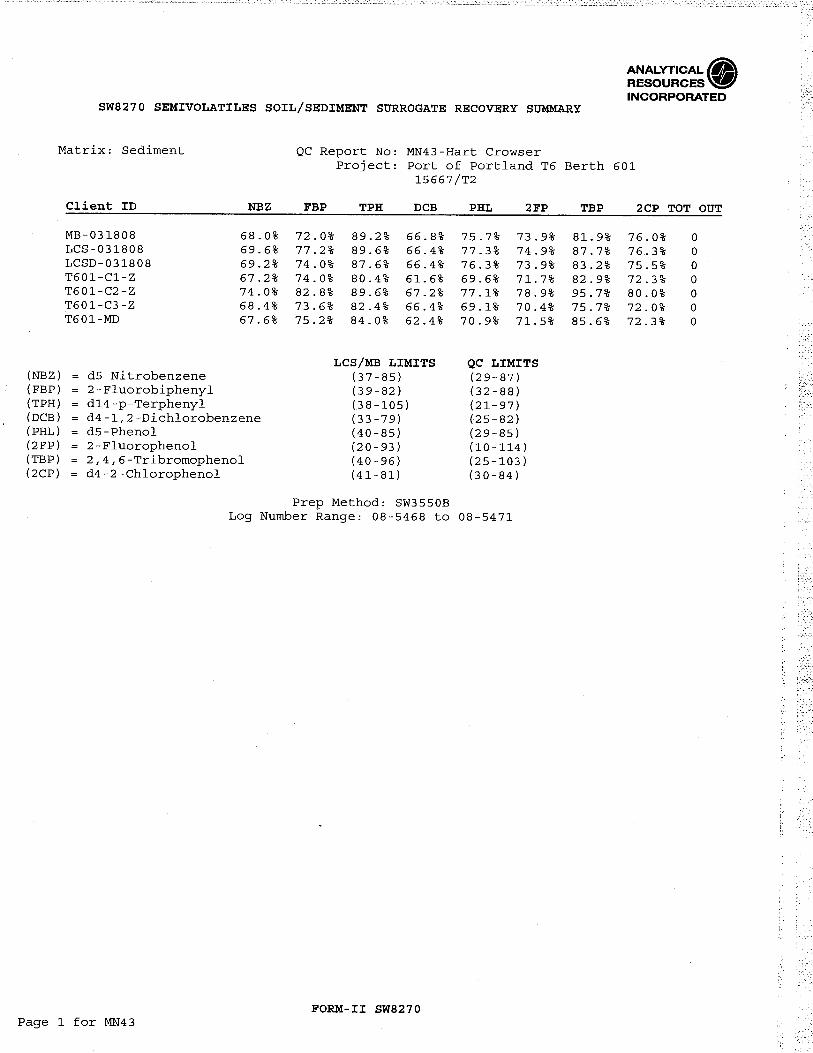
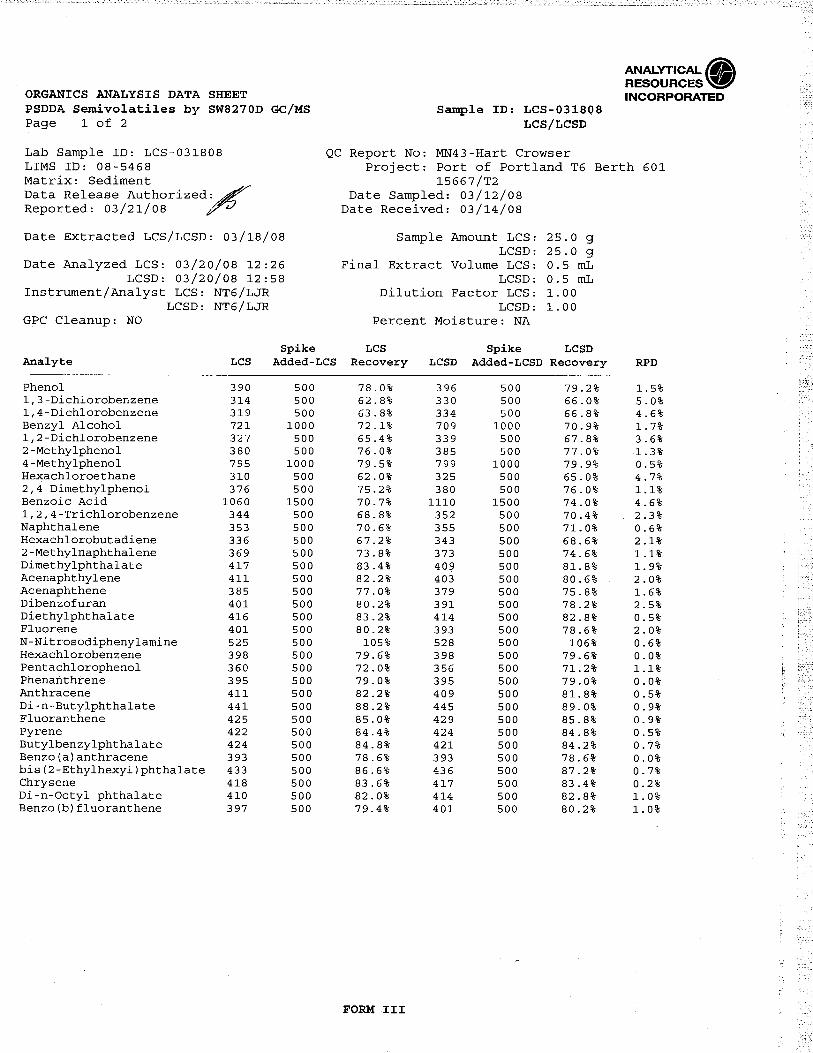
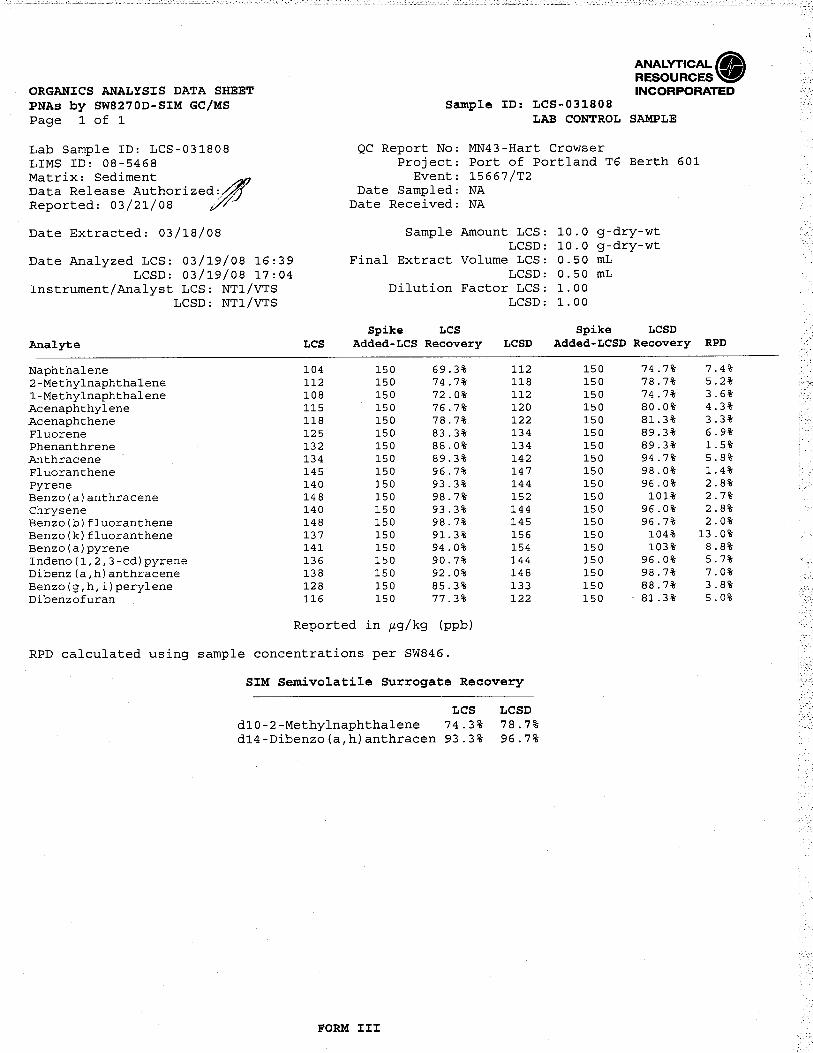
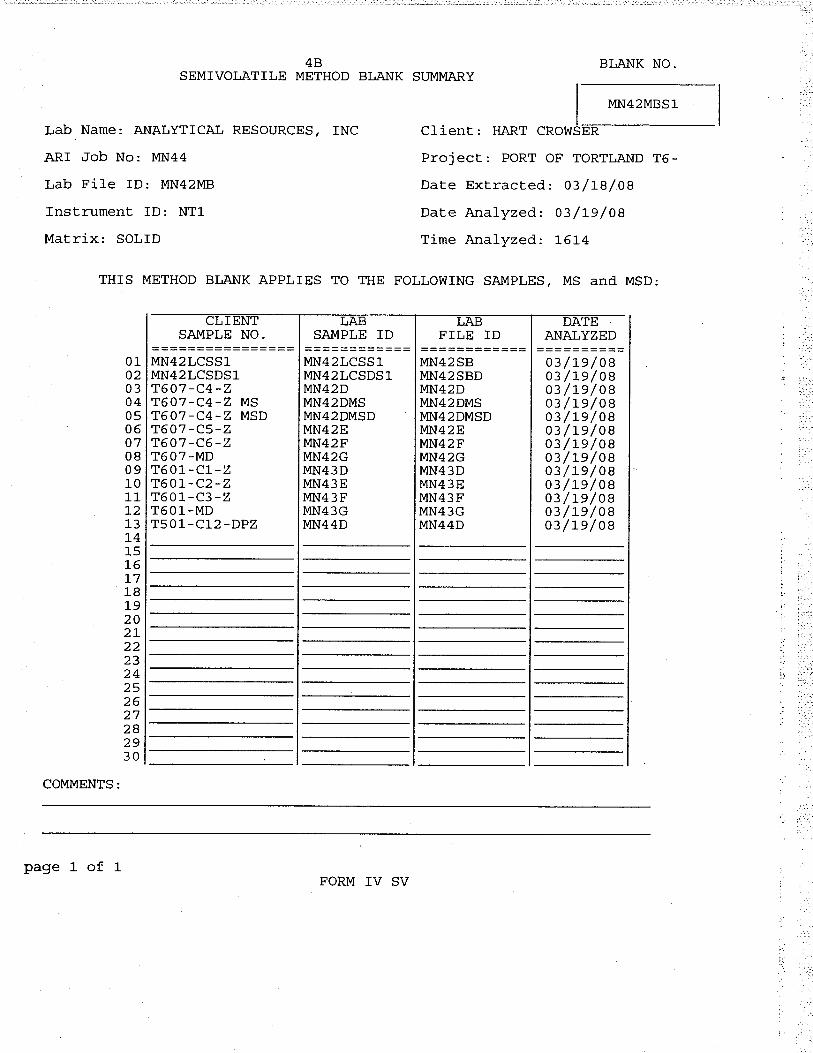
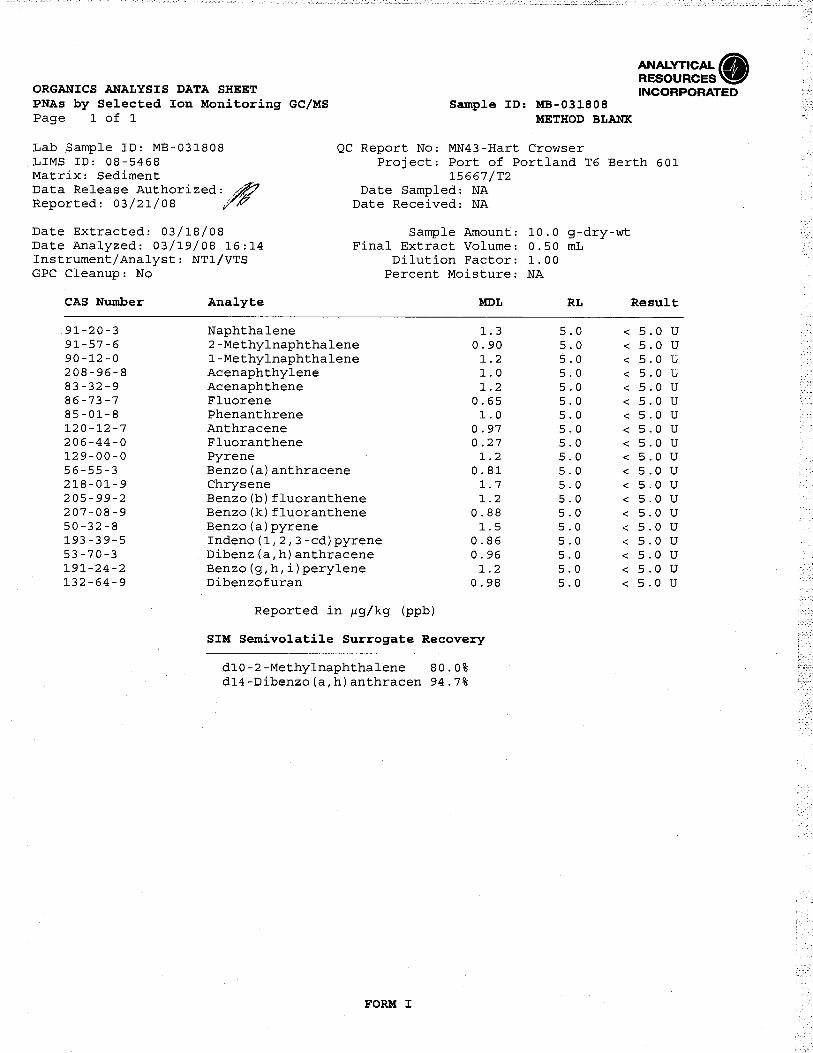
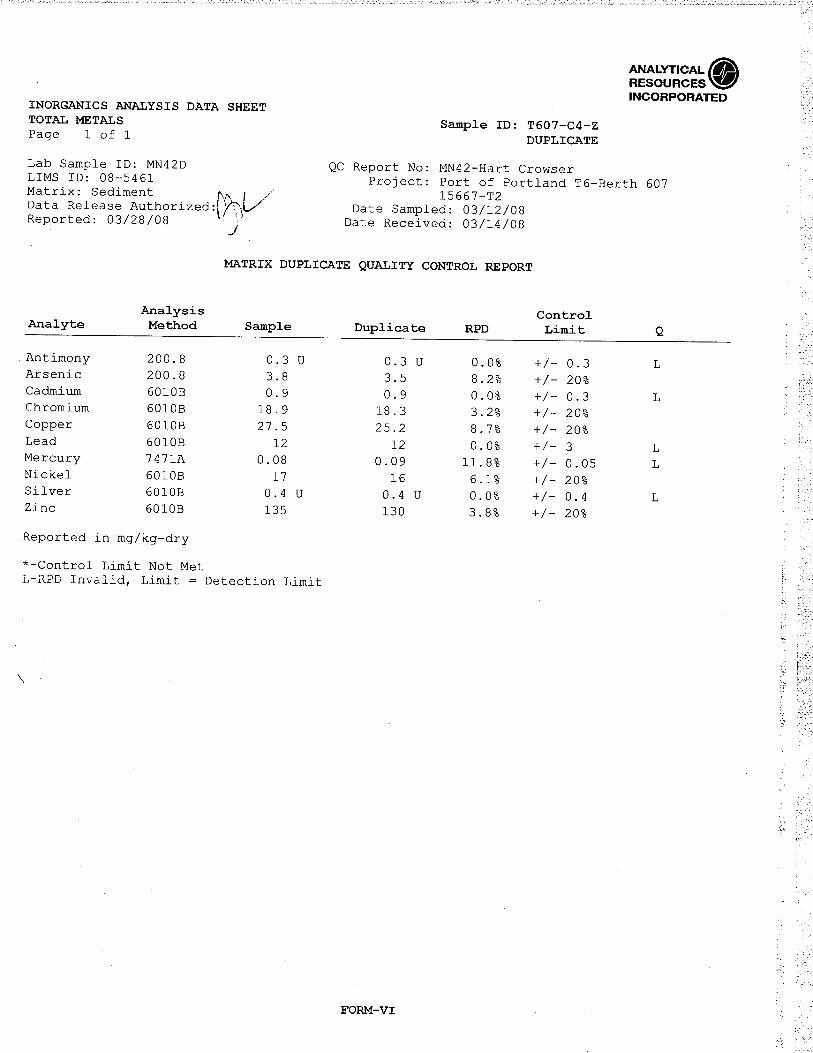
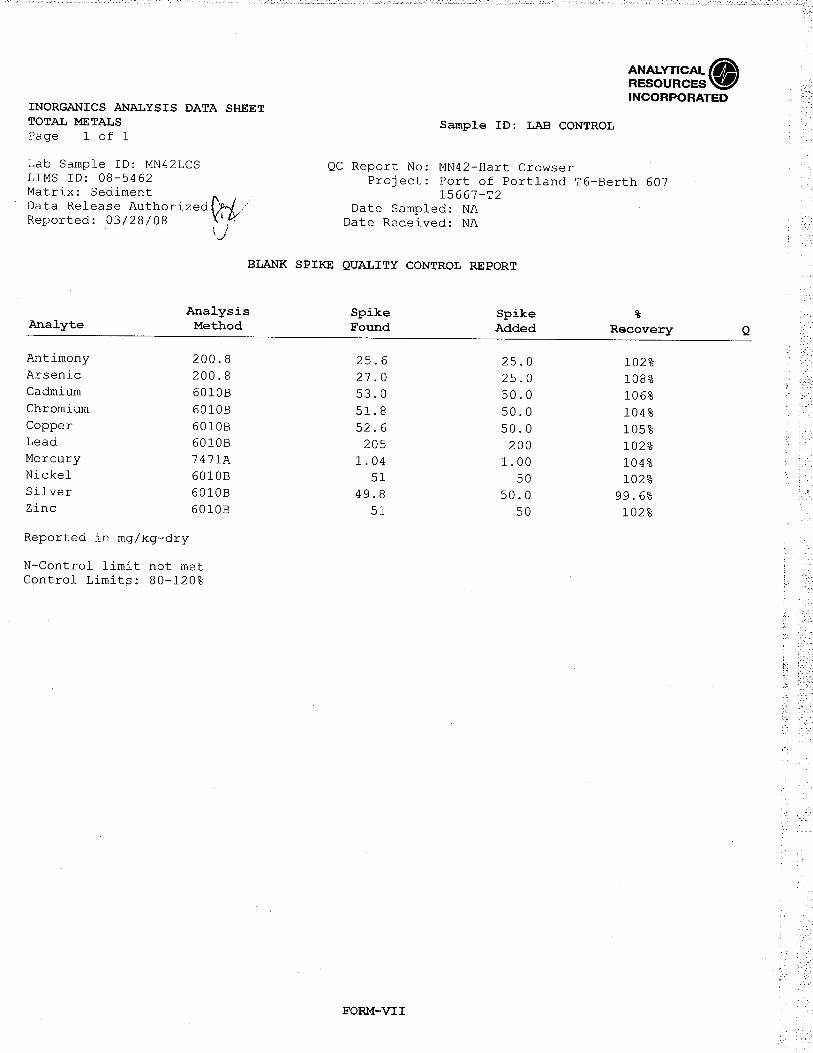
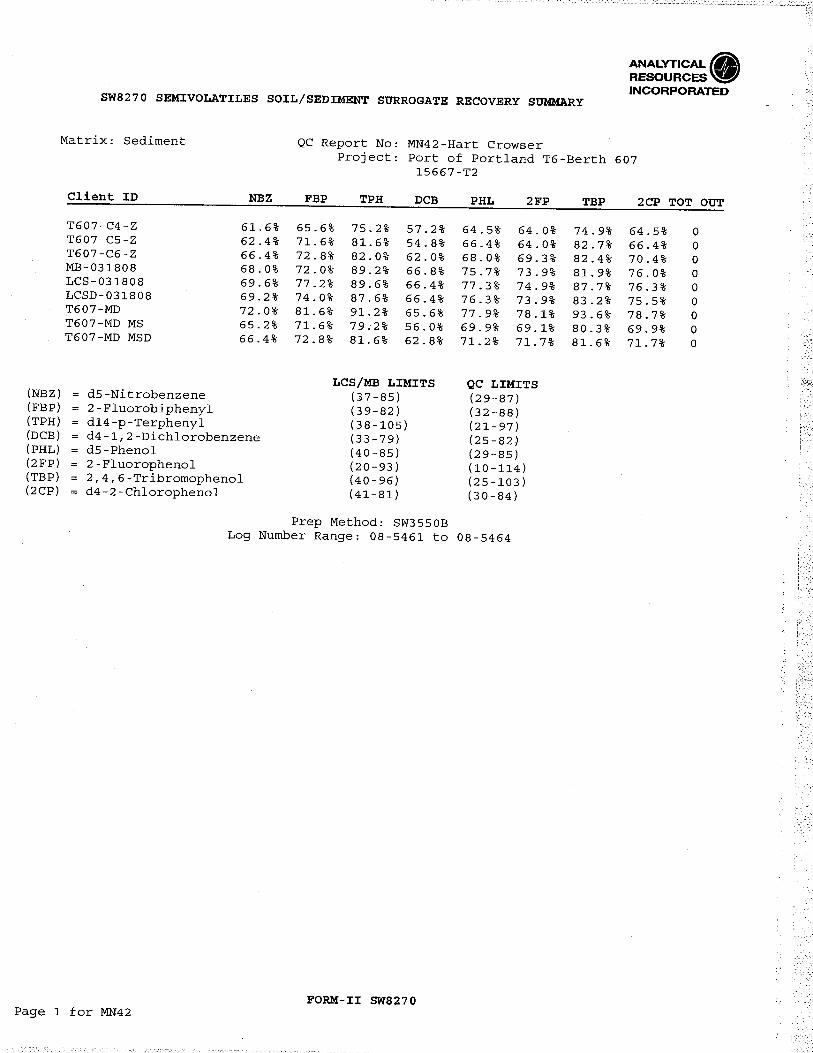
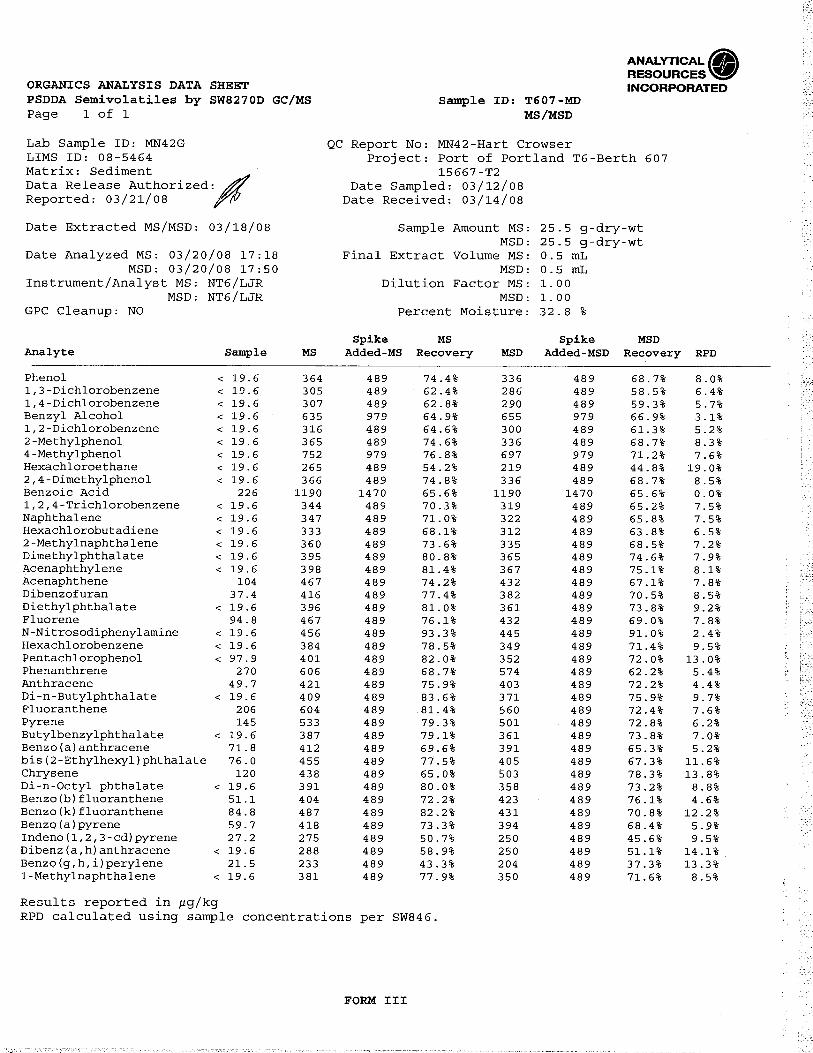
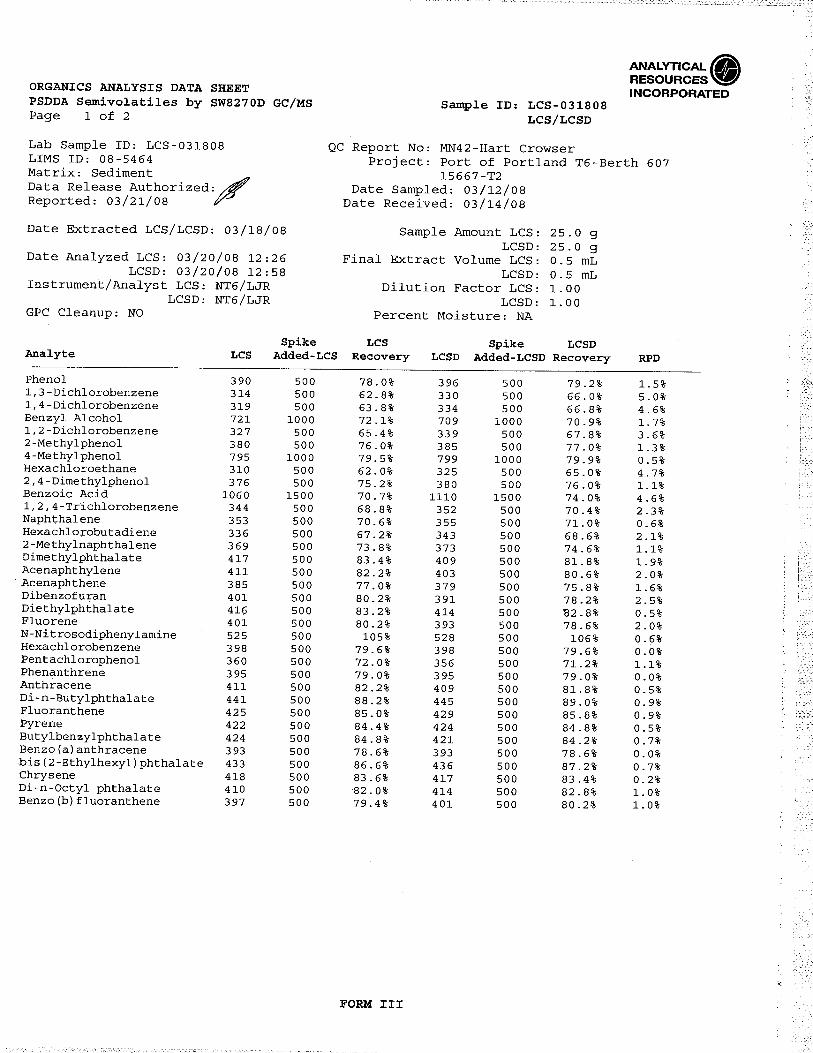
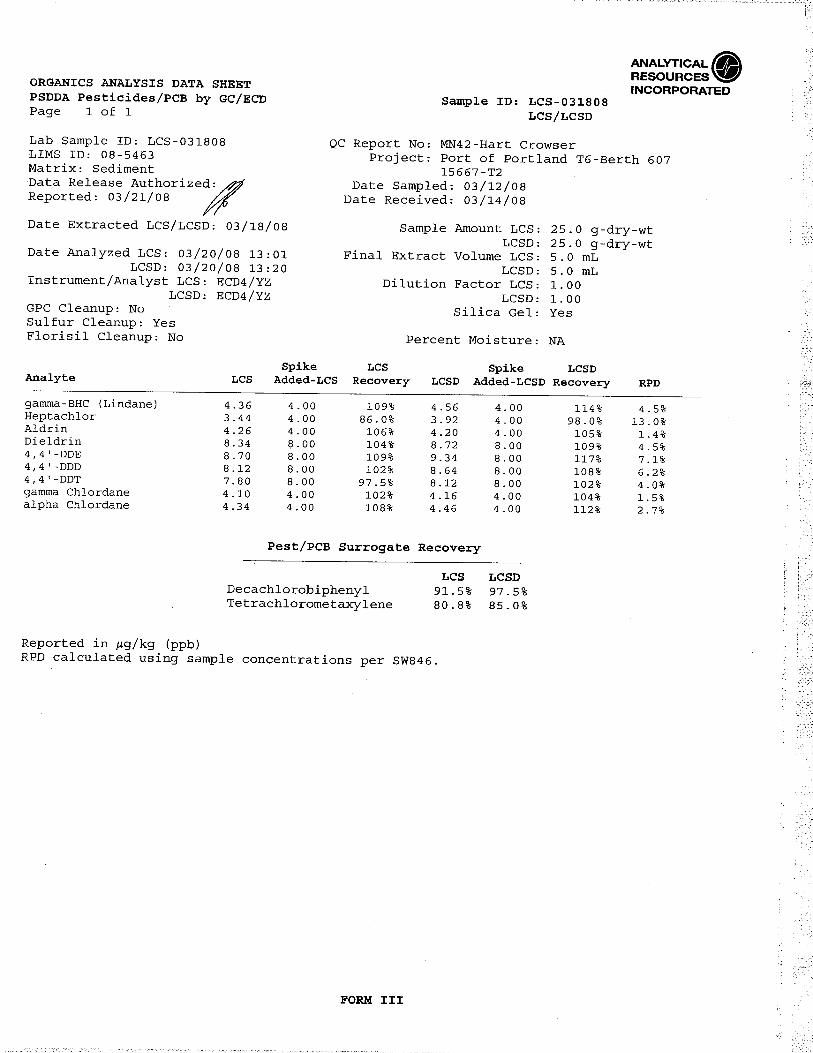
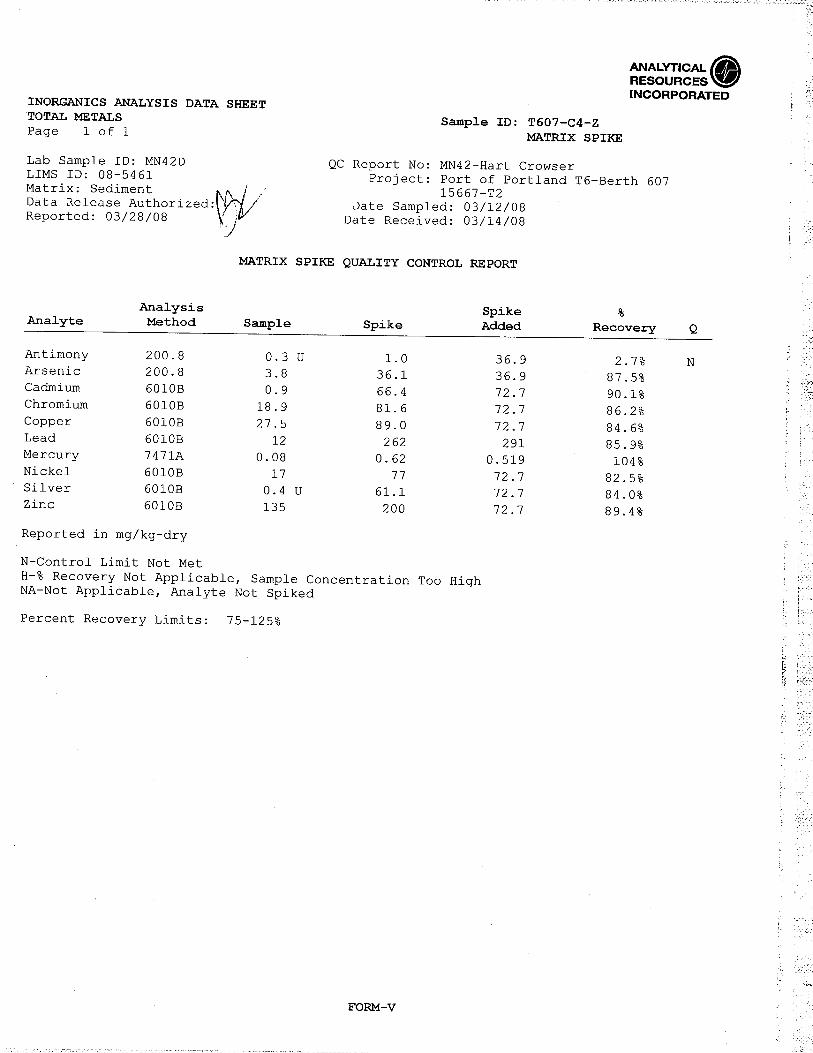
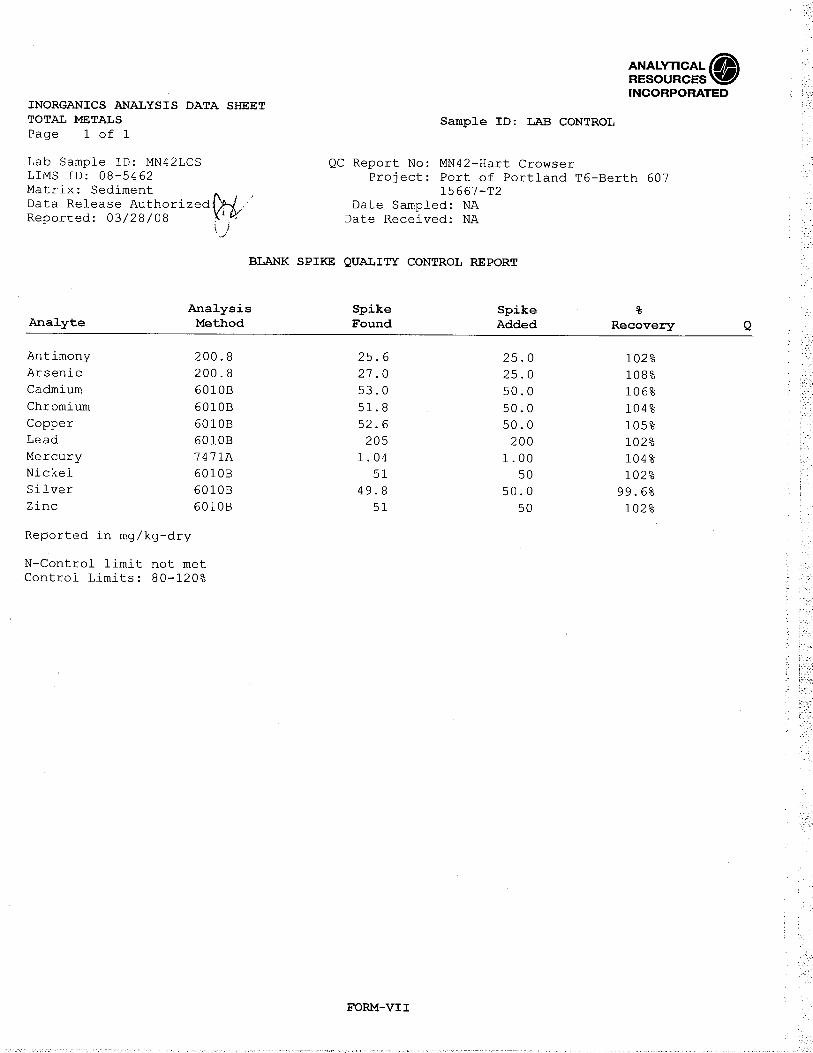
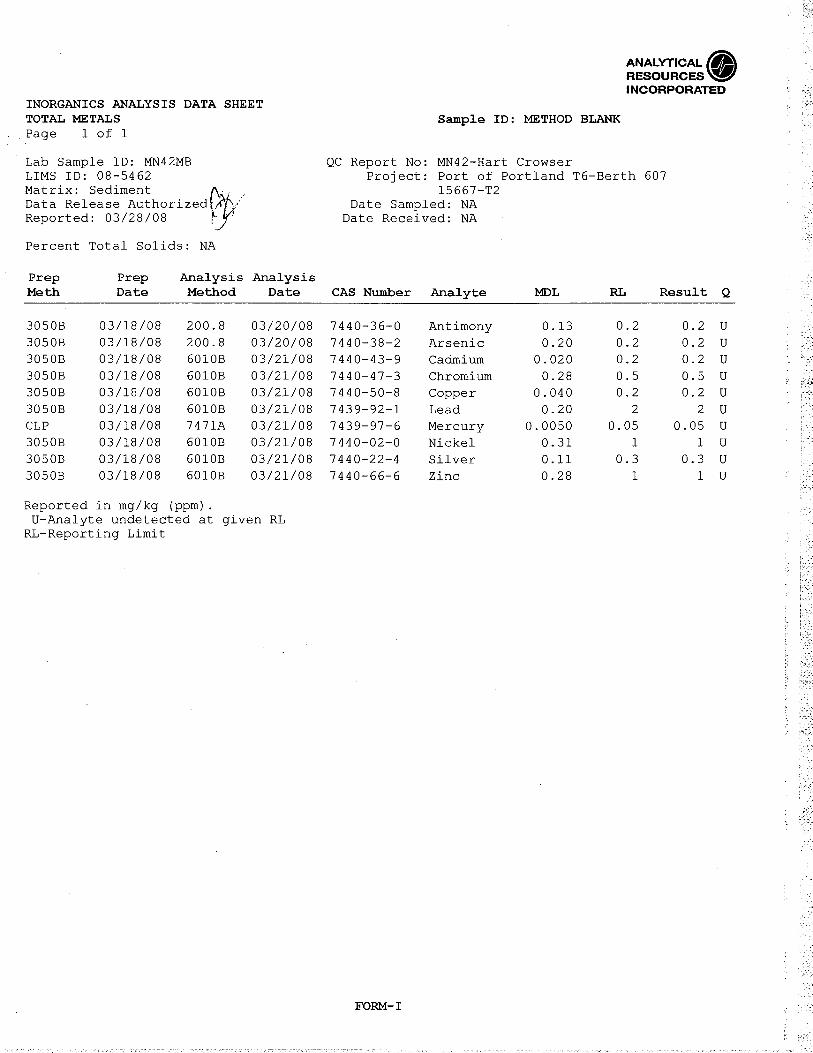
A QA review of the data is provided in Appendix B. Both MRLs and method detection limits (MDLs) were reported for all chemical analyses except conventional analyses (although the ARI reports MDLs for metals, they do not estimate concentrations between the MDL and MRLs). The laboratory analyzed QC samples, including surrogates, method blanks, laboratory control samples (LCS), matrix spikes (MS), and laboratory, LCS, and MS duplicates. Upon review, the overall data quality objectives for collection and chemical testing of sediment samples were met, and the data for this project are acceptable for use as qualified. Laboratory reports for chemical analysis, including QC samples, are included in Appendix C.
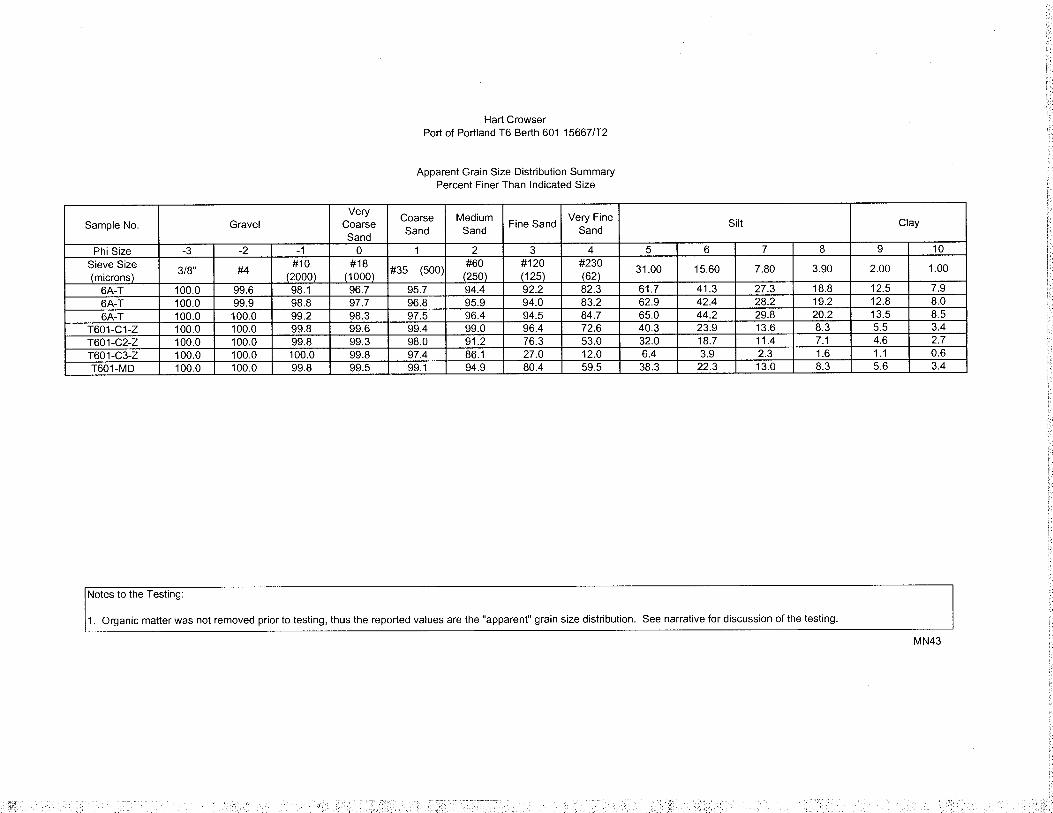
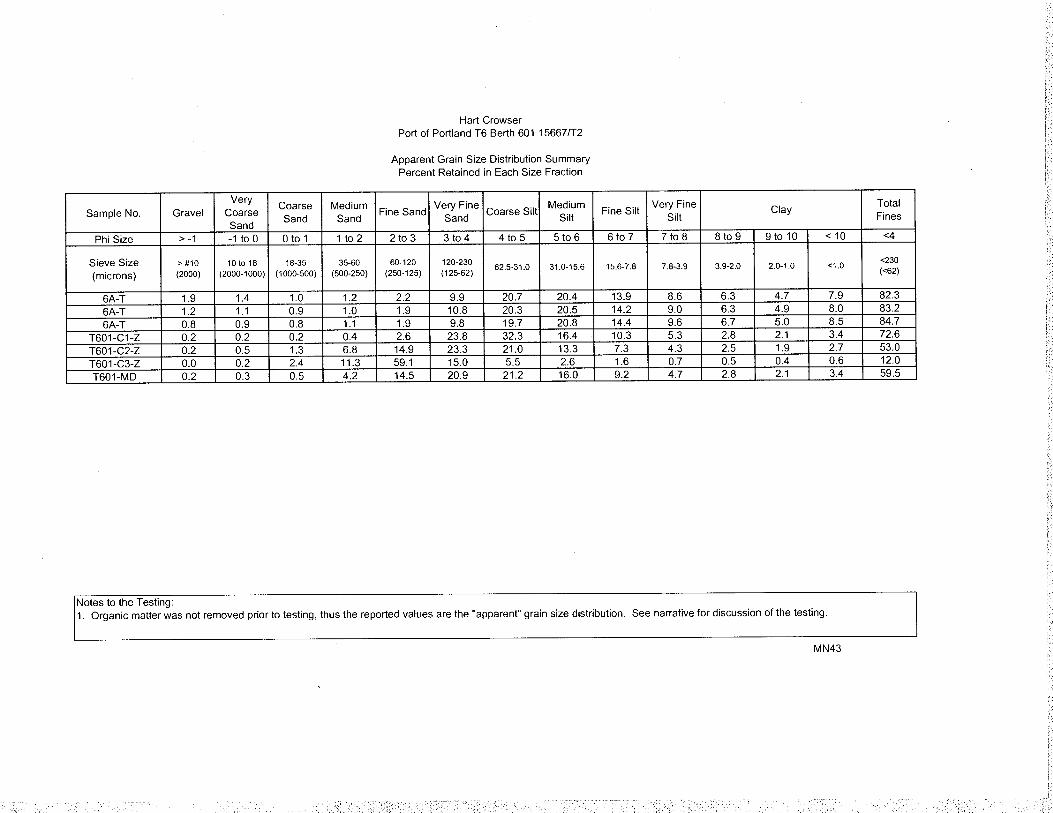
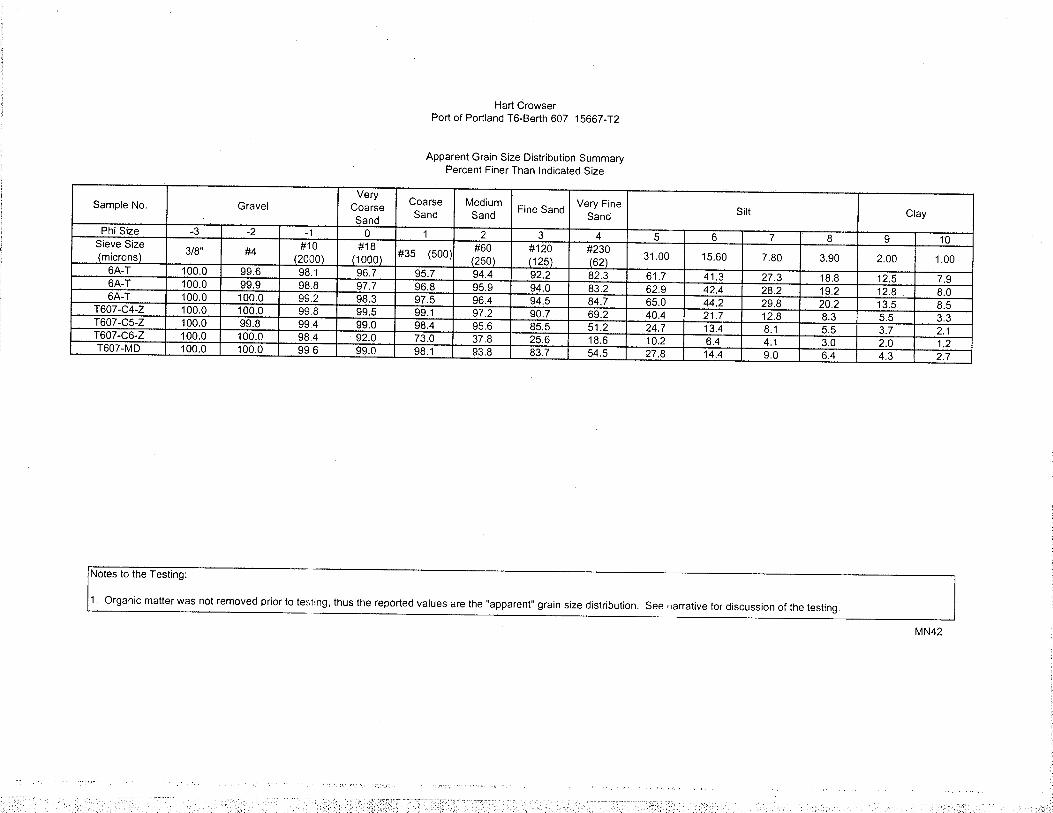
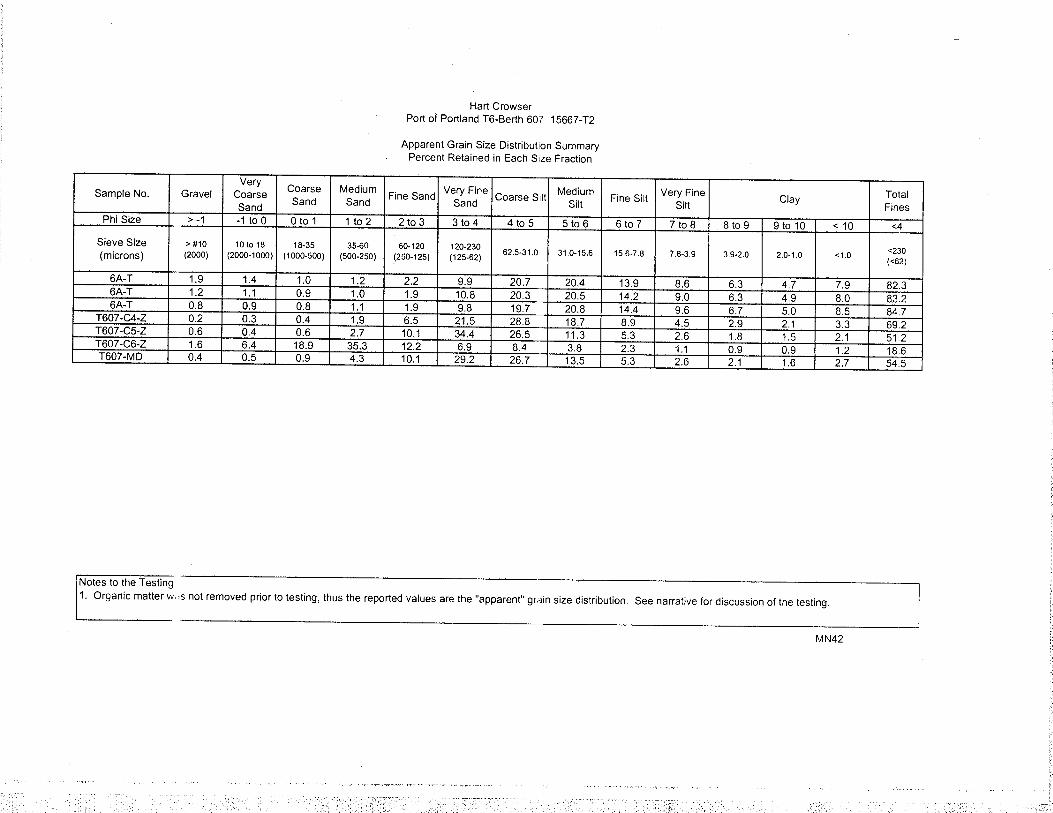
4.2 Grain Size Characteristics
The grain size results are presented in Table 3, and grain size distribution curves are provided in Appendix C. The grain size distributions of the dredge prism composite samples (T601-MD and T607-MD) were similar, consisting of 54.5 to 59.5 percent fines and classified as a slightly clayey, very sandy silt. The NSM samples ranged from a sandy silt to a slightly silty sand. At each berth, NSM sediments became increasingly sandy upstream. The downstream samples at each berth had 69.2 to 72.6 percent fines (sandy silt), whereas upstream samples had 12.6 to 18.6 percent fines (a slightly silty sand).
4.3 Comparison to SEF Screening Levels
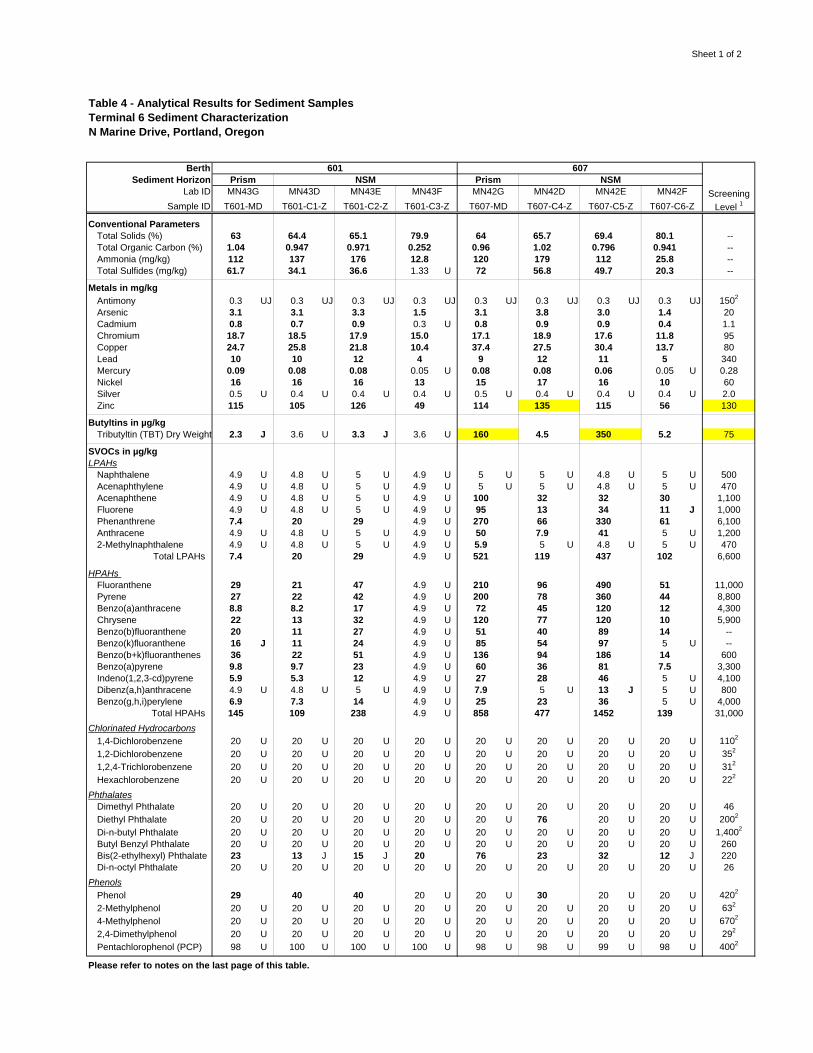
Table 4 presents the chemical results on the sediment samples. Per our SAP, these results were compared to the SEF SLs. These SLs were established in the SEF for protection of the aquatic environment and to provide a uniform framework for evaluating sediment quality of dredged material for unconfined aquatic disposal. Where established, SEF SLs in Table 4 are freshwater Screening Level 1 values from Table 7-1 of the SEF (revised October 20, 2006). If freshwater SLs were not available, marine SLs were used for comparison. Other SLs are also available, such as threshold effects levels, probable effects levels, and bioaccumulation screening level values. These SLs are listed with the data in Appendix D for reference.
Hart Crowser Page 6 15667-00 June 12, 2008
4.3.1 Berth 601
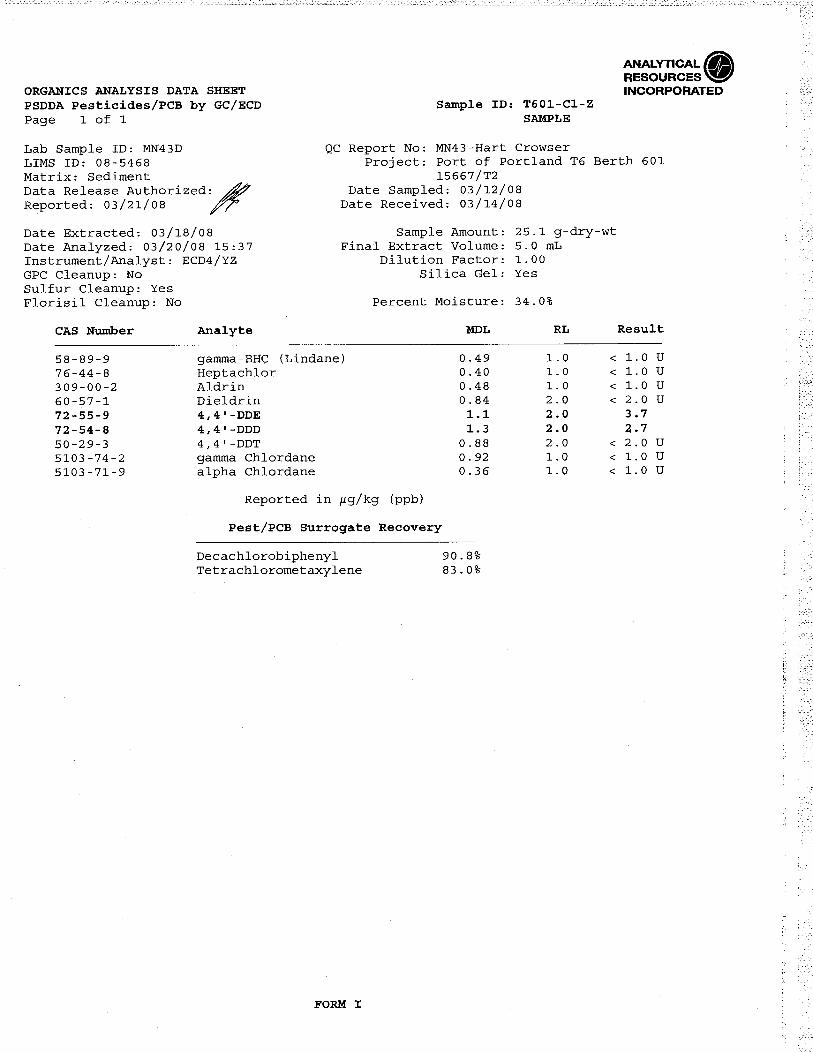
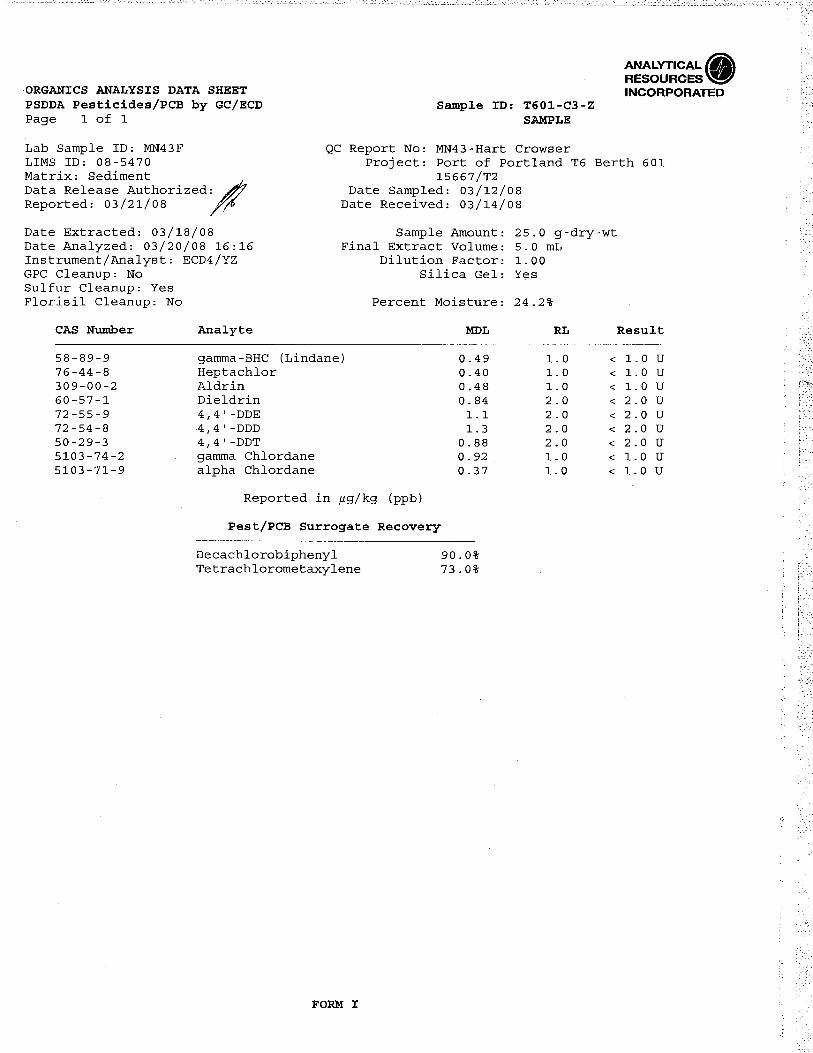
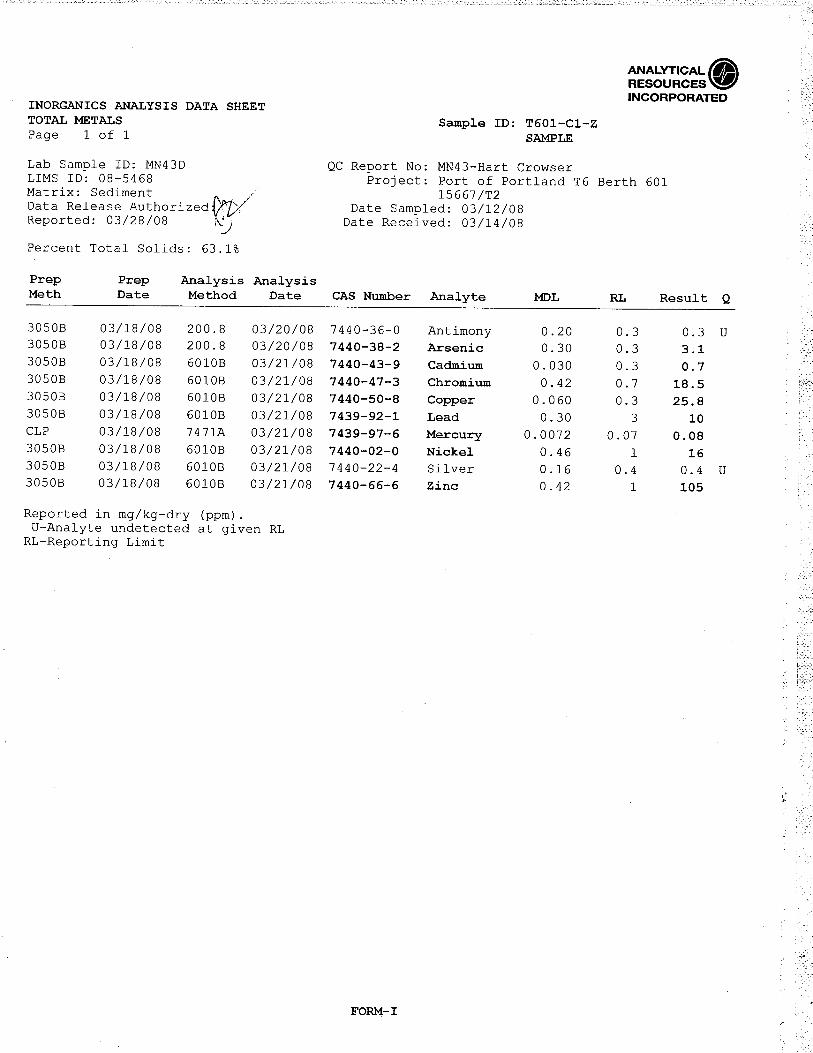
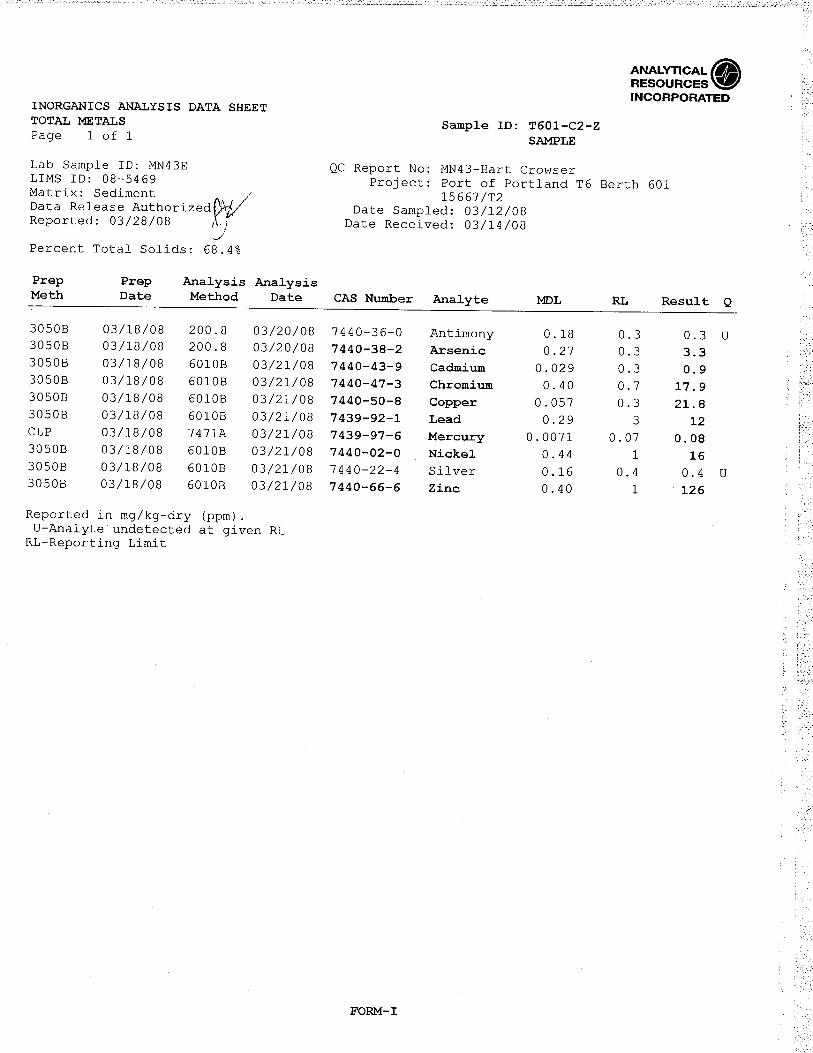
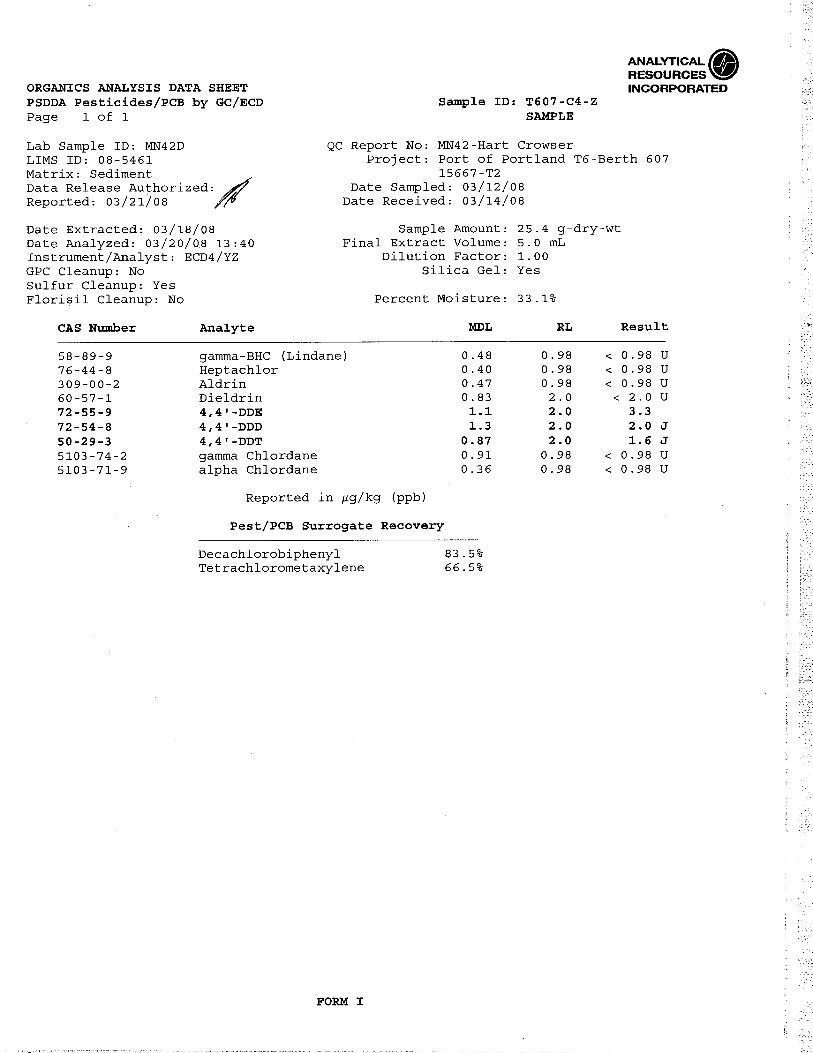
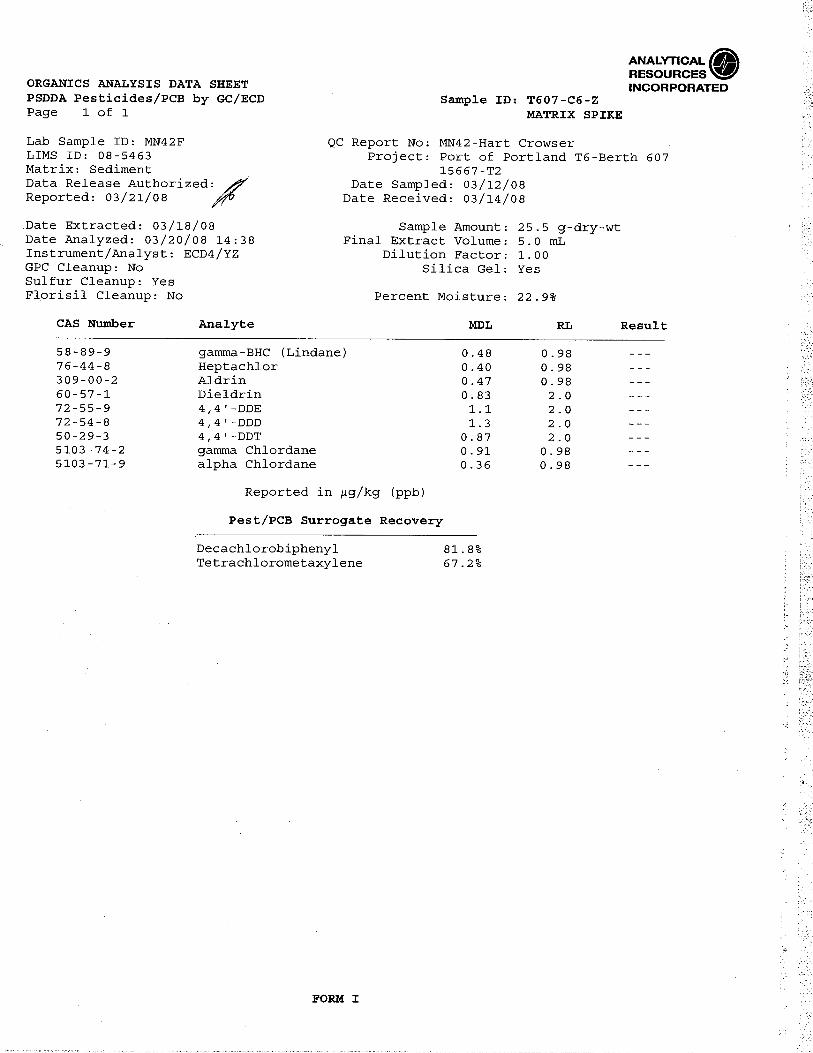
Analytical results for the dredge prism sample and three NSM samples were compared to SEF SLs in Table 4. As indicated below, all detected chemical concentrations were below SLs. Dredge Prism Sample. Analytical results for composite sample T601-MD indicate that detected concentrations of metals, TBT, SVOCs, and pesticides were below SEF SLs. PCBs were not detected. NSM Samples. Analysis of the discrete NSM samples from cores C1, C2, and C3 indicate that detected concentrations of metals, TBT, SVOCs, and pesticides were below SEF SLs. PCBs were not detected. 4.3.2 Berth 607
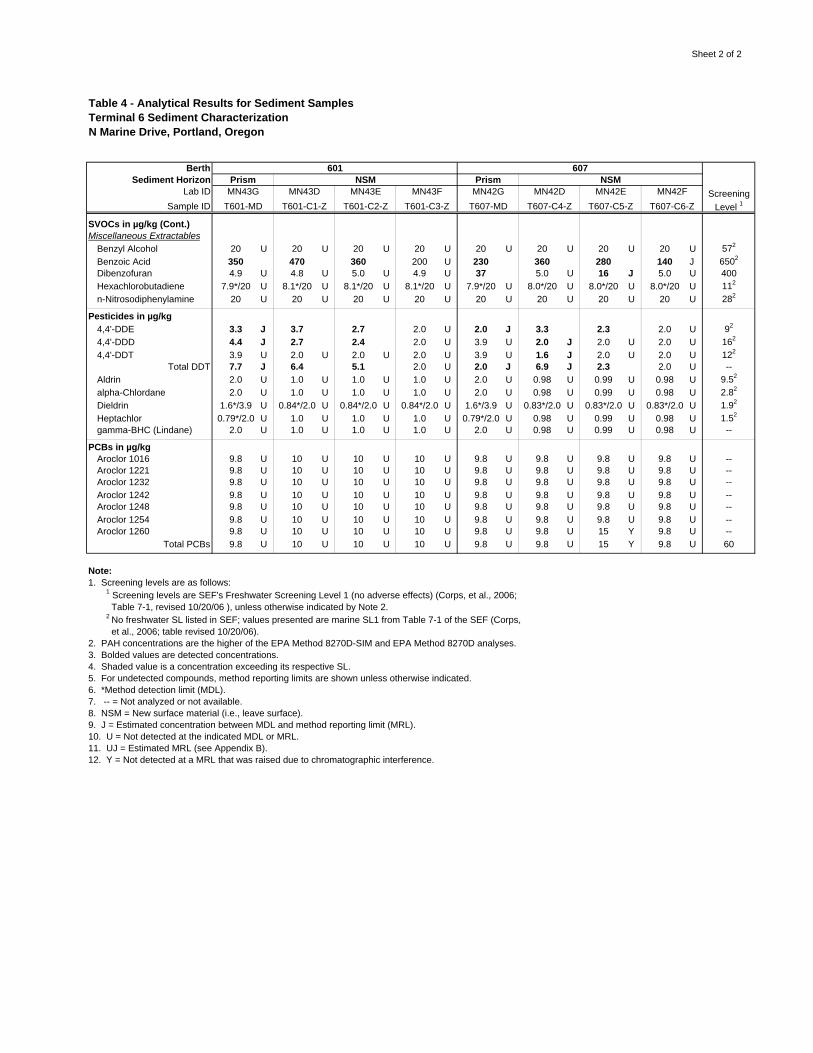
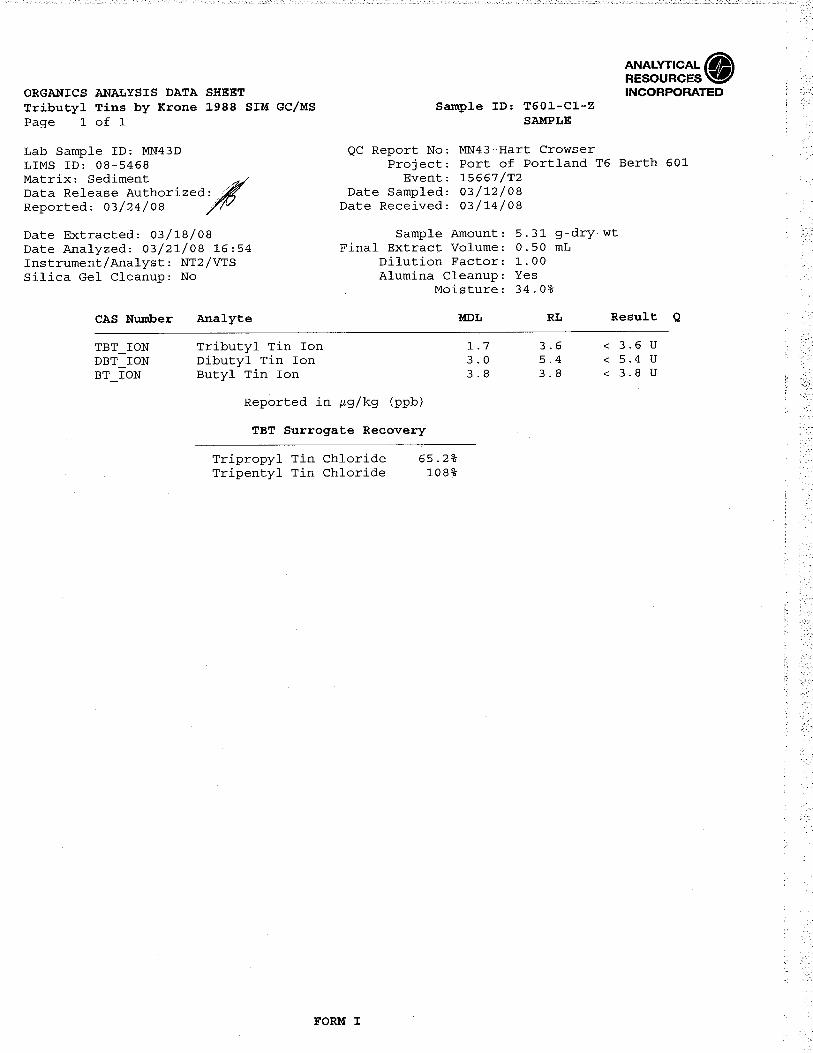
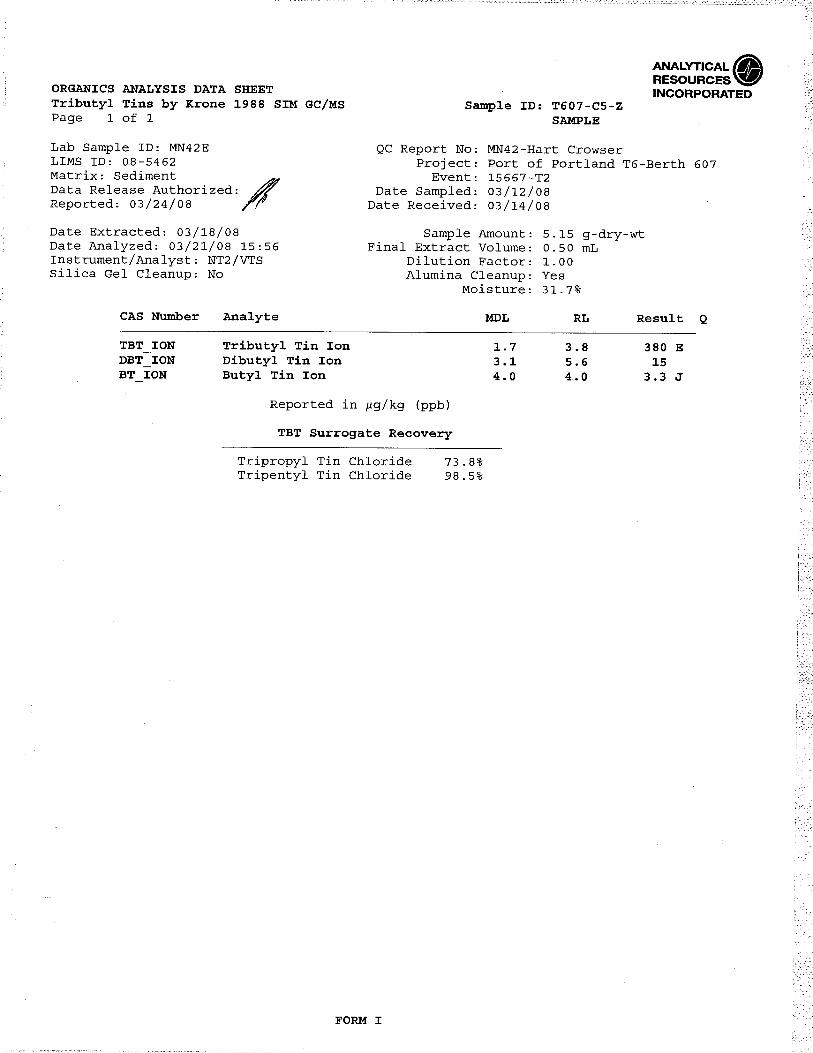
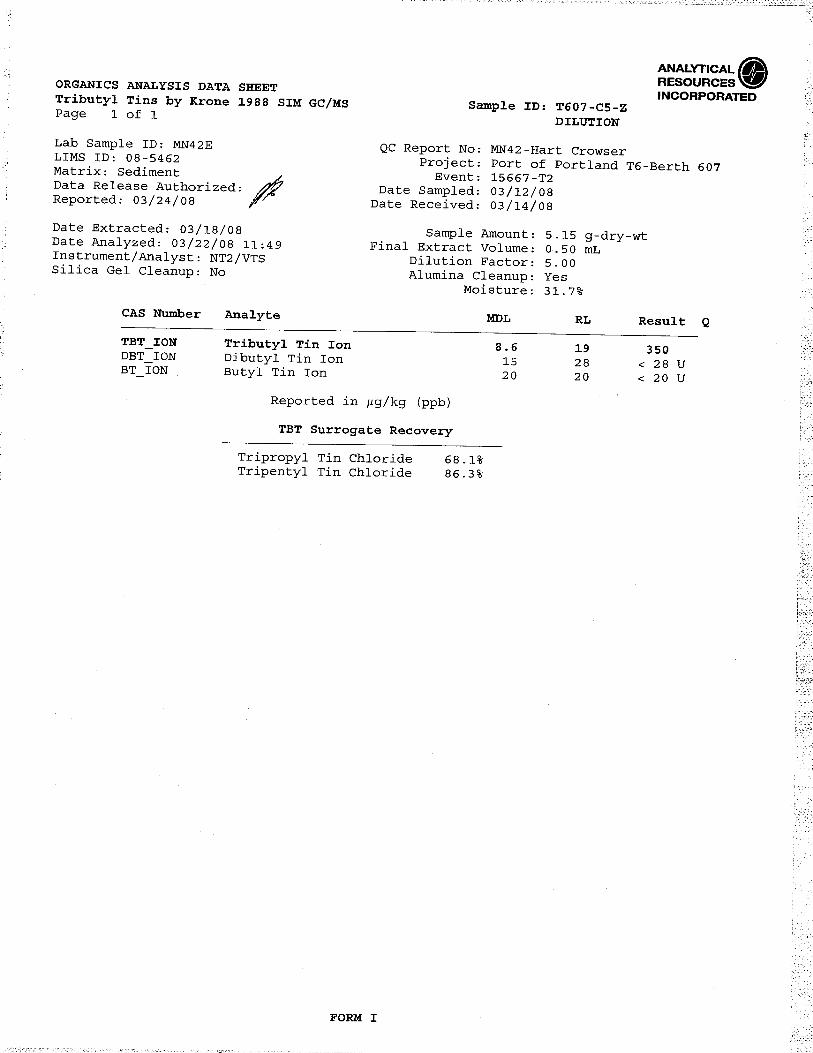
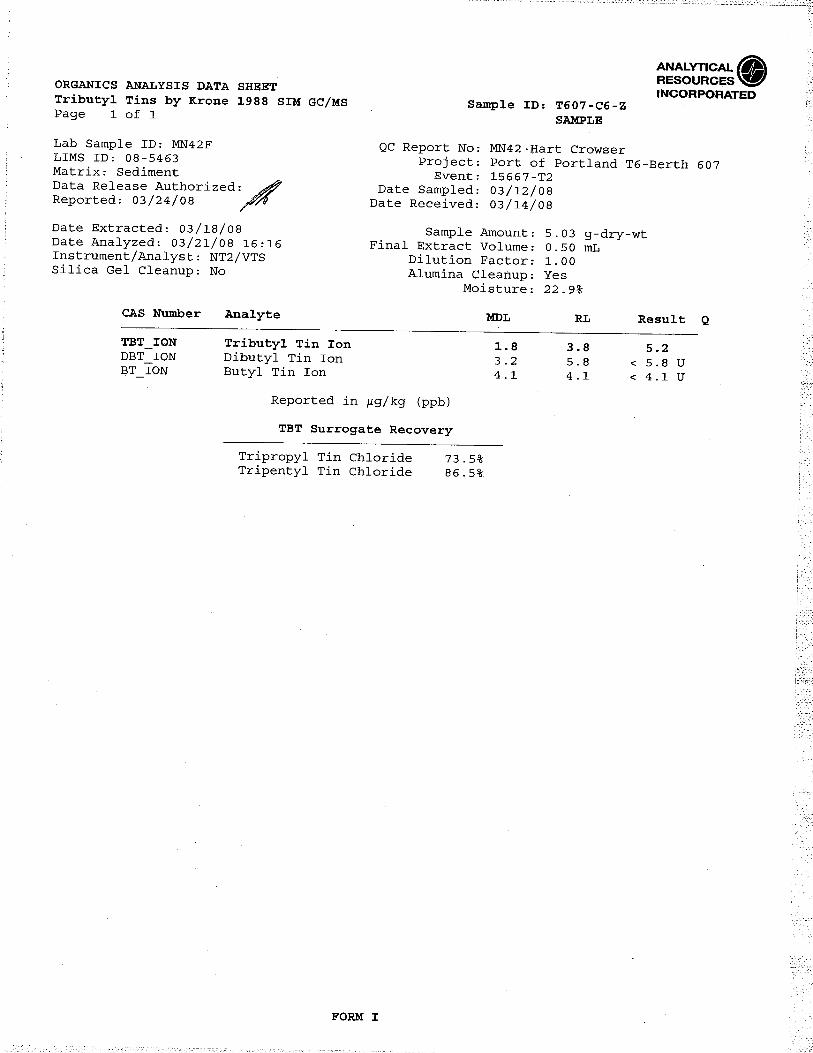
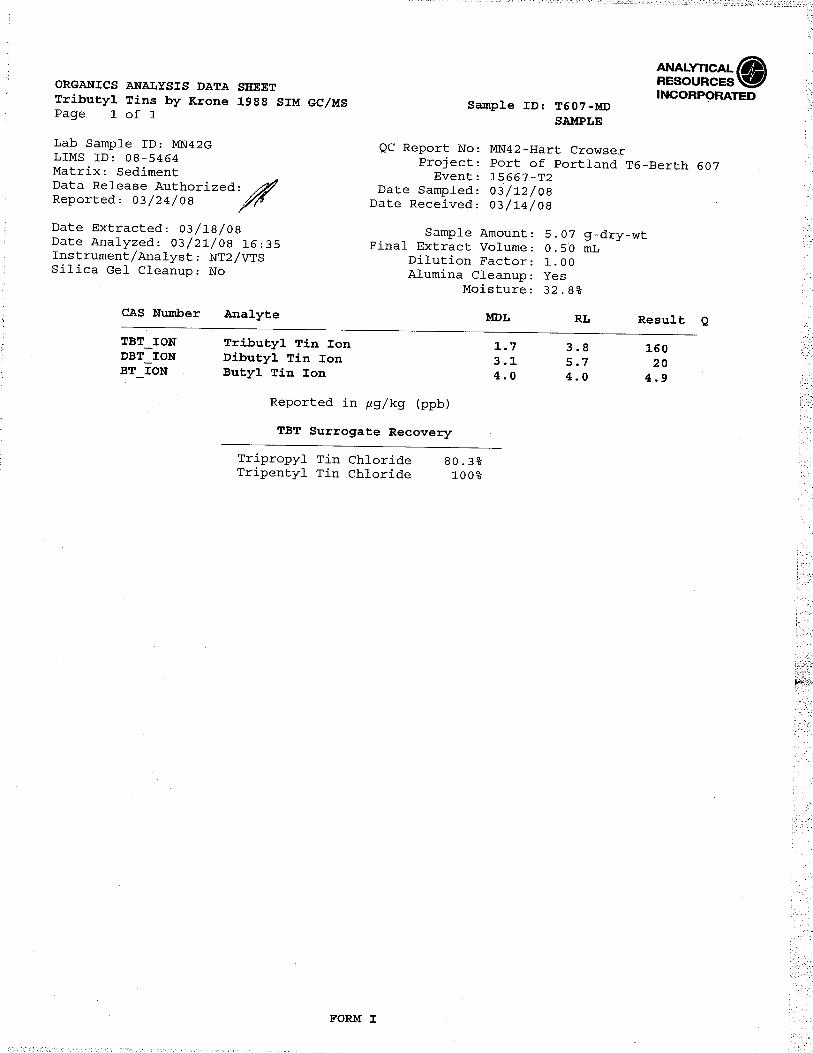
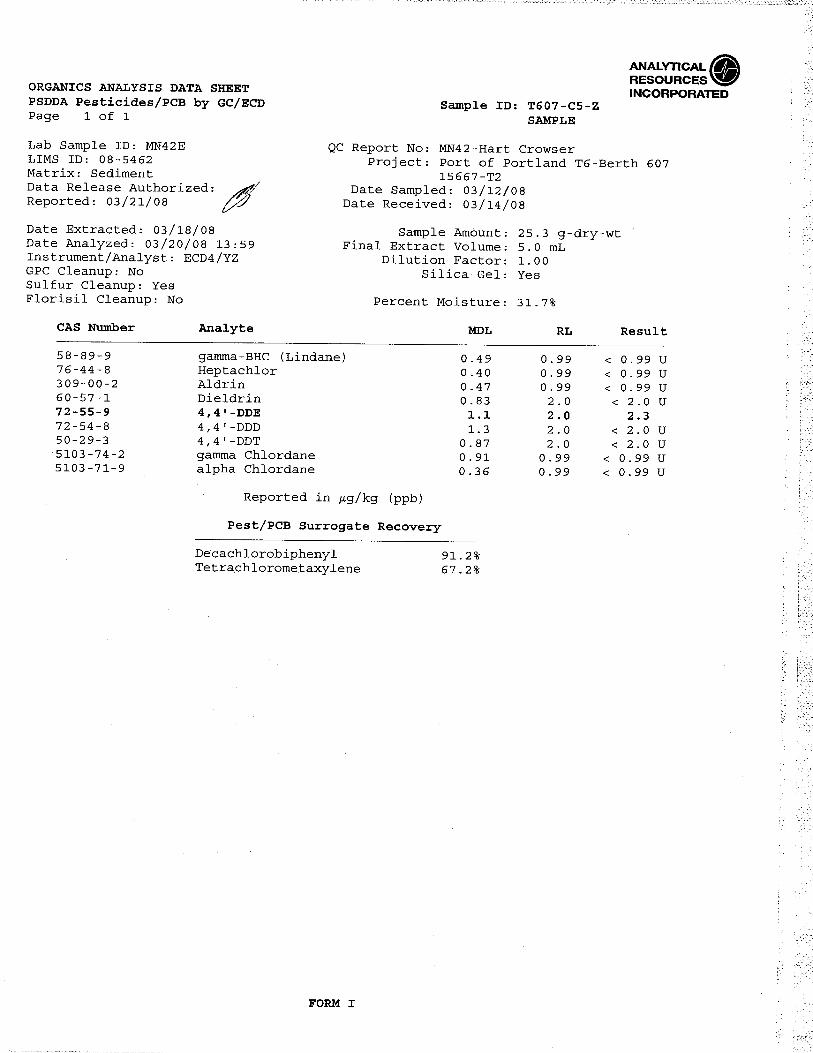
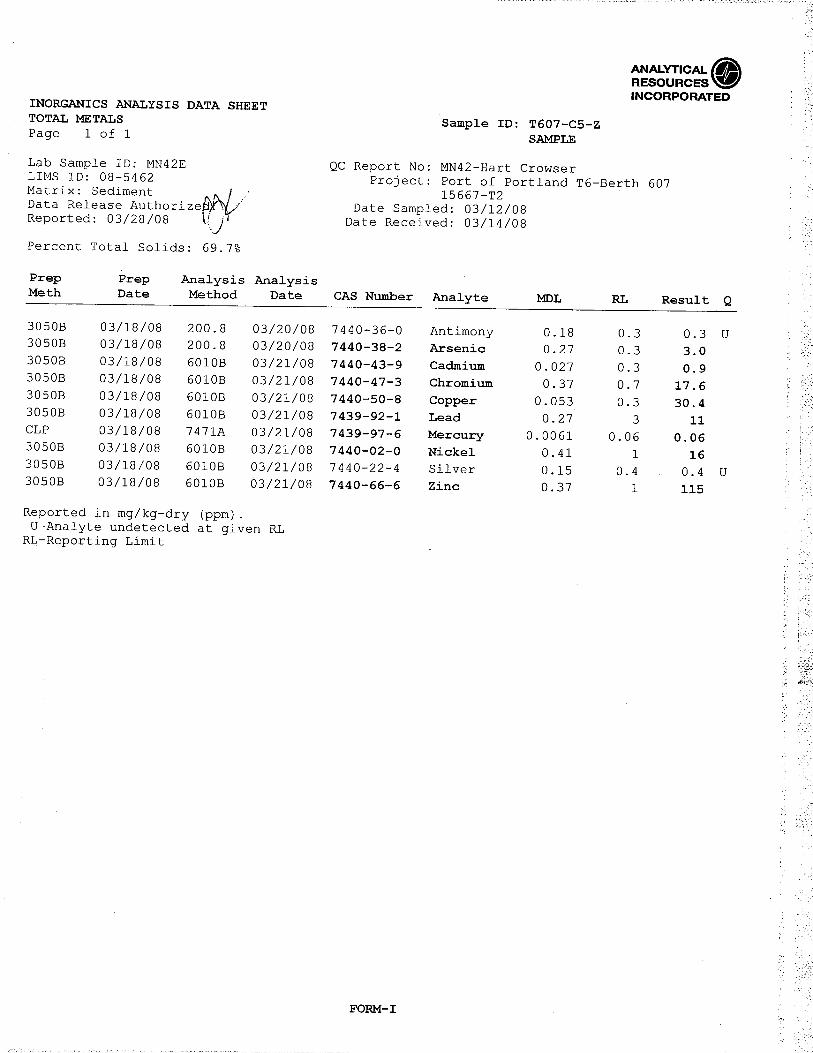
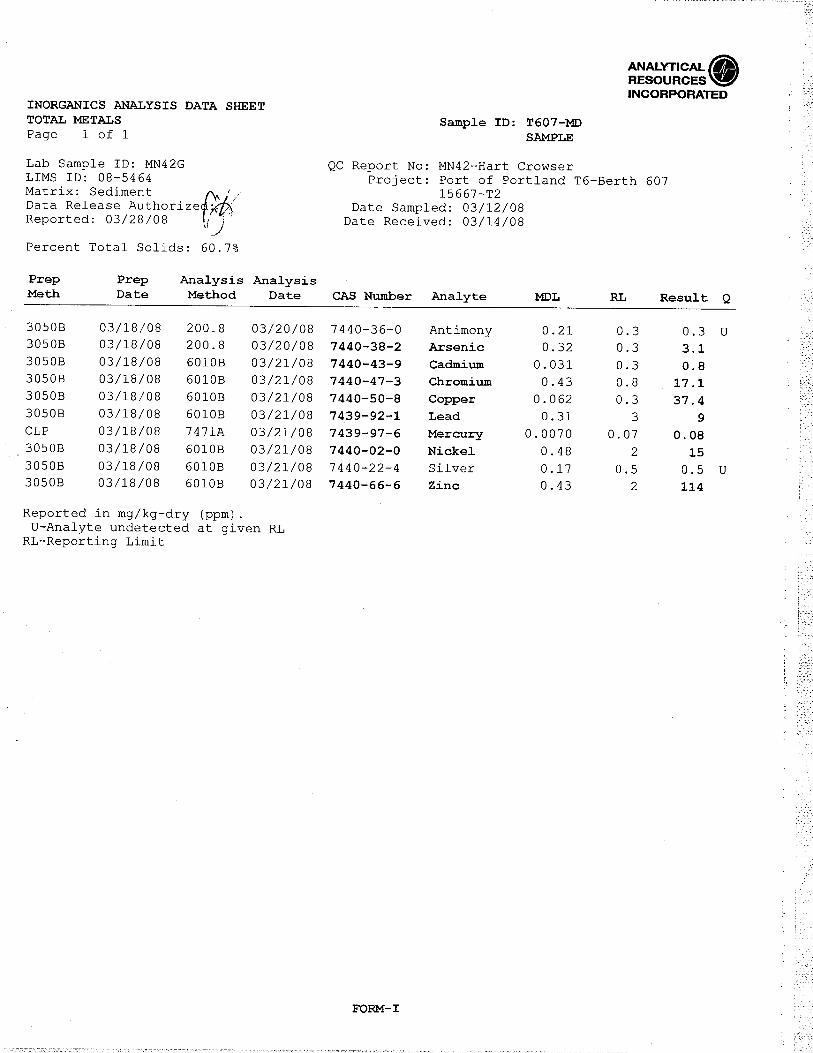
Results for the dredge prism sample and three NSM samples were compared to SEF SLs in Table 4. Detected chemical concentrations were generally below SLs, except as noted below. SL exceedances are discussed further in Section 4.4. Dredge Prism Sample. Analytical results for composite sample T607-MD indicate that detected concentrations of metals, SVOCs, and pesticides were below SEF SLs. PCBs were not detected. TBT was detected at 160 μg/kg, exceeding its freshwater SL of 75 μg/kg. NSM Samples. Analysis of the discrete NSM samples from cores C4, C5, and C6 indicate that detected concentrations of most metals, SVOCs, and pesticides, were below SEF SLs. PCBs were not detected. Two exceedances were observed: 135 mg/kg zinc in sample T607-C4-Z (SL of 130 mg/kg); and 350 μg/kg in sample T607-C5-Z (SL of 75 μg/kg).
4.4 Data Evaluation
Sediment data for Berth 601 did not exceed SEF SLs for dredge prism and NSM sediments. For Berth 607, two chemicals of concern (COCs) were detected above their SLs: zinc and TBT. Further evaluation of these two COCs is as follows. Zinc. Zinc was detected just barely above its SL 1 (130 mg/kg) in just one of the three NSM samples at a concentration of 135 mg/kg. This SL 1 represents a value at which no adverse effects are anticipated. Overall, this slight exceedance does not suggest that the NSM at Berth 607, when exposed, would pose an environmental risk due to it basically being right at the SL, that the other two NSM
Hart Crowser Page 7 15667-00 June 12, 2008
samples and the NSM average are all well below the SL, and the extremely small area affected by the proposed dredging project (approximately 15,000 square feet; Figure 3). Additionally, the detected concentration of zinc is well below its SEF SL 2 of 400 mg/kg, which represents a division between where minor versus significant adverse effects may occur.
TBT. TBT is present in antifouling paints on ships to prevent biological growth on the ships’ hulls. At berths, the presence of TBT in sediment may result from the flaking off of antifouling paint from ships, presumably when they rub against the dock. Therefore, the occurrence and magnitude of TBT in sediment depends on the proximity of the sample to the dock (including downstream) and the number of paint flakes present in the sample. Additionally, TBT slowly leaches from the painted hulls and paint flakes, and will adsorb onto suspended particles that can settle as sediment. Because TBT analysis uses only a small amount of sediment (10 grams), the resultant concentration can be variable depending on the number of paint flakes in this aliquot. To minimize this variability and provide an overall sediment concentration, sediment from the cores was homogenized prior to obtaining the sediment sample for analysis. TBT was detected above its SL 1 (75 μg/kg) in the dredge prism sample (160 μg/kg) and the NSM sample in front of the Berth 607 dock (350 μg/kg). No SL 2 value has been developed. Based on the NSM data and the above discussion regarding TBT from flaking paint, the area of exceedance is likely localized in front of the berthing dock. Considering that the dredge prism sample represents a composite of three cores, removal of the dredge prism (160 μg/kg TBT) is actually predicted to result in improvement in sediment quality along the berth, as the average concentration of the resultant NSM based on the three Berth 607 NSM samples would be 120 μg/kg.
5.0 SUMMARY
The Port is proposing to conduct maintenance dredging at Berths 601 and 607 to maintain the navigational depth clearances for vessels docking at these berths. Approximately 7,300 and 1,300 cy of sediment, respectively, will be dredged from these berths. In March 2008, three sediment cores each were collected from these berths. Composite dredge prism and discrete NSM samples were submitted for analyses per the approved SAP.
Analytical results on samples from Berth 601 showed that both dredge prism and NSM sediments are below SEF SLs. Sediment data for Berth 607 indicated two COCs exceeding SEF SLs: zinc in one NSM sample, and TBT in the dredge prism and one NSM sample. The zinc exceedance is minimal (135 mg/kg versus an SL of 130 mg/kg) and is unlikely to pose an environmental concern as discussed in
Hart Crowser Page 8 15667-00 June 12, 2008
Section 4.4. TBT concentrations are several times the SEF SL of 75 μg/kg; however, the small area affected by the proposed dredging project and the overall on average similar TBT concentrations in the dredge prism and resultant NSM do not suggest a detrimental effect to the aquatic environment would occur from the proposed dredging project.
6.0 REFERENCES
EPA, 2001. Methods for Collection, Storage, and Manipulation of Sediments for Chemical and Toxicological Analyses: Technical Manual. Office of Water. EPA-823-B-01-002, October 2001. Hart Crowser 2008. Sampling and Analysis Plan, Sediment Characterization, Terminal 6, Berths 601 and 607, Portland, Oregon. January 9, 2008. Krone, C.A., D.W. Brown, D.G. Burrows, R.G. Bogar, S.-L. Chan, and U. Varanasi, 1989. A method for analysis of butyltin species and the measurement of butyltins in sediment and English sole livers from Puget Sound. Mar. Environ. Res. 27:1-18. Plumb, Russell H., Jr., 1981. Procedures for Handling and Chemical Analysis of Sediment and Water Samples. U.S. Environmental Protection Agency/U.S. Army Corps of Engineers. May 1981. Port of Portland and ENVIRON International Corporation, 2008. U.S. Army Corps of Engineers/ Oregon Department of State Lands, Joint Permit Application, Maintenance Dredging, Marine Terminal 6, Berths 601 and 607, Lower Columbia River, Portland, Oregon. February 6, 2008. RSET, 2007. Memorandum for Portland District Regulatory, Project Review Group Draft Sediment and Analysis Plan Review for Project - NWP-2008-28 – Port of Portland Dredging of Terminal 6, Berths 601 and 607. February 22, 2008. U.S. Army Corps of Engineers, Seattle District, Portland District, Walla Walla District, and Northwestern Division; U.S. EPA, Region 10; Washington Departments of Ecology and Natural Resource; Oregon Department of Environmental Quality; Idaho Department of Environmental Quality; National Marine Fisheries Service; and U.S., Fish and Wildlife Service, 2006. Northwest Region Sediment Evaluation Framework, Interim Final. September 2006.
Hart Crowser Page 9 15667-00 June 12, 2008
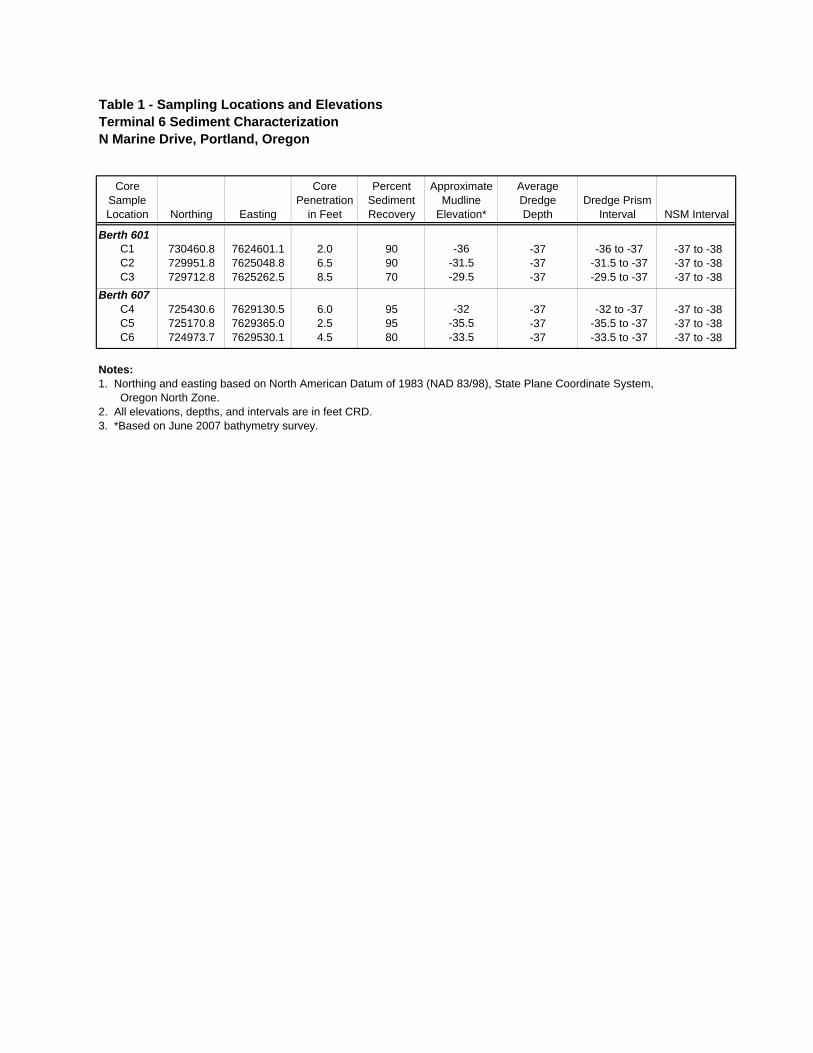
Table 1 - Sampling Locations and Elevations Terminal 6 Sediment CharacterizationN Marine Drive, Portland, Oregon
Core Sample Location Northing Easting
Core Penetration
in Feet
Percent Sediment Recovery
Approximate Mudline
Elevation*
AverageDredgeDepth
Dredge Prism Interval NSM Interval
Berth 601C1 730460.8 7624601.1 2.0 90 -36 -37 -36 to -37 -37 to -38C2 729951.8 7625048.8 6.5 90 -31.5 -37 -31.5 to -37 -37 to -38C3 729712.8 7625262.5 8.5 70 -29.5 -37 -29.5 to -37 -37 to -38
Berth 607C4 725430.6 7629130.5 6.0 95 -32 -37 -32 to -37 -37 to -38C5 725170.8 7629365.0 2.5 95 -35.5 -37 -35.5 to -37 -37 to -38C6 724973.7 7629530.1 4.5 80 -33.5 -37 -33.5 to -37 -37 to -38
Notes:1. Northing and easting based on North American Datum of 1983 (NAD 83/98), State Plane Coordinate System, Oregon North Zone.2. All elevations, depths, and intervals are in feet CRD.3. *Based on June 2007 bathymetry survey.
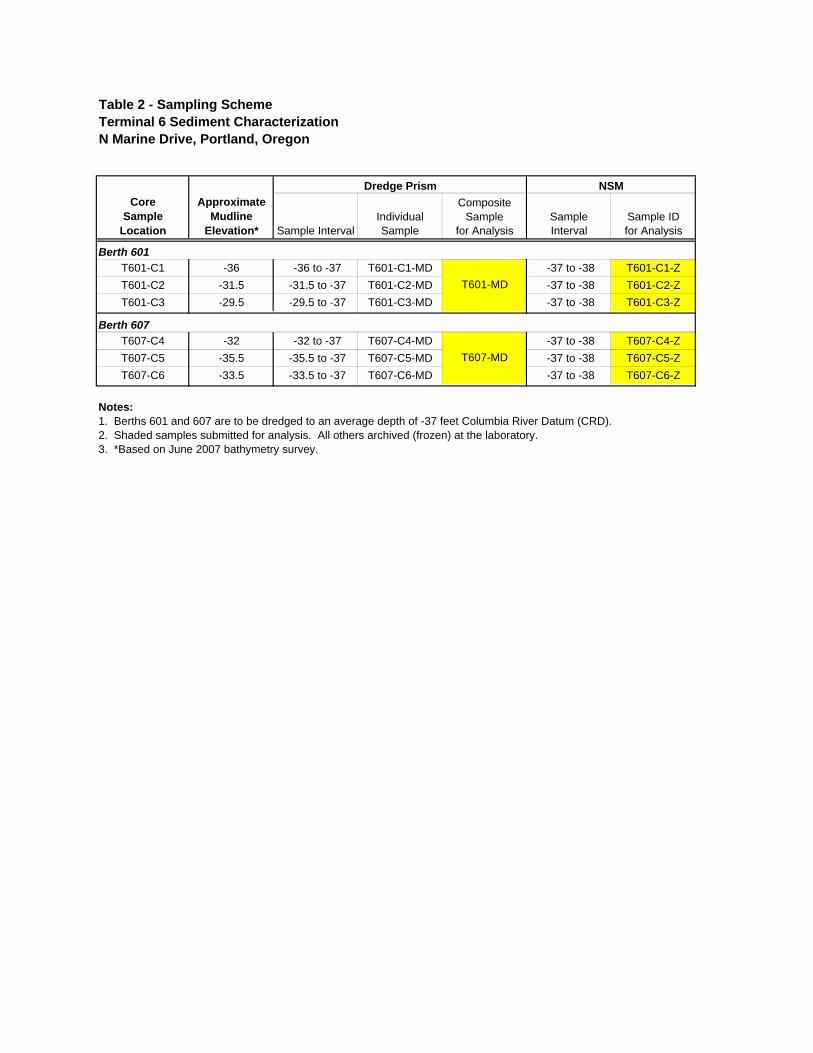
Table 2 - Sampling SchemeTerminal 6 Sediment CharacterizationN Marine Drive, Portland, Oregon
Dredge Prism NSMCore
SampleLocation
Approximate Mudline
Elevation* Sample IntervalIndividualSample
Composite Sample
for AnalysisSampleInterval
Sample IDfor Analysis
Berth 601T601-C1 -36 -36 to -37 T601-C1-MD -37 to -38 T601-C1-ZT601-C2 -31.5 -31.5 to -37 T601-C2-MD -37 to -38 T601-C2-ZT601-C3 -29.5 -29.5 to -37 T601-C3-MD -37 to -38 T601-C3-Z
Berth 607T607-C4 -32 -32 to -37 T607-C4-MD -37 to -38 T607-C4-ZT607-C5 -35.5 -35.5 to -37 T607-C5-MD -37 to -38 T607-C5-ZT607-C6 -33.5 -33.5 to -37 T607-C6-MD -37 to -38 T607-C6-Z
Notes:1. Berths 601 and 607 are to be dredged to an average depth of -37 feet Columbia River Datum (CRD).2. Shaded samples submitted for analysis. All others archived (frozen) at the laboratory.3. *Based on June 2007 bathymetry survey.
T607-MD
T601-MD
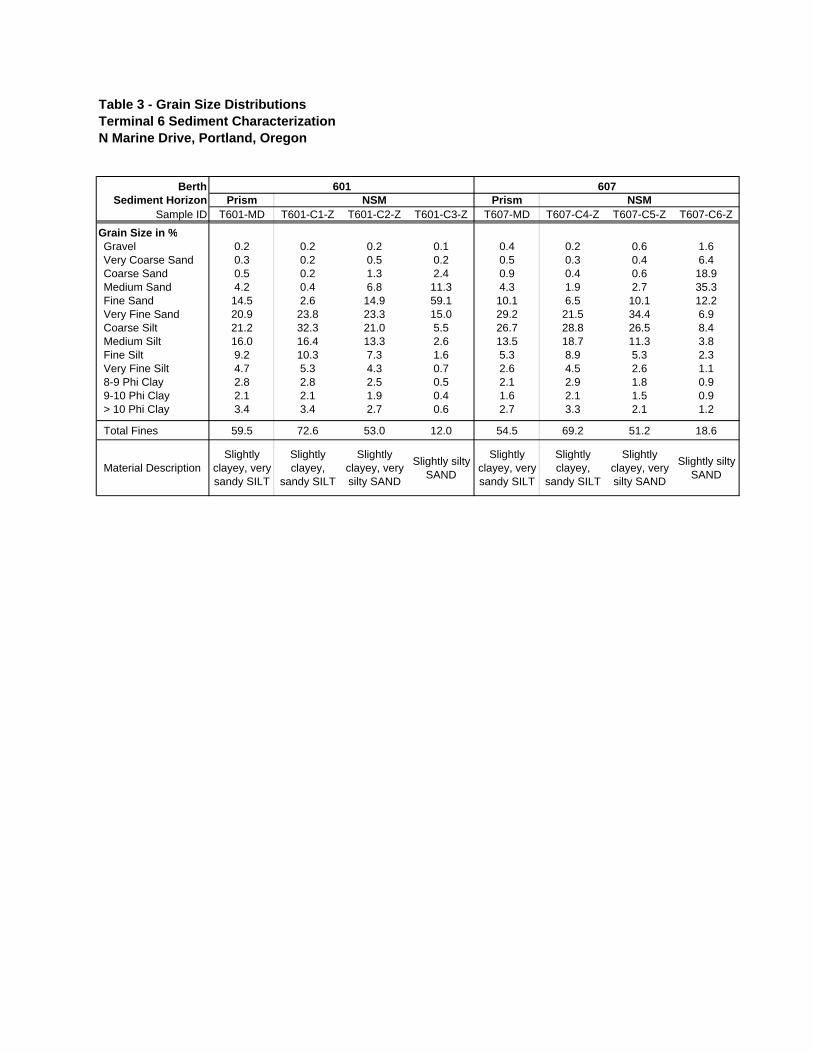
Table 3 - Grain Size DistributionsTerminal 6 Sediment CharacterizationN Marine Drive, Portland, Oregon
Berth 601 607Sediment Horizon Prism NSM Prism NSM
Sample ID T601-MD T601-C1-Z T601-C2-Z T601-C3-Z T607-MD T607-C4-Z T607-C5-Z T607-C6-Z
Grain Size in %Gravel 0.2 0.2 0.2 0.1 0.4 0.2 0.6 1.6Very Coarse Sand 0.3 0.2 0.5 0.2 0.5 0.3 0.4 6.4Coarse Sand 0.5 0.2 1.3 2.4 0.9 0.4 0.6 18.9Medium Sand 4.2 0.4 6.8 11.3 4.3 1.9 2.7 35.3Fine Sand 14.5 2.6 14.9 59.1 10.1 6.5 10.1 12.2Very Fine Sand 20.9 23.8 23.3 15.0 29.2 21.5 34.4 6.9Coarse Silt 21.2 32.3 21.0 5.5 26.7 28.8 26.5 8.4Medium Silt 16.0 16.4 13.3 2.6 13.5 18.7 11.3 3.8Fine Silt 9.2 10.3 7.3 1.6 5.3 8.9 5.3 2.3Very Fine Silt 4.7 5.3 4.3 0.7 2.6 4.5 2.6 1.18-9 Phi Clay 2.8 2.8 2.5 0.5 2.1 2.9 1.8 0.99-10 Phi Clay 2.1 2.1 1.9 0.4 1.6 2.1 1.5 0.9> 10 Phi Clay 3.4 3.4 2.7 0.6 2.7 3.3 2.1 1.2
Total Fines 59.5 72.6 53.0 12.0 54.5 69.2 51.2 18.6
Material DescriptionSlightly
clayey, very sandy SILT
Slightly clayey,
sandy SILT
Slightly clayey, very silty SAND
Slightly silty SAND
Slightly clayey, very sandy SILT
Slightly clayey,
sandy SILT
Slightly clayey, very silty SAND
Slightly silty SAND
Sheet 1 of 2
Table 4 - Analytical Results for Sediment Samples Terminal 6 Sediment CharacterizationN Marine Drive, Portland, Oregon
BerthSediment Horizon
Lab IDSample ID
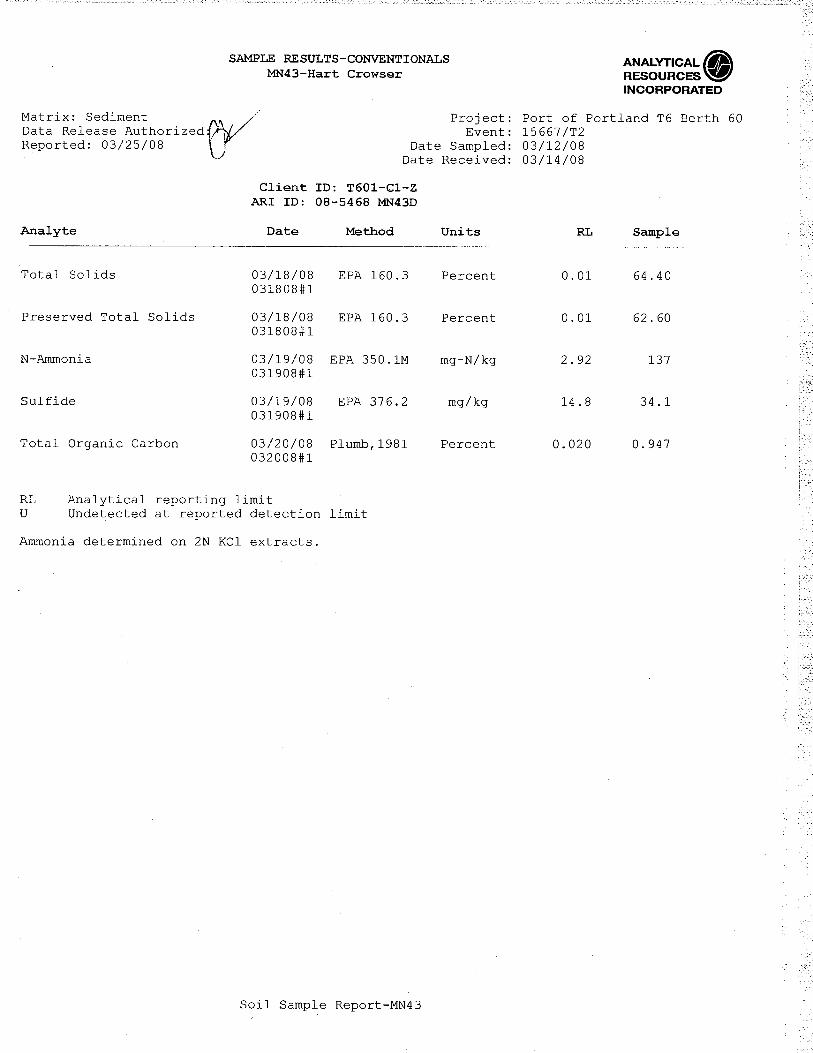
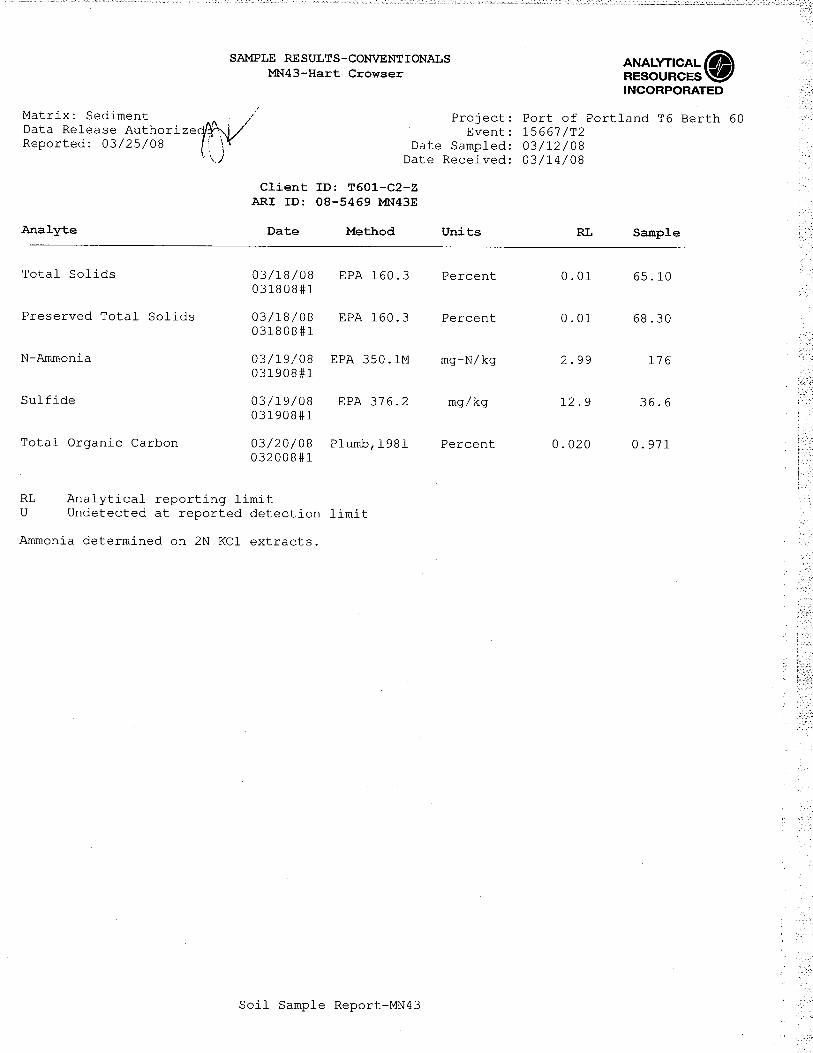
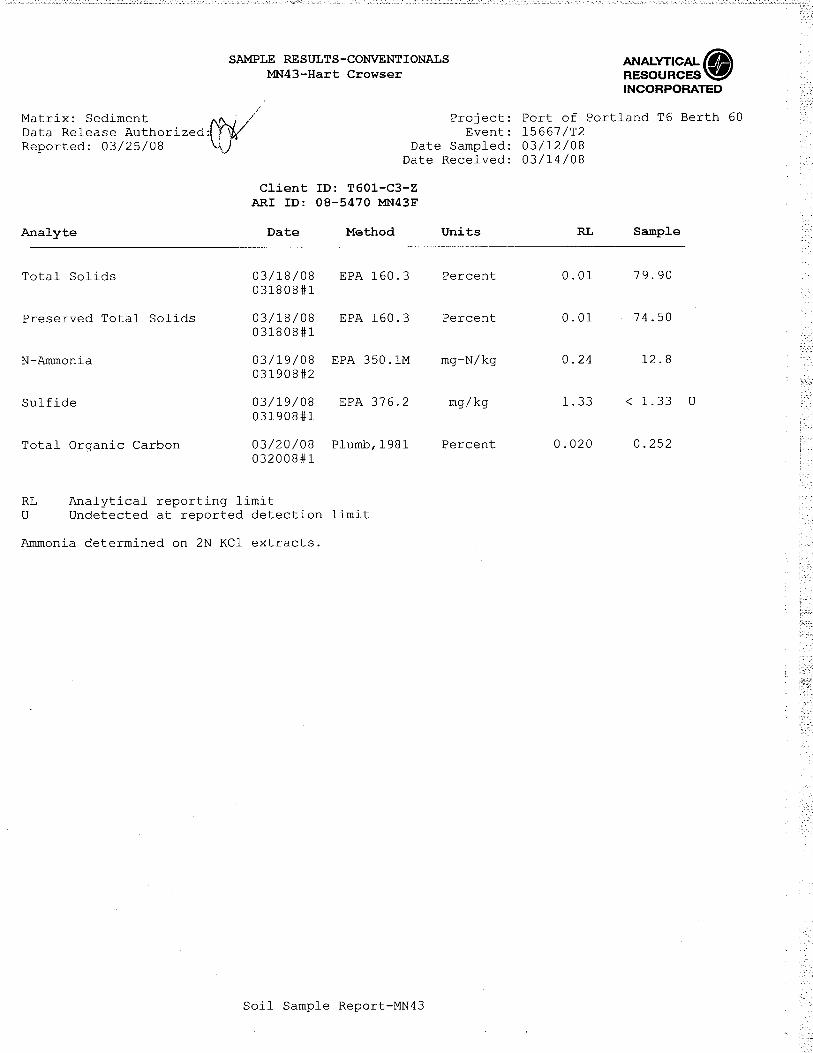
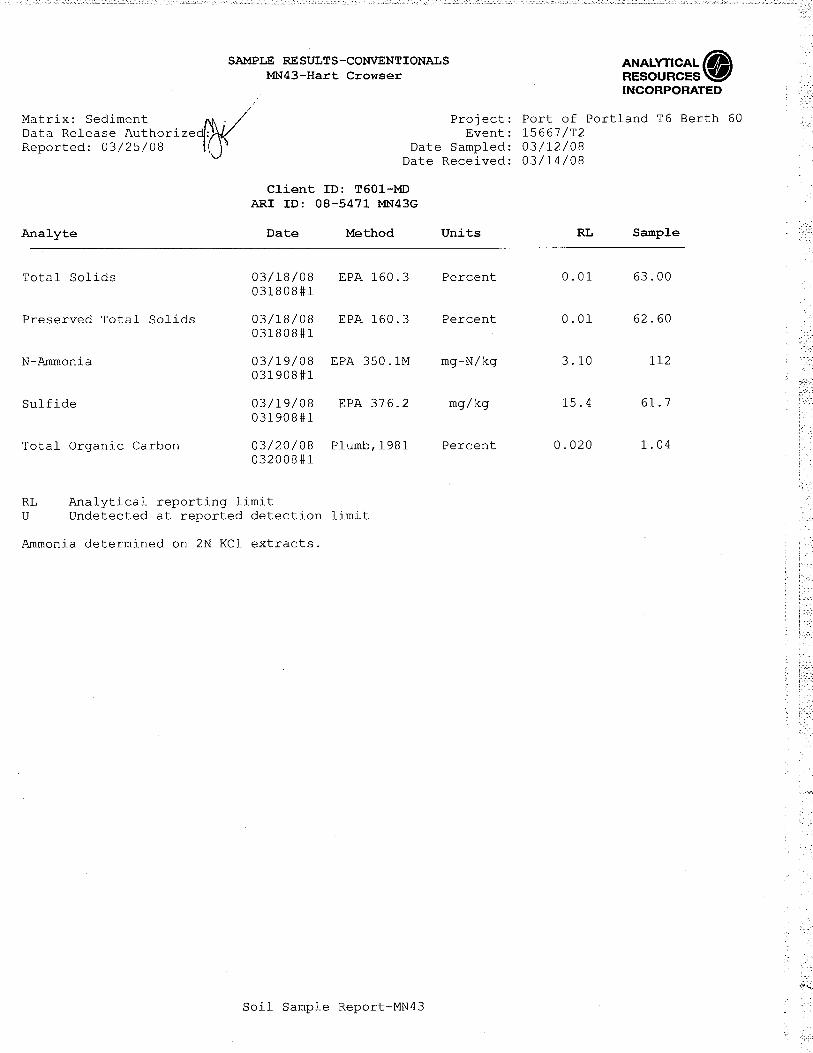
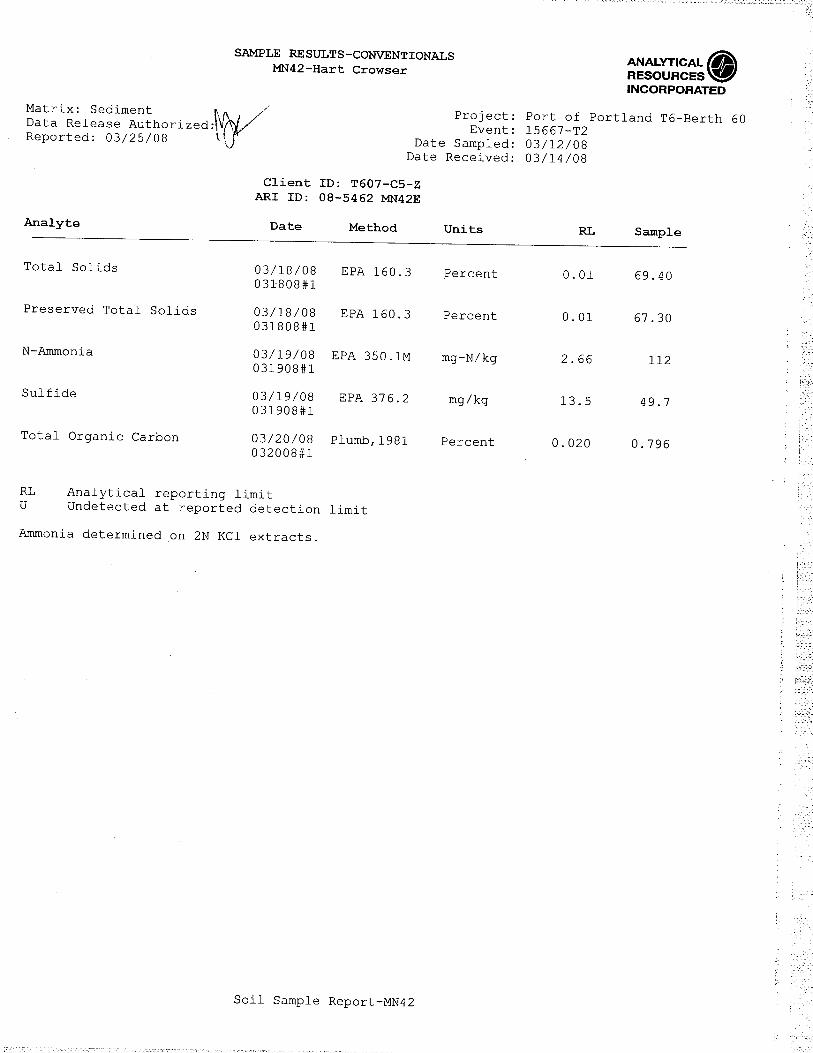
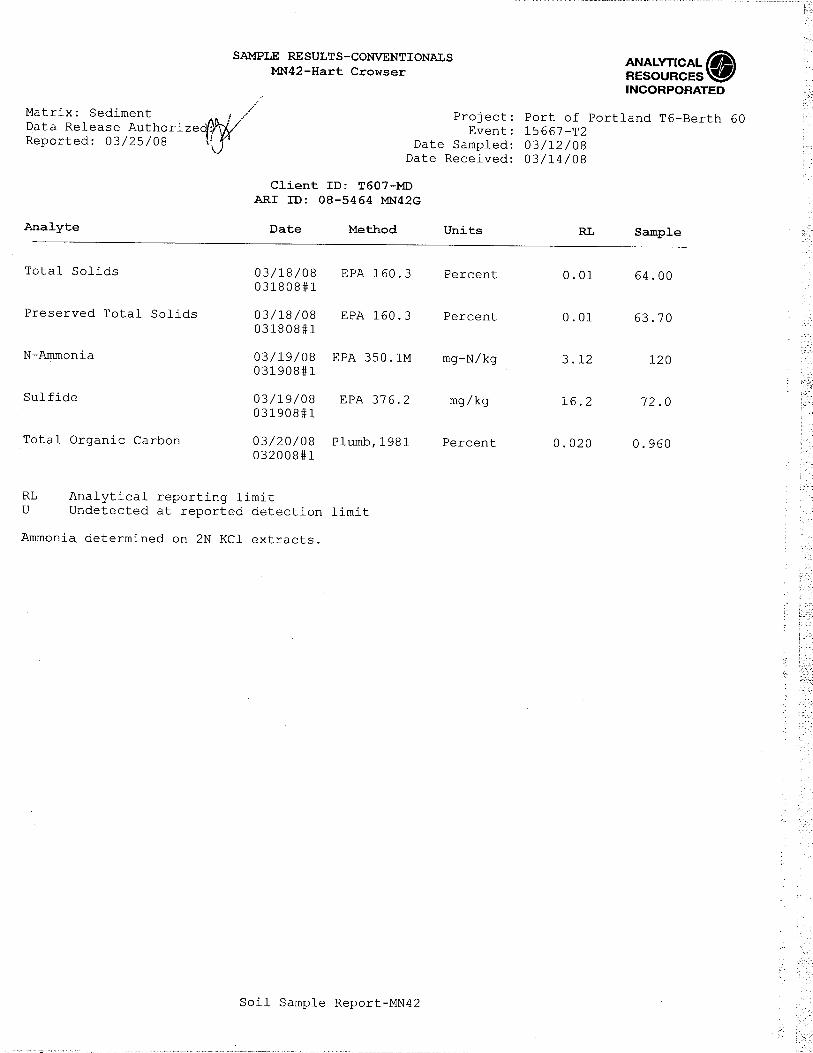
Conventional ParametersTotal Solids (%) 63 64.4 65.1 79.9 64 65.7 69.4 80.1 --Total Organic Carbon (%) 1.04 0.947 0.971 0.252 0.96 1.02 0.796 0.941 --Ammonia (mg/kg) 112 137 176 12.8 120 179 112 25.8 --Total Sulfides (mg/kg) 61.7 34.1 36.6 1.33 U 72 56.8 49.7 20.3 --
Metals in mg/kgAntimony 0.3 UJ 0.3 UJ 0.3 UJ 0.3 UJ 0.3 UJ 0.3 UJ 0.3 UJ 0.3 UJ 1502
Arsenic 3.1 3.1 3.3 1.5 3.1 3.8 3.0 1.4 20Cadmium 0.8 0.7 0.9 0.3 U 0.8 0.9 0.9 0.4 1.1Chromium 18.7 18.5 17.9 15.0 17.1 18.9 17.6 11.8 95Copper 24.7 25.8 21.8 10.4 37.4 27.5 30.4 13.7 80Lead 10 10 12 4 9 12 11 5 340Mercury 0.09 0.08 0.08 0.05 U 0.08 0.08 0.06 0.05 U 0.28Nickel 16 16 16 13 15 17 16 10 60Silver 0.5 U 0.4 U 0.4 U 0.4 U 0.5 U 0.4 U 0.4 U 0.4 U 2.0Zinc 115 105 126 49 114 135 115 56 130
Butyltins in µg/kgTributyltin (TBT) Dry Weight 2.3 J 3.6 U 3.3 J 3.6 U 160 4.5 350 5.2 75
SVOCs in µg/kg LPAHs
Naphthalene 4.9 U 4.8 U 5 U 4.9 U 5 U 5 U 4.8 U 5 U 500Acenaphthylene 4.9 U 4.8 U 5 U 4.9 U 5 U 5 U 4.8 U 5 U 470Acenaphthene 4.9 U 4.8 U 5 U 4.9 U 100 32 32 30 1,100Fluorene 4.9 U 4.8 U 5 U 4.9 U 95 13 34 11 J 1,000Phenanthrene 7.4 20 29 4.9 U 270 66 330 61 6,100Anthracene 4.9 U 4.8 U 5 U 4.9 U 50 7.9 41 5 U 1,2002-Methylnaphthalene 4.9 U 4.8 U 5 U 4.9 U 5.9 5 U 4.8 U 5 U 470
Total LPAHs 7.4 20 29 4.9 U 521 119 437 102 6,600
HPAHs Fluoranthene 29 21 47 4.9 U 210 96 490 51 11,000Pyrene 27 22 42 4.9 U 200 78 360 44 8,800Benzo(a)anthracene 8.8 8.2 17 4.9 U 72 45 120 12 4,300Chrysene 22 13 32 4.9 U 120 77 120 10 5,900Benzo(b)fluoranthene 20 11 27 4.9 U 51 40 89 14 --Benzo(k)fluoranthene 16 J 11 24 4.9 U 85 54 97 5 U --Benzo(b+k)fluoranthenes 36 22 51 4.9 U 136 94 186 14 600Benzo(a)pyrene 9.8 9.7 23 4.9 U 60 36 81 7.5 3,300Indeno(1,2,3-cd)pyrene 5.9 5.3 12 4.9 U 27 28 46 5 U 4,100Dibenz(a,h)anthracene 4.9 U 4.8 U 5 U 4.9 U 7.9 5 U 13 J 5 U 800Benzo(g,h,i)perylene 6.9 7.3 14 4.9 U 25 23 36 5 U 4,000
Total HPAHs 145 109 238 4.9 U 858 477 1452 139 31,000Chlorinated Hydrocarbons
1,4-Dichlorobenzene 20 U 20 U 20 U 20 U 20 U 20 U 20 U 20 U 1102
1,2-Dichlorobenzene 20 U 20 U 20 U 20 U 20 U 20 U 20 U 20 U 352
1,2,4-Trichlorobenzene 20 U 20 U 20 U 20 U 20 U 20 U 20 U 20 U 312
Hexachlorobenzene 20 U 20 U 20 U 20 U 20 U 20 U 20 U 20 U 222
PhthalatesDimethyl Phthalate 20 U 20 U 20 U 20 U 20 U 20 U 20 U 20 U 46Diethyl Phthalate 20 U 20 U 20 U 20 U 20 U 76 20 U 20 U 2002
Di-n-butyl Phthalate 20 U 20 U 20 U 20 U 20 U 20 U 20 U 20 U 1,4002
Butyl Benzyl Phthalate 20 U 20 U 20 U 20 U 20 U 20 U 20 U 20 U 260Bis(2-ethylhexyl) Phthalate 23 13 J 15 J 20 76 23 32 12 J 220Di-n-octyl Phthalate 20 U 20 U 20 U 20 U 20 U 20 U 20 U 20 U 26
PhenolsPhenol 29 40 40 20 U 20 U 30 20 U 20 U 4202
2-Methylphenol 20 U 20 U 20 U 20 U 20 U 20 U 20 U 20 U 632
4-Methylphenol 20 U 20 U 20 U 20 U 20 U 20 U 20 U 20 U 6702
2,4-Dimethylphenol 20 U 20 U 20 U 20 U 20 U 20 U 20 U 20 U 292
Pentachlorophenol (PCP) 98 U 100 U 100 U 100 U 98 U 98 U 99 U 98 U 4002
Please refer to notes on the last page of this table.
T601-C3-Z T607-C6-ZT607-C5-ZT607-C4-ZT607-MDMN42G MN42D MN42E MN42FMN43G MN43D MN43E MN43F Screening
Level 1
601 607NSM NSMPrism Prism
T601-C2-ZT601-C1-ZT601-MD
Sheet 2 of 2
Table 4 - Analytical Results for Sediment Samples Terminal 6 Sediment CharacterizationN Marine Drive, Portland, Oregon
BerthSediment Horizon
Lab IDSample ID
SVOCs in µg/kg (Cont.)Miscellaneous Extractables
Benzyl Alcohol 20 U 20 U 20 U 20 U 20 U 20 U 20 U 20 U 572
Benzoic Acid 350 470 360 200 U 230 360 280 140 J 6502
Dibenzofuran 4.9 U 4.8 U 5.0 U 4.9 U 37 5.0 U 16 J 5.0 U 400Hexachlorobutadiene 7.9*/20 U 8.1*/20 U 8.1*/20 U 8.1*/20 U 7.9*/20 U 8.0*/20 U 8.0*/20 U 8.0*/20 U 112
n-Nitrosodiphenylamine 20 U 20 U 20 U 20 U 20 U 20 U 20 U 20 U 282
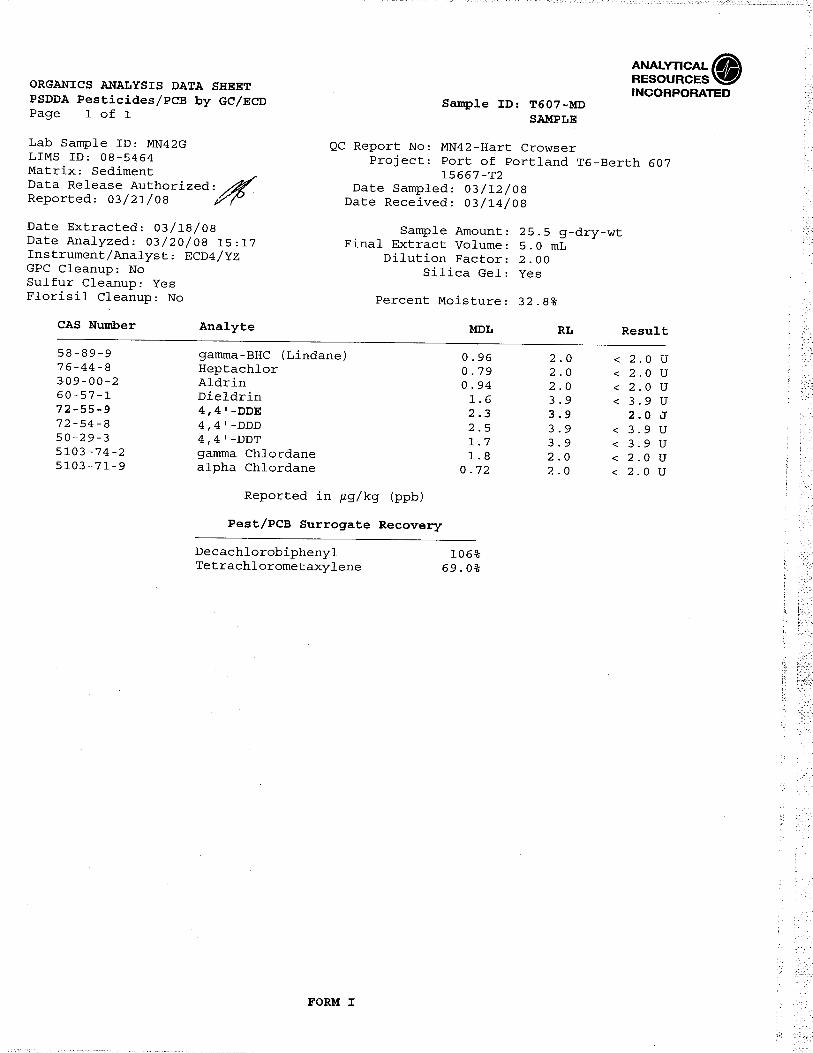
Pesticides in µg/kg4,4'-DDE 3.3 J 3.7 2.7 2.0 U 2.0 J 3.3 2.3 2.0 U 92
4,4'-DDD 4.4 J 2.7 2.4 2.0 U 3.9 U 2.0 J 2.0 U 2.0 U 162
4,4'-DDT 3.9 U 2.0 U 2.0 U 2.0 U 3.9 U 1.6 J 2.0 U 2.0 U 122
Total DDT 7.7 J 6.4 5.1 2.0 U 2.0 J 6.9 J 2.3 2.0 U --Aldrin 2.0 U 1.0 U 1.0 U 1.0 U 2.0 U 0.98 U 0.99 U 0.98 U 9.52
alpha-Chlordane 2.0 U 1.0 U 1.0 U 1.0 U 2.0 U 0.98 U 0.99 U 0.98 U 2.82
Dieldrin 1.6*/3.9 U 0.84*/2.0 U 0.84*/2.0 U 0.84*/2.0 U 1.6*/3.9 U 0.83*/2.0 U 0.83*/2.0 U 0.83*/2.0 U 1.92
Heptachlor 0.79*/2.0 U 1.0 U 1.0 U 1.0 U 0.79*/2.0 U 0.98 U 0.99 U 0.98 U 1.52
gamma-BHC (Lindane) 2.0 U 1.0 U 1.0 U 1.0 U 2.0 U 0.98 U 0.99 U 0.98 U --
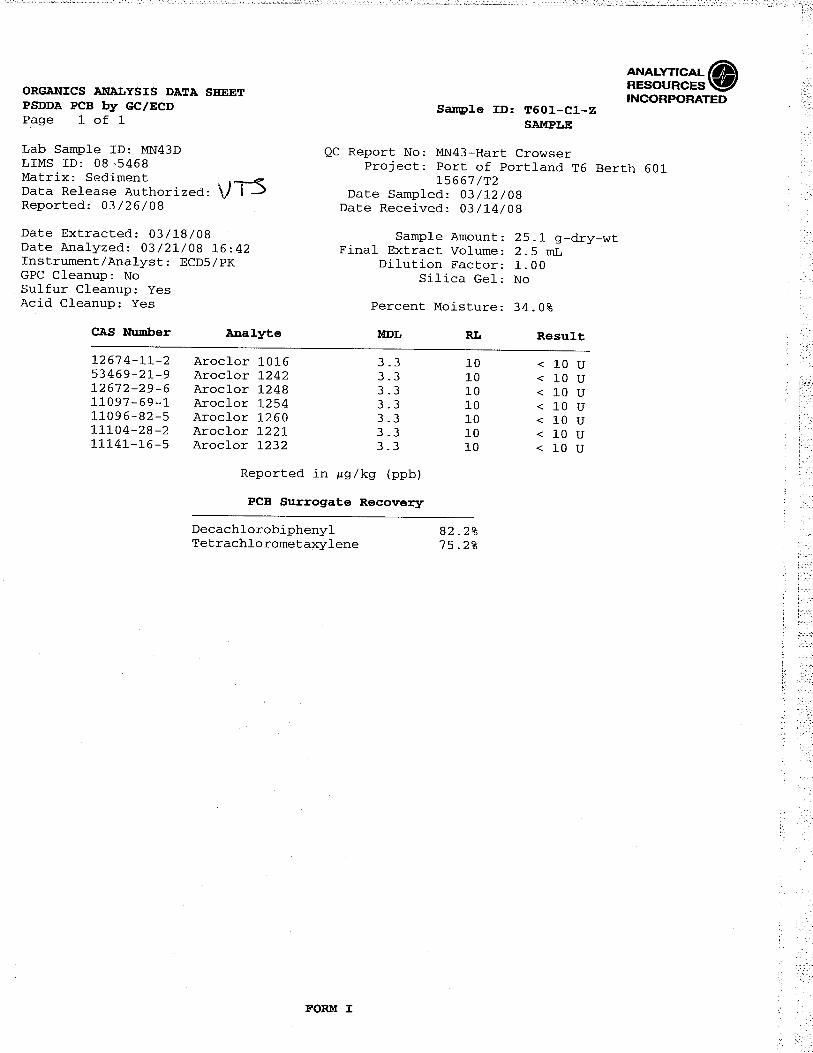
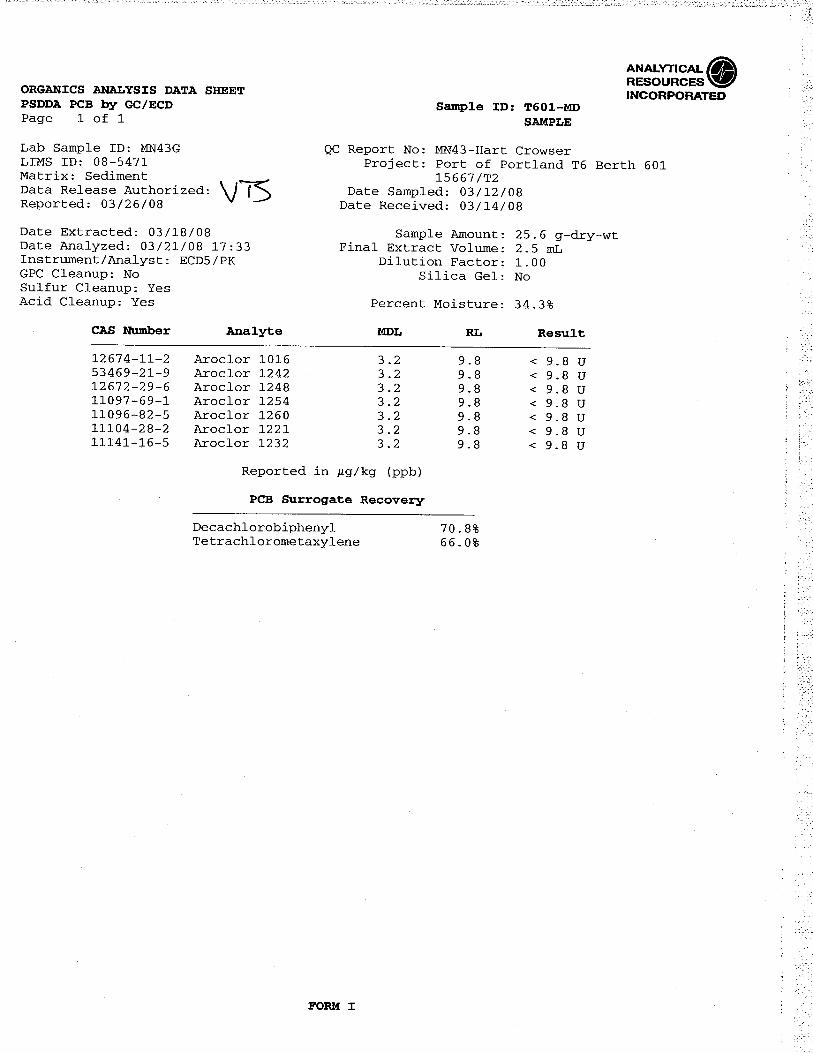
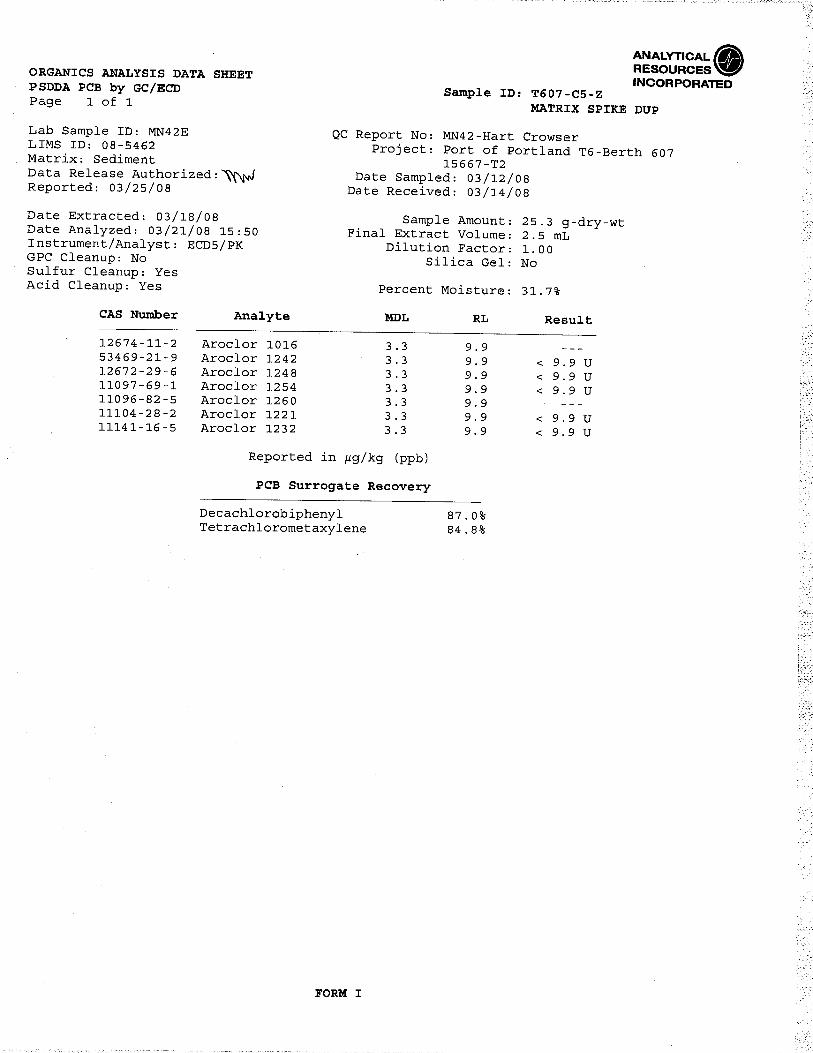
PCBs in µg/kgAroclor 1016 9.8 U 10 U 10 U 10 U 9.8 U 9.8 U 9.8 U 9.8 U --Aroclor 1221 9.8 U 10 U 10 U 10 U 9.8 U 9.8 U 9.8 U 9.8 U --Aroclor 1232 9.8 U 10 U 10 U 10 U 9.8 U 9.8 U 9.8 U 9.8 U --Aroclor 1242 9.8 U 10 U 10 U 10 U 9.8 U 9.8 U 9.8 U 9.8 U --Aroclor 1248 9.8 U 10 U 10 U 10 U 9.8 U 9.8 U 9.8 U 9.8 U --Aroclor 1254 9.8 U 10 U 10 U 10 U 9.8 U 9.8 U 9.8 U 9.8 U --Aroclor 1260 9.8 U 10 U 10 U 10 U 9.8 U 9.8 U 15 Y 9.8 U --
Total PCBs 9.8 U 10 U 10 U 10 U 9.8 U 9.8 U 15 Y 9.8 U 60
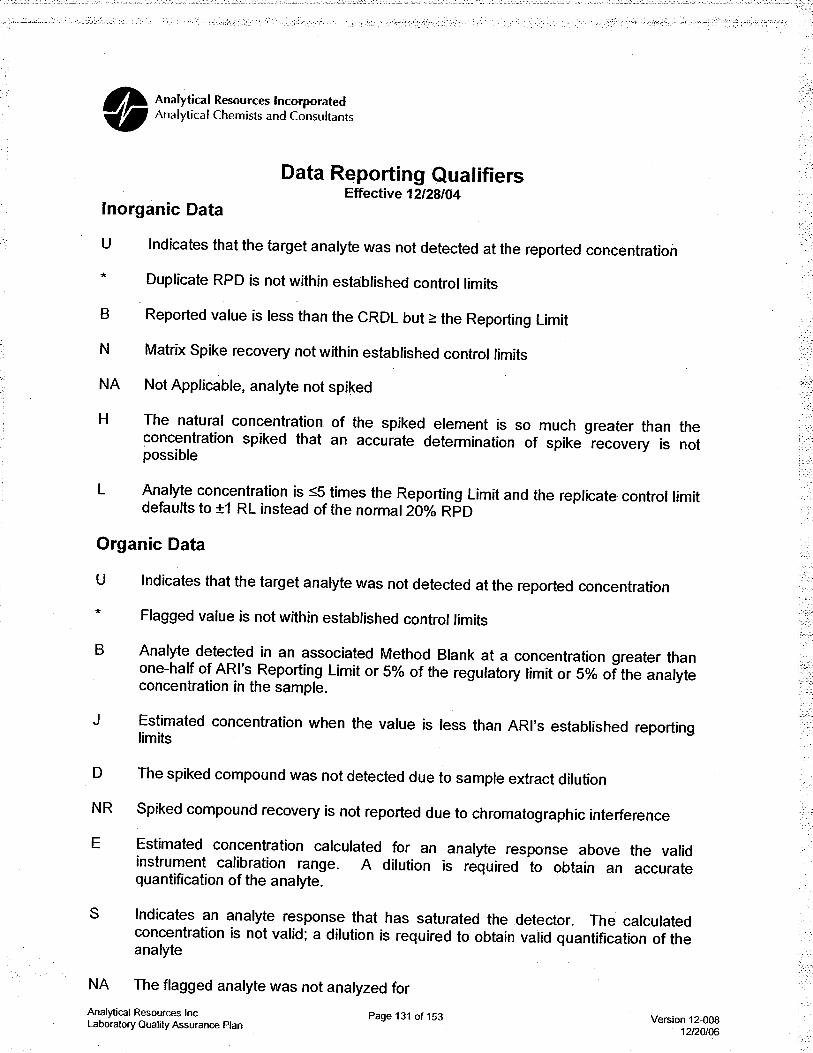
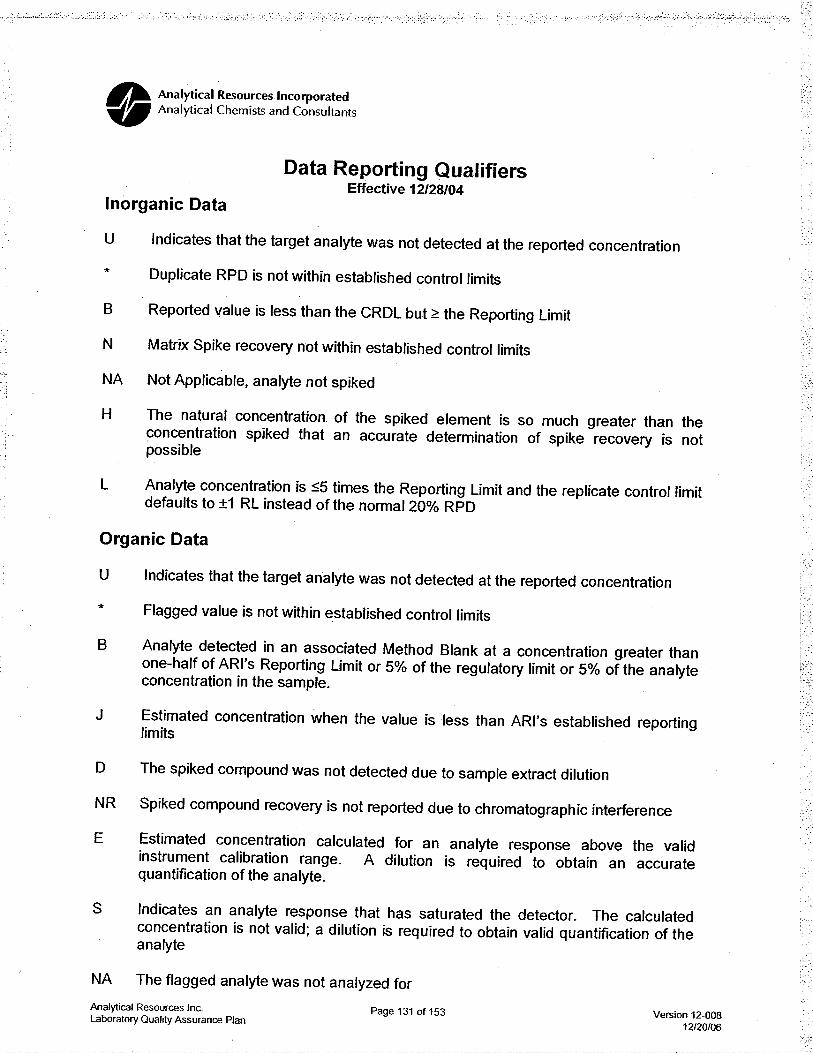
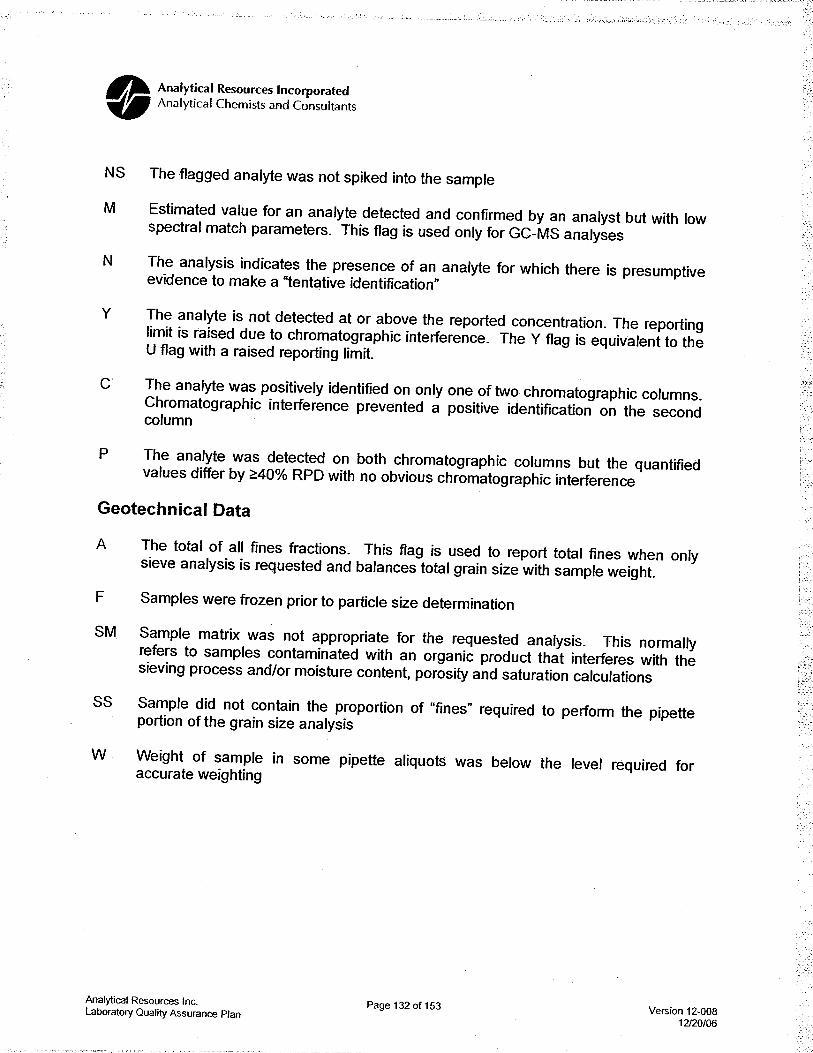
Note:1. Screening levels are as follows: 1 Screening levels are SEF's Freshwater Screening Level 1 (no adverse effects) (Corps, et al., 2006; Table 7-1, revised 10/20/06 ), unless otherwise indicated by Note 2. 2 No freshwater SL listed in SEF; values presented are marine SL1 from Table 7-1 of the SEF (Corps, et al., 2006; table revised 10/20/06).2. PAH concentrations are the higher of the EPA Method 8270D-SIM and EPA Method 8270D analyses.3. Bolded values are detected concentrations.4. Shaded value is a concentration exceeding its respective SL.5. For undetected compounds, method reporting limits are shown unless otherwise indicated.6. *Method detection limit (MDL).7. -- = Not analyzed or not available.8. NSM = New surface material (i.e., leave surface).9. J = Estimated concentration between MDL and method reporting limit (MRL).10. U = Not detected at the indicated MDL or MRL.11. UJ = Estimated MRL (see Appendix B).12. Y = Not detected at a MRL that was raised due to chromatographic interference.
601 607Prism NSM Prism NSM
MN42G MN42D MN42EMN43G MN43D MN43E MN43FT607-C6-Z
Screening Level 1
MN42FT601-MD T601-C1-Z T601-C2-Z T601-C3-Z T607-MD T607-C4-Z T607-C5-Z
Source: Base map prepared from the USGS 7.5-minute quadrangle of Sauvie Island, Oregon, dated 1990.
Berth601
15667-00Figure 1
6/08
F:\D
ata
\Jobs\P
ort
ofP
ort
land\1
5667
T6
Main
t\R
eport
\Fig
ure
s\1
566700
01
(Site
Location).
cdr
OREGON
Portland
0 2,000 4,000
Scale in FeetContour Interval 10 Feet
Site Location MapTerminal 6 Sediment CharacterizationN Marine Drive, Portland, Oregon
N
Berth607
Hart Crowser 15667-00 June 12, 2008
APPENDIX A SEDIMENT CORE LOGS
Hart Crowser 15667-00 June 12, 2008
APPENDIX B QUALITY ASSURANCE REVIEW
APPENDIX B QUALITY ASSURANCE REPORT
This appendix documents the results of a quality assurance (QA) review of the analytical data for dredge prism and new surface material (NSM) samples collected during the March 12, 2008, sediment characterization at the Berths 601 and 607. Field procedures used for sample collection are discussed in our Sampling and Analysis Plan (SAP; Hart Crowser, 2008). Hart Crowser submitted sediment samples to Analytical Resources, Inc. (ARI), of Tukwila, Washington, for chemical analysis. Copies of the analytical laboratory reports are included in Appendix C. Upon review, the analytical data are valid for their intended use. A Data Completeness (QA1) checklist is included as Table B-1 in this appendix.
The quality assurance review included examination and validation of the laboratories’ summary report, including:
Holding times;
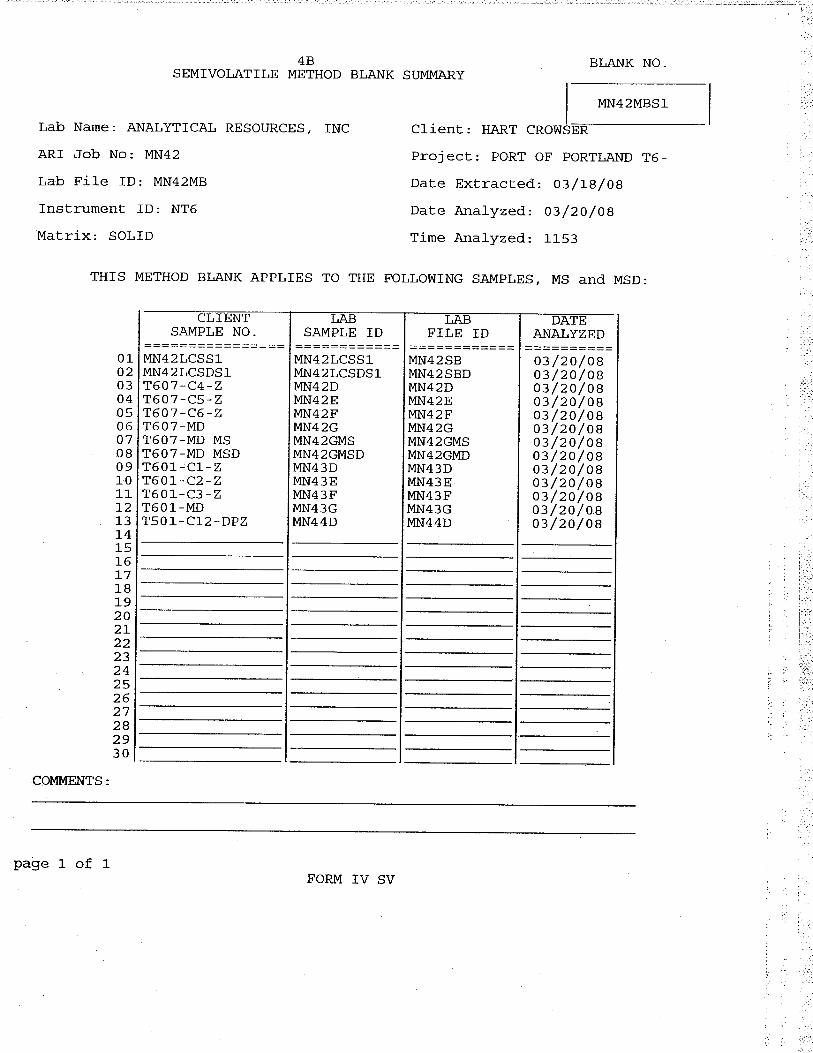
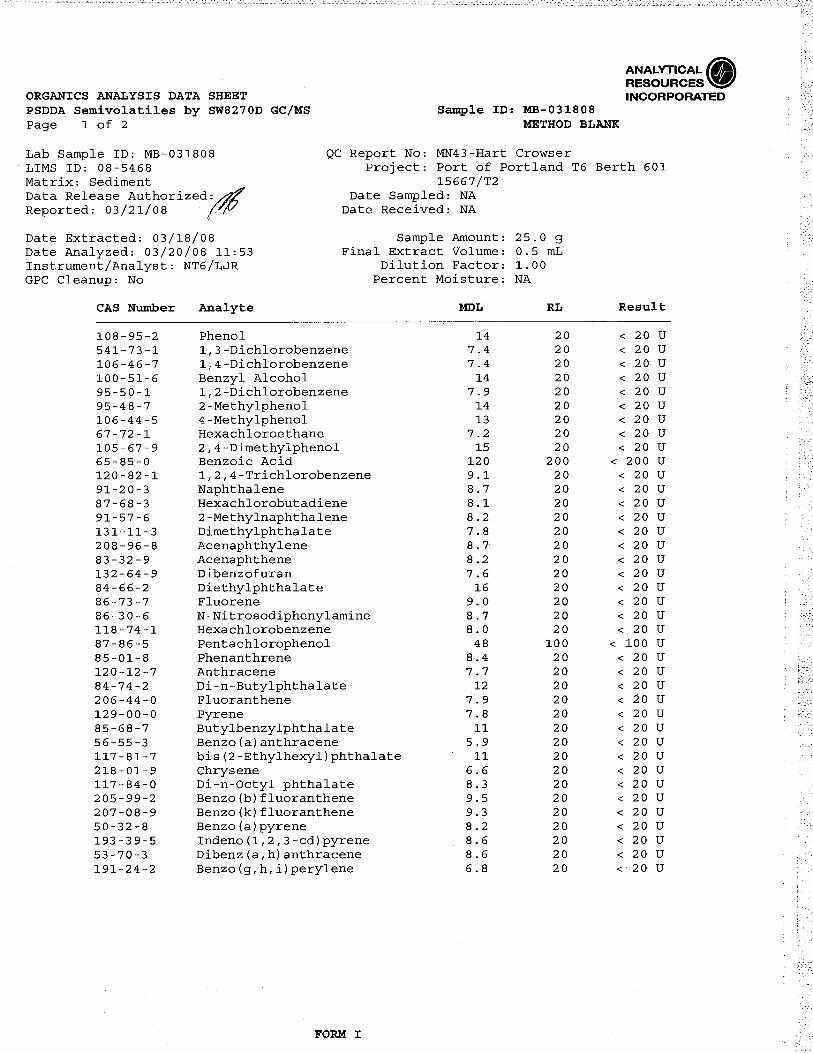
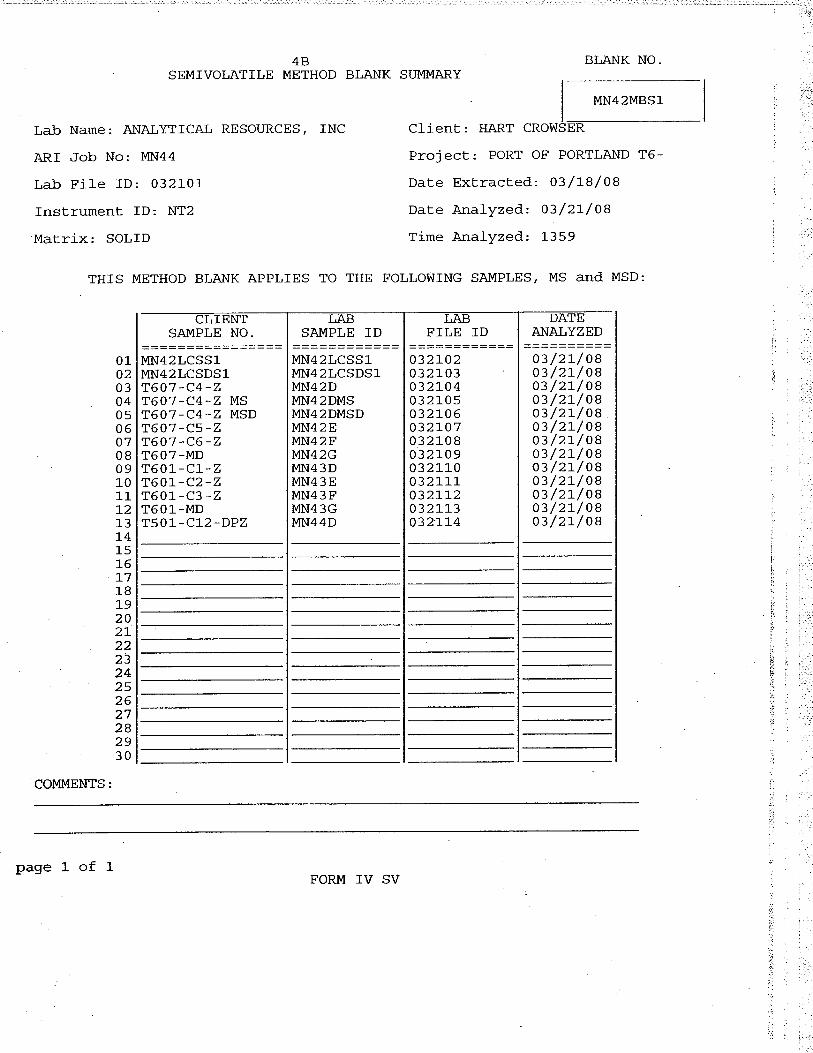
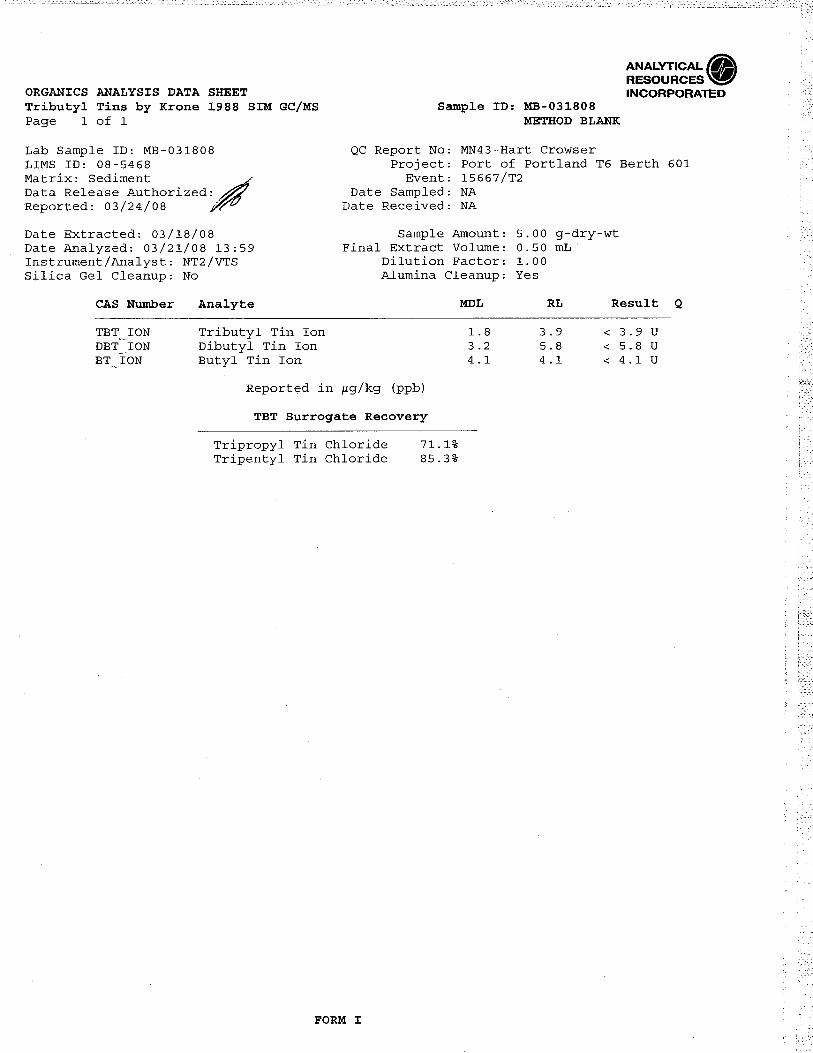
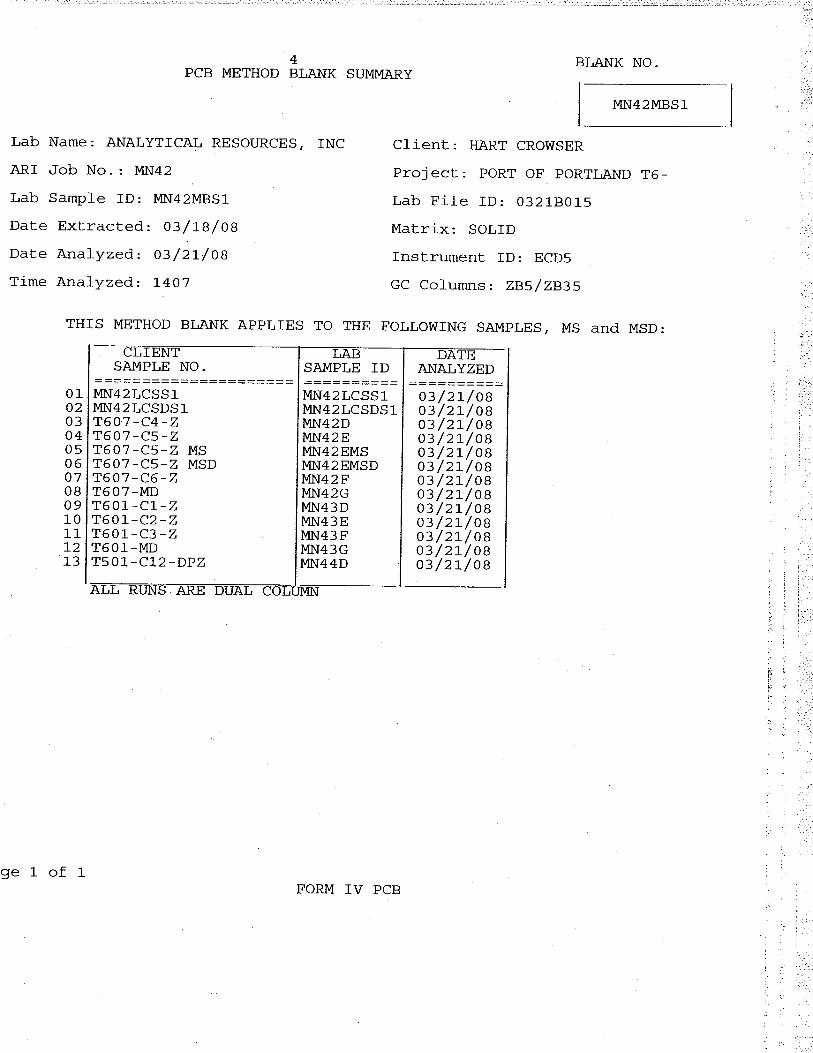
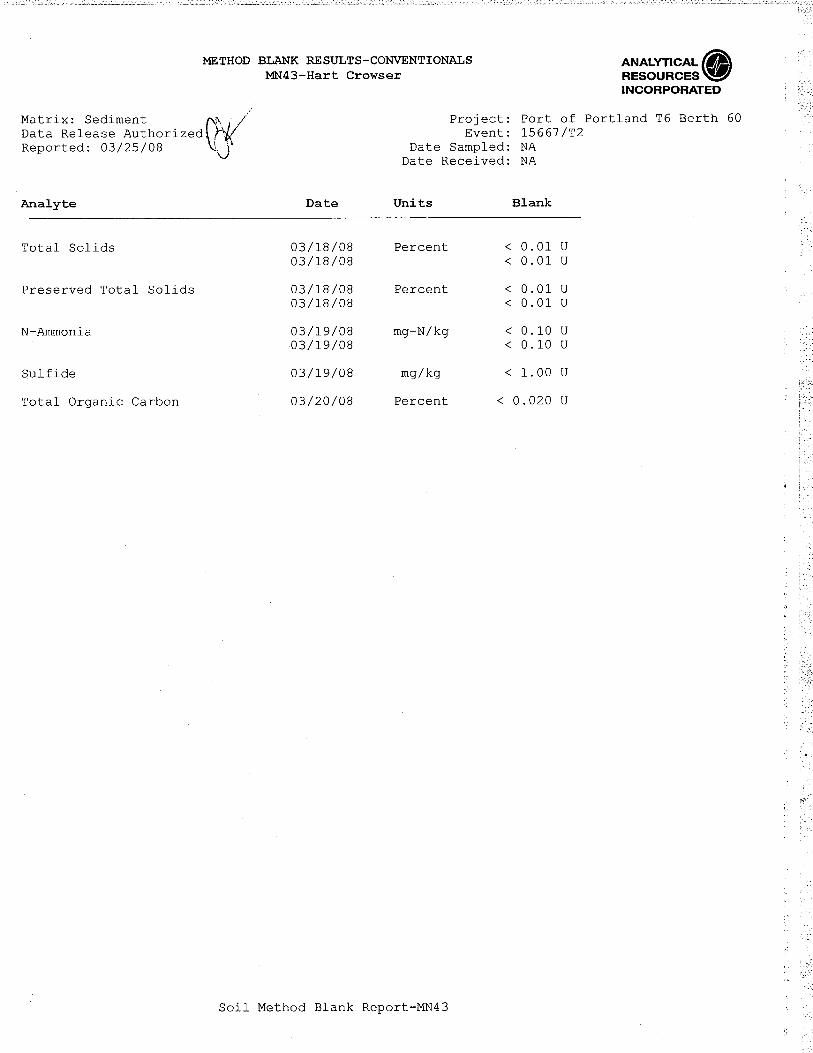
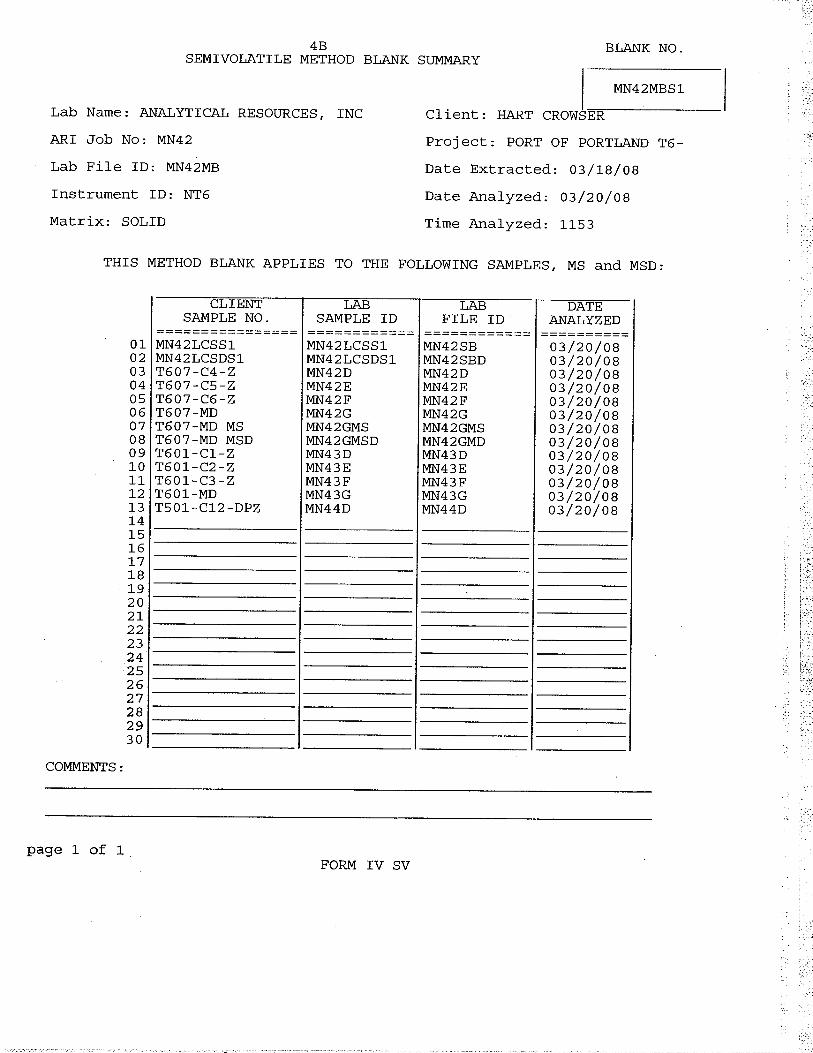
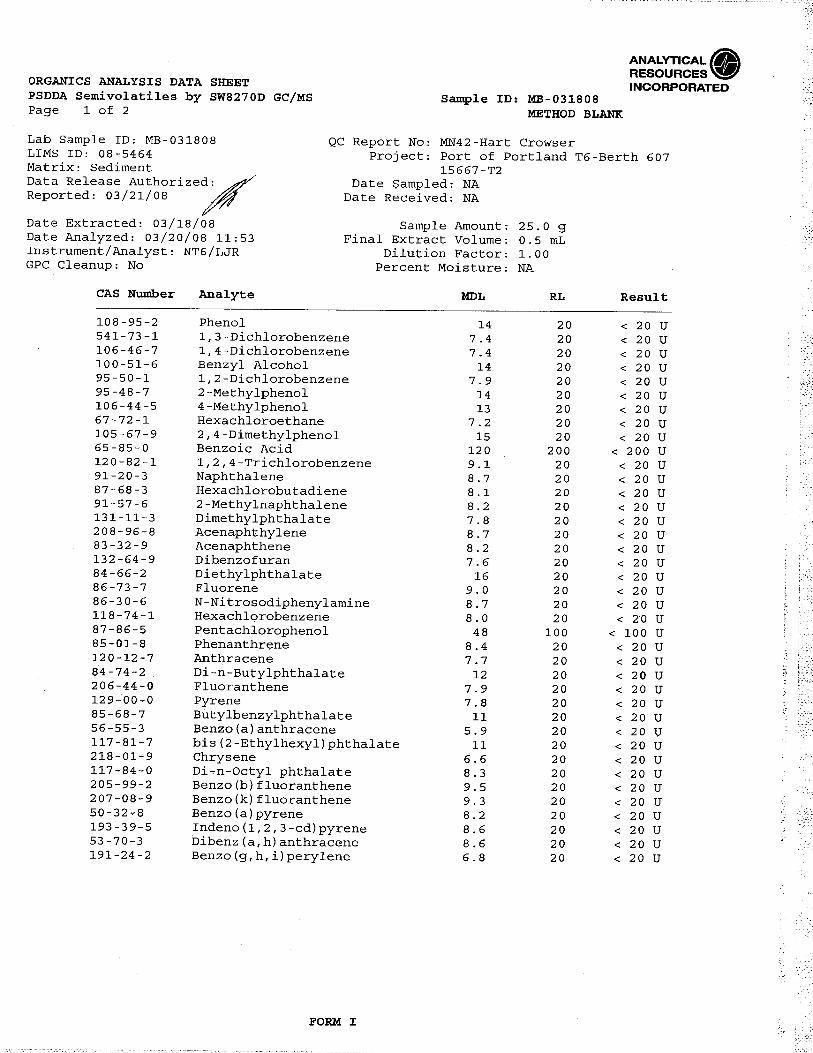
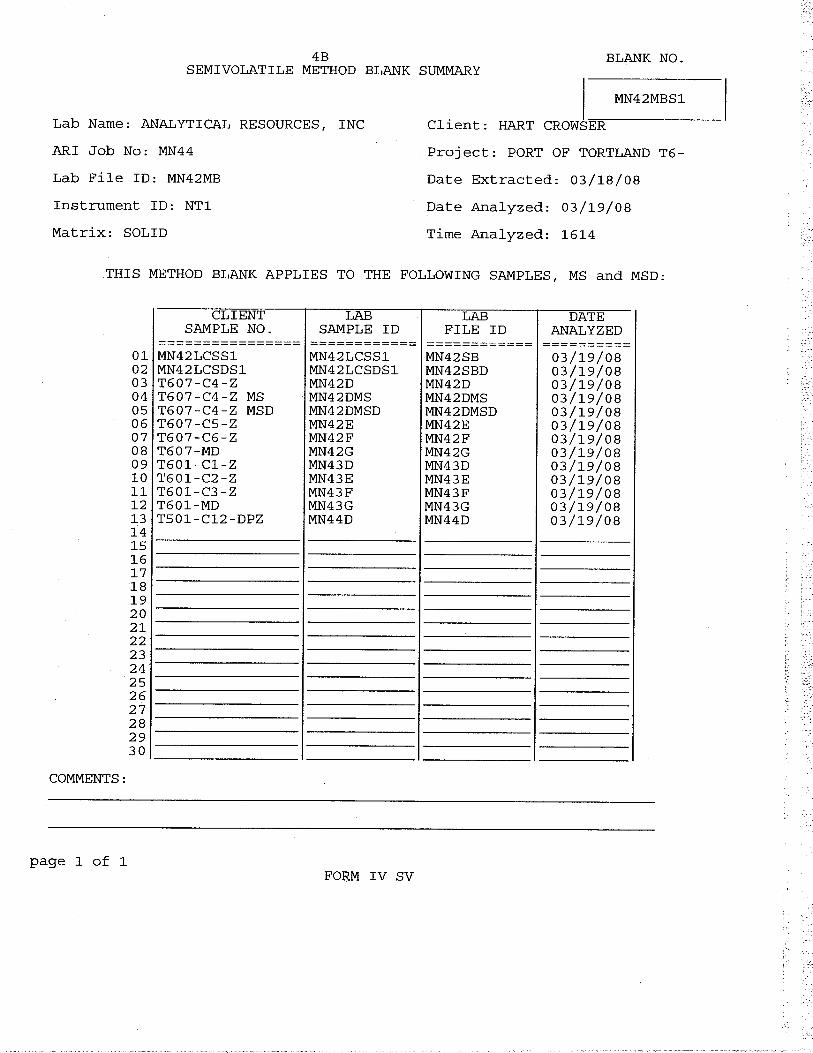
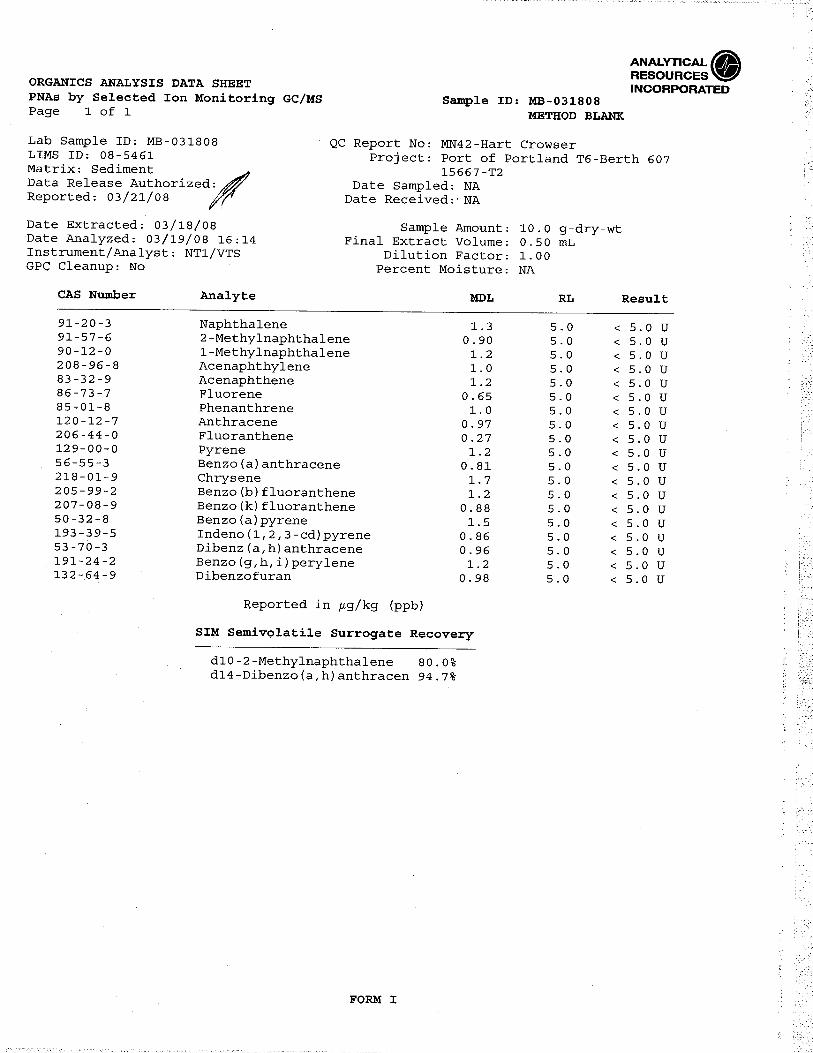
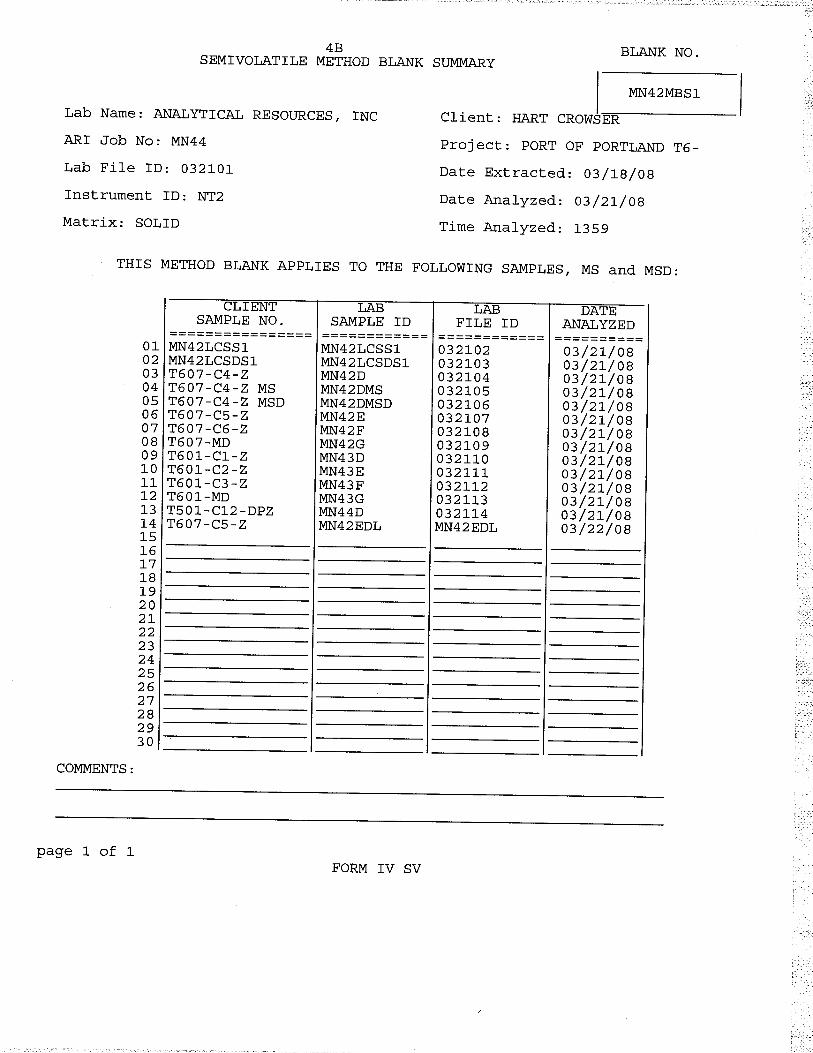
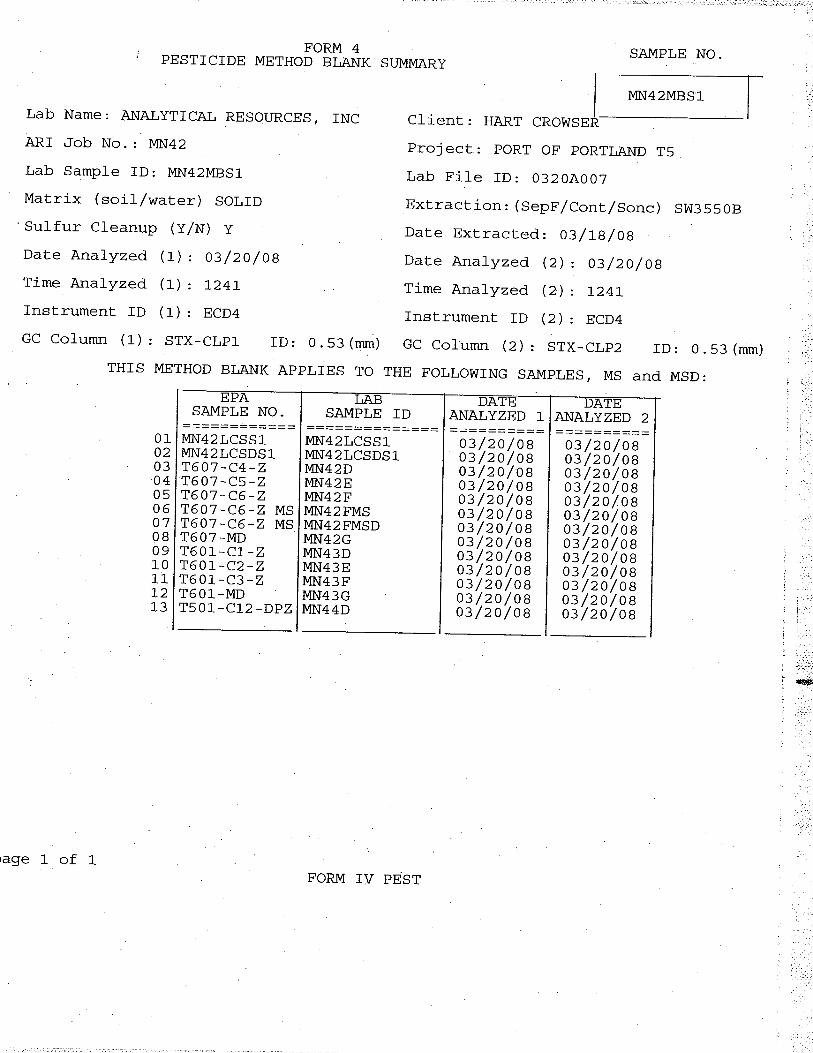
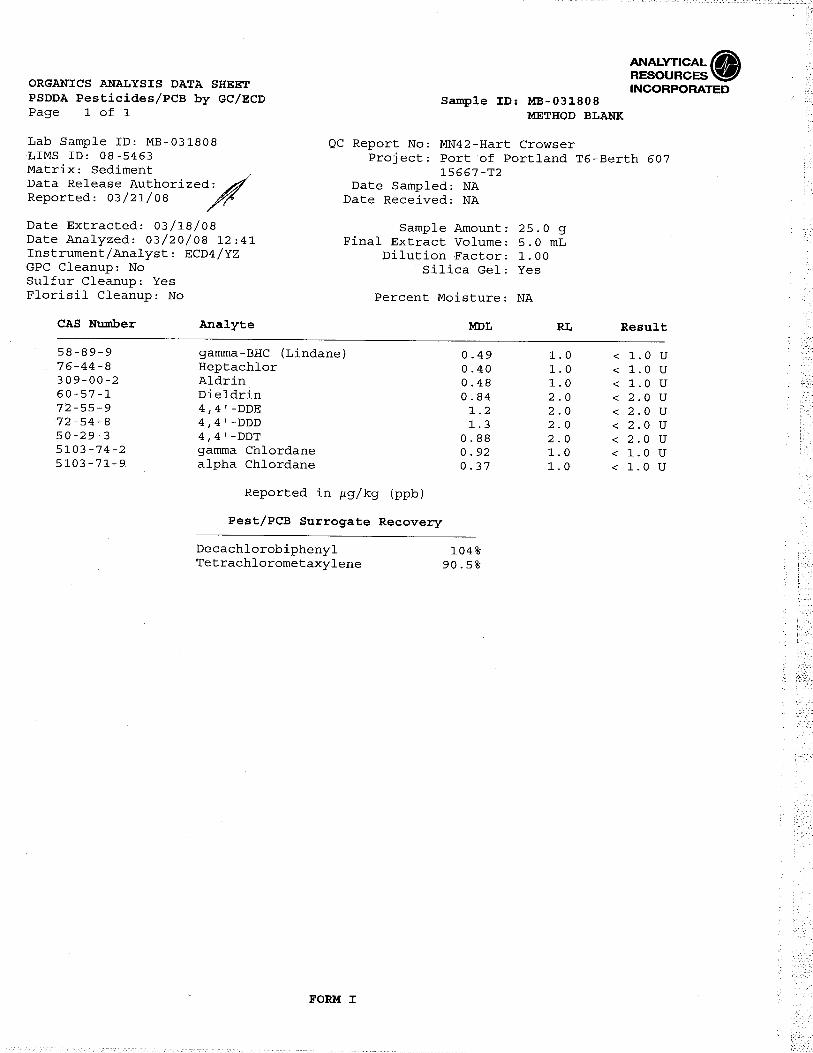
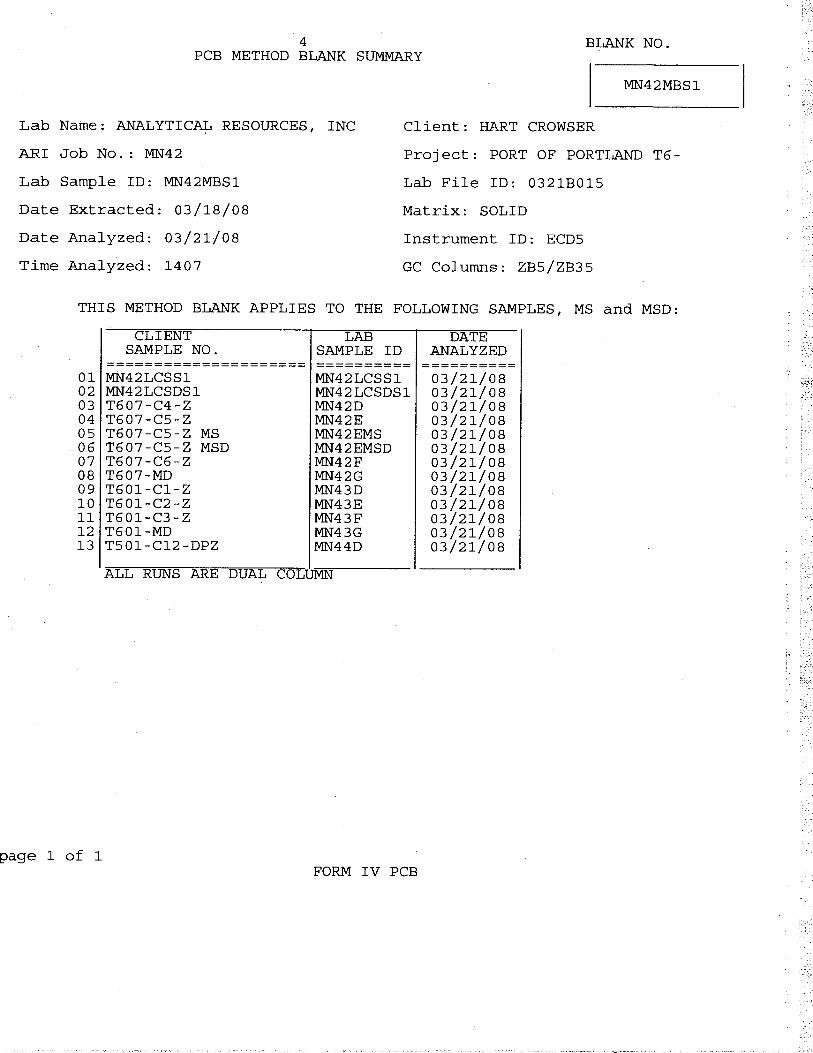
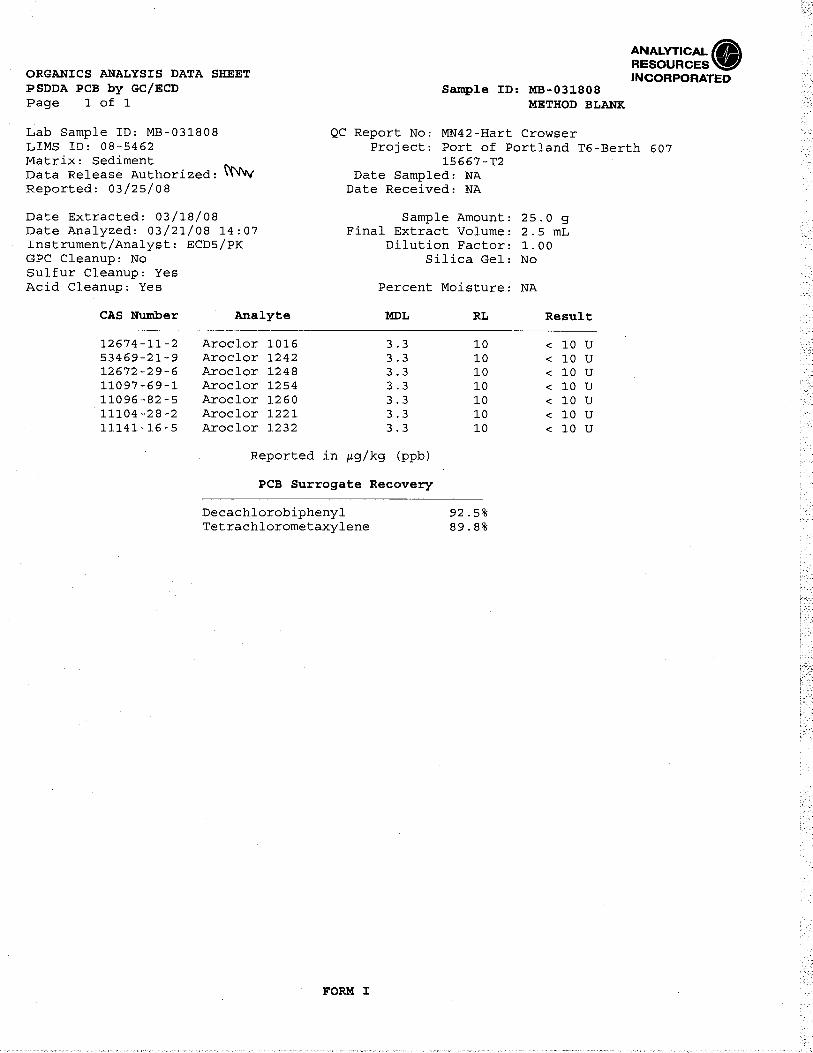
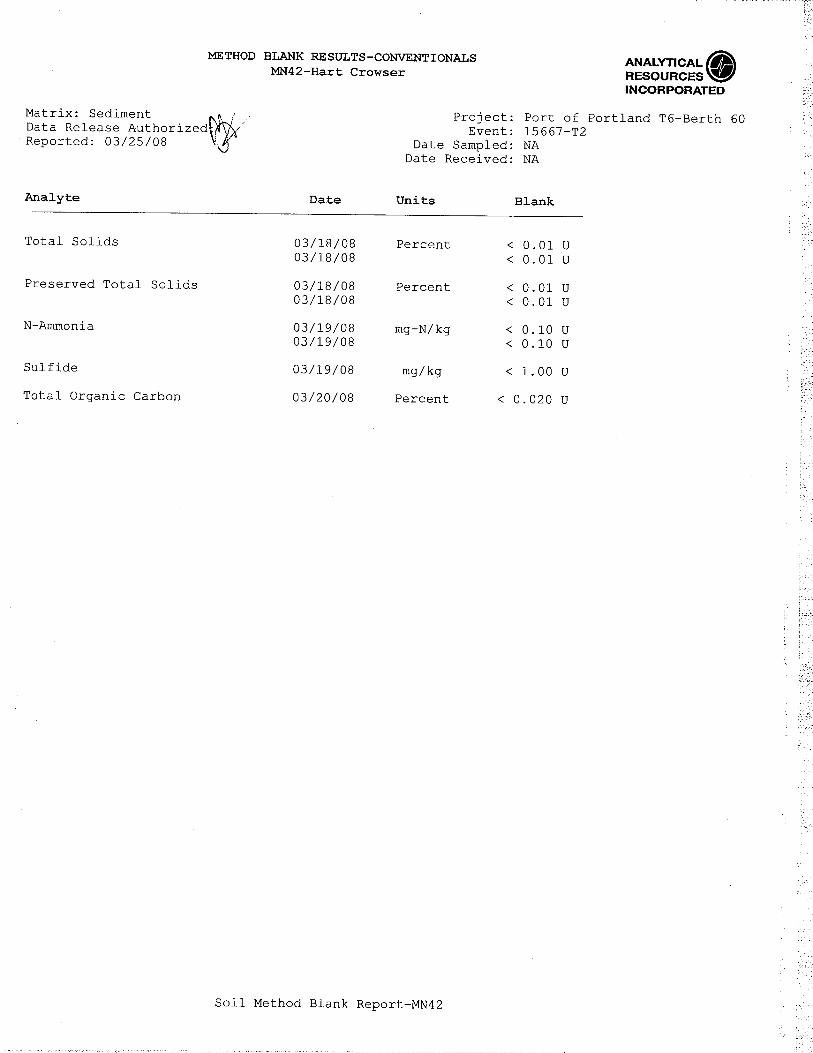
Method blanks;
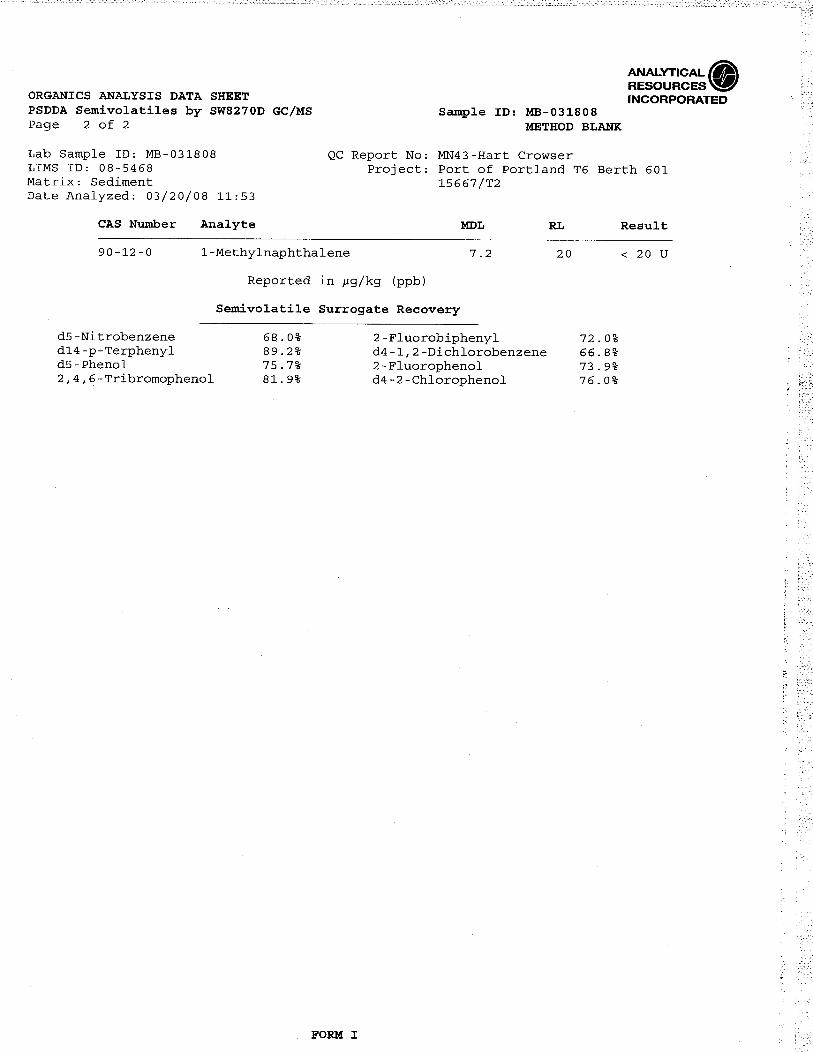
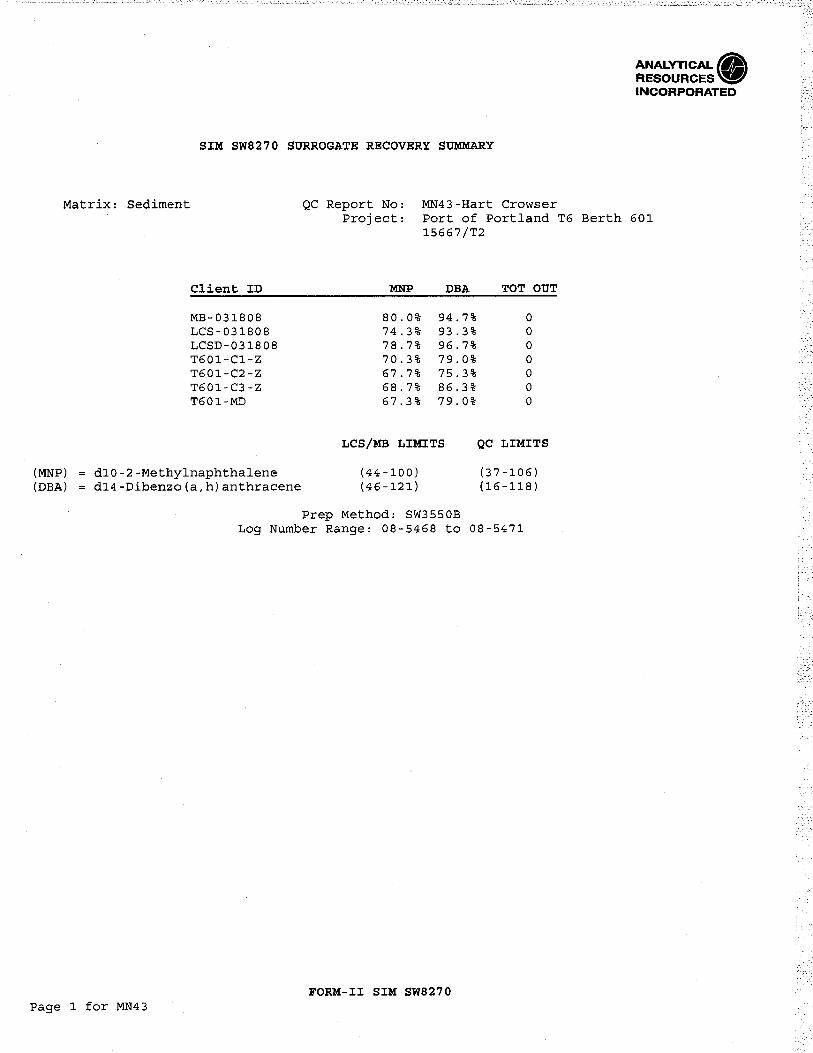
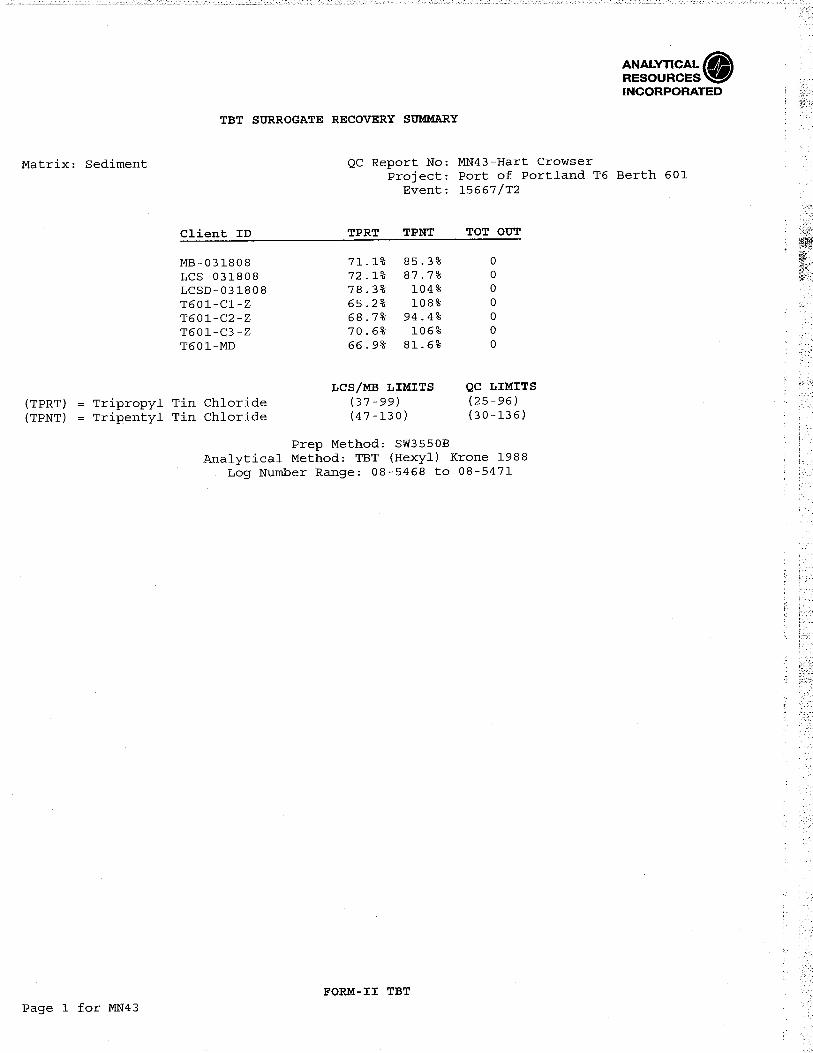
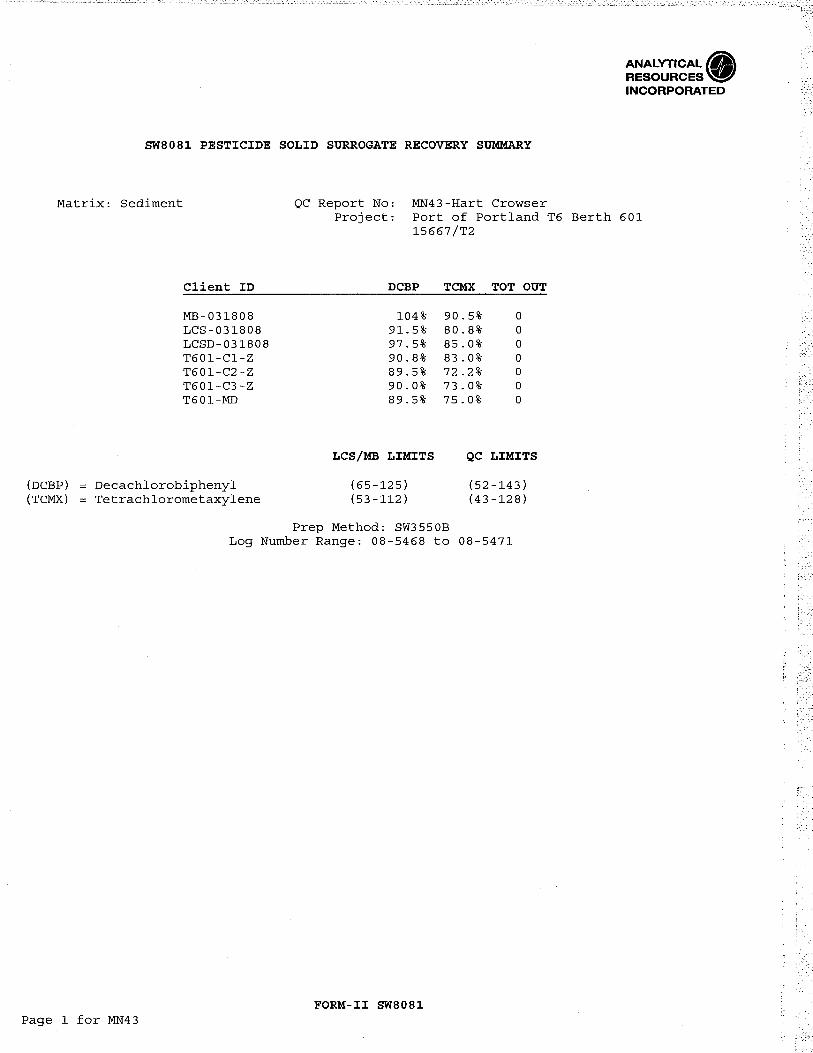
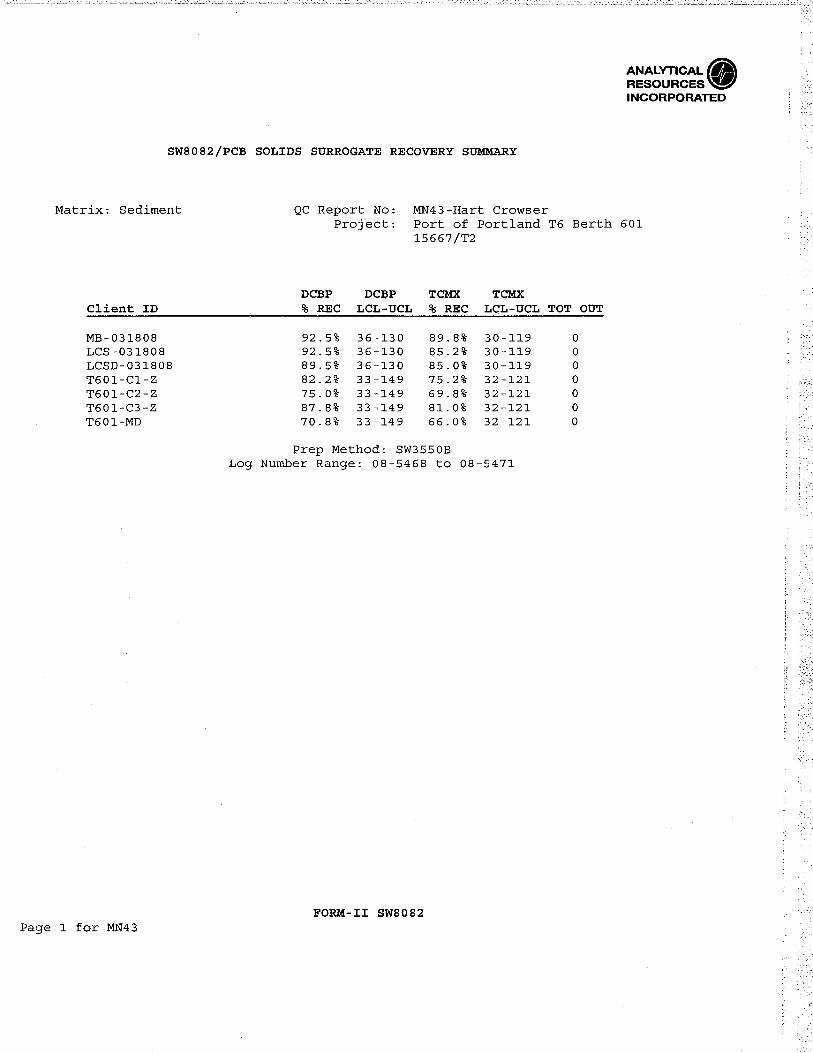
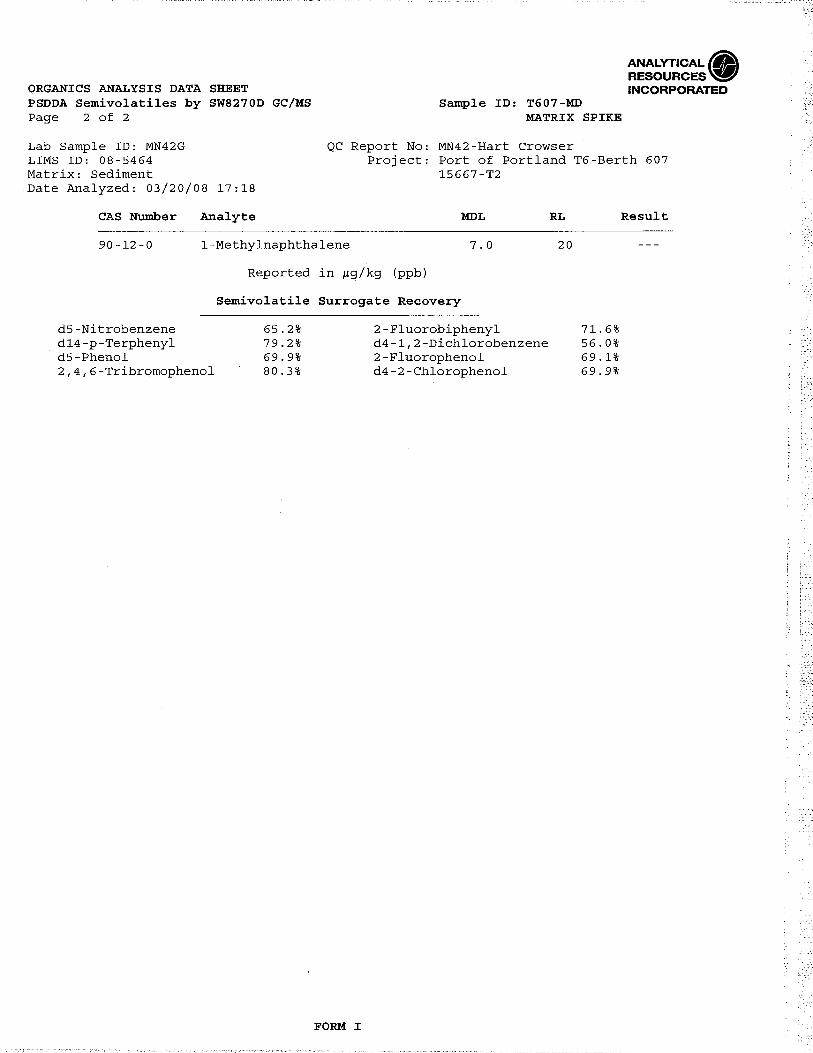
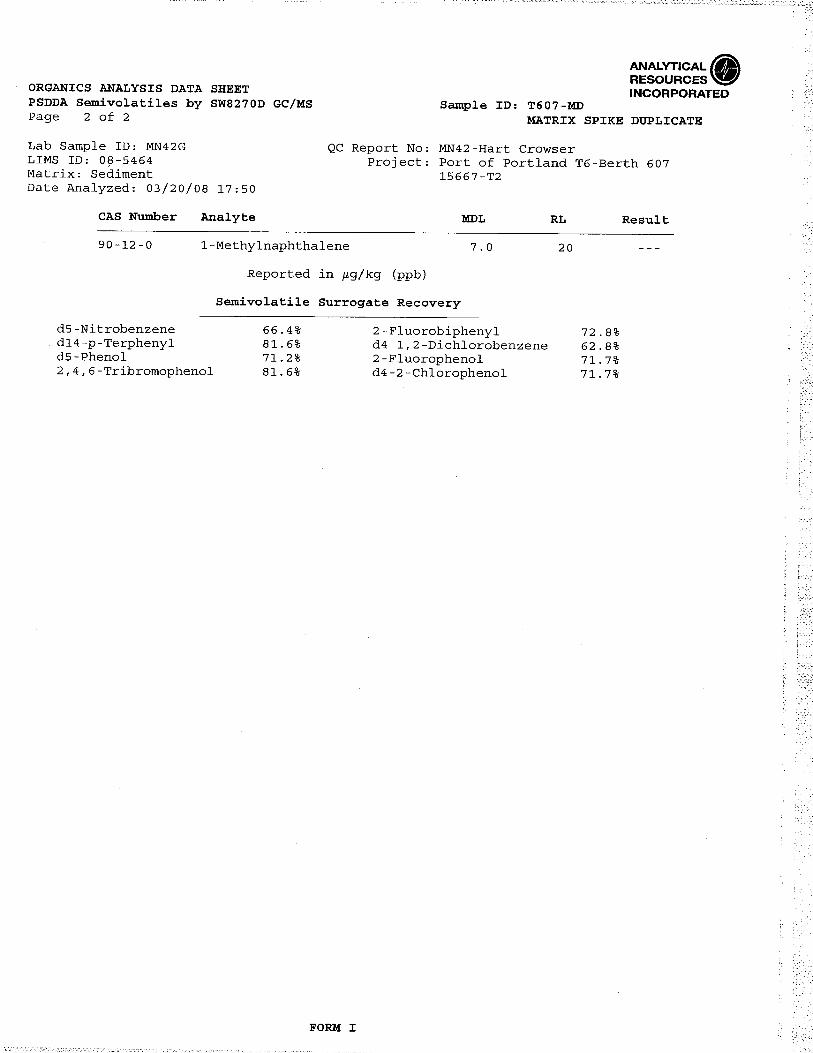
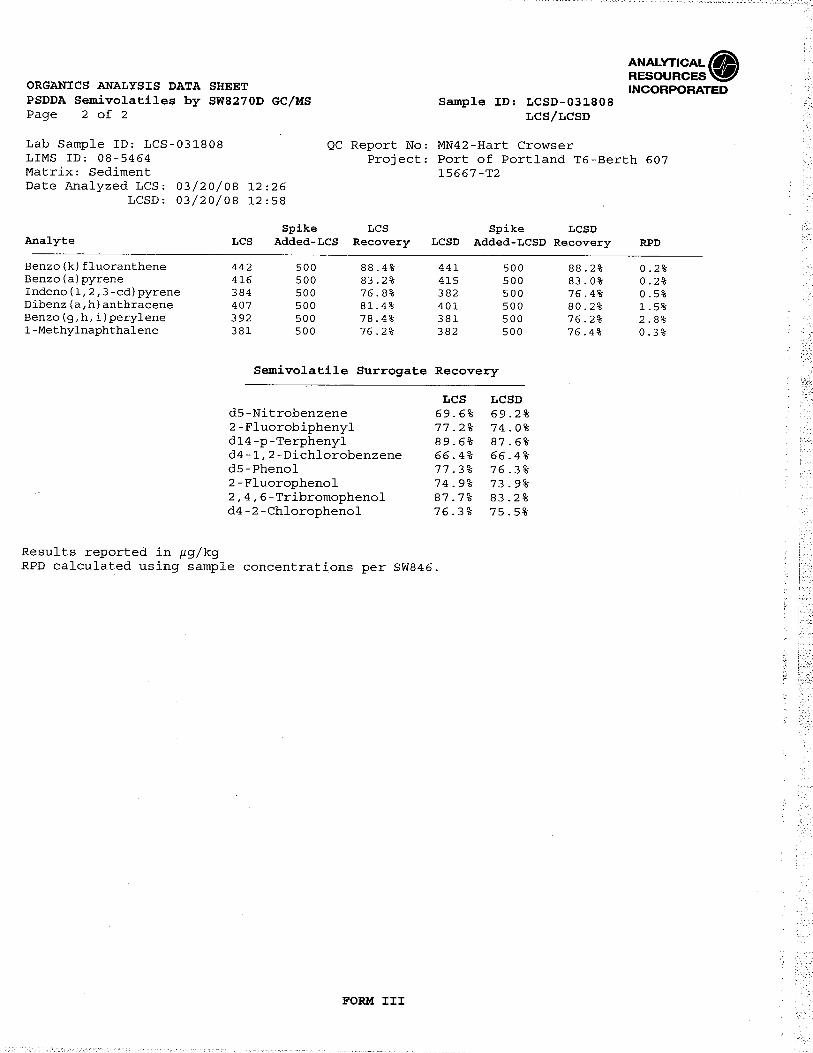
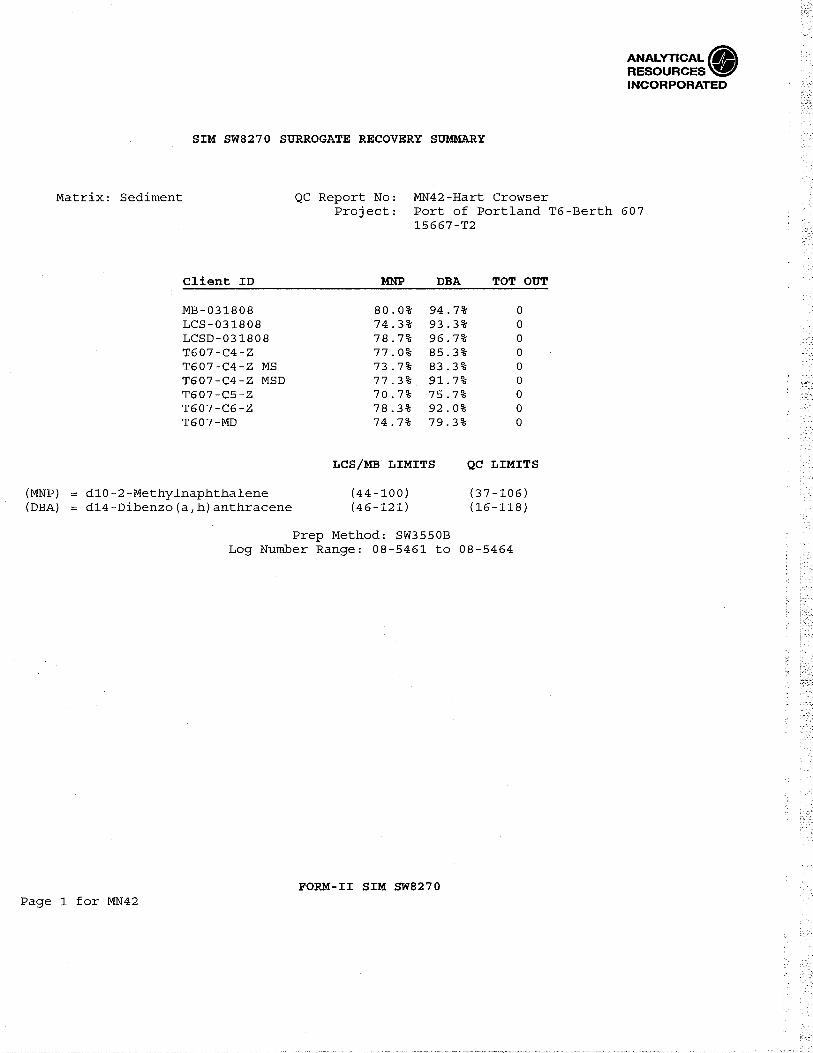
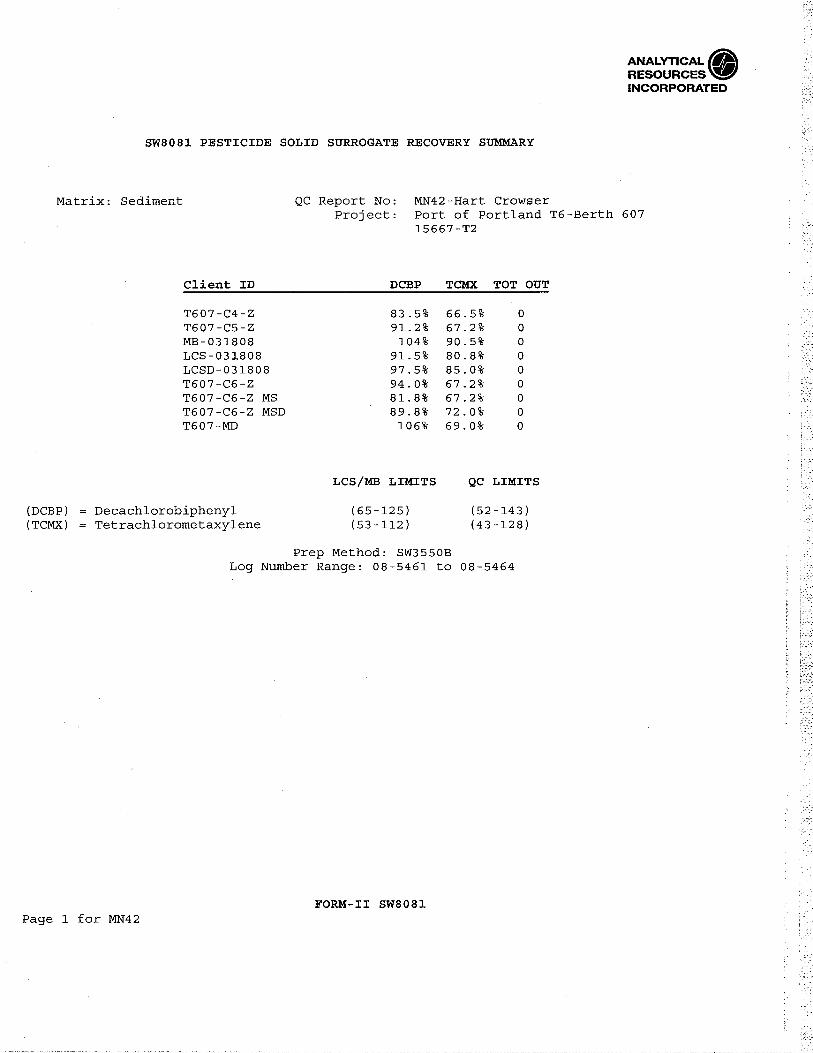
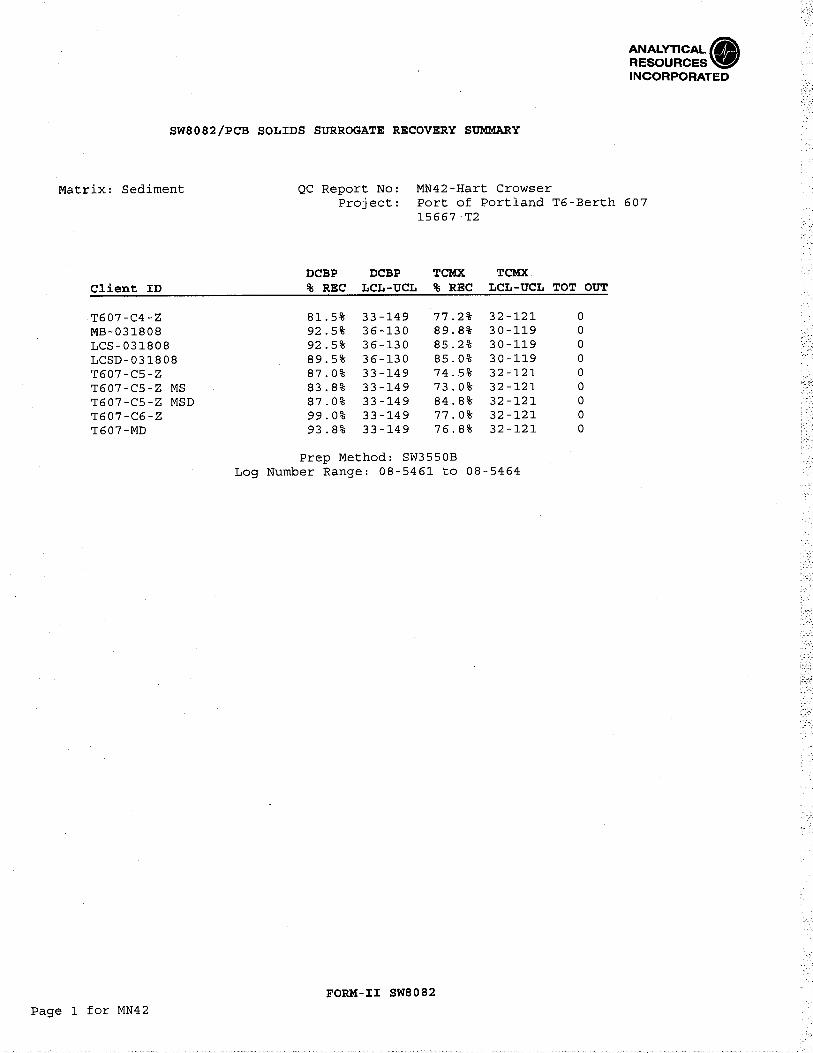
Surrogate recoveries;
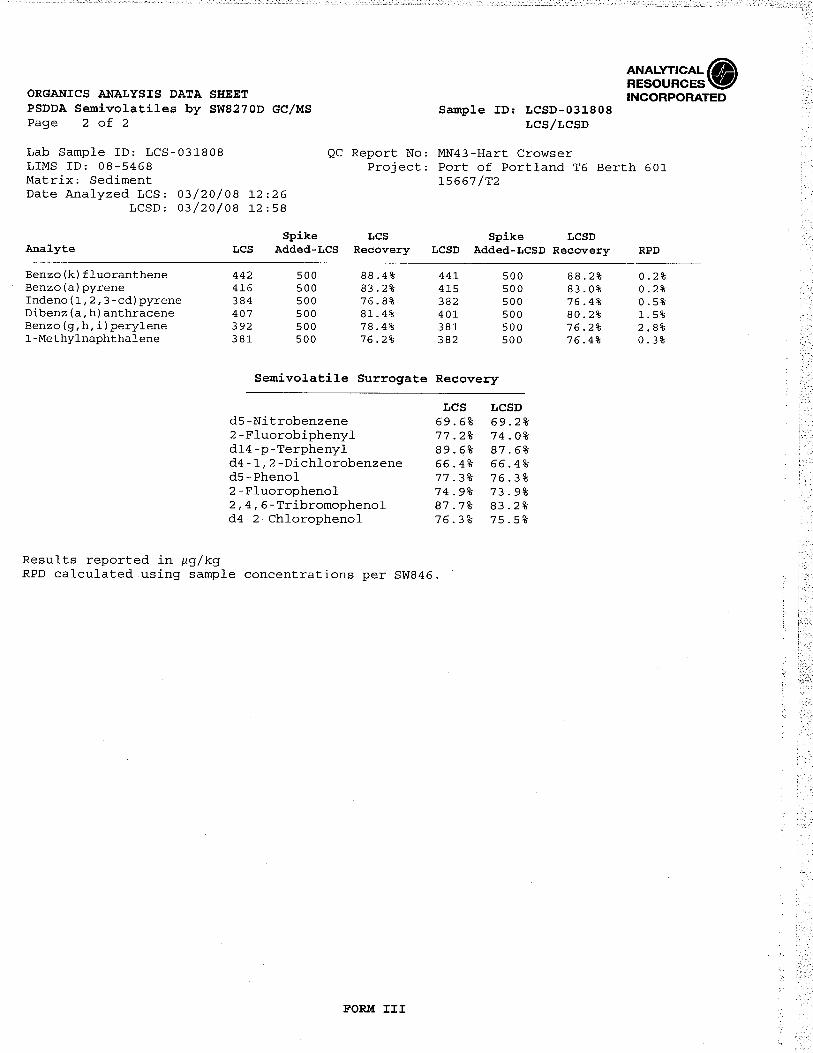
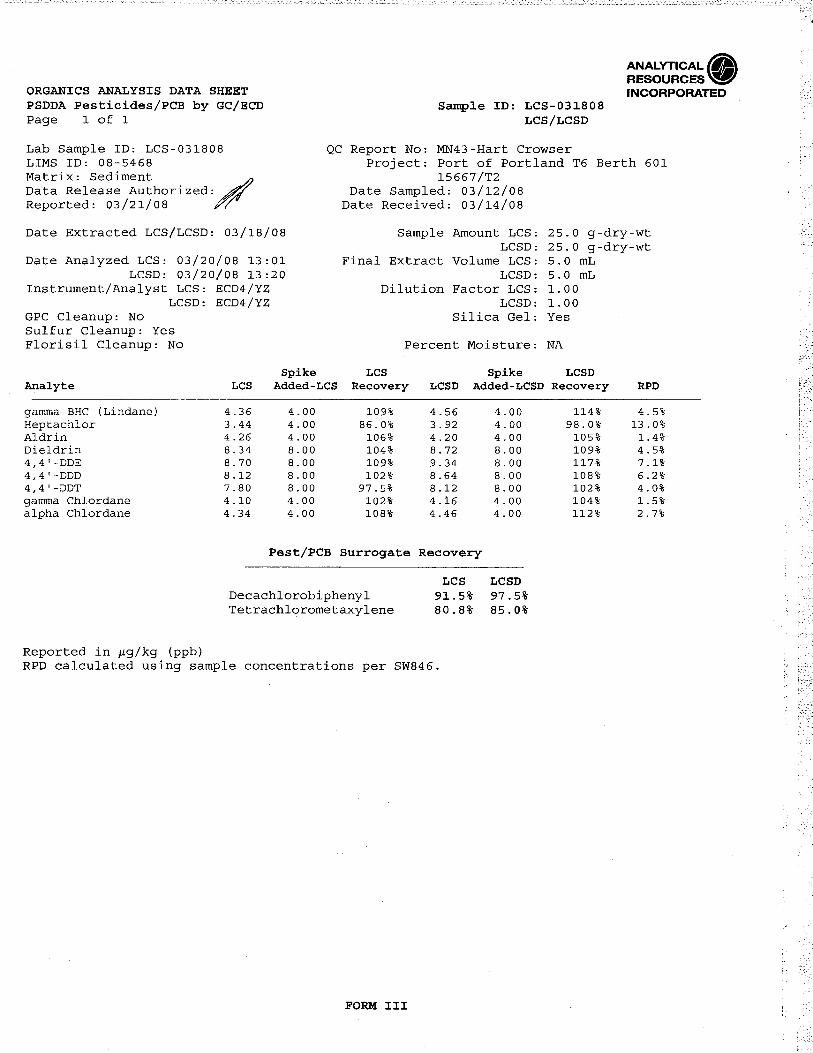
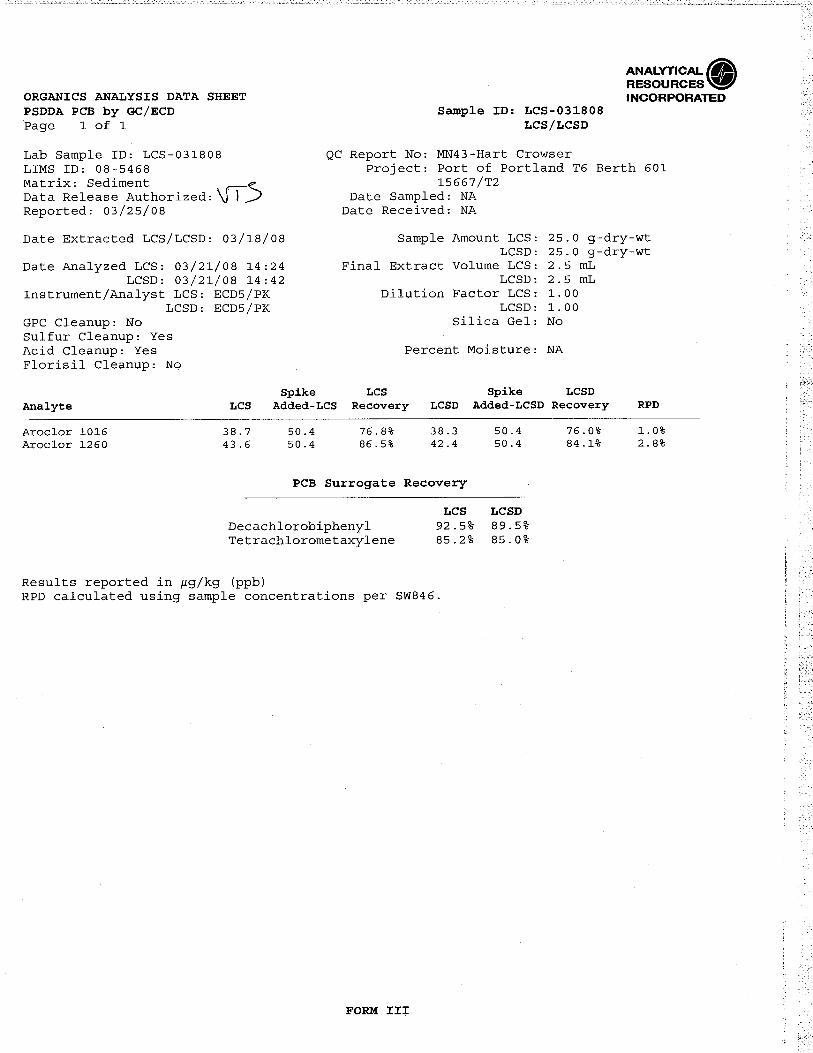
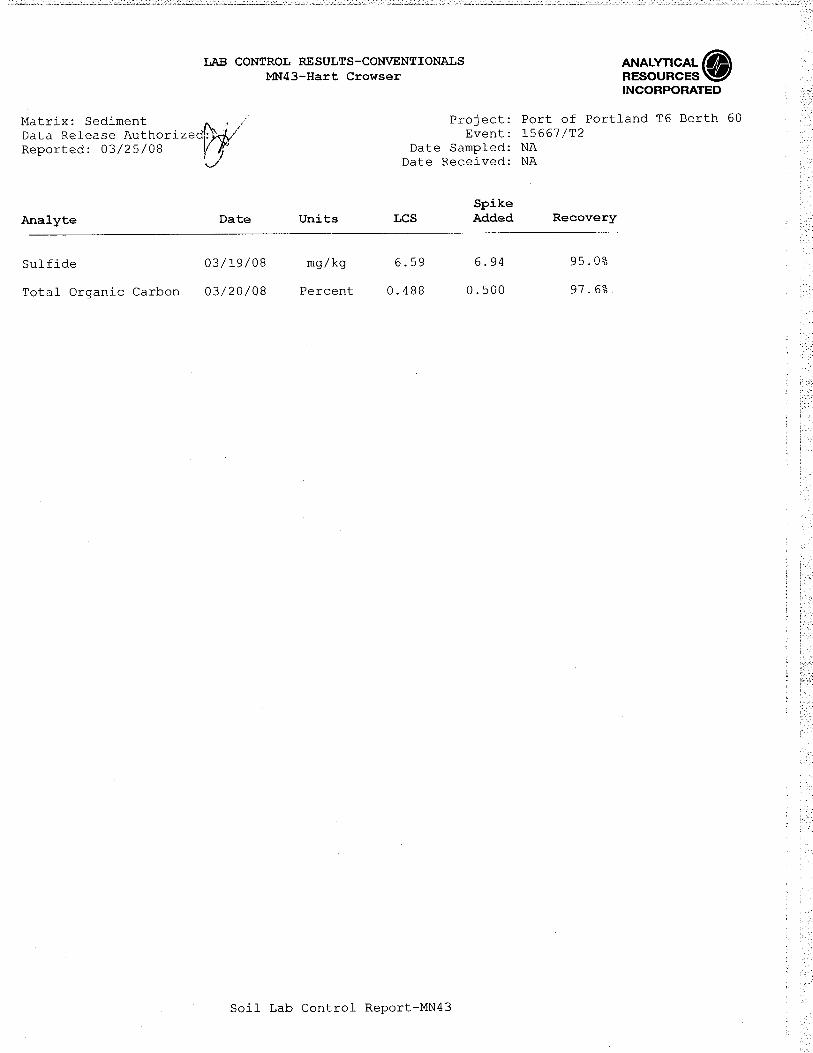
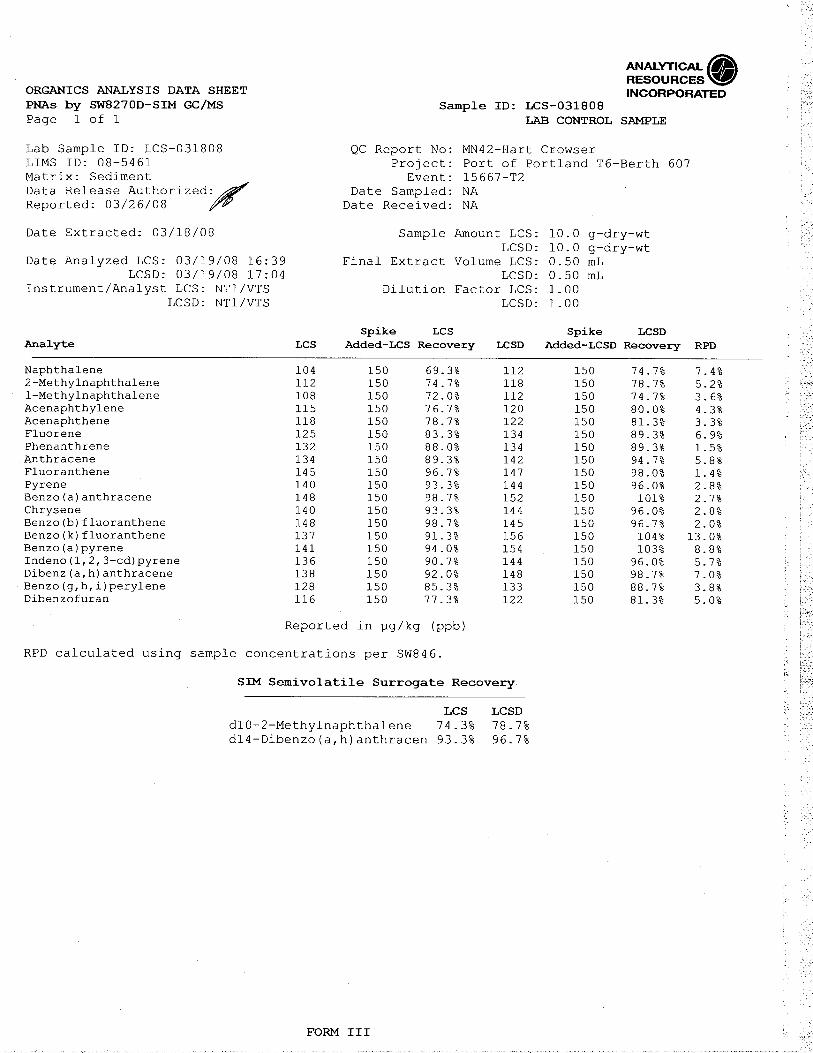
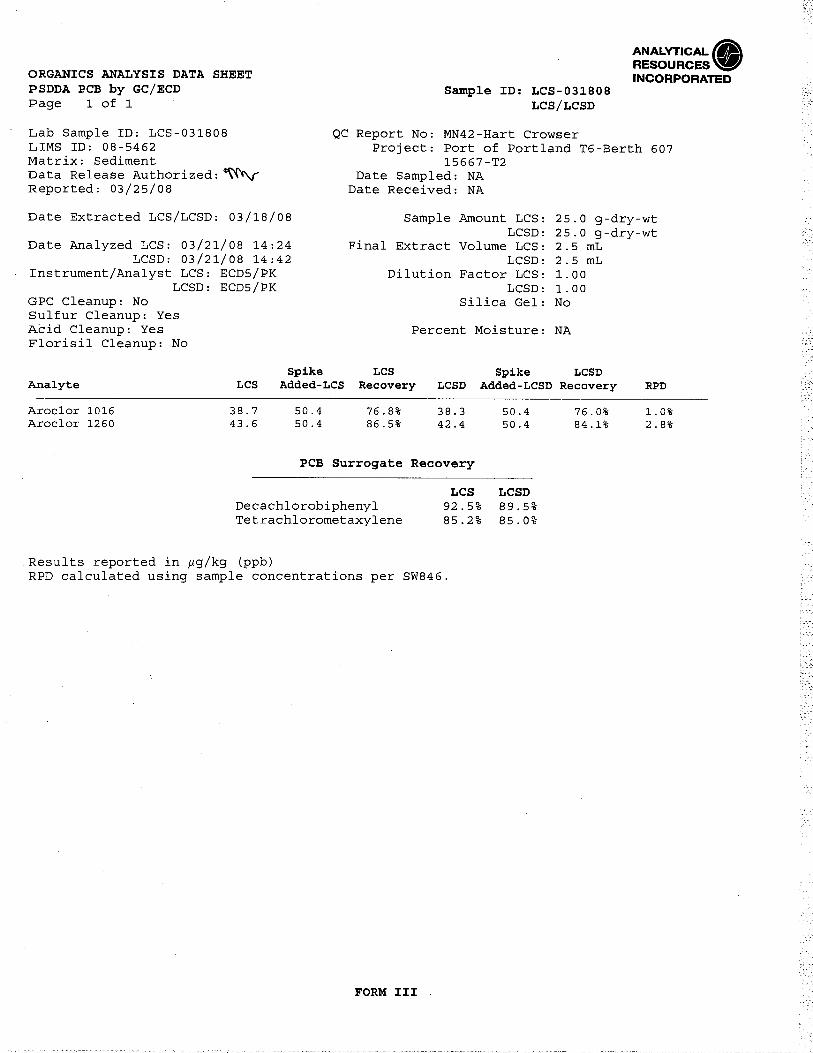
Laboratory control sample/laboratory control sample duplicate (LCS/LCSD) recoveries;
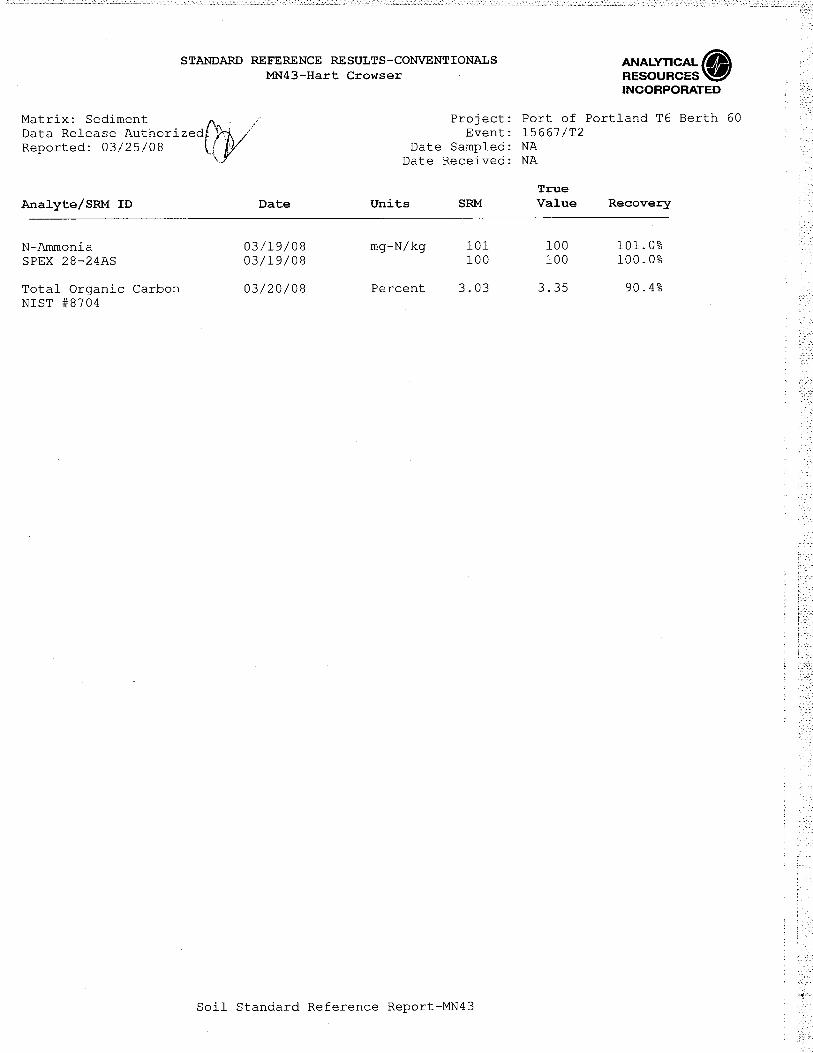
Standard reference material (SRM) recoveries;
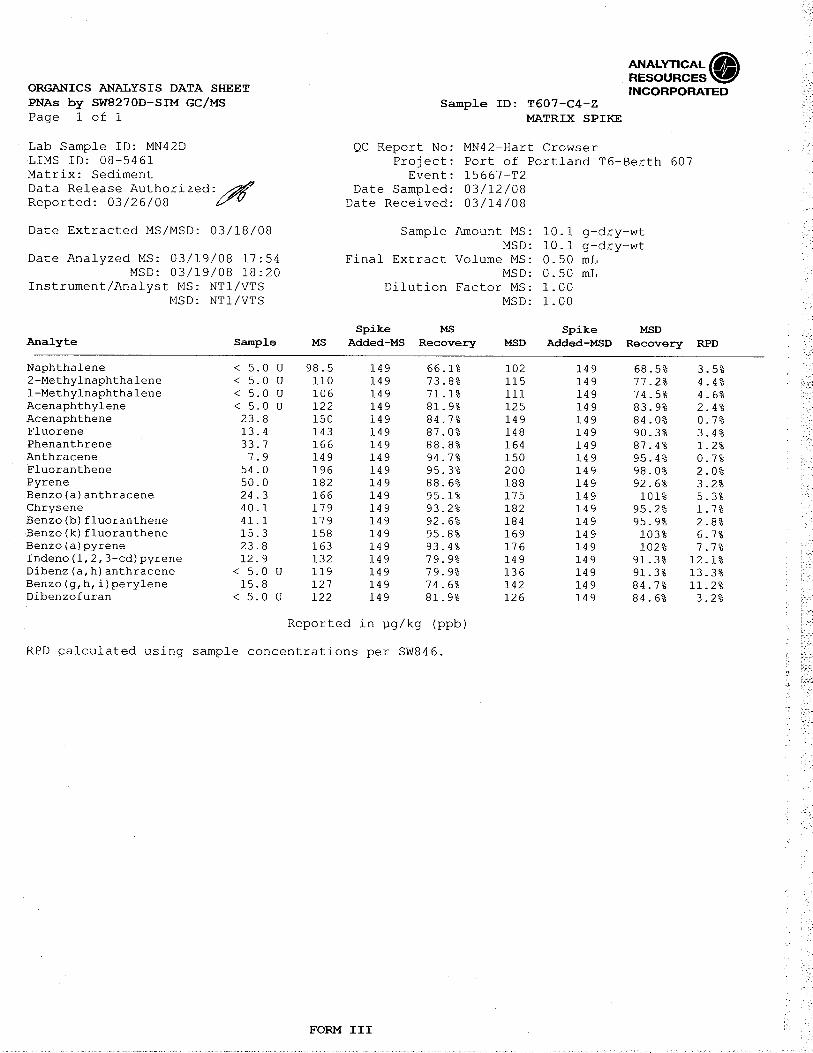
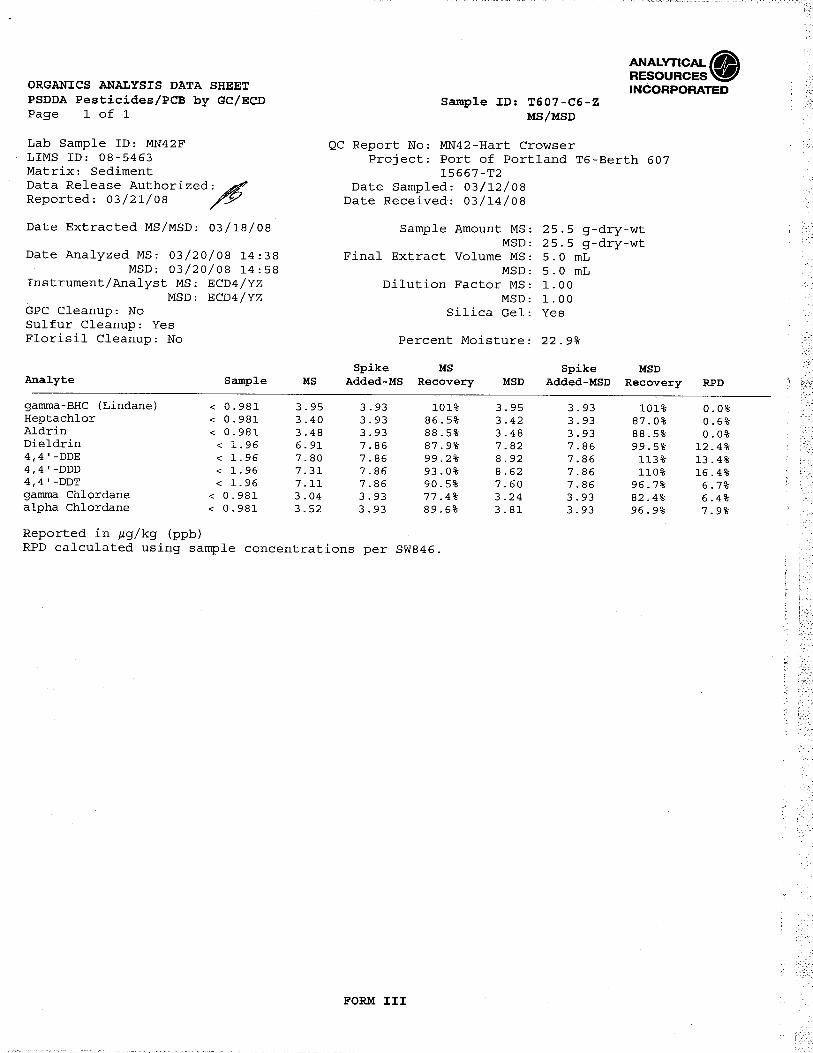
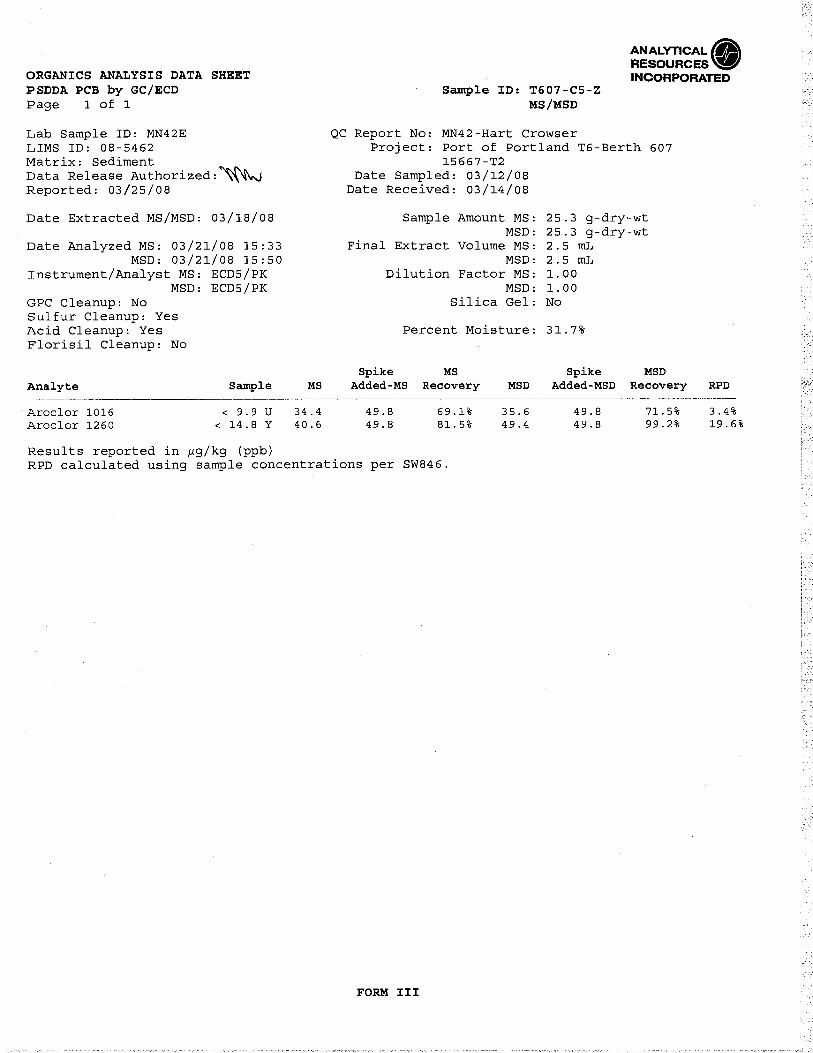
Matrix spike and matrix spike duplicate (MS/MSD) recoveries; and
Laboratory duplicate relative percent difference (RPD). The QA review did not include a review of raw data.
ANALYTICAL METHODS AND DETECTION LIMITS
Chemical Analyses on Sediment
A total of 14 sediment samples were collected from the six cores obtained during the sediment characterization fieldwork in March 2008 (i.e., a dredge prism and a NSM sample from each core and one composite sample from each of the two dredge material management units [DMMUs]). To assess the chemical quality of the DMMUs and future NSM after maintenance dredging, the two composite samples and six NSM samples were analyzed for the following:
Grain size by ASTM D 422M;
Hart Crowser Page B-1 15667-00 June 12, 2008
Total solids by EPA Method 160.3;
Total organic carbon (TOC) by Plumb (1981);
Ammonia by EPA Method 350.1M;
Sulfide by EPA Method 376.2;
Total metals (antimony, arsenic, cadmium, chromium, copper, lead, mercury, nickel, silver, and zinc) by EPA Method 200.8/6010B/7471A;
Tributyltin (TBT) by Krone, et al. (written 1988; published 1989);
Polynuclear aromatic hydrocarbon (PAHs) by EPA Method 8270D-SIM;
Semivolatile organic compounds (SVOCs) by EPA Method 8270D;
Organochlorine pesticides by EPA Method 8081A; and
Polychlorinated biphenyls (PCBs) by EPA Method 8082. These analytical test methods were the analytical methods specified in the SAP (Hart Crowser, 2008), except analysis for arsenic and antimony by EPA Method 200.8 was used to obtain lower method reporting limits (MRLs) than EPA Method 6010B. Methods 200.8 and 6010B both use inductively coupled plasma to atomize and ionize the metals in the sample, but Method 200.8 follows with mass spectrometer to separate the metal ions for quantification.
Detection and Reporting Limits
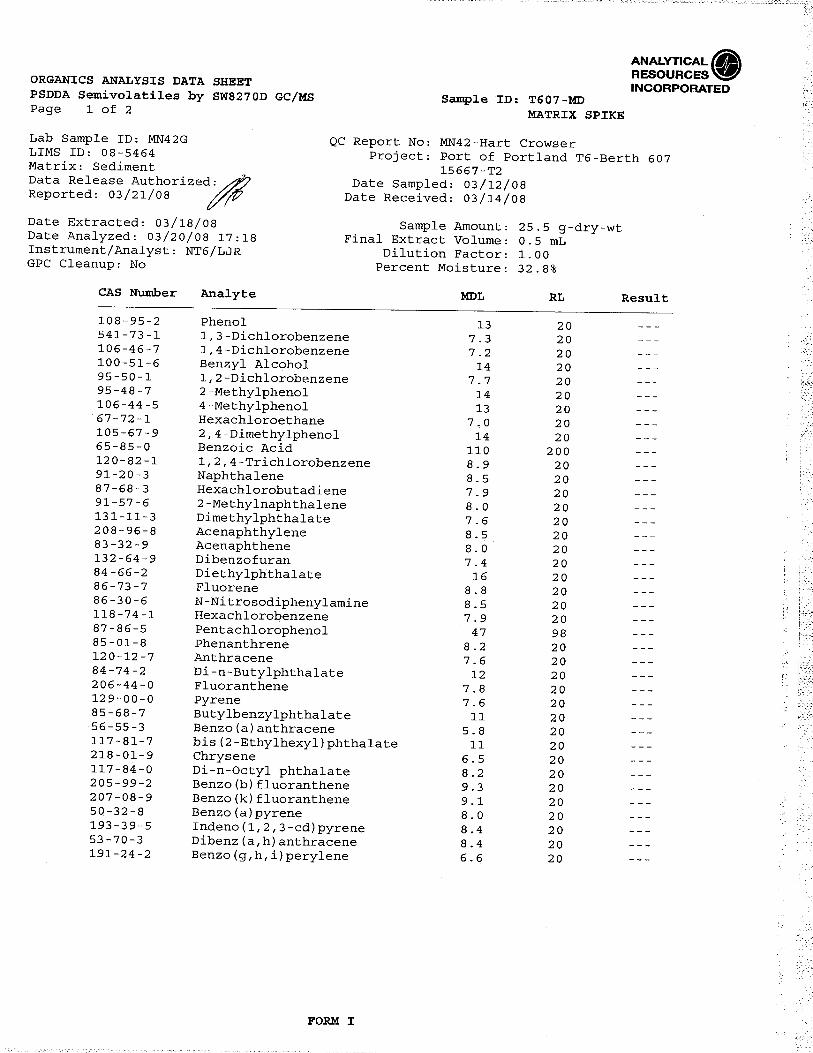
Method detection limits (MDLs) are the minimum concentration of a chemical compound that can be measured and reported that the compound is present, and is based on instrumentation abilities and sample matrix. MRLs are set by the laboratory and are based on the low standard of the initial calibration curve or low-level calibration check standard, and represent the concentration that can be accurately quantified. In some cases, the MRL is raised due to high concentrations of analytes in the samples or matrix interferences. MRLs were consistent with industry standards.
Table 4 of this report lists the MRLs for undetected samples. For the majority of compounds, MRLs were below Sediment Evaluation Framework (SEF) screening levels (SLs). For dieldrin, heptachlor, and hexachlorobutadiene, their MRLs were above the SL; in these cases, their MDLs are also listed and are below their SLs. Upon review, MDLs and MRLs are sufficient in achieving SEF SLs. As presented in Appendix D, other SLs are available for screening sediment data; some of which are lower than SEF SLs. Additional MDLs are therefore indicated in Table D-1 for those compounds that have MRLs above one of these other SLs.
Hart Crowser Page B-2 15667-00 June 12, 2008
QA REVIEW RESULTS
The laboratory provided QC sample results, which underwent a QA review. QC samples were consistent with those specified in the SAP (Hart Crowser, 2008) to evaluate precision, accuracy, representativeness, comparability, and completeness. Upon review, the sample data and laboratory QC data were found to be suitable for their intended use in determining the chemical quality of sediments.
Physical and Chemical Analysis
The following section summarizes, by analyte or test, the results of our QA review of the analytical data.
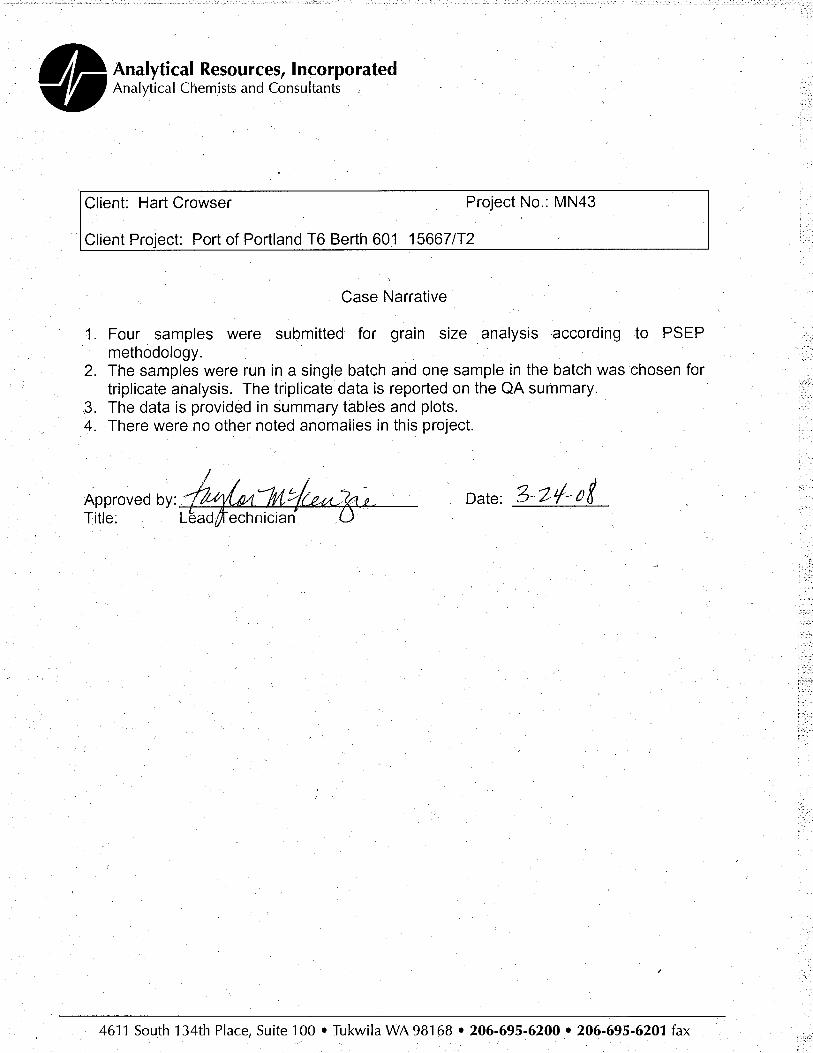
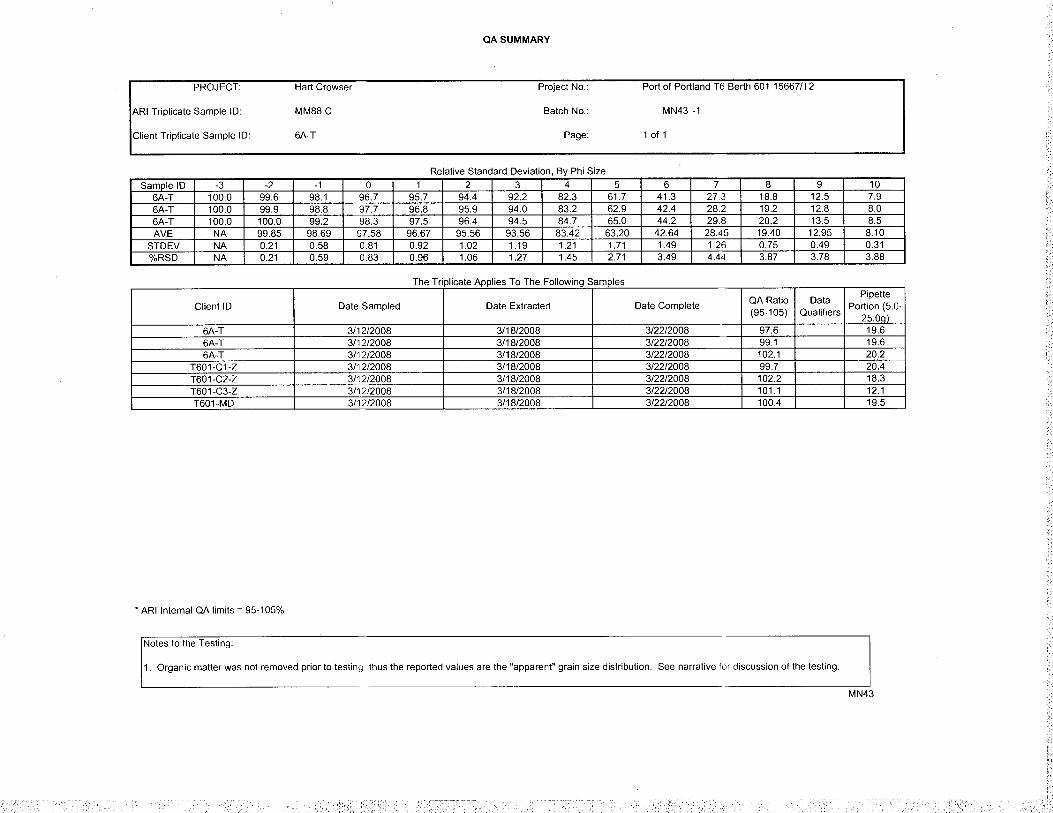
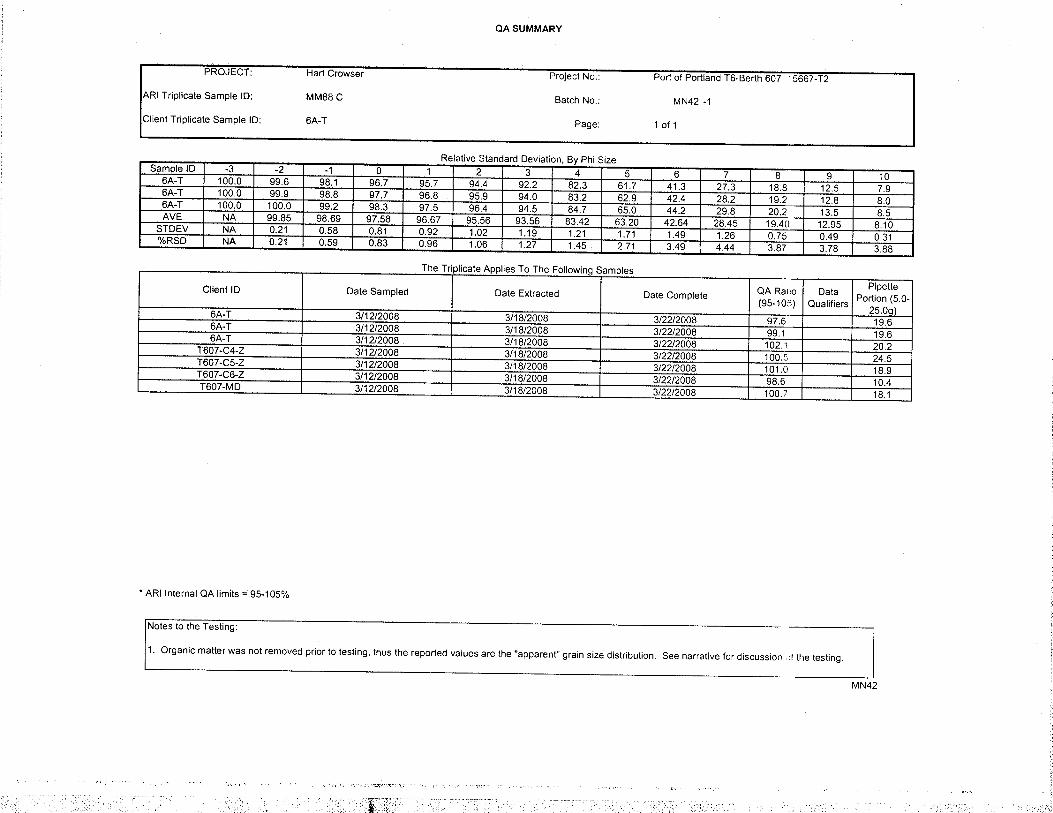
Grain Size. Holding times were met. Samples were run in one batch along with triplicate analyses on one sample. QA ratios were acceptable. Results were reported to 0.1 percent for each sieve fraction. The laboratory noted that samples might contain organic matter, so the reported values are the “apparent” grain size distribution.
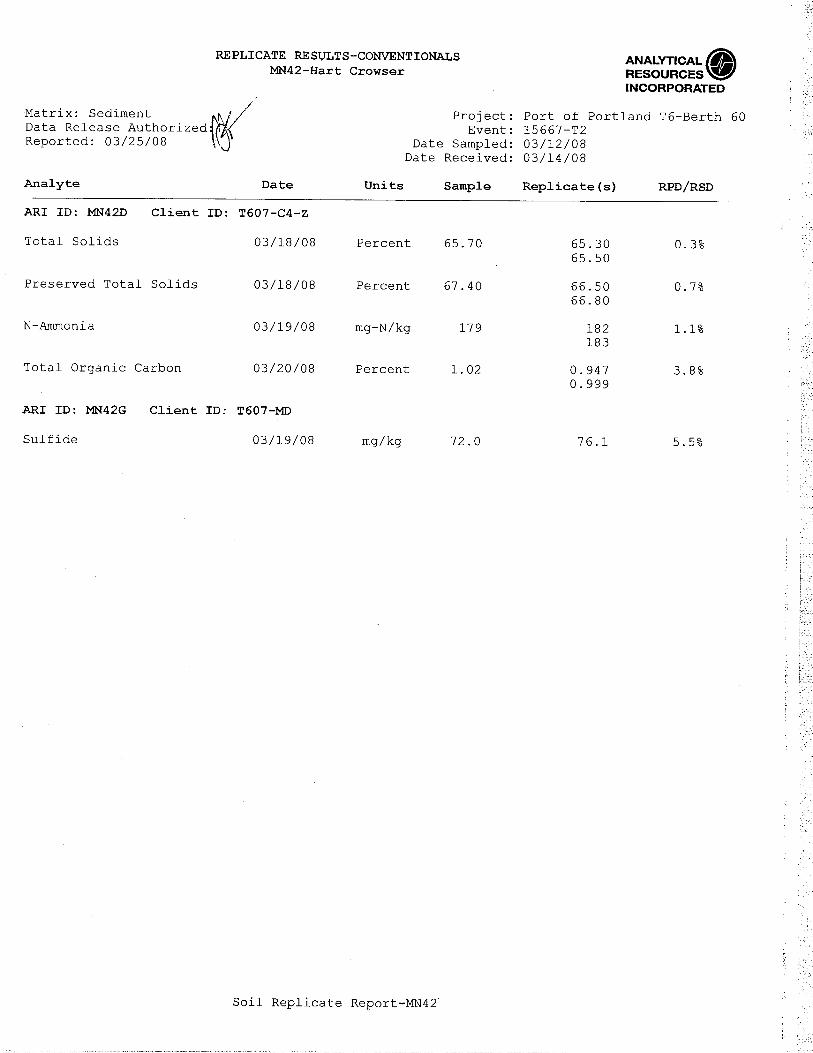
Total Solids. Holding times were met. No method blank contamination was detected. The laboratory duplicate RPD, reported for the Berth 607 analyses, was acceptable (samples from Berth 601 were also analyzed with Berth 607 samples).
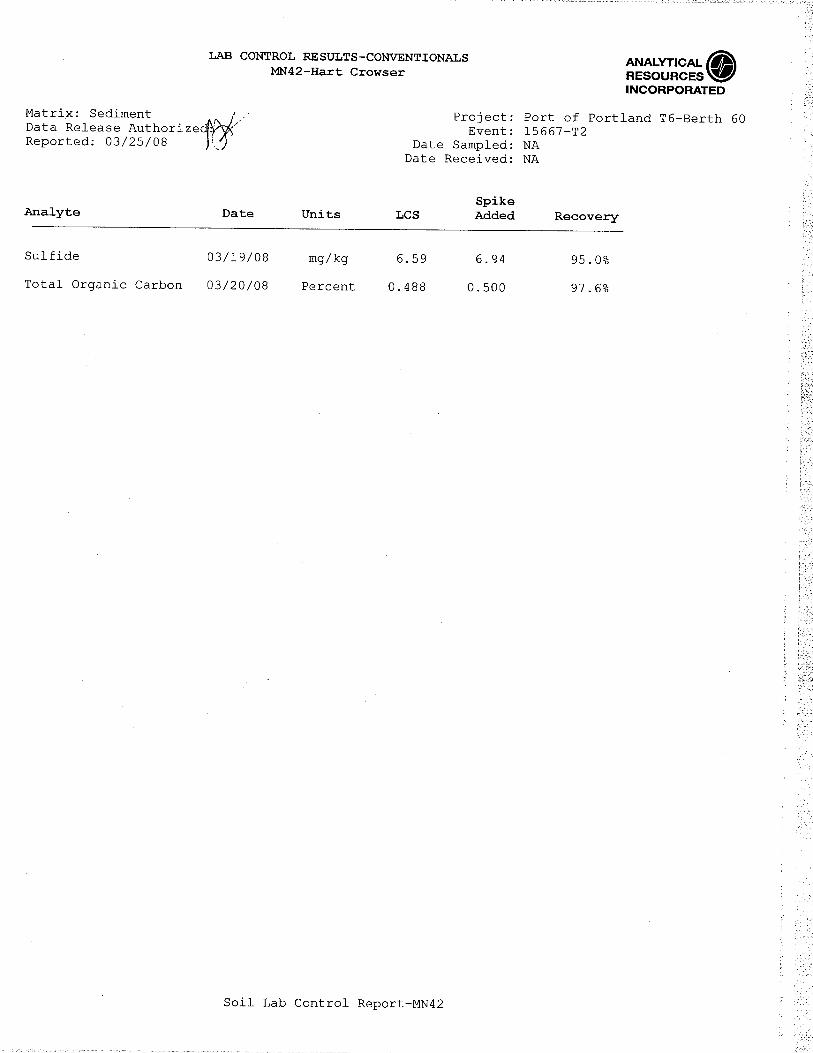
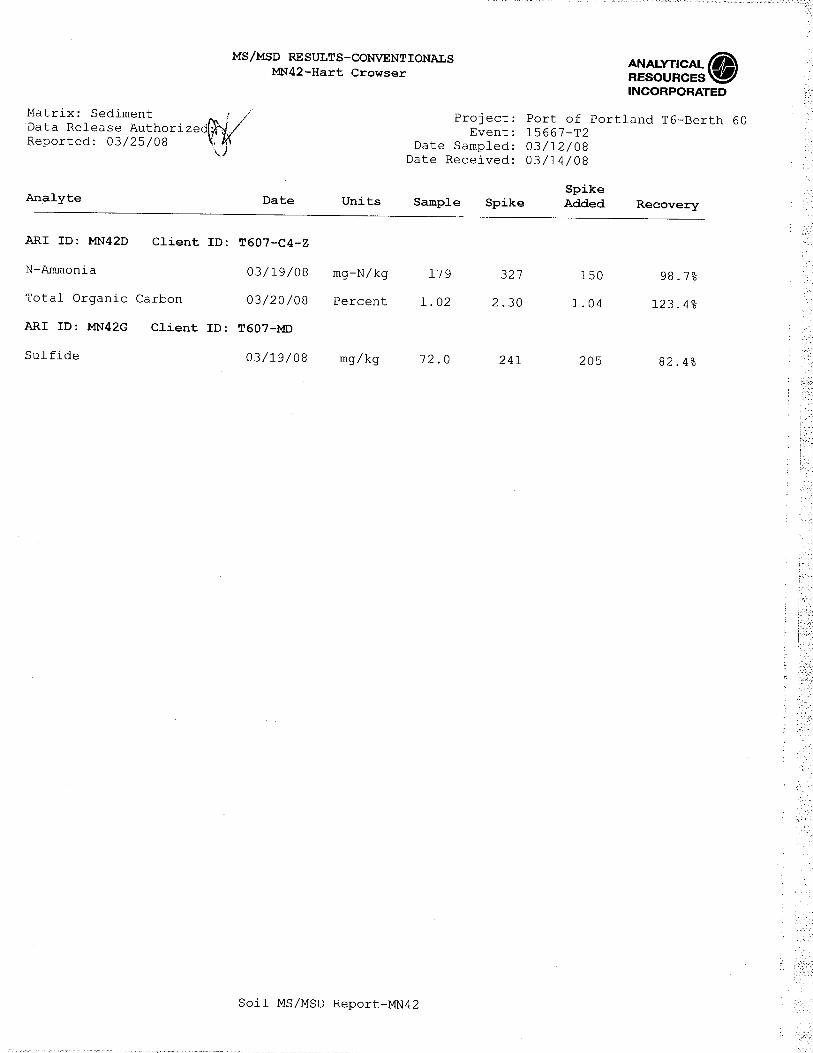
TOC. Holding times were met. No method blank contamination was detected. The LCS and SRM recoveries were within control limits. The MS recovery and the laboratory duplicate RPD, reported for the Berth 607 analyses, were acceptable (samples from Berth 601 were also analyzed with Berth 607 samples).
Ammonia. Holding times were met. No method blank contamination was detected. The SRM recovery was within control limits. The MS recovery and the laboratory duplicate RPD, reported for the Berth 607 analyses, were acceptable (samples from Berth 601 were also analyzed with Berth 607 samples).
Sulfide. Holding times were met. No method blank contamination was detected. The LCS and SRM recoveries were within control limits. MS recovery and the laboratory duplicate RPD, reported for the Berth 607 analyses, were acceptable (samples from Berth 601 were also analyzed with Berth 607 samples).
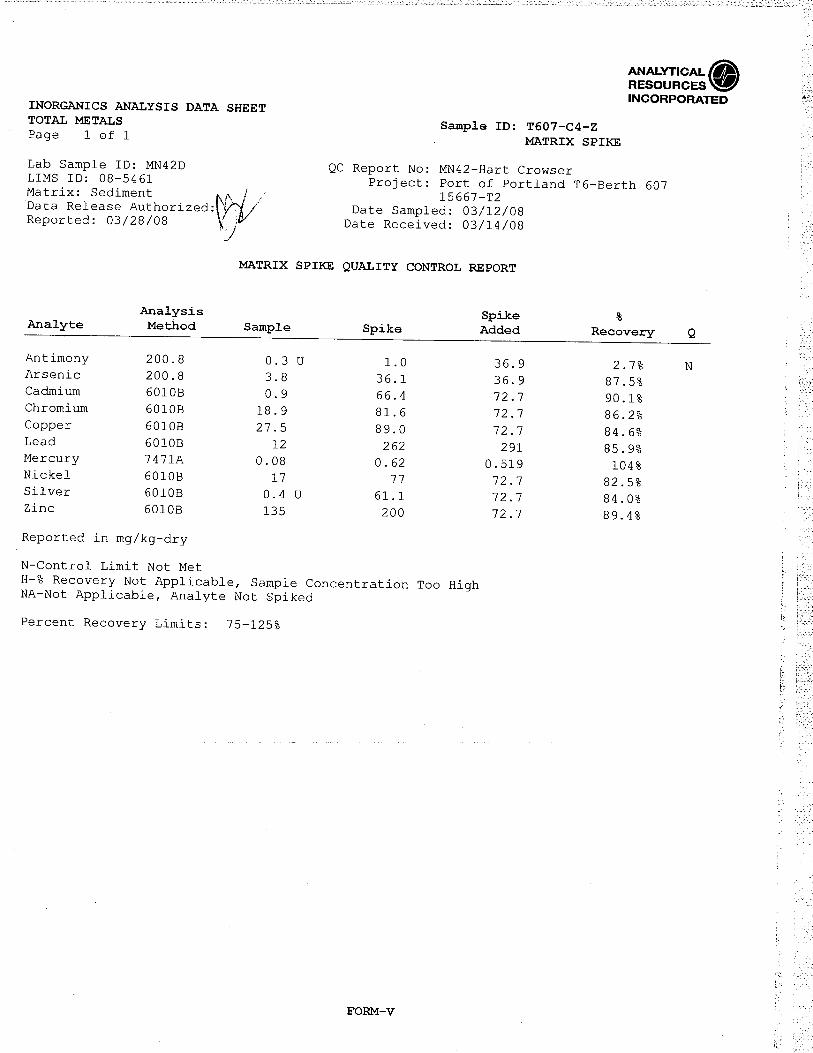
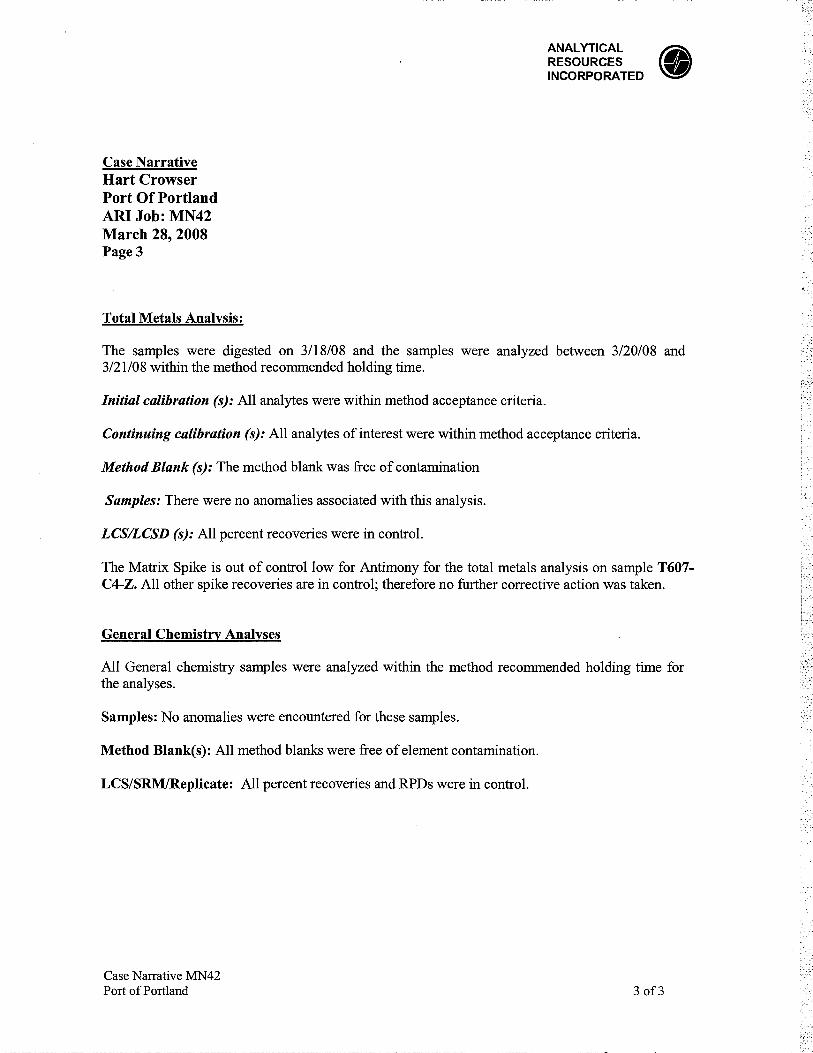
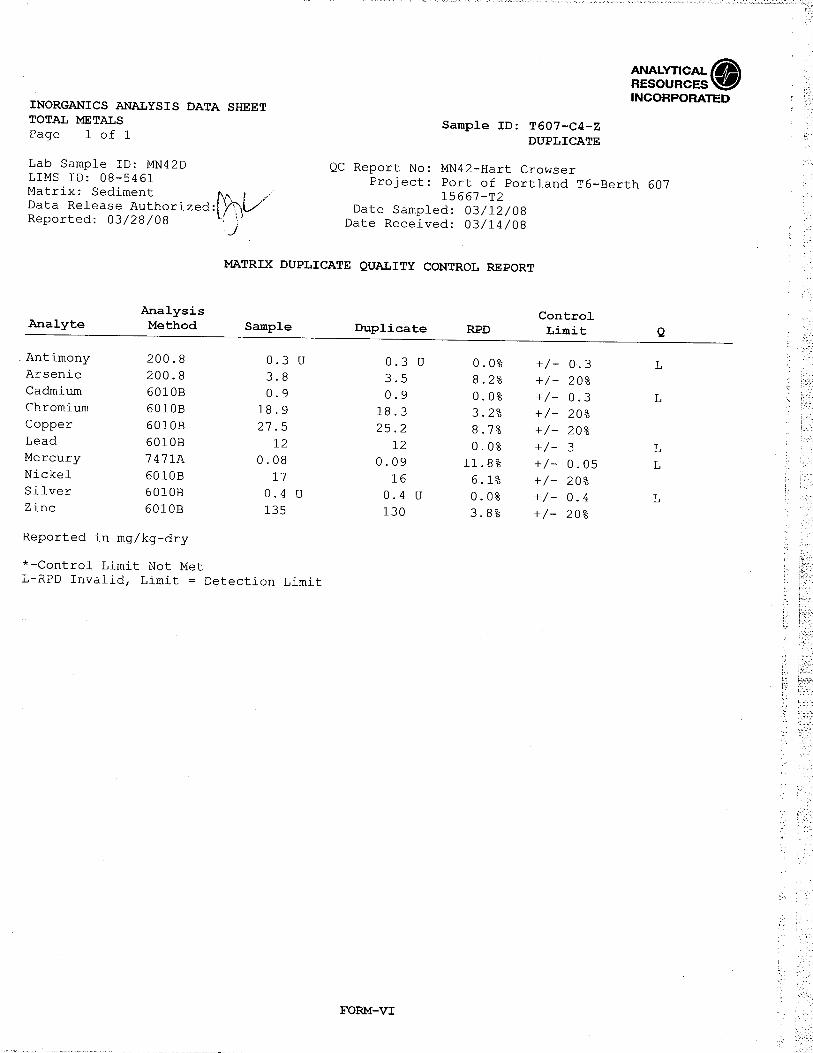
Total Metals. Holding times were met. No method blank contamination was detected. LCS recoveries were within control limits for all elements. MS recoveries were within control limits with the following exception: antimony had a low recovery (2.7 percent). Results for antimony in the associated samples were qualified as estimated (UJ). The laboratory duplicate RPD was acceptable.
Hart Crowser Page B-3 15667-00 June 12, 2008
ARI indicated in its case narrative that initial and continuing calibrations were within acceptance criteria for both reports.
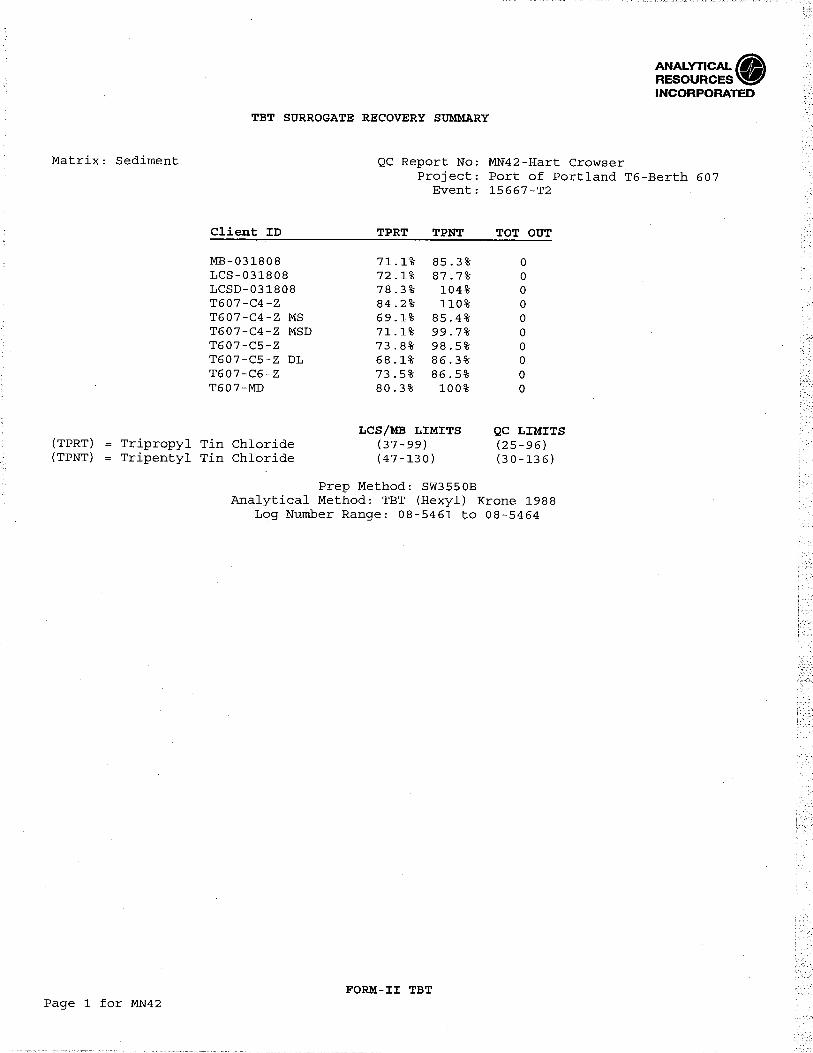
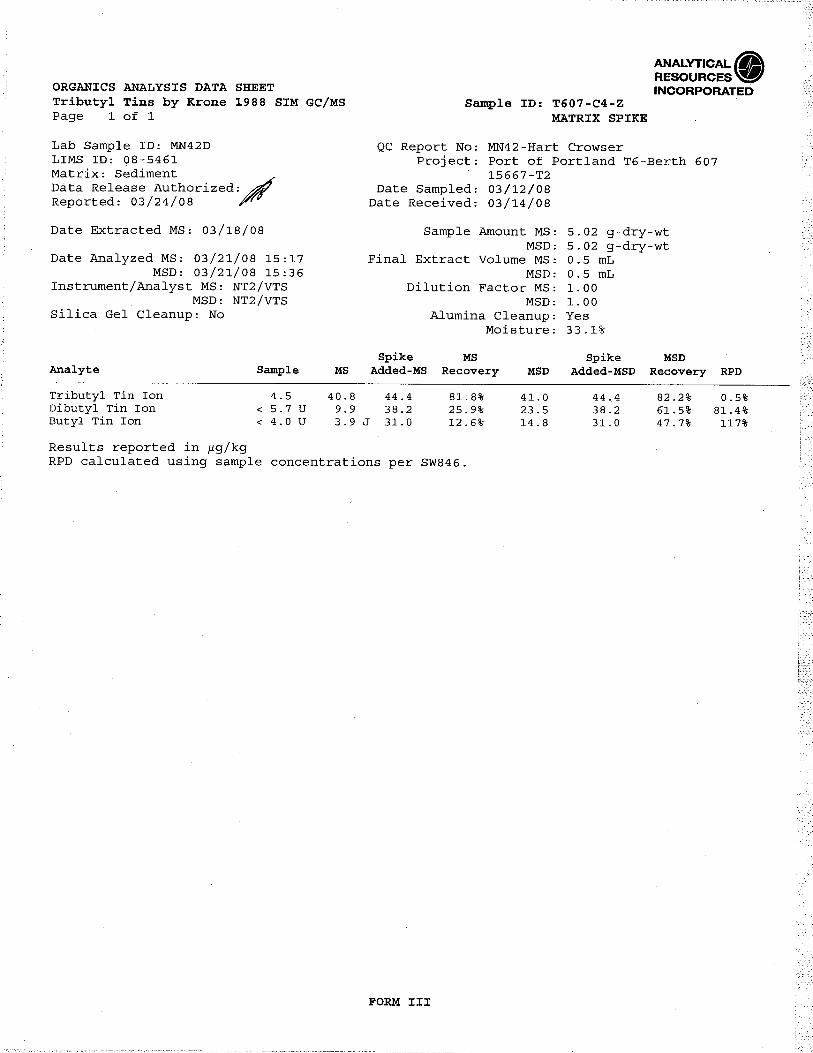
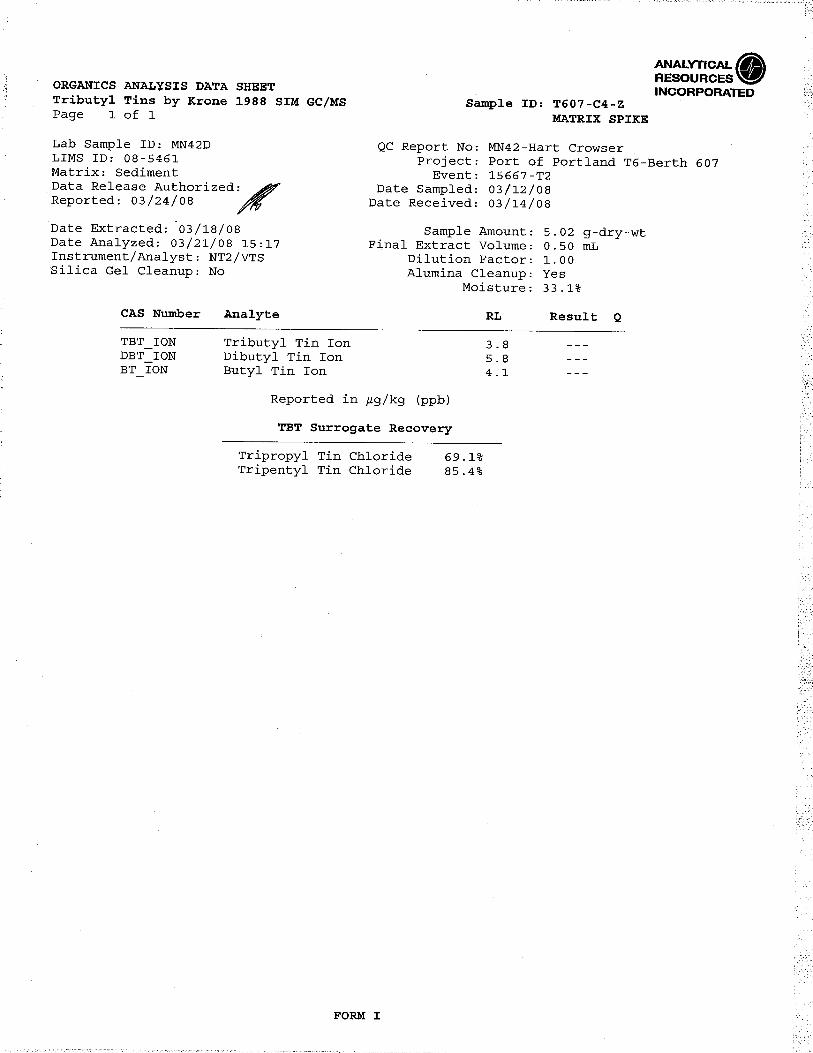
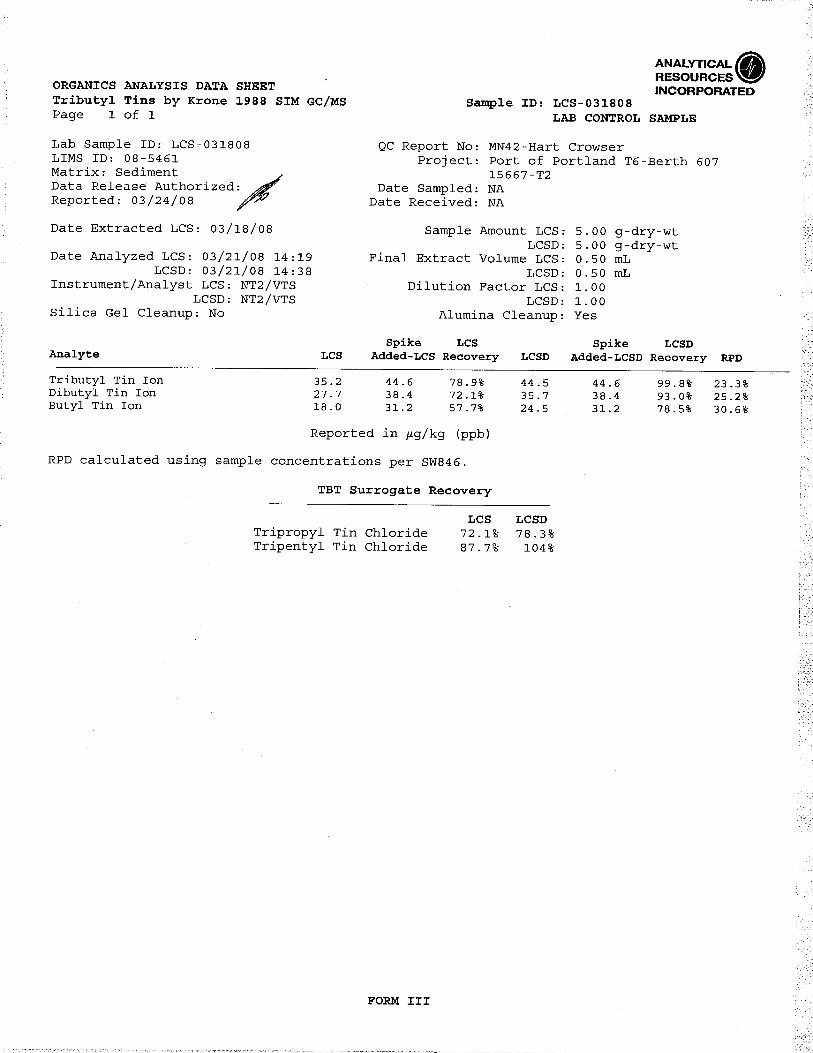
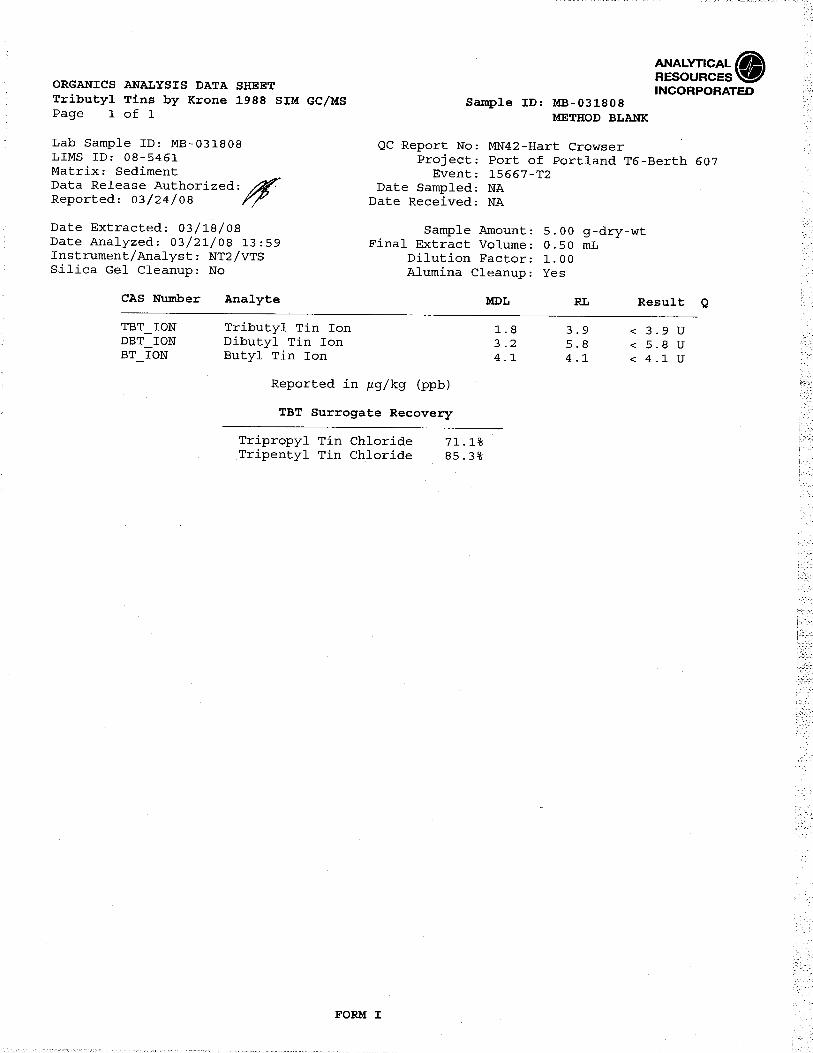
Tributyltin. Holding times were met. No method blank contamination was detected. Surrogate and LCS recoveries were within laboratory control limits. MS recoveries were within laboratory control limits for TBT; however, recoveries for dibutyltin and butyltin were below the control limits for the MS, but within the control limits for the MSD. As the compounds were not target analytes, no samples were qualified. ARI indicated in its case narrative that initial and continuing calibrations were within acceptance criteria.
PAHs. Holding times were met. No method blank contamination was detected. Surrogate, LCS, and MS recoveries were within laboratory control limits. ARI indicated in its case narrative that initial and continuing calibrations were within acceptance criteria.
SVOCs. Holding times were met. No method blank contamination was detected. Surrogate, LCS, and MS recoveries were within laboratory control limits. ARI indicated in its case narrative that initial and continuing calibrations were within acceptance criteria.
Organochlorine Pesticides. Holding times were met. No method blank contamination was detected. Surrogate, LCS, and MS recoveries were within laboratory control limits. ARI indicated in its case narrative that initial and continuing calibrations were within acceptance criteria.
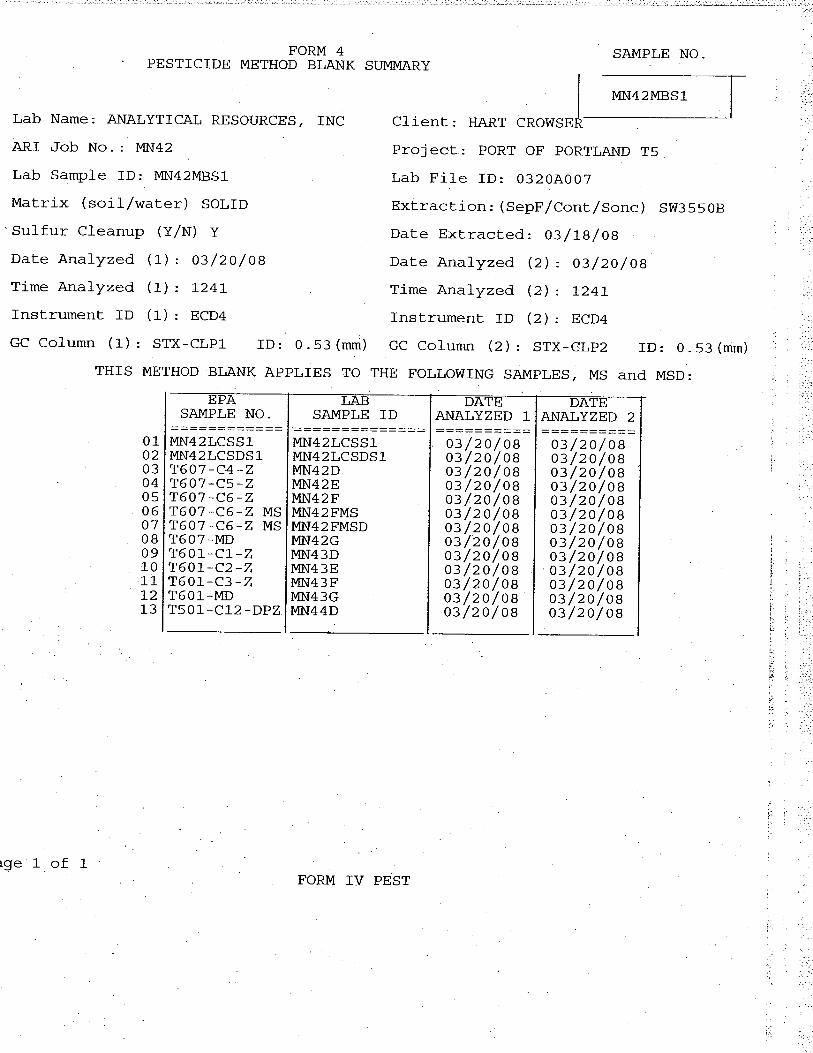
PCBs. Holding times were met. No method blank contamination was detected. Surrogate, LCS, and MS recoveries were within laboratory control limits. ARI indicated in its case narrative that initial and continuing calibrations were within acceptance criteria.
Sample Integrity
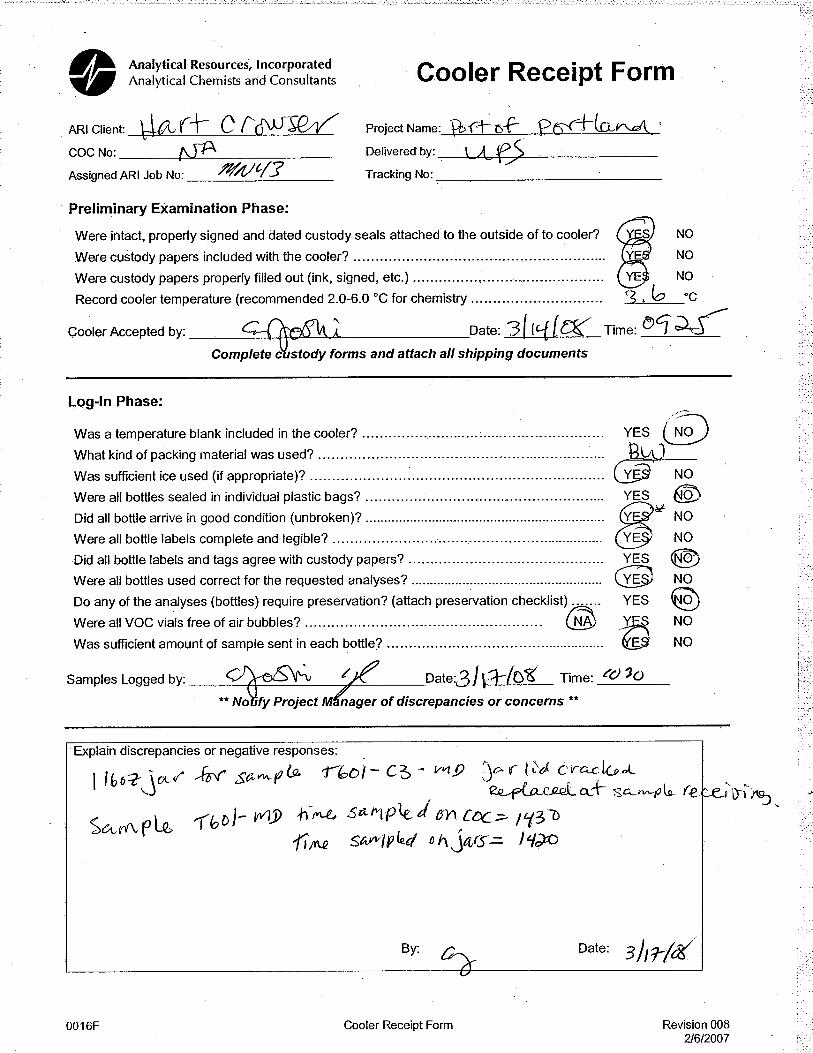
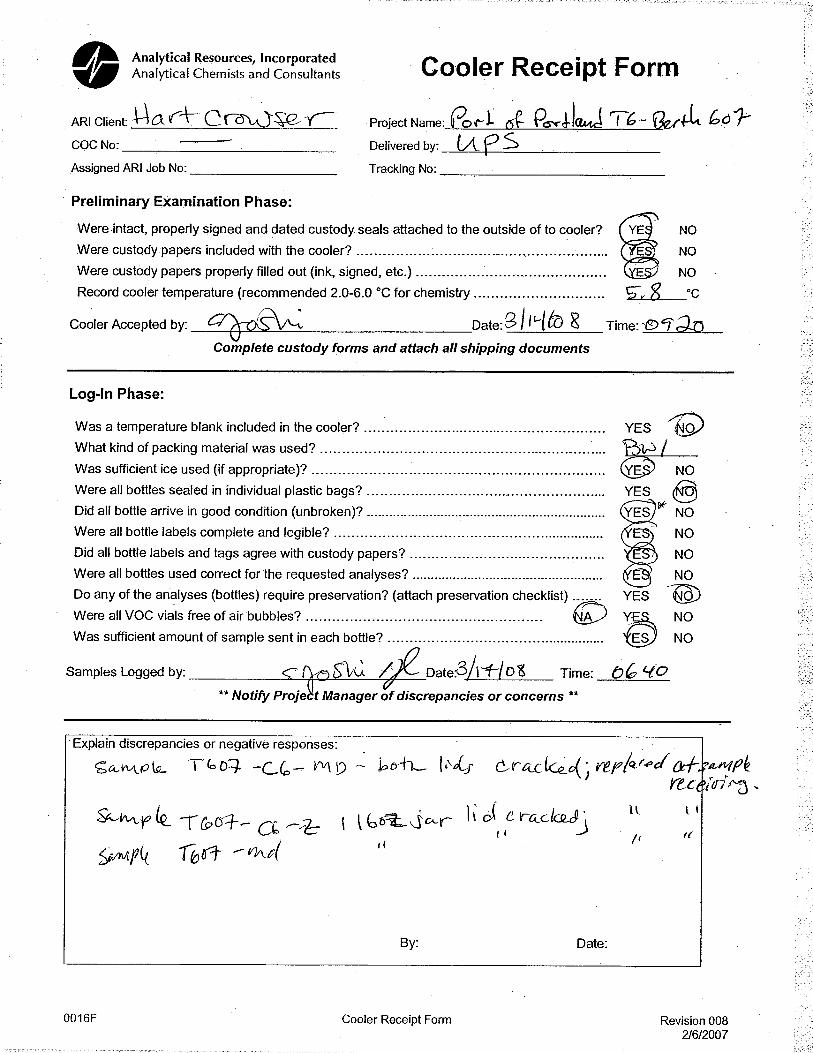
Samples were collected in accordance with the SAP, following quality control procedures to ensure that sample data were representative of site conditions. Samples were sent via overnight courier to ARI for analysis. Chain of custody was maintained at all times. When received by the laboratory, the receiving temperature of the cooler was within the 2 to 6 °C acceptance criteria. Samples T601-C3-MD, T607-C6-MD, T607-C6-Z, and T607-MD, were received at the laboratory with cracked jar lids. The lids were replaced at the laboratory, and no samples were qualified. Sediment samples that were not analyzed were archived (frozen) at the time of receipt at ARI.
Hart Crowser Page B-4 15667-00 June 12, 2008
Sheet 1 of 2
Table B-1 - QA1 Data ChecklistTerminal 6 Sediment CharacterizationN Marine Drive, Portland, Oregon
TestSediment
ReferenceSediment
ControlSediment
WaterControl
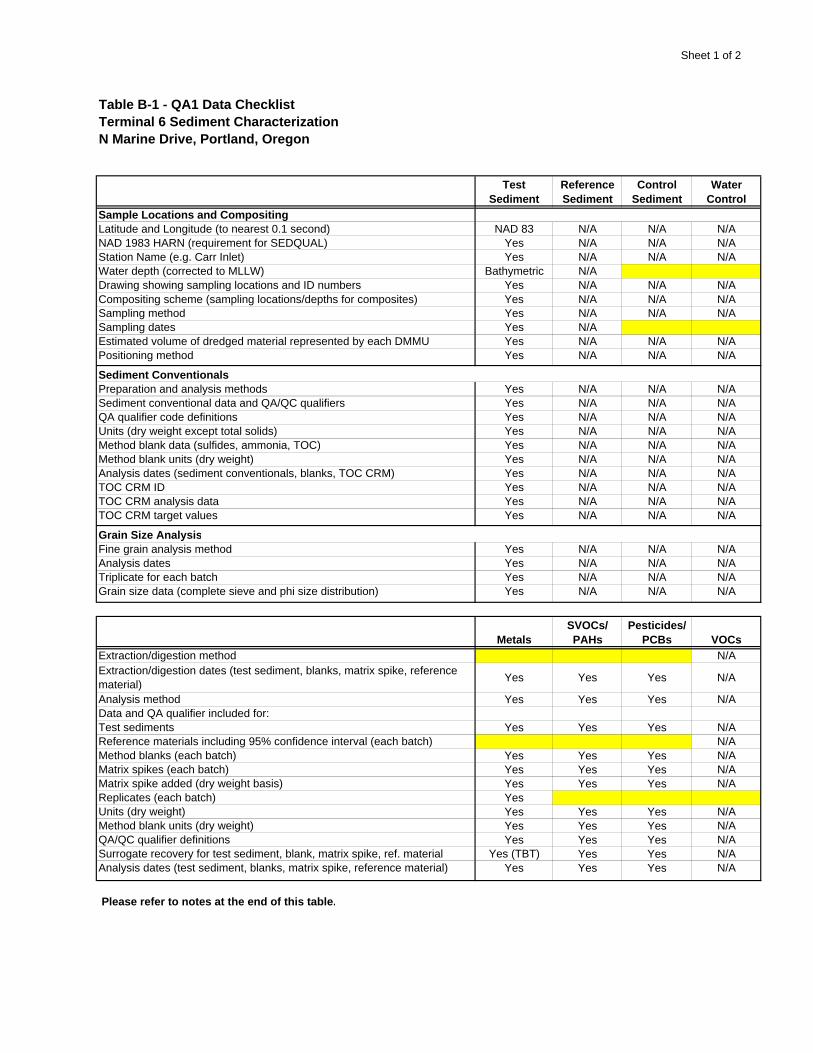
Sample Locations and CompositingLatitude and Longitude (to nearest 0.1 second) NAD 83 N/A N/A N/ANAD 1983 HARN (requirement for SEDQUAL) Yes N/A N/A N/AStation Name (e.g. Carr Inlet) Yes N/A N/A N/AWater depth (corrected to MLLW) Bathymetric N/ADrawing showing sampling locations and ID numbers Yes N/A N/A N/ACompositing scheme (sampling locations/depths for composites) Yes N/A N/A N/ASampling method Yes N/A N/A N/ASampling dates Yes N/AEstimated volume of dredged material represented by each DMMU Yes N/A N/A N/APositioning method Yes N/A N/A N/A
Sediment ConventionalsPreparation and analysis methods Yes N/A N/A N/ASediment conventional data and QA/QC qualifiers Yes N/A N/A N/AQA qualifier code definitions Yes N/A N/A N/AUnits (dry weight except total solids) Yes N/A N/A N/AMethod blank data (sulfides, ammonia, TOC) Yes N/A N/A N/AMethod blank units (dry weight) Yes N/A N/A N/AAnalysis dates (sediment conventionals, blanks, TOC CRM) Yes N/A N/A N/ATOC CRM ID Yes N/A N/A N/ATOC CRM analysis data Yes N/A N/A N/ATOC CRM target values Yes N/A N/A N/A
Grain Size AnalysisFine grain analysis method Yes N/A N/A N/AAnalysis dates Yes N/A N/A N/ATriplicate for each batch Yes N/A N/A N/AGrain size data (complete sieve and phi size distribution) Yes N/A N/A N/A
MetalsSVOCs/PAHs
Pesticides/PCBs VOCs
Extraction/digestion method N/AExtraction/digestion dates (test sediment, blanks, matrix spike, reference material) Yes Yes Yes N/A
Analysis method Yes Yes Yes N/AData and QA qualifier included for:Test sediments Yes Yes Yes N/AReference materials including 95% confidence interval (each batch) N/AMethod blanks (each batch) Yes Yes Yes N/AMatrix spikes (each batch) Yes Yes Yes N/AMatrix spike added (dry weight basis) Yes Yes Yes N/AReplicates (each batch) YesUnits (dry weight) Yes Yes Yes N/AMethod blank units (dry weight) Yes Yes Yes N/AQA/QC qualifier definitions Yes Yes Yes N/ASurrogate recovery for test sediment, blank, matrix spike, ref. material Yes (TBT) Yes Yes N/AAnalysis dates (test sediment, blanks, matrix spike, reference material) Yes Yes Yes N/A
Please refer to notes at the end of this table.
Sheet 2 of 2
Table B-1 - QA1 Data ChecklistTerminal 2 Sediment CharacterizationPortland, Oregon
Notes:QA Checklist based on Figures 12-2 and 12-3 of the SEF (Corps, et al., 2006).Shaded boxes indicated those type of data are not applicable for that column.N/A = Not applicable or not analyzed.
Acronyms and Abbreviations:CRM = Control Reference MaterialDMMU = Dredge Material Management UnitMLLW = Mean lower low waterNAD = North American DatumPAHs = Polynuclear aromatic hydrocarbonsPCBs = Polychlorinated biphenylsQA = Quality assuranceQC = Quality controlSEF = Sediment evaluation frameworkSVOCs = Semivolatile organic compoundsTBT = TributyltinTOC = Total organic carbonVOCs = Volatile organic compounds
Hart Crowser 15667-00 June 12, 2008
APPENDIX C ANALYTICAL LABORATORY REPORTS


Hart Crowser 15667-00 June 12, 2008
APPENDIX D ADDITIONAL SCREENING CRITERIA TABLE
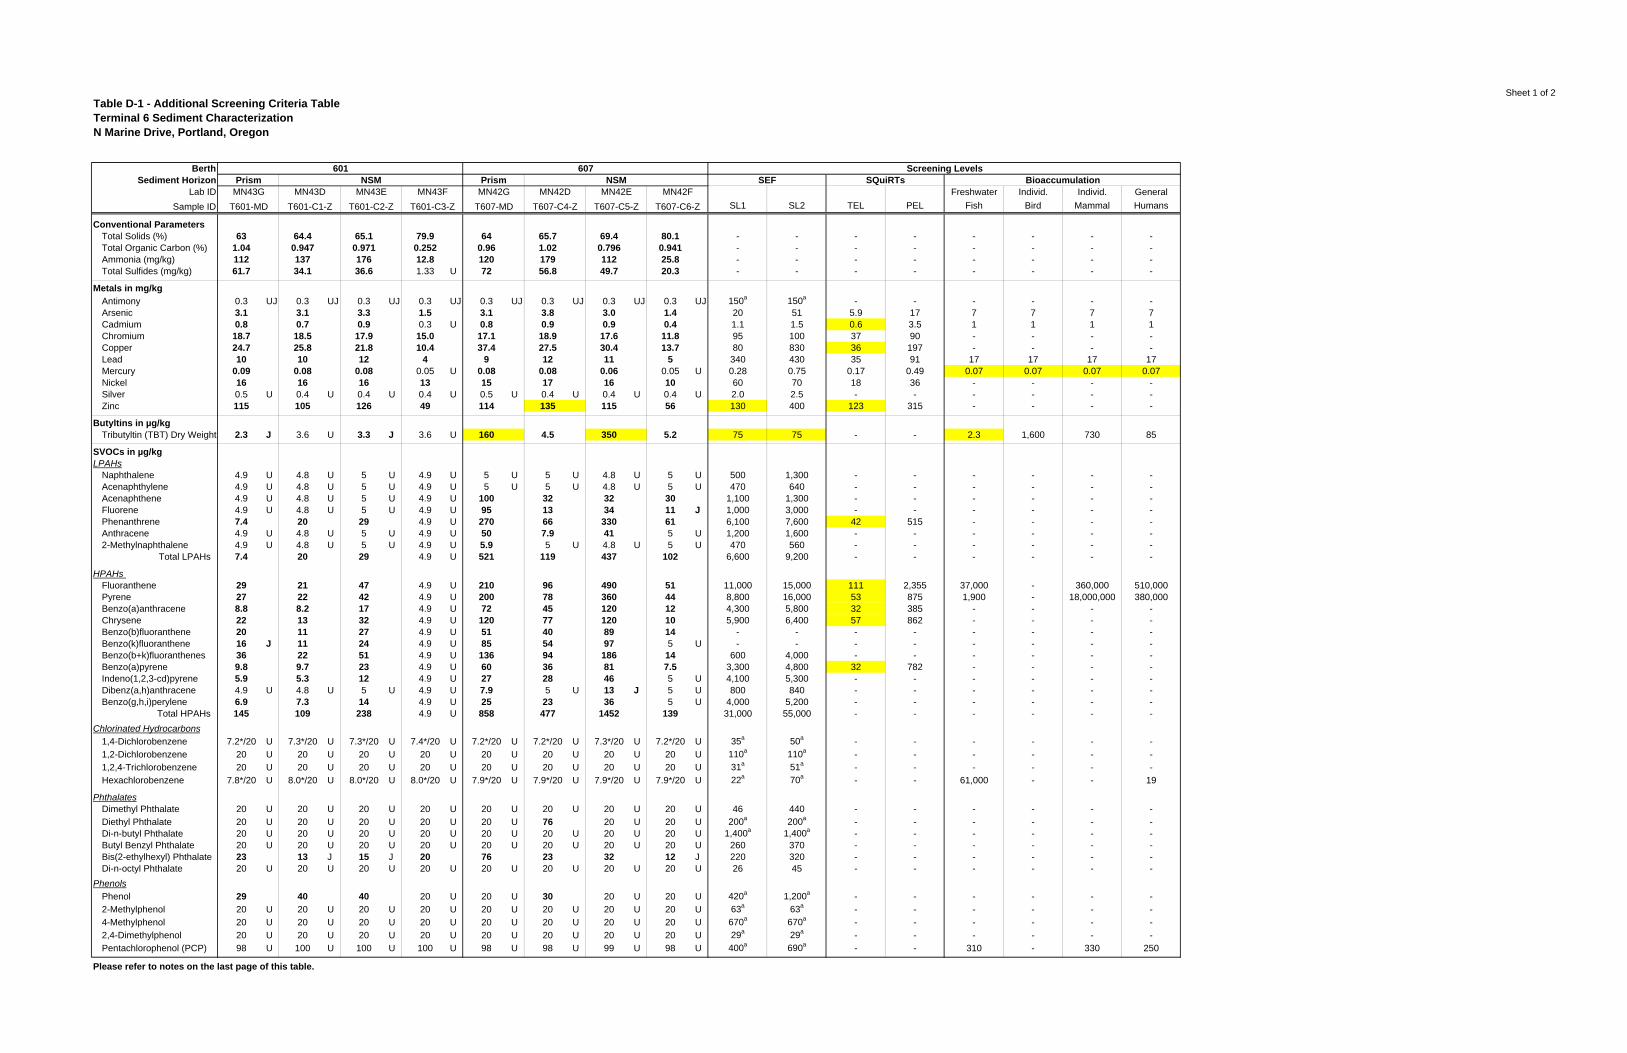
Sheet 1 of 2Table D-1 - Additional Screening Criteria TableTerminal 6 Sediment CharacterizationN Marine Drive, Portland, Oregon
Berth Screening LevelsSediment Horizon SEF SQuiRTs Bioaccumulation
Lab ID Freshwater Individ. Individ. GeneralSample ID SL1 SL2 TEL PEL Fish Bird Mammal Humans
Conventional ParametersTotal Solids (%) 63 64.4 65.1 79.9 64 65.7 69.4 80.1 - - - - - - - -Total Organic Carbon (%) 1.04 0.947 0.971 0.252 0.96 1.02 0.796 0.941 - - - - - - - -Ammonia (mg/kg) 112 137 176 12.8 120 179 112 25.8 - - - - - - - -Total Sulfides (mg/kg) 61.7 34.1 36.6 1.33 U 72 56.8 49.7 20.3 - - - - - - - -
Metals in mg/kgAntimony 0.3 UJ 0.3 UJ 0.3 UJ 0.3 UJ 0.3 UJ 0.3 UJ 0.3 UJ 0.3 UJ 150a 150a - - - - - -Arsenic 3.1 3.1 3.3 1.5 3.1 3.8 3.0 1.4 20 51 5.9 17 7 7 7 7Cadmium 0.8 0.7 0.9 0.3 U 0.8 0.9 0.9 0.4 1.1 1.5 0.6 3.5 1 1 1 1Chromium 18.7 18.5 17.9 15.0 17.1 18.9 17.6 11.8 95 100 37 90 - - - -Copper 24.7 25.8 21.8 10.4 37.4 27.5 30.4 13.7 80 830 36 197 - - - -Lead 10 10 12 4 9 12 11 5 340 430 35 91 17 17 17 17Mercury 0.09 0.08 0.08 0.05 U 0.08 0.08 0.06 0.05 U 0.28 0.75 0.17 0.49 0.07 0.07 0.07 0.07Nickel 16 16 16 13 15 17 16 10 60 70 18 36 - - - -Silver 0.5 U 0.4 U 0.4 U 0.4 U 0.5 U 0.4 U 0.4 U 0.4 U 2.0 2.5 - - - - - -Zinc 115 105 126 49 114 135 115 56 130 400 123 315 - - - -
Butyltins in µg/kgTributyltin (TBT) Dry Weight 2.3 J 3.6 U 3.3 J 3.6 U 160 4.5 350 5.2 75 75 - - 2.3 1,600 730 85
SVOCs in µg/kg LPAHs
Naphthalene 4.9 U 4.8 U 5 U 4.9 U 5 U 5 U 4.8 U 5 U 500 1,300 - - - - - -Acenaphthylene 4.9 U 4.8 U 5 U 4.9 U 5 U 5 U 4.8 U 5 U 470 640 - - - - - -Acenaphthene 4.9 U 4.8 U 5 U 4.9 U 100 32 32 30 1,100 1,300 - - - - - -Fluorene 4.9 U 4.8 U 5 U 4.9 U 95 13 34 11 J 1,000 3,000 - - - - - -Phenanthrene 7.4 20 29 4.9 U 270 66 330 61 6,100 7,600 42 515 - - - -Anthracene 4.9 U 4.8 U 5 U 4.9 U 50 7.9 41 5 U 1,200 1,600 - - - - - -2-Methylnaphthalene 4.9 U 4.8 U 5 U 4.9 U 5.9 5 U 4.8 U 5 U 470 560 - - - - - -
Total LPAHs 7.4 20 29 4.9 U 521 119 437 102 6,600 9,200 - - - - - -
HPAHs Fluoranthene 29 21 47 4.9 U 210 96 490 51 11,000 15,000 111 2,355 37,000 - 360,000 510,000Pyrene 27 22 42 4.9 U 200 78 360 44 8,800 16,000 53 875 1,900 - 18,000,000 380,000Benzo(a)anthracene 8.8 8.2 17 4.9 U 72 45 120 12 4,300 5,800 32 385 - - - -Chrysene 22 13 32 4.9 U 120 77 120 10 5,900 6,400 57 862 - - - -Benzo(b)fluoranthene 20 11 27 4.9 U 51 40 89 14 - - - - - - - -Benzo(k)fluoranthene 16 J 11 24 4.9 U 85 54 97 5 U - - - - - - - -Benzo(b+k)fluoranthenes 36 22 51 4.9 U 136 94 186 14 600 4,000 - - - - - -Benzo(a)pyrene 9.8 9.7 23 4.9 U 60 36 81 7.5 3,300 4,800 32 782 - - - -Indeno(1,2,3-cd)pyrene 5.9 5.3 12 4.9 U 27 28 46 5 U 4,100 5,300 - - - - - -Dibenz(a,h)anthracene 4.9 U 4.8 U 5 U 4.9 U 7.9 5 U 13 J 5 U 800 840 - - - - - -Benzo(g,h,i)perylene 6.9 7.3 14 4.9 U 25 23 36 5 U 4,000 5,200 - - - - - -
Total HPAHs 145 109 238 4.9 U 858 477 1452 139 31,000 55,000 - - - - - -Chlorinated Hydrocarbons
1,4-Dichlorobenzene 7.2*/20 U 7.3*/20 U 7.3*/20 U 7.4*/20 U 7.2*/20 U 7.2*/20 U 7.3*/20 U 7.2*/20 U 35a 50a - - - - - -1,2-Dichlorobenzene 20 U 20 U 20 U 20 U 20 U 20 U 20 U 20 U 110a 110a - - - - - -1,2,4-Trichlorobenzene 20 U 20 U 20 U 20 U 20 U 20 U 20 U 20 U 31a 51a - - - - - -Hexachlorobenzene 7.8*/20 U 8.0*/20 U 8.0*/20 U 8.0*/20 U 7.9*/20 U 7.9*/20 U 7.9*/20 U 7.9*/20 U 22a 70a - - 61,000 - - 19
PhthalatesDimethyl Phthalate 20 U 20 U 20 U 20 U 20 U 20 U 20 U 20 U 46 440 - - - - - -Diethyl Phthalate 20 U 20 U 20 U 20 U 20 U 76 20 U 20 U 200a 200a - - - - - -Di-n-butyl Phthalate 20 U 20 U 20 U 20 U 20 U 20 U 20 U 20 U 1,400a 1,400a - - - - - -Butyl Benzyl Phthalate 20 U 20 U 20 U 20 U 20 U 20 U 20 U 20 U 260 370 - - - - - -Bis(2-ethylhexyl) Phthalate 23 13 J 15 J 20 76 23 32 12 J 220 320 - - - - - -Di-n-octyl Phthalate 20 U 20 U 20 U 20 U 20 U 20 U 20 U 20 U 26 45 - - - - - -
PhenolsPhenol 29 40 40 20 U 20 U 30 20 U 20 U 420a 1,200a - - - - - -2-Methylphenol 20 U 20 U 20 U 20 U 20 U 20 U 20 U 20 U 63a 63a - - - - - -4-Methylphenol 20 U 20 U 20 U 20 U 20 U 20 U 20 U 20 U 670a 670a - - - - - -2,4-Dimethylphenol 20 U 20 U 20 U 20 U 20 U 20 U 20 U 20 U 29a 29a - - - - - -Pentachlorophenol (PCP) 98 U 100 U 100 U 100 U 98 U 98 U 99 U 98 U 400a 690a - - 310 - 330 250
Please refer to notes on the last page of this table.
601 607NSM NSMPrism Prism
T601-C2-ZT601-C1-ZT601-MDMN43G MN43D MN43E MN42F
T601-C3-Z T607-C6-ZT607-C5-ZT607-C4-ZT607-MDMN43F MN42G MN42D MN42E
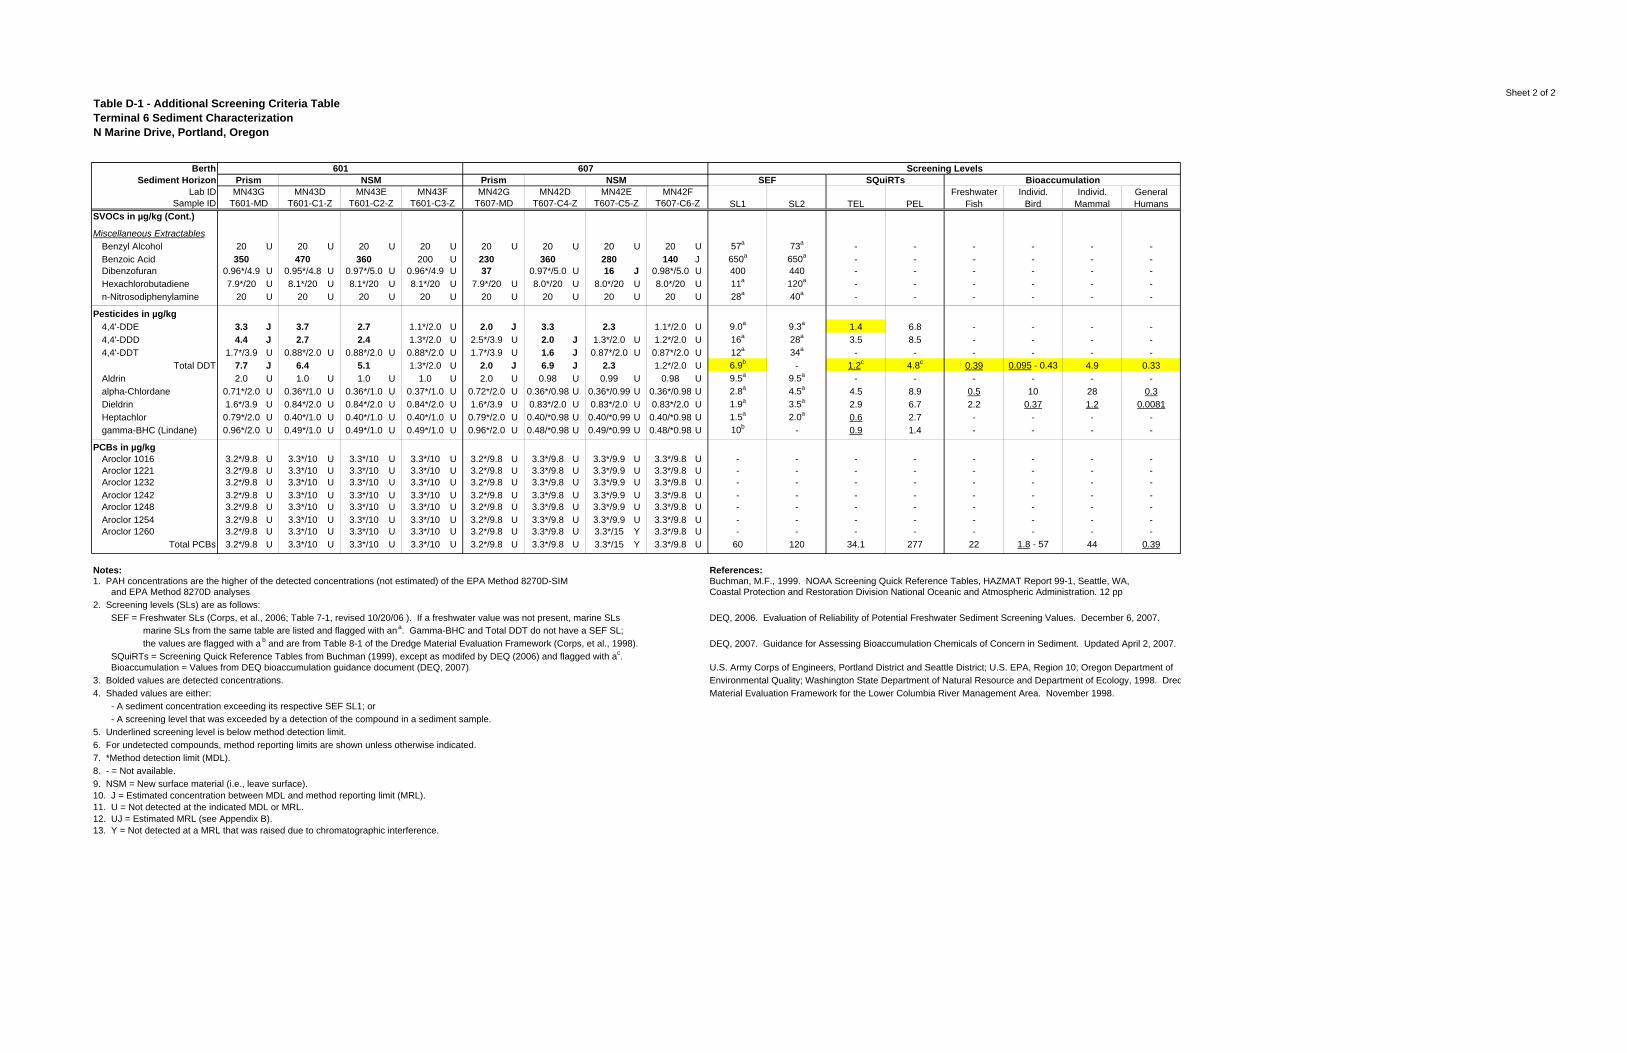
Sheet 2 of 2Table D-1 - Additional Screening Criteria TableTerminal 6 Sediment CharacterizationN Marine Drive, Portland, Oregon
Berth Screening LevelsSediment Horizon SEF SQuiRTs Bioaccumulation
Lab ID Freshwater Individ. Individ. GeneralSample ID SL1 SL2 TEL PEL Fish Bird Mammal Humans
SVOCs in µg/kg (Cont.)
Miscellaneous ExtractablesBenzyl Alcohol 20 U 20 U 20 U 20 U 20 U 20 U 20 U 20 U 57a 73a - - - - - -Benzoic Acid 350 470 360 200 U 230 360 280 140 J 650a 650a - - - - - -Dibenzofuran 0.96*/4.9 U 0.95*/4.8 U 0.97*/5.0 U 0.96*/4.9 U 37 0.97*/5.0 U 16 J 0.98*/5.0 U 400 440 - - - - - -Hexachlorobutadiene 7.9*/20 U 8.1*/20 U 8.1*/20 U 8.1*/20 U 7.9*/20 U 8.0*/20 U 8.0*/20 U 8.0*/20 U 11a 120a - - - - - -n-Nitrosodiphenylamine 20 U 20 U 20 U 20 U 20 U 20 U 20 U 20 U 28a 40a - - - - - -
Pesticides in µg/kg4,4'-DDE 3.3 J 3.7 2.7 1.1*/2.0 U 2.0 J 3.3 2.3 1.1*/2.0 U 9.0a 9.3a 1.4 6.8 - - - -4,4'-DDD 4.4 J 2.7 2.4 1.3*/2.0 U 2.5*/3.9 U 2.0 J 1.3*/2.0 U 1.2*/2.0 U 16a 28a 3.5 8.5 - - - -4,4'-DDT 1.7*/3.9 U 0.88*/2.0 U 0.88*/2.0 U 0.88*/2.0 U 1.7*/3.9 U 1.6 J 0.87*/2.0 U 0.87*/2.0 U 12a 34a - - - - - -
Total DDT 7.7 J 6.4 5.1 1.3*/2.0 U 2.0 J 6.9 J 2.3 1.2*/2.0 U 6.9b - 1.2c 4.8c 0.39 0.095 - 0.43 4.9 0.33Aldrin 2.0 U 1.0 U 1.0 U 1.0 U 2.0 U 0.98 U 0.99 U 0.98 U 9.5a 9.5a - - - - - -alpha-Chlordane 0.71*/2.0 U 0.36*/1.0 U 0.36*/1.0 U 0.37*/1.0 U 0.72*/2.0 U 0.36*/0.98 U 0.36*/0.99 U 0.36*/0.98 U 2.8a 4.5a 4.5 8.9 0.5 10 28 0.3Dieldrin 1.6*/3.9 U 0.84*/2.0 U 0.84*/2.0 U 0.84*/2.0 U 1.6*/3.9 U 0.83*/2.0 U 0.83*/2.0 U 0.83*/2.0 U 1.9a 3.5a 2.9 6.7 2.2 0.37 1.2 0.0081Heptachlor 0.79*/2.0 U 0.40*/1.0 U 0.40*/1.0 U 0.40*/1.0 U 0.79*/2.0 U 0.40/*0.98 U 0.40/*0.99 U 0.40/*0.98 U 1.5a 2.0a 0.6 2.7 - - - -gamma-BHC (Lindane) 0.96*/2.0 U 0.49*/1.0 U 0.49*/1.0 U 0.49*/1.0 U 0.96*/2.0 U 0.48/*0.98 U 0.49/*0.99 U 0.48/*0.98 U 10b - 0.9 1.4 - - - -
PCBs in µg/kgAroclor 1016 3.2*/9.8 U 3.3*/10 U 3.3*/10 U 3.3*/10 U 3.2*/9.8 U 3.3*/9.8 U 3.3*/9.9 U 3.3*/9.8 U - - - - - - - -Aroclor 1221 3.2*/9.8 U 3.3*/10 U 3.3*/10 U 3.3*/10 U 3.2*/9.8 U 3.3*/9.8 U 3.3*/9.9 U 3.3*/9.8 U - - - - - - - -Aroclor 1232 3.2*/9.8 U 3.3*/10 U 3.3*/10 U 3.3*/10 U 3.2*/9.8 U 3.3*/9.8 U 3.3*/9.9 U 3.3*/9.8 U - - - - - - - -Aroclor 1242 3.2*/9.8 U 3.3*/10 U 3.3*/10 U 3.3*/10 U 3.2*/9.8 U 3.3*/9.8 U 3.3*/9.9 U 3.3*/9.8 U - - - - - - - -Aroclor 1248 3.2*/9.8 U 3.3*/10 U 3.3*/10 U 3.3*/10 U 3.2*/9.8 U 3.3*/9.8 U 3.3*/9.9 U 3.3*/9.8 U - - - - - - - -Aroclor 1254 3.2*/9.8 U 3.3*/10 U 3.3*/10 U 3.3*/10 U 3.2*/9.8 U 3.3*/9.8 U 3.3*/9.9 U 3.3*/9.8 U - - - - - - - -Aroclor 1260 3.2*/9.8 U 3.3*/10 U 3.3*/10 U 3.3*/10 U 3.2*/9.8 U 3.3*/9.8 U 3.3*/15 Y 3.3*/9.8 U - - - - - - - -
Total PCBs 3.2*/9.8 U 3.3*/10 U 3.3*/10 U 3.3*/10 U 3.2*/9.8 U 3.3*/9.8 U 3.3*/15 Y 3.3*/9.8 U 60 120 34.1 277 22 1.8 - 57 44 0.39
Notes: References:1. PAH concentrations are the higher of the detected concentrations (not estimated) of the EPA Method 8270D-SIM Buchman, M.F., 1999. NOAA Screening Quick Reference Tables, HAZMAT Report 99-1, Seattle, WA, and EPA Method 8270D analyses. Coastal Protection and Restoration Division National Oceanic and Atmospheric Administration. 12 pp.2. Screening levels (SLs) are as follows: SEF = Freshwater SLs (Corps, et al., 2006; Table 7-1, revised 10/20/06 ). If a freshwater value was not present, marine SLs DEQ, 2006. Evaluation of Reliability of Potential Freshwater Sediment Screening Values. December 6, 2007.
marine SLs from the same table are listed and flagged with an a. Gamma-BHC and Total DDT do not have a SEF SL; the values are flagged with a b and are from Table 8-1 of the Dredge Material Evaluation Framework (Corps, et al., 1998). DEQ, 2007. Guidance for Assessing Bioaccumulation Chemicals of Concern in Sediment. Updated April 2, 2007.
SQuiRTs = Screening Quick Reference Tables from Buchman (1999), except as modifed by DEQ (2006) and flagged with a c. Bioaccumulation = Values from DEQ bioaccumulation guidance document (DEQ, 2007). U.S. Army Corps of Engineers, Portland District and Seattle District; U.S. EPA, Region 10; Oregon Department of 3. Bolded values are detected concentrations. Environmental Quality; Washington State Department of Natural Resource and Department of Ecology, 1998. Dred4. Shaded values are either: Material Evaluation Framework for the Lower Columbia River Management Area. November 1998. - A sediment concentration exceeding its respective SEF SL1; or - A screening level that was exceeded by a detection of the compound in a sediment sample.5. Underlined screening level is below method detection limit.6. For undetected compounds, method reporting limits are shown unless otherwise indicated.7. *Method detection limit (MDL).8. - = Not available.9. NSM = New surface material (i.e., leave surface).10. J = Estimated concentration between MDL and method reporting limit (MRL).11. U = Not detected at the indicated MDL or MRL.12. UJ = Estimated MRL (see Appendix B).13. Y = Not detected at a MRL that was raised due to chromatographic interference.
T607-C6-ZMN42F
T601-MD T601-C1-Z T601-C2-Z T601-C3-Z T607-MD T607-C4-Z T607-C5-ZMN42G MN42D MN42EMN43G MN43D MN43E MN43F
601 607Prism NSM Prism NSM