Section AUDIO ET VIDEO - Villeneuve sur Lot
29
ADAPS Chapter 3: Overview of Data Processing ADAPS 11 NWIS User 3 OVERVIEW OF DATA PROCESSING by Edward E. Fischer This section provides a general description of how ADAPS is configured to receive, process, and store data from USGS data-collection stations and of the computational procedures that are available in ADAPS to process these data. Information also is provided on types of variables and ratings used, data corrections and shifts, and computation of daily mean values. 3.1 Levels of Database Access Four levels of database access are available in ADAPS. The highest level (code SYST) has access to all NWIS databases and programs. The levels of access are listed in table 1. 3.2 Site and Data Type Records At each site (station), the data types that will be collected, the data processing steps, and the data storage formats must be established in ADAPS before any data can be entered. This information is maintained within ADAPS with the following records. 3.2.1 Site (Station) Record The site record is maintained in the NWIS Site File. It must be created before any data- specific information can be established in ADAPS. The site record is created and updated by the DBA. Information about creating and updating records in the Site File is provided in the GWSI manual. 3.2.2 Location Record Sites where a single data type is measured at two or more points require a location record for each measuring point. For example, if temperature is measured at three depths in a single horizontal location in a lake, the station requires three location records. Other data types measured at the same locations (for example specific conductance) do not require additional location records. Location records are created and updated by the ADBA using program LOC_EDIT or program DD_EDIT. Table 1: ADAPS Access Levels Code Description Level of access SYST System Database Administrator (DBA) All NWIS databases and programs ADBA ADAPS Database Administrator (ADBA) ADAPS processing records USER User Data processing capabilities COOP Cooperator Read-only capabilities
Transcript of Section AUDIO ET VIDEO - Villeneuve sur Lot

ADAPS Chapter 3: Overview of Data Processing
3 OVERVIEW OF DATA PROCESSINGby Edward E. Fischer
This section provides a general description of how ADAPS is configured to receive,process, and store data from USGS data-collection stations and of the computationalprocedures that are available in ADAPS to process these data. Information also isprovided on types of variables and ratings used, data corrections and shifts, andcomputation of daily mean values.
3.1 Levels of Database Access
Four levels of database access are available in ADAPS. The highest level (code SYST)has access to all NWIS databases and programs. The levels of access are listed in table 1.
3.2 Site and Data Type Records
At each site (station), the data types that will be collected, the data processing steps, andthe data storage formats must be established in ADAPS before any data can be entered.This information is maintained within ADAPS with the following records.
3.2.1 Site (Station) Record
The site record is maintained in the NWIS Site File. It must be created before any data-specific information can be established in ADAPS. The site record is created and updatedby the DBA. Information about creating and updating records in the Site File is providedin the GWSI manual.
3.2.2 Location Record
Sites where a single data type is measured at two or more points require a location recordfor each measuring point. For example, if temperature is measured at three depths in asingle horizontal location in a lake, the station requires three location records. Other datatypes measured at the same locations (for example specific conductance) do not requireadditional location records. Location records are created and updated by the ADBA usingprogram LOC_EDIT or program DD_EDIT.
Table 1: ADAPS Access Levels
Code Description Level of access
SYST System Database Administrator (DBA) All NWIS databases and programsADBA ADAPS Database Administrator (ADBA) ADAPS processing recordsUSER User Data processing capabilitiesCOOP Cooperator Read-only capabilities
ADAPS 11 NWIS User

ADAPS: Chapter 3. Overview of Data Processing
3.2.3 Data Descriptor (DD) Record
Each data type that is collected requires a Data Descriptor (DD) record. The DD recordcontains information about processing and storing the data. It references other data thatmay be required for data processing such as data correction tables, shift tables, and ratingtables. If the data are automatically collected, the DD record also references a processorrecord (next section). DD records are created and updated by the ADBA using programDD_EDIT. Only data types that are included in the NWIS parameter code dictionary,PARMFILE, can be stored in ADAPS.
3.2.4 Processor Record
A processor record corresponding to the DD record may be required depending on thetype of data being collected. The processor record contains site-specific information onhow to compute unit and daily values from the input data and, if required, how to computedata that serve as input for a different data type. Processor records are created and updatedby the ADBA using program DD_EDIT.
3.2.5 Device Conversion and Delivery System (DECODES) Record
Data collected by Data Collection Platforms (DCP) and Electronic Data Loggers (EDL)require a Device Conversion and Delivery System (DECODES) record. The DECODESrecord defines the data types and their respective positions in the data stream. The recordreferences the DD record that was created for the data type. The DECODES record isused by the DECODES program and by the Satellite Telemetry Input (SATIN) program.The record is created by the ADBA using the DECODES program.
3.2.6 Relation Between DD, Processor, and DECODES Records
A schematic of the relation between the DD,processor, and DECODES records is shownin figure 1. Stage/discharge data from asingle-channel instrument are used as anexample. The discharge processor recordreferences the gage-height DD record. It alsocontrols the daily values statisticscomputations of the gage-height data. For amultiple-channel instrument, the DECODESrecord references a separate DD record foreach channel. Each DD record references itsown processor record.
“Gage-height” “Discharge”
Figure 1. Relation between data descriptor,processor, and DECODES records.
DECODES record—specifies conversion of rawdata to standard input data
DD record DD record
Processor record—specifies unit values
computations, daily valuesstatistics computations
Thresholds Thresholds
Daily values statistics Daily values statistics
ADAPS 12 NWIS User

ADAPS Chapter 3: Overview of Data Processing
3.3 Data Storage Formats
Data for a single data type are stored in several formats that correspond to the variousprocessing steps. The values at each step are stored in case it is necessary to reprocess thedata. There are also three special storage formats: discharge measurements, peak flowvalues, and summary statistics. Up to 2,880 values per unit-value-format type can bestored for a single day.
3.3.1 Measured Unit Values
Measured unit values are the “raw” values measured by the data collection instrumentsand entered into the ADAPS database. They can be entered using one of several entryprograms. Measured unit values cannot be altered within the ADAPS system. When amistake occurs, they must be deleted and the correct values entered.
During normal processing measured unit values are displayed after the conversion-of-input rating has been applied. Measured unit values can be viewed without theconversion-of-input rating applied by selecting the “view raw measured unit values”option available in programs that process them.
3.3.2 Edited Unit Values
Edited unit values are measured unit values that have been converted to the engineeringunits specified for the data type using a conversion-of-input rating. They are available formodification, deletion, or the addition of remark codes. For example, stage unit valuesmay have spurious peaks or missing values that can be changed (edited) using the dataediting program, HYDRA, and data from other sources. Any modifications to the editedunit values are saved back into the edited unit values.
3.3.3 Correction Unit Values
Correction unit values are added to edited unit values to correct systematic errors in thedata such as datum corrections or instrument-bias corrections. For example, a 6-weekperiod of stage unit values might require that a 10-foot datum correction be added to eachvalue. Correction unit values are calculated from data correction curves.
3.3.4 Computed Unit Values
Computed unit values are edited unit values that have had correction unit values added tothem.
3.3.5 Shift Unit Values
Shift unit values are added to stage computed unit values prior to computing dischargeunit values. If the processing is a velocity-discharge computation, shift unit values areadded to velocity computed unit values prior to computing discharge unit values. Shiftunit values are calculated from shift curves.
ADAPS 13 NWIS User

ADAPS: Chapter 3. Overview of Data Processing
3.3.6 Output-Computed Unit Values
Output-computed unit values are calculated by the primary computations program fromother unit values. For example, discharge unit values are computed from stage unit values.
3.3.7 Computed Daily Values
Computed daily values are calculated by the primary computations program from unitvalues. For example, daily mean discharge is computed from discharge unit values.
3.3.8 Final Daily Values
Final daily values are computed daily values that have been reviewed and, if necessary,edited. For example, computed daily discharge values may be edited to account for ananomalous backwater situation. Final daily values can only be edited manually usingHYDRA.
3.3.9 Discharge Measurements
Data from discharge measurements are stored in “Form 9-207” format in the DischargeMeasurements File. They are entered into ADAPS manually.
3.3.10 Peak Discharges
Peak discharges are stored in a separate peak flow file. They are entered manually.
3.3.11 Summary Statistics
Summary statistics are stored as a distinct data format. They are stored automaticallywhen they are computed.
3.4 Date and Time Conventions
Every piece of time-series data in ADAPS is tagged with a date and time. The tagsconform to ISO (International Organization for Standardization) standards. NOTE: Theconvention of designating midnight as 00:00:00 hours of a new day and of storingdata with respect to UTC (see following) is different from that used in previousversions of ADAPS.
3.4.1 Dates
Dates are stored in ADAPS according to the Gregorian calendar. Years are entered usingfour digits. Months are entered with numbers; “1” equals January. Leap years areautomatically taken into account during data processing.
ADAPS 14 NWIS User

ADAPS Chapter 3: Overview of Data Processing
3.4.2 Times
The time of day runs from 00:00:00 (midnight, read as “zero hours, zero minutes, zeroseconds”) to 23:59:59 in 1-second intervals. If midnight is entered as 24:00:00, it isconverted to 00:00:00 of the next day. Midnight 24:00:00 is used for certain purposessuch as reporting the times of minimums and maximums on primary reports; 0000 is thebeginning-of-day midnight and 2400 is the end-of-day midnight.
3.4.3 UTC, Local Time, Time Zones, Daylight Savings Time
All data in ADAPS are stored with respect to UTC (Universal Time Coordinate). Localtime is calculated from time zone information stored in the site record. Whether localtime is calculated as standard time or daylight savings time depends on how the site isconfigured to use daylight savings time.
3.4.4 Data Processing in Local Time
All data processing in ADAPS is done with respect to local time. Data corrections, shifts,ratings, etc., are entered using local time. Daily values are computed for data collectedfrom midnight to midnight local time. When a site is configured to use daylight savingstime, in most cases ADAPS automatically switches between standard time and daylightsavings time as appropriate during data processing and printing of unit values tables.
ADAPS 15 NWIS User
ADAPS: Chapter 3. Overview of Data Processing
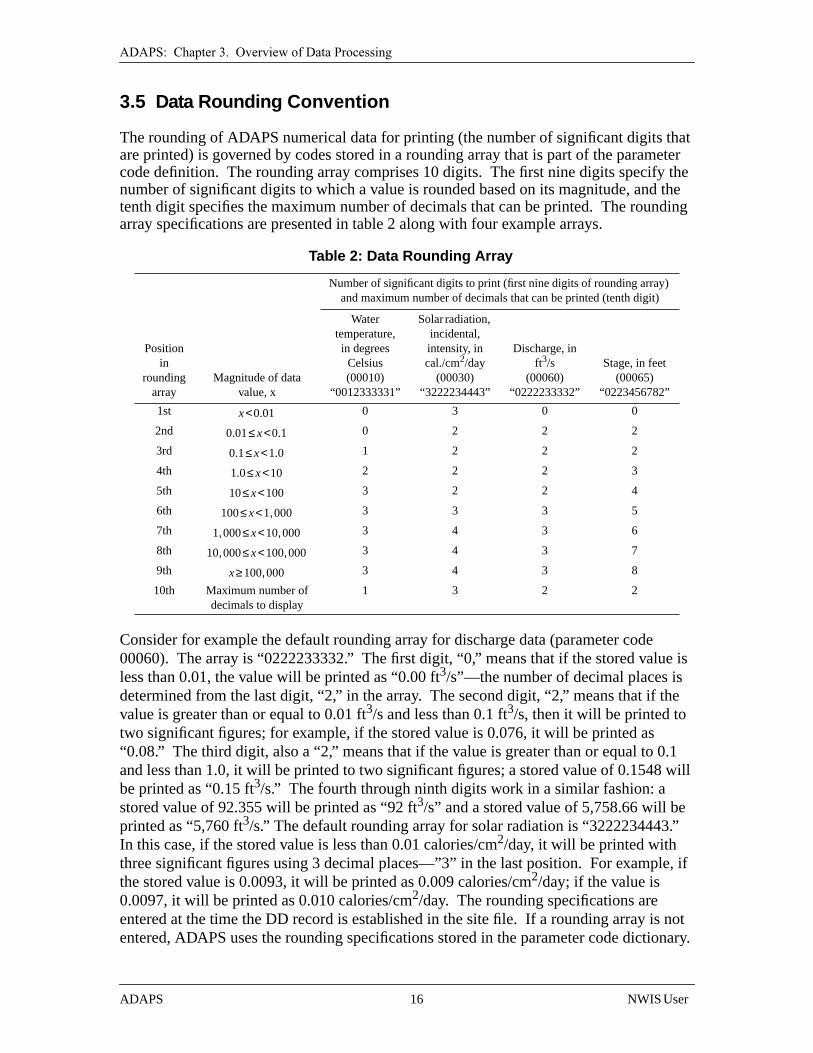
3.5 Data Rounding Convention
The rounding of ADAPS numerical data for printing (the number of significant digits thatare printed) is governed by codes stored in a rounding array that is part of the parametercode definition. The rounding array comprises 10 digits. The first nine digits specify thenumber of significant digits to which a value is rounded based on its magnitude, and thetenth digit specifies the maximum number of decimals that can be printed. The roundingarray specifications are presented in table 2 along with four example arrays.
Consider for example the default rounding array for discharge data (parameter code00060). The array is “0222233332.” The first digit, “0,” means that if the stored value isless than 0.01, the value will be printed as “0.00 ft3/s”—the number of decimal places isdetermined from the last digit, “2,” in the array. The second digit, “2,” means that if thevalue is greater than or equal to 0.01 ft3/s and less than 0.1 ft3/s, then it will be printed totwo significant figures; for example, if the stored value is 0.076, it will be printed as“0.08.” The third digit, also a “2,” means that if the value is greater than or equal to 0.1and less than 1.0, it will be printed to two significant figures; a stored value of 0.1548 willbe printed as “0.15 ft3/s.” The fourth through ninth digits work in a similar fashion: astored value of 92.355 will be printed as “92 ft3/s” and a stored value of 5,758.66 will beprinted as “5,760 ft3/s.” The default rounding array for solar radiation is “3222234443.”In this case, if the stored value is less than 0.01 calories/cm2/day, it will be printed withthree significant figures using 3 decimal places—”3” in the last position. For example, ifthe stored value is 0.0093, it will be printed as 0.009 calories/cm2/day; if the value is0.0097, it will be printed as 0.010 calories/cm2/day. The rounding specifications areentered at the time the DD record is established in the site file. If a rounding array is notentered, ADAPS uses the rounding specifications stored in the parameter code dictionary.
Table 2: Data Rounding Array
Number of significant digits to print (first nine digits of rounding array)and maximum number of decimals that can be printed (tenth digit)
Positionin
roundingarray
Magnitude of datavalue, x
Watertemperature,in degrees
Celsius(00010)
“0012333331”
Solar radiation,incidental,intensity, incal./cm2/day
(00030)“3222234443”
Discharge, inft3/s
(00060)“0222233332”
Stage, in feet(00065)
“0223456782”
1st 0 3 0 0
2nd 0 2 2 2
3rd 1 2 2 2
4th 2 2 2 3
5th 3 2 2 4
6th 3 3 3 5
7th 3 4 3 6
8th 3 4 3 7
9th 3 4 3 8
10th Maximum number ofdecimals to display
1 3 2 2
x 0.01<
0.01 x 0.1<≤
0.1 x 1.0<≤
1.0 x 10<≤
10 x 100<≤
100 x 1 000,<≤
1 000, x 10 000,<≤
10 000, x 100 000,<≤
x 100 000,≥
ADAPS 16 NWIS User

ADAPS: Chapter 3. Overview of Data Processing
3.6 Ratings Ratings define the relationship between two parameters. They are entered into ADAPS using program RT_EDIT and are stored in the Rating Tables File either as equations or as tables. Ratings are in effect during the time periods specified with the rating. Discharge ratings are developed according to the methods presented in Discharge Ratings at Gaging Stations (Kennedy, 1984). 3.6.1 Rating Types The types of ratings used in ADAPS and a brief description of each are given in table 3 below. The description indicates the measuring method for which the rating type is used.
Table 3: Rating Types
Rating Code
Rating Name
Dependent Variable –
must ascend
Independent Variable - Minimum
Dependent Variable - Minimum
Rating Description
STGQ stage-discharge True N/A 0.00 A rating used to compute the discharge of a stream on the basis of stage.
FALL fall False N/A 0.00 A rating used to determine the adjusted fall as it relates to the mean gage height observed at the base gage in a reach where the fall in stage (slope of water surface), between auxiliary and base gages is affected by backwater.
FLFC Fall-factor False 0.00 0.00 A rating used to determine the factor value needed to compute an adjusted discharge on the basis of measured fall in the reach between auxiliary and base gages, and measured discharge.
STCO stage-coefficient False N/A N/A A rating used to determine a velocity adjustment coefficient from its relation to stage, for the index velocity method.
STAR stage-area True N/A 0.00 A rating used to determine the cross-sectional area of a stream on the basis of stage.
PARM dependent, parameter
False N/A N/A A rating used to compute one parameter on the basis of its relational parameter.
STOR storage-correction False N/A N/A A rating used to determine the variable Sc/J from its relation to gage height.
VELO velocity False N/A N/A A rating used to determine the mean velocity on the basis of the index velocity.
MEAS input conversion False N/A N/A Conversion of input rating for measured unit values.
ADAPS 17 NWIS User

ADAPS Chapter 3: Overview of Data Processing
3.6.2 Equation Ratings
Equation ratings are of the form
where y = output value (dependent variable),x = input value (independent variable), and
a,b,c,d = coefficients.
Conversions are exact; that is, interpolation is not used to calculate intermediate values.Only the coefficients are stored in the Rating Tables File.
3.6.3 Table Ratings
Table ratings are stored as ordered input/output pairs. Generally input/output pairs are notstored for every possible input value. Instead, intermediate values are interpolated fromthe tabled values. Interpolation is either linear or logarithmic, depending on the ratingtype. The method of logarithmic interpolation is described in Kennedy (1984).
3.6.4 Rating Dates
A rating is in effect according to the starting date and time specified with the rating. It isused until it is superseded by the starting date of another rating. A rating may have morethan one starting date because it can become valid again as environmental conditionschange. Ratings used for a single DD are numbered sequentially as they are developed.Ratings that are used again at a later date are not renumbered.
3.7 Data Corrections and Shifts
Data corrections are applied to edited unit values to correct systematic errors. Shifts arespecial data corrections that are applied to corrected stage unit values to adjust therelationship between stage and discharge; the stage values are otherwise correct but thestage/discharge relationship has changed because of changes in the river environment.Data corrections are stored as computed unit values; shifted stage (or index-velocity) unitvalues are not stored after the discharge has been determined because shifts areautomatically calculated. Shifts and their application are discussed in Computation ofContinuous Records of Streamflow (Kennedy, 1983).
3.7.1 Starting/Ending Dates and Times
Data corrections are applied only between the starting and ending dates specified with thecorrection. Shifts are linked to stage-discharge ratings and are in effect only within thetime frame of the ratings. Data corrections and shifts are carried across water-yearboundaries. Explicit zero data corrections and shifts are not required for time periodsduring which corrections are not necessary.
y a b x+( )cd+=
ADAPS 18 NWIS User

ADAPS: Chapter 3. Overview of Data Processing
3.7.2 Constant Data Corrections and Shifts
A constant data correction or shift is a single value that is added to each input value toproduce the output value. The value is added only during the period between the startingand ending dates of the correction. No proration of any kind is performed. The mostrecent correction and (or) shift is applied during real-time data processing if an endingdate was not specified with the correction. Note that, conceptually, a constant datacorrection or shift is a “single-point” variable shift diagram (next section).
3.7.3 Variable Data Corrections and Shifts
Shifts can be varied with the input value. (Inthis section “data correction” and “shift” aresynonymous, as are “input value” and“stage.”) A variable shift is defined by a shiftdiagram comprising two or three points(figure 2). The input variable (stage in thefigure) is the independent variable and theoutput (dependent) variable is the shift.Interpolation between the points is linear. Aconstant shift equal to the closest end pointvalue is returned if the input value liesoutside the defined domain of the shiftdiagram.
3.7.4 Data Correction and Shifts withTime Proration
Shifts can also be varied with time. (In thissection also, “data correction” and “shift” aresynonymous.) Time proration is based on thestarting times of two consecutive shiftdiagrams (figure 3). First, the shiftscorresponding to the stage measured at time,t, are determined from each shift diagram.Then, using the two shift values as endpoints,the shift is interpolated with respect to time,t. Shift-with-time proration also is linear.
Shift-with-time proration is not performed ifan end date is explicitly entered with the shiftdiagram or if the shift diagram is the mostrecent one in use and does not have anexplicit end date. In these cases the shift isthat determined from the diagram.
Figure 2. Variable shift diagrams. The shift isinterpolated linearly in the defined domain andis constant above and below the defineddomain. [Stage, input variable; shift, outputvariable.]
Shift
Sta
ge Defined domain
Constant shift
Constant shift
•
•
•
•
•
•
“single- double- triple-point”
diagrampoint
diagrampoint
diagram
Figure 3. Schematic of proration of shift at time tbetween two variable-shift diagrams. [t1, starttime of 1st diagram; t2, start time of 2nddiagram; Stgt, stage at time t; S1, shift from 1stdiagram for Stgt; S2, shift from 2nd diagram forStgt; St, prorated shift at time t.]
S1
Time
t
St
Stgt
1stdiagram
2nddiagram
t1
t2
•
•S2
(Shift at time, t)
•
•
ADAPS 19 NWIS User

ADAPS Chapter 3: Overview of Data Processing
.
3.8 Data Aging
Data in ADAPS are in one of three status levels: “Working,” “In-Review,” and“Approved.” Data aging is the process by which data are moved from one status level tothe next. Each status level is called a data aging code. The codes and the database accesslevels associated with each code are listed in table 4.
Data aging applies to most aspects of data processing: processor records, ratings, ratingdates, shift curves, correction curves, unit values, daily values and summary statistics.
Prior to NWIS version 4.2, data were flagged either “Provisional” or “Final.”Provisional data could be manipulated and edited, while final data could not be altered.With version 4.2, this concept was expanded to provide a more comprehensive method ofcontrolling alterations to data and of preserving this status not only for the actual dataitems, but also for related items involved in processing the data. Also in 4.2, the“Provisional” and “Final” flags were replaced by the data aging codes. When data aremarked “In-Review” and “Approved,” all of the pieces are marked the same. Similarly,when “Approved” data must be reset to “Working,” all of the associated pieces must bereset to “Working.” Discharge measurements/gage inspections are not included in the dataaging process.
Data aging is handled slightly different in each of three categories: processor records,ratings, and data (rating dates, correction curves, shifts, unit values, daily values, andsummary statistics. ADAPS programs for managing processor records (DD_EDIT)and ratings (RT_EDIT) also manage data aging. A utility program (SETSTATUS)allows users at different database access levels to manage data aging for the rest of thedata. The utility program (STATUS_REPORT) lets users check on current data aging status
3.8.1 Data Aging of Processor Records
Processor records are protected from modification by setting them to “Approved.” Dataaging of processor records is managed using program DD_EDIT. The status level of aprocessor record does not affect the status of the data it processes, nor does changing thestatus of a processor record affect any data that were previously processed by it. If aprocessor record that has been used for approved data must be modified, it isrecommended that a new version be created rather than changing the status back to“Working.”
Table 4: Data Aging Codes
Code DescriptionADAPSaccesslevel
Permitted actions at access level
Working Data can be computed, edited, anddeleted
USER Process records and change data-aging codeto “In-Review”
In-Review Data are locked against furthermodification pending review
ADBA Review records, change data-aging code to“Approved” or back to “Working”
Approved Data are considered final andlocked against any modifications
SYST Change data-aging code back to “Working”
ADAPS 20 NWIS User
ADAPS: Chapter 3. Overview of Data Processing
3.8.2 Data Aging of Ratings
Ratings must be set to “Approved” before any data computed using the ratings can be setto “Approved.” Data aging of ratings is managed using program RT_EDIT. While thesystem allows an “Approved” rating that was used to compute “Approved” data to be setback to “Working” without also resetting the data, this is strongly discouraged. Instead, itis recommended that a new rating be created using the “copy” or “extend” options inRT_EDIT. Note that data aging of rating dates is managed separately (next section).
3.8.3 Data Aging of Data
Data correction curves, shift curves, rating dates, unit values, daily values and summarystatistics pertaining to a single DD are data aged as a single unit. Other DDs may beincluded in the unit. For example, discharge data (one DD) are computed from gage-height data (a different DD); the data for both DDs are aged together. Data aging in this
category is by water year and is managed using program SETSTATUS. Data in thiscategory cannot be set to “Approved” if any ratings associated with the processingare not set to “Approved.”
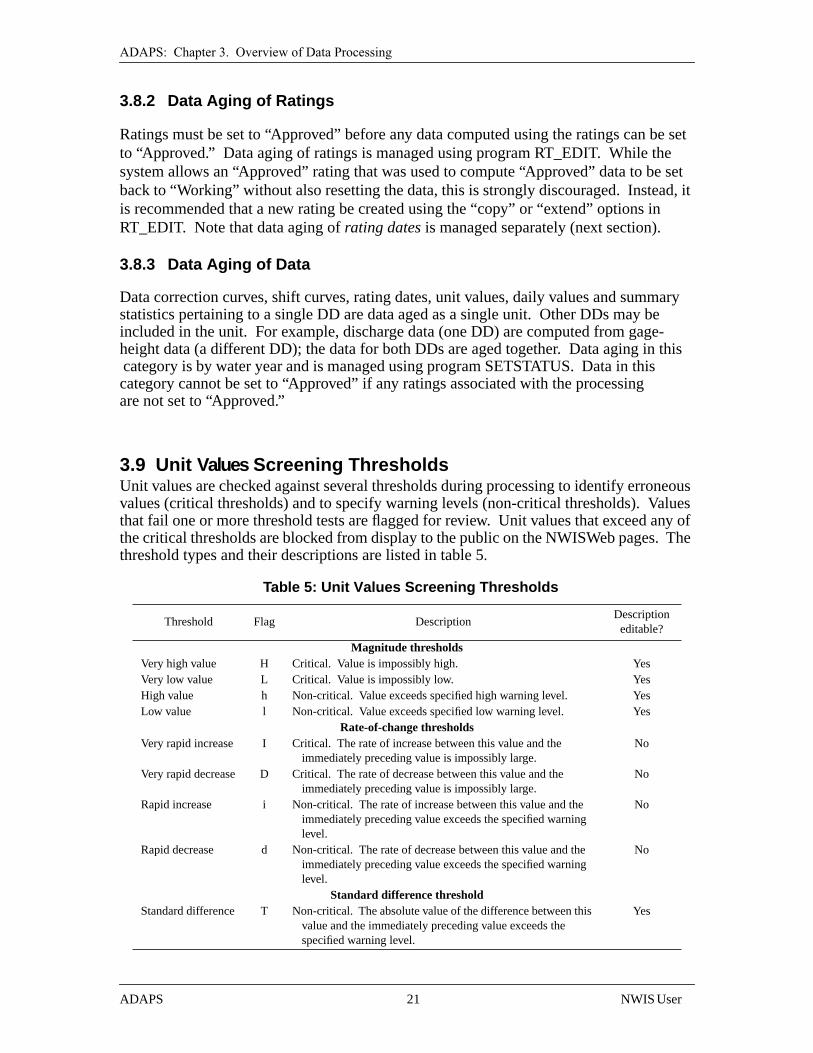
3.9 Unit Values Screening ThresholdsUnit values are checked against several thresholds during processing to identify erroneousvalues (critical thresholds) and to specify warning levels (non-critical thresholds). Valuesthat fail one or more threshold tests are flagged for review. Unit values that exceed any ofthe critical thresholds are blocked from display to the public on the NWISWeb pages. Thethreshold types and their descriptions are listed in table 5.
Table 5: Unit Values Screening Thresholds
Threshold Flag DescriptionDescription
editable?
Magnitude thresholdsVery high value H Critical. Value is impossibly high. YesVery low value L Critical. Value is impossibly low. YesHigh value h Non-critical. Value exceeds specified high warning level. YesLow value l Non-critical. Value exceeds specified low warning level. Yes
Rate-of-change thresholdsVery rapid increase I Critical. The rate of increase between this value and the
immediately preceding value is impossibly large.No
Very rapid decrease D Critical. The rate of decrease between this value and theimmediately preceding value is impossibly large.
No
Rapid increase i Non-critical. The rate of increase between this value and theimmediately preceding value exceeds the specified warninglevel.
No
Rapid decrease d Non-critical. The rate of decrease between this value and theimmediately preceding value exceeds the specified warninglevel.
No
Standard difference thresholdStandard difference T Non-critical. The absolute value of the difference between this
value and the immediately preceding value exceeds thespecified warning level.
Yes
ADAPS 21 NWIS User

ADAPS Chapter 3: Overview of Data Processing
Unit values screening thresholds are specified using program DD_EDIT orTHRESHOLD_EDIT. Some of the threshold descriptions are editable so that morespecific messages can be included in printouts. Whether a description can be edited isindicated in the column labeled “Description editable.” Thresholds are not data-aged.
Unit values are screened in several places during data processing according to the unitvalue type. If a threshold is not established for a DD, the respective unit values are notscreened. The threshold types and the situations under which unit values are screened arediscussed in the following sections.
3.9.1 Magnitude Thresholds
Magnitude thresholds test whether each unit value exceeds a specific value.
3.9.2 Rate-of-Change Thresholds
Rate-of-change thresholds test whether the rate of change between successive unit valuesis reasonable as determined for the data type. The rate of change is calculated bysubtracting the previous unit value from the current unit value and dividing by the timeinterval between the two values. Rate-of-change thresholds can be specified for up tothree ranges of unit-value magnitudes.
3.9.3 Standard Difference Threshold
The standard difference threshold tests whether the absolute value of the differencebetween successive unit values is exceeded. The difference is calculated by subtractingthe previous unit value from the current unit value.
3.9.4 Screening of Input-DD Unit Values
Input-DD unit values that are entered using SENTRY or STD_STOR are screened in thefollowing situations:
1. When they are designated as “preferred input.”
2. When they are saved after editing (HYDRA).
3. When a re-computation is performed after adding or modifying data corrections(DC_EDIT).
4. When a re-computation is performed after adding or modifying shifts (only for slope-discharge and velocity-discharge type computations) (SV_EDIT).
5. When a primary computation is performed (PRIMARY).
3.9.5 Screening of Computed-DD Unit Values
Computed-DD unit values, such as discharge, are screened when they are computed byprogram PRIMARY.
ADAPS 22 NWIS User

ADAPS: Chapter 3. Overview of Data Processing
3.10 Data Processing Steps
Data are processed and stored in ADAPS according to the data type. The various steps aredescribed in the following sections. Data that are processed as they arrive at the server areoften called real-time or near-real-time data.
3.10.1 Transferring Unit Values
Unit values data are transferred from the data collection site by any of several transportmethods. The transport method is identified by a data transport code. Automatically-collected data generally are transported to the ADAPS system by telemetry or other digitalmedia, whereas manually-collected data are entered into ADAPS manually.
Data transport code
The data transport method is identified by a transport code. The code is automaticallyadded as a suffix to the DD by the transfer process. The data transport codes are listed intable 6.
The transport code is the means by which data for a single DD that are transported bymore than one method are differentiated in ADAPS. For example, stage data may becollected and transported by both a DCP and an EDL. The suffixes S and E differentiatethe data.
Automatically-collected data
Automatically-collected data are collected onsite by continuously-operating sensorswithout manual (human) intervention. The data are stored in the data-collectioninstruments as digital values. Presently (2002), the most common onsite data storagemedium is computer memory. The values are transferred to the ADAPS server bytelemetry or by downloading to a portable computer.
Table 6: Data Collection and Transport Method Codes
Code Description
s GOES DCP (Data Collection Platform) data. Data are collected and stored onsite in the DCP. They aretransferred to ADAPS by satellite technologies, typically once every 4 hours.
e EDL (Electronic Data Logger) data. Data are collected and stored onsite in the EDL. They are transferredto ADAPS by land-line telephone, cellular telephone, line-of-sight radio, or by downloading to a portablecomputer. Data typically are transferred once per day, or in the case of a portable computer, once per sitevisit.
a ADR (Analog to Digital Recorder) punched paper tape data. Data are collected and mechanically storedonsite on punched paper tape. The punches are converted to electronic digital values prior to entry intoADAPS. Data typically are transferred once per site visit after the paper tape is retrieved.
c Chart (graphical recorder paper chart, also known as “strip chart”) data. Data are collected andmechanically stored onsite as a line drawn on a moving paper chart. Data typically are transferred onceper site visit after the chart is retrieved. The line is digitized prior to entry into ADAPS.
o Observation data. Data are collected manually and entered into ADAPS by typing at a keyboard.
ADAPS 23 NWIS User

ADAPS Chapter 3: Overview of Data Processing
Some automatically-collected data are stored at the data-collection site by mechanicalmedia such as digital paper-tape recorders. Methods for transferring mechanically-recorded digital data to ADAPS servers are discussed in an appendix.
Transfer by satellite telemetry (DCP data)
Many automatically-collected data aretransferred to ADAPS by satellite telemetry.Satellite telemetry comprises three majorcomponents: (1) on-site instrumentationcalled Data Collection Platforms (DCPs) thatcollect, store, and transmit the data;(2) geostationary satellites that relay thetransmissions; and (3) a ground stationwhere the data transmissions are combinedand rebroadcast to local receive sites aroundthe country. DCPs transmit the data at presetintervals, typically once every 3 or 4 hours.A schematic of the DCP data flow path to anADAPS server is shown in figure 4.
The relay satellites are part of theGeostationary Operational Earth SatelliteData Collection System (GOES), which isoperated by the U.S. Department ofCommerce National Oceanic andAtmospheric Administration (NOAA). The data are received by NOAA at its WallopsIsland facility in Virginia where they are merged into a single data stream. The single datastream is transmitted via a commercial communications satellite to Local Readout GroundStations (LRGS) that store it locally until programs on the ADAPS servers retrieve thedata over the Internet or by telephone. The Puerto Rico District receives data directlyfrom the GOES satellite and the Alaska and Hawaii Districts receive data via the Internetafter it has been retrieved from a LRGS by the Washington District.
DCP data are retrieved from LRGS computers using a program on the ADAPS servercalled Satellite Telemetry Input (SATIN). SATIN processes the data into ADAPSstandard input format for input to program SENTRY. SENTRY reads the data from thestandard input file, adds the data transport code, and writes the data to ADAPS asmeasured unit values. The SATIN and SENTRY programs are automated processes thatprocess data as they are received by the ADAPS server.
Transfer by other telemetry methods or portable computer (EDL data)
Automatically-collected data also are transferred to ADAPS by telemetry methods that includeland-line telephones, cellular telephones, and line-of-sight radio. In some situations they aretransferred by downloading to a portable computer. On-site instrumentation called ElectronicData Loggers (EDLs) collect and store the data. Data are transferred at less frequent intervals thanDCP data, typically once per day, or in the case of a portable computer, once per site visit.
GOES
Figure 4. Data flow path from DCP sites to anADAPS server
NOAA WallopsIsland Facility
DCP
DCP
LRGS
LRGS
CommercialCommunications
SatelliteSatellite
ADAPS Server
ADAPS 24 NWIS User
ADAPS: Chapter 3. Overview of Data Processing
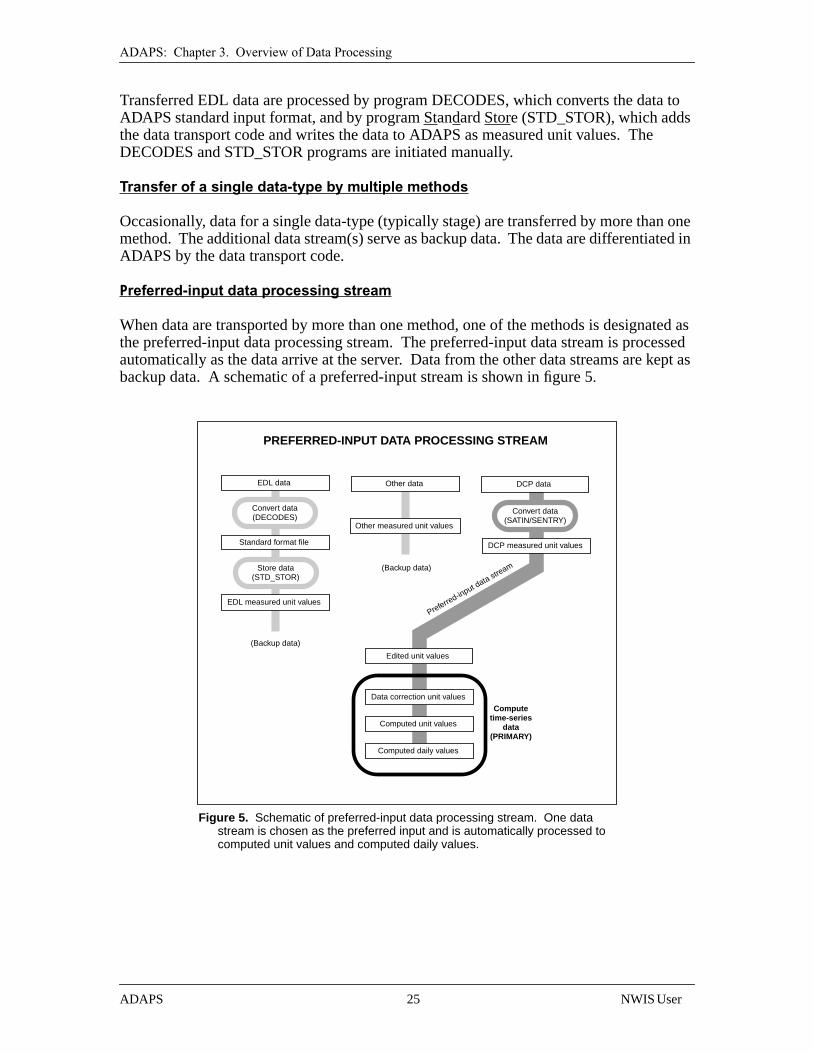
Transferred EDL data are processed by program DECODES, which converts the data toADAPS standard input format, and by program Standard Store (STD_STOR), which addsthe data transport code and writes the data to ADAPS as measured unit values. TheDECODES and STD_STOR programs are initiated manually.
Transfer of a single data-type by multiple methods
Occasionally, data for a single data-type (typically stage) are transferred by more than onemethod. The additional data stream(s) serve as backup data. The data are differentiated inADAPS by the data transport code.
Preferred-input data processing stream
When data are transported by more than one method, one of the methods is designated asthe preferred-input data processing stream. The preferred-input data stream is processedautomatically as the data arrive at the server. Data from the other data streams are kept asbackup data. A schematic of a preferred-input stream is shown in figure 5.
Figure 5. Schematic of preferred-input data processing stream. One datastream is chosen as the preferred input and is automatically processed tocomputed unit values and computed daily values.
PREFERRED-INPUT DATA PROCESSING STREAM
Standard format file
EDL data
EDL measured unit values
Other measured unit values
DCP measured unit values
Other data DCP data
Edited unit values
Convert data(SATIN/SENTRY)
Convert data(DECODES)
Store data(STD_STOR)
Preferred-input data stre
am
(Backup data)
(Backup data)
Computed unit values
Computed daily values
Data correction unit values
Computetime-series
data(PRIMARY)
ADAPS 25 NWIS User

ADAPS Chapter 3: Overview of Data Processing
Manually-collected data
Manually-collected data are collected onsite by humans and the data entered into ADAPSusing various unit-values-entry or daily-values-entry programs. Manually-collected datatypically are collected to verify automatically-collected data and in situations where it isnot feasible or cost-effective to use automatic data-collection equipment. For example,discharge measurements are made to validate stage-discharge rating curves. Thedischarge measurement data are manually entered into ADAPS.
Some automatically-collected data stored on mechanical media may be manuallytranscribed. For example, stage data recorded by pen-and-ink strip chart recorders aredigitized and the digitized values entered into ADAPS.
3.10.2 Editing Unit Values (HYDRA)
Measured unit values are reviewed and edited using HYDRA, a graphical editingprogram, and are stored as edited unit values. HYDRA has the capability of importingmeasured unit values from backup recorders, displaying data from other stations asreference curves, changing or deleting values, and flagging values. If edited values arelater re-edited, HYDRA reloads them automatically. HYDRA also has the capability ofreverting to the original measured unit values.
Unit values flags are used by ADAPS to track the status of each unit value. The flags areset (“turned on”) automatically according to the data type, the thresholds set up for thedata type, and the type of data processing acting upon the data. Multiple flags can be setfor a single data value. The flags used in ADAPS are listed in table 7.
Table 7: Unit Values Flags
Flag Description
Flags indicating thresholds[See table 4 for threshold explanations]
I Value exceeds “very rapid increase” thresholdi Value exceeds “rapid increase” threshold
ADAPS 26 NWIS User

ADAPS: Chapter 3. Overview of Data Processing
Unit values remarks codes
Remarks codes can be assigned to unit values during review and editing in HYDRA. Thecodes are assigned by the user or automatically by the program. The remarks codes usedin ADAPS are listed in table 8.
The following rules govern the processing of unit values that have been assigned remarkscodes:
1. Remarks codes are initially stored with the edited unit values.
2. Corrected unit values inherit all remarks codes from edited unit values except “X”.Unit values assigned “X” are filtered out (not included in the set of corrected unitvalues).
D Value exceeds “very rapid decrease” thresholdd Value exceeds “rapid decrease” thresholdL Value exceeds “very low” thresholdl Value exceeds “low” thresholdH Value exceeds “very high” thresholdh Value exceeds “high” thresholdT Value exceeds “standard difference” threshold
Flags indicating processing status@ Value was reviewed by USGS personnel* Value was edited by USGS personnel
Flags indicating data sourceo Value was observed in the fielda Value is from paper tapes Value is from a DCP~ Value is a system interpolated valuee Value was recorded by a data loggerc Value was recorded on a strip chartp Value was received by telephone transmissionr Value was received by radio transmissionf Value was received by machine readable file
Table 8: Unit Values Remarks Codes
Code Description
Codes assignable by userA Value is affected by backwater from ice at the measurement siteB Value is affected by backwater at the measurement siteR Rating is undefined for this value& Value is affected by unspecified causesK Value is affected by instrument calibration drift.X Value is erroneous and will not be used< Value is known to be less than the reported value> Value is known to be greater than the reported value
Code assignable by systemF Value was modified by automated filtering
Table 7: Unit Values Flags
Flag Description
ADAPS 27 NWIS User

ADAPS Chapter 3: Overview of Data Processing
3. Computed unit values inherit all remarks codes from corrected unit values.
4. Daily values computed from unit values that were assigned one or more “value isaffected” codes are flagged “&.”
Display hierarchy of unit values flags and remarks codes
Unit values flags and remarks codes are displayed with the values on unit values tables andduring editing. Up to three flags/codes can be displayed at once for a single value. If thereare more than three flags, the additional flags are included at the bottom of the page with anote indicating that these flags have also been set. The display hierarchy of the codes/flagsis shown in table 9.
3.10.3 Correcting Unit Values (DC_EDIT)
Edited unit values are corrected for systematic errors using program DC_EDIT and arestored as final corrected unit values. Also available as output is the set of data correctionunit values. Systematic errors comprise situations such as datum changes, instrumentdrift, and instrument calibration. For example, input gage-height unit values may have tobe corrected both for a datum change and for an error in the sensing instrument. Up tothree separate corrections using various algorithms (Section 3.7) can be made and each ofthe corrections can be prorated over time. Time proration is automatically applied whenmultiple starting dates are present in the corrections data. Time proration is not appliedduring real-time data processing.
3.10.4 Computing Time-Series Data (PRIMARY)
Time-series computations are performed using corrected unit values as input to calculateother (second-parameter) unit values and (or) to compute daily values. The program iscalled PRIMARY and the outputs are called primary computations or primary reports.
Table 9: Display hierarchy of unit values flags and remarks codes[Multiple codes on a line are mutually exclusive; larger
internal priority level values have higher priority]
CodeInternalpriority
level
Short description[See tables 6 and 7 for details]
A,B,R,&,K,X,<,>,F 99 Remarks codesT 7 Standard difference threshold flag
H,h,L,l 6 Magnitude threshold flagsD,d,I,i 5 Rate-of-change threshold flags
* 4 Processing status (edited) flag~ 3 Interpolated value flag
c,e,r,f,p,o,a,s 2 Data source flags@ 1 Processing status (reviewed) flag
ADAPS 28 NWIS User

ADAPS: Chapter 3. Overview of Data Processing
Primary computation codes
Eleven types of time-series computations are produced by PRIMARY. Each type isdenoted with a primary computation code and has its own primary report format. Threeprocessing types (NONE, STGO, and TIDE) compute daily values only. The other typesentail processing steps that compute additional unit values as well as daily values. Theprimary computation codes are listed in table 10, grouped by principal processing method(following section).
Processing methods
There are four principal processing methods. Listed in order of increasing complexity,they are: single-parameter processing, two-parameter non-discharge processing, stage-discharge processing, and slope-discharge/velocity-discharge processing. Note that stage-discharge processing is a special variation of two-parameter data processing. The methodsare outlined in the following sections. Many steps within each method, particularly thoserelated to transferring and processing unit values, are the same.
Table 10: Primary computation codes
Code Description
Single-parameter computationsNONE Compute daily values only. Primarily used for ground water and water quality
processing.STGO Compute stage daily values only.TIDE Compute tidal daily values only.ELEV Compute reservoir/lake surface-elevations.DIFF Compute difference between successive unit values for parameters other than
rainfall.RAIN Compute difference between successive rainfall unit values. Negative
differences are ignored (set to zero).Two-parameter computations
GENR Compute second parameter from input parameter using a rating.RCNT Compute reservoir contents.
Stage-discharge computationSTGQ Compute discharge from stage.
Slope-discharge/velocity-discharge computationsSLPQ Compute discharge from stage and water-surface slope.VELQ Compute discharge from stage and index velocity.
ADAPS 29 NWIS User

ADAPS Chapter 3: Overview of Data Processing
Single-parameter processing
Single-parameter data processing entails processing and storing data in the units in whichthey are received by ADAPS. The measured unit values are edited using HYDRA andcorrected using correction curves. Single-parameter processing is used for primarycomputations denoted by codes NONE, STGO, TIDE, ELEV, DIFF, and RAIN. Aschematic of the processing steps is shown in figure 6.
Figure 6. Schematic of processing steps for single-parameter data
SINGLE-PARAMETER DATA PROCESSING
Standard format file
EDL data
EDL measured unit values
Other measured unit values
DCP measured unit values
Other data DCP data
Edited unit values
Computed unit values
Computed daily values
Convert data(SATIN/SENTRY)
Convert data(DECODES)
Store data(STD_STOR)
Backup data
Backup data
Edit/flag measureddata (HYDRA)
Input/edit correctioncurves (DC_EDIT)
Final daily values
Edit daily values(HYDRA)
Preferre
d-input
data stre
am
Data correction unit values
Computetime-series
data(PRIMARY)
Data correctioncurves
ADAPS 30 NWIS User

ADAPS: Chapter 3. Overview of Data Processing
Two-parameter processing (non-discharge)
Two-parameter non-discharge data processing entails computing a second parameter fromthe input parameter using rating curves. The input parameter is first processed as forsingle-parameter processing. Two-parameter processing is used for primary computationsdenoted by codes RCNT and GENR. A schematic of the processing steps is shown infigure 7.
Input/edit ratingcurves (RT_EDIT)
Ratingcurves
Input/edit correctioncurves (DC_EDIT)
Data correctioncurves
Figure 7. Schematic of processing steps for two-parameter non-dischargedata
TWO-PARAMETER NON-DISCHARGE DATA PROCESSING
Edit daily values data(HYDRA)
Final daily values
Standard format file
EDL data
EDL measured unit values
Other measured unit values
DCP measured unit values
Other data DCP data
Convert data(SATIN/SENTRY)
Convert data(DECODES)
Store data(STD_STOR)
Backup data
Backup data
Edit/flag measureddata (HYDRA)
Preferre
d-input
data stre
am
Edited unit values
Output-parameter computeddaily values
Data correction unit values
Computetime-series
data(PRIMARY)
Output-parameter computedunit values
Input-parameter computeddaily values
Input-parameter computedunit values
ADAPS 31 NWIS User

ADAPS Chapter 3: Overview of Data Processing
Stage-discharge processing
Stage-discharge data processing is a special type of two-parameter data processing. Inaddition to the steps for two-parameter processing, shifts can be applied to the stage valuesprior to computing discharge. The primary computations code for stage-dischargeprocessing is STGQ. A schematic of the processing steps is shown in figure 8.
Input/edit shiftcurves (SV_EDIT)
Shiftcurves
Input/edit correctioncurves (DC_EDIT)
Data correctioncurves
Input/edit ratingcurves (RT_EDIT)
Ratingcurves
Figure 8. Schematic of processing steps for stage-discharge data
STAGE-DISCHARGE DATA PROCESSING
Standard format file
EDL data
EDL measured unit values
Other measured unit values
DCP measured unit values
Other data DCP data
Convert data(SATIN/SENTRY)
Convert data(DECODES)
Store data(STD_STOR)
Backup data
Backup data
Preferre
d-input
data stre
am
Edit/flag measureddata (HYDRA)
Edit daily values data(HYDRA)
Final daily values
Edited unit values
Stage correction unit values
Computetime-series
data(PRIMARY)Discharge computed unit
values
Discharge computed dailyvalues
Shift unit values
Stage computed unit values
Stage computed daily values
ADAPS 32 NWIS User

ADAPS: Chapter 3. Overview of Data Processing
Slope-discharge/velocity-discharge processing
Slope-discharge and velocity-discharge data processing are the most complex types ofprocessing in ADAPS. The output parameter, discharge, is computed from two inputparameters, either the stages measured at two sites (one downstream of the other), or stageand velocity measured at the site. Shifts can be applied to the stage or velocity values.The primary computations code for slope-discharge processing is SLPQ; for velocity-discharge processing it is VELQ. A schematic of the processing steps is shown in figure 9.
Figure 9. Schematic of processing steps for slope-discharge/velocity-discharge data
SLOPE-DISCHARGE/VELOCITY-DISCHARGE DATA PROCESSING
Standard format file
EDL data
EDL measured unit values
Other measured unit values
DCP measured unit values
Other data DCP data
Convert data(SATIN/SENTRY)
Convert data(DECODES)
Store data(STD_STOR)
Backup data
Bac
kup
data
Preferred-input
data stream
Edit/flag measureddata (HYDRA)Base gage initial
processing
Auxiliarygage initialprocessingsame as forbase gage
Input/edit shiftcurves (SV_EDIT)
Shiftcurves
Input/edit correctioncurves (DC_EDIT)
Data correctioncurves
Input/edit ratingcurves (RT_EDIT)
Ratingcurves
Edit daily values data(HYDRA)
Final daily values
Computetime-series
data(PRIMARY)
Discharge computed dailyvalues
Base gage correctionunit values
Base gage computedunit values
Auxiliary gage correctionunit values
Auxiliary gage computedunit values
Edited unit values
Discharge computed unitvalues
Base gage computed dailyvalues
Auxiliary gage computeddaily values
Edited unit values
Input/edit correctioncurves (DC_EDIT)
Data correctioncurves
Shift unit values(slope-discharge)
Shift unit values(velocity-discharge)
Input/edit shiftcurves (RT_EDIT)
Shiftcurves
ADAPS 33 NWIS User

ADAPS Chapter 3: Overview of Data Processing
Primary computations
Each of the primary computation types listed in table 9 is described in the followingparagraphs.
Compute daily values only (NONE)
PRIMARY computes only daily values from corrected unit values. It is used principallyfor processing water quality and ground water data. Output consists of computed dailyvalues and a standard primary report.
Compute stage daily values only (STGO)
PRIMARY computes only stage daily values from corrected unit values. Output consistsof computed daily values and a stage primary report.
Compute tide daily values only (TIDE)
PRIMARY computes special tide daily values. Output consists of high high-tide, lowhigh-tide, high low-tide, and low low-tide daily values and a tide primary report.
Compute reservoir/lake surface elevations (ELEV)
PRIMARY computes water-surface elevations. If necessary, stage values are converted toelevations in the data correction processing step. Output consists of computed elevationunit values, computed daily values, and a water-surface-elevation primary report.
Compute accumulative differences (DIFF)
PRIMARY computes new unit values by calculating the difference between successiveinput unit values and computes daily values by accumulating the differences. Outputconsists of the difference unit values, the daily sum of the difference unit values, and astandard primary report.
Compute rainfall amounts (RAIN)
PRIMARY computes rainfall unit value amounts by calculating the difference betweensuccessive input unit values. It computes daily values by accumulating the differences. Ifspecified in the computation instructions, the unit values are filtered for “noise,” that is,negative differences are set to zero. Output consists of the filtered unit value rainfallamounts, the daily sum of the amounts, and a rainfall primary report.
Compute second parameter using a rating (GENR)
PRIMARY computes generic output unit values from input unit values using a rating tableor equation. This computation type is used for all two-parameter computations exceptreservoir contents and discharge. Output consists of computed unit values, computeddaily values for both the input and output parameters, and a standard primary report.
ADAPS 34 NWIS User

ADAPS: Chapter 3. Overview of Data Processing
Compute reservoir contents (RCNT)
PRIMARY computes reservoir contents unit values from elevation unit values using anelevation-contents rating, and it computes daily values of both elevations and contents.Output consists of computed contents unit values, computed elevation daily values,computed contents daily values, and a reservoir contents primary report.
Compute discharge from stage (STGQ)
PRIMARY computes discharge unit values from stage unit values using a rating table orequation. Shifts may be applied to the stage values prior to computing discharge tocompensate for changes in the river environment. It computes daily values for both stageand discharge. Output consists of computed discharge unit values, stage daily values,discharge daily values, and a stage-discharge primary report.
Compute discharge from stage and water-surface slope (SLPQ)
PRIMARY computes discharge unit values from stages measured at two sites, onedownstream of the other. One site is designated the base gage and the other site theauxiliary gage. Discharge is based on the stage at the base gage and the slope (fall) of thewater surface between the two sites. The calculations require three ratings: the basedischarge curve (rating type STGQ), the fall curve (FALL), and the discharge factor curve(FLFC). Shifts can be applied to the base gage height, but only to obtain a value from thebase discharge curve. Shifts are not used when computing fall or when obtaining a valuefrom the fall curve. Output consists of computed discharge unit values, base stage dailyvalues, auxiliary gage daily values, discharge daily values, and a slope-discharge primaryreport.
Compute discharge from stage and index velocity (VELQ)
PRIMARY computes discharge unit values from the stage and index velocity measured atthe site. The gage measuring index velocity is designated the base gage and the gagemeasuring stage the auxiliary gage. The discharge calculations are made using one of twomethods. The first method uses up to three ratings: the index velocity versus meanvelocity curve (rating type VELO), the stage versus cross-sectional-area curve for astandard cross section (STAR), and the stage velocity factor curve (STCO). The secondmethod uses an equation that calculates mean velocity from the index velocity and stage.The equation is of the form
where v = mean velocity,v = index velocity,s = stage, and
Cx,Cy,C0 = coefficients.
v Cxv Cyvs C0+ +=
ADAPS 35 NWIS User

ADAPS Chapter 3: Overview of Data Processing
The coefficients are determined from a regression analysis of mean velocity, indexvelocity, and stage data. The equation replaces the VELO and STCO ratings. The type ofcalculation that is performed is specified in the processor record. When used, the equationcoefficients also are stored in the processor record.
Shifts can be applied to the index velocity, but not to the gage height. Output consists ofdischarge unit values, stage daily values, mean velocity daily values, and a velocity-discharge primary report.
Daily values computations
Daily values are computed by all primary computations types. A daily value summarizesthe unit values collected during the day into a single value according to the statisticscode(s) assigned for computation. The daily interval is measured from midnight tomidnight. Unit values from which daily values are computed must meet various relationalcriteria, depending on the data type.
Daily values primary computations statistics codes
The ADAPS statistics codes that can be processed during primary computations are listedin table 11. The statistic code 32400 denotes end-of-day midnight observations.
Daily values time interval
Daily values are computed using unit values collected between midnights local time. Bothbeginning and ending midnight values are used in the calculation of all statistics exceptsum (statistics code 00006), whereupon only the ending midnight value is used. Becauseboth midnight values are used in the interval, it is possible (for example) that one day’smaximum value is the next day’s minimum value. Similarly, if a maximum value occursat midnight the value can be the same maximum value for the two adjacent days.
Table 11: Statistics codes processed by PRIMARY
Code Name Description
00001 Maximum Maximum values00002 Minimum Minimum values00003 Mean Mean values00006 Sum Sum of values00007 Mode Modal values00008 Median Median values00009 STD Standard deviation values00010 Variance Variance values00021 Tidal high High high-tide values00022 Tidal low-high Low high-tide values00023 Tidal high-low High low-tide values00024 Tidal low Low low-tide values3hhmm Observation at hhmm Instantaneous observation at time hhmm where
hhmm runs from 0001 to 2400.
ADAPS 36 NWIS User

ADAPS: Chapter 3. Overview of Data Processing
Daily values computations criteria
Daily values are computed only from unit values that meet these relational criteria: (1) themaximum difference between any two adjacent unit values is less than or equal to a presetthreshold, and (2) the maximum time interval between any two adjacent unit values is lessthan a preset time interval. When a threshold is exceeded during daily valuescomputations, a message describing the failed threshold is displayed in the primary reportand a daily value is not computed for the day. The thresholds are established individuallyfor each DD.
Daily mean values computations
Daily mean values are computed forparameters that have instantaneous unitvalues (statistics code 00011). They arecomputed using the trapezoidal method ofapproximate integration: the daily mean valueis equal to the total area under the unit-valuescurve divided by 24 hours (or 1,440 minutesor 86,400 seconds). The total area is the sumof the trapezoidal areas defined by the unitvalues. A schematic of the trapezoidalmethod is shown in figure 10.
The instantaneous values can be irregularlyspaced, that is, the time interval betweenvalues can be of varying lengths. If aninstantaneous value is not measured at a dayboundary (00:00:00, or midnight), a value isinterpolated from the two values measuredbefore and after midnight. The values and thetime interval between the values from whichthe interpolated midnight values arecomputed must satisfy the criteria establishedfor computing daily values.
Daylight savings computations
Mean daily values are computed as followson days when the time changes to (“springforward”) or from (“fall back”) daylightsavings time: On the spring forward day, the mean daily value is computed for a 23-hourday; on the fall back day, it is computed for a 25-hour day.
Partial-day computations
Mean daily values are computed for days that do not have a complete set of unit values,but the values are not stored in ADAPS. They are computed only for display in theprimary report.
Figure 10. Schematic of computation of dailymean values. [v0, value at midnight; vi, ith valueafter midnight; ti, elapsed time since midnight ofith value; n, number of trapezoids; t0, startingtime (= 0 hrs); tn, ending time (= 24 hours).]
0 hrs
ti-1, ti,
vi-1
vi
Ai
Trapezoidal area: , i = 1, 2, ..., n
Daily mean value:
Ai
vi vi 1–+( ) ti ti 1––( )⋅2
-----------------------------------------------=
DV1tn---- Ai
i 1=
n
∑⋅=
t0, t1, tn• • •, • • •,
v0v1
vn
Total area under curve
Instantaneous unit value
Interpolated unit value
Trapezoidal area
(00:00:00)(midnight)
24 hrs(00:00:00)(midnight)
ADAPS 37 NWIS User

ADAPS Chapter 3: Overview of Data Processing
Daily values editing (HYDRA)
Computed daily values are edited using HYDRA. Just as for editing unit values, HYDRAhas the capability of importing other data as reference curves, changing or deleting values,and flagging values. Daily values also can be estimated using the estimation routineMISTE.
Daily values that have been edited can be flagged and write-protected. Write-protectedvalues are called final daily values. They can no longer be altered within ADAPS unlessthe write-protect flag is explicitly removed. The daily values remarks codes are listed intable 12.
3.10.5 Preparing Final Records
The following paragraphs describe procedures that are done after the unit and daily valueshave been processed.
Summary statistics computation
Summary statistics are computed and stored as separate data in ADAPS. The procedure tocompute and store them is initiated manually.
Peak above base computations
Unit values for a particular DD may be analyzed for peaks occurring above a thresholdvalue. This computation is generally performed on discharge data, but it can be used forother parameters.
Peak flow file
Annual peak discharges are stored manually in the peak flow file.
Station analysis
A preliminary station analysis report may be generated to list for a year all of the datacorrections, ratings, and shifts with comments that were used, the periods of missing dailyvalues, and the periods of estimated daily values. The procedure is initiated manually.
Table 12: Daily values remarks codes
Code Description
e Value was edited or estimated by USGS personnel and is write protected& Value was computed from affected unit values< Value is known to be less than the reported value and is write protected> Value is known to be greater than the reported value and is write protected1 Value is write protected without any remark code to be printed
(blank) No remark
ADAPS 38 NWIS User
bhoopes
Records

ADAPS: Chapter 3. Overview of Data Processing
3.10.6 Approving Data
Data that have been processed must be officially approved. The initial status of all data is“Working.” After they have been processed, the status is changed to “In-Review,” andafter they are reviewed, to “Approved.” Only persons with ADBA or SYST access (table1) can change the data status level to “Approved.” If data marked “Approved” must besubsequently re-edited, the status must be changed back to “Working.” Only persons withSYST access can change the status of “Approved” data back to “Working.” The section ondata aging (Section 3.8) describes the three status levels of data in ADAPS.
3.10.7 Publishing State Annual Water-Data Reports
Water data are published annually in State water-data reports. Each District is responsiblefor publishing the data collected within its jurisdiction. The reports are produced usingguidelines recommended by the U.S. Geological Survey and guidelines specific to theneeds of each State. Generally the data that are published include for each site: siteinformation (location, drainage area, period of record, and other facts), a daily values tablefor each data type, and current-year and period-of-record statistics about the unit and dailyvalues for each data type as appropriate. Some States also include hydrographs. MostStates use the daily values tables in the format produced by ADAPS.
ADAPS 39 NWIS User