Secrets of Top Performers: How Companies With Highly Effective
49
Secrets of Top Performers: How Companies With Highly Effective Employee Communication Differentiate Themselves – the Methodology Behind the 2007/2008 Communication ROI Study TM by: Richard Luss and Steven Nyce January 11, 2008 The opinions and conclusions stated here are the authors’ and should not be construed to be those of Watson Wyatt Worldwide or any of its other associates.
Transcript of Secrets of Top Performers: How Companies With Highly Effective
Secrets of Top Performers: How Companies With Highly Effective Employee Communication Differentiate
Themselves – the Methodology Behind the 2007/2008 Communication ROI StudyTM
by:
Richard Luss
and
Steven Nyce
January 11, 2008
The opinions and conclusions stated here are the authors’ and should not be construed to be those of Watson Wyatt Worldwide or any of its other associates.

2
Executive Summary Six years of Watson Wyatt research confirm that effective employee communication is a leading indicator of financial performance. The 2007/2008 Watson Wyatt Communication ROI Study™ leverages data collected from 264 companies representing 6.2 million employees around the world. It confirms that the positive correlation between effective communication and financial performance extends worldwide. The study also describes the evolution of communication practices since we launched this study, in 2003/2004. This paper offers insight into the statistical methodologies used to measure communication effectiveness and its relationship to performance, as well as the policies and practices that differentiate organizations that communicate most effectively from those that communicate least ineffectively. Together, the study and the white paper enable communication professionals to build a compelling business case for more staff and budget, allocate limited time and resources more effectively and get the highest return on investment from their employee communication programs.
Key Findings Effective employee communication remains a leading indicator of financial
performance worldwide. Companies with the most effective employee communication programs delivered a 91
percent total return to shareholders (TRS) from 2002 to 2006 compared with 62 percent for firms that communicate least effectively. Moreover, a significant improvement in communication effectiveness is associated with a nearly 16 percent increase in market value.
Employee communication programs that drive behavioral change have the strongest
correlation to financial performance. All nine best practices that constitute the Watson Wyatt Hierarchy of Effective
Communication continue to be positively correlated to financial performance. The number of high-effectiveness companies that measure employee behavior change
has increased by almost 25 percent since the 2003/2004 study. Since the 2003/2004 study, there has been a decline in the number of high-performing
companies that explain the reasons behind major decisions and solicit meaningful input from employees on decisions that will affect them and how the work gets done.

3
Table of Contents EXECUTIVE SUMMARY .......................................................................................................................... 2 KEY FINDINGS........................................................................................................................................... 2 TABLE OF CONTENTS ............................................................................................................................. 3 INTRODUCTION ........................................................................................................................................ 4 ABOUT THE SURVEY ............................................................................................................................... 4 THE METHODOLOGY BEHIND COMMUNICATION EFFECTIVENESS.................................... 10
CREATING RELIABLE SCALES TO MEASURE COMMUNICATION PROGRAMS AND EFFECTIVENESS ............ 10 LINKING COMMUNICATION EFFECTIVENESS TO SHAREHOLDER VALUE ................................................... 12 MULTIVARIATE REGRESSION RESULTS .................................................................................................... 16 EFFECTIVE COMMUNICATION AS A LEADING INDICATOR OF FINANCIAL PERFORMANCE ......................... 19
EFFECTIVE COMMUNICATION PROGRAMS AND PRACTICES................................................ 21 ESTIMATING THE EFFECT OF COMMUNICATION DIMENSIONS ON MARKET VALUE .................................. 21
HIERARCHY OF EFFECTIVE COMMUNICATION: THE CHARACTERISTICS OF HIGHLY EFFECTIVE COMMUNICATION.......................................................................................................... 24
BUILDING THE FOUNDATION .................................................................................................................... 25 Follows a Formal Process .................................................................................................................. 25 Uses Employee Feedback.................................................................................................................... 26 Integrates Total Rewards.................................................................................................................... 27 Leverages Technology ........................................................................................................................ 28
EVOLVING THROUGH STRATEGIC COMMUNICATION................................................................................ 30 Facilitates Change .............................................................................................................................. 30 Focuses on Continuous Improvement ................................................................................................. 31 Connects to the Business Strategy ...................................................................................................... 33
EFFECTING CHANGE AT A BEHAVIORAL LEVEL ....................................................................................... 34 Drives Supervisory/Managerial Behavior .......................................................................................... 35 Drives Employee Behavior.................................................................................................................. 36
EMPLOYEE ENGAGEMENT ................................................................................................................. 37 COMMUNICATING EFFECTIVELY IN A GLOBAL WORKPLACE ............................................. 38 TRENDS: WHAT WE’VE LEARNED IN SIX YEARS OF COMMUNICATION ROI STUDIES.. 41 CONCLUSION........................................................................................................................................... 44 APPENDIX – REGIONAL DETAIL ....................................................................................................... 45
BUILDING THE FOUNDATION .................................................................................................................. 45 EVOLVING THROUGH STRATEGIC COMMUNICATION........................................................................... 47 EFFECTING CHANGE AT A BEHAVIORAL LEVEL ................................................................................... 49
4
Introduction The 2007/2008 Watson Wyatt Communication ROI Study™ examines the
relationship between an organization’s communication practices and its business
performance. The 2003/2004 and the 2005/2006 studies showed that companies with
effective communication practices earn significantly higher market premiums than their
competitors. For the third fielding of this study, we again estimate the impact of effective
communication on employee retention, productivity and market premium for
shareholders, and identify the characteristics of an effective communication program. The
study also suggests ways that firms can enhance shareholder returns by changing the
culture and methods of communication across their organization.
Building on previous studies, we identify trends – both positive and negative – in
key communication policies and practices since 2003. Finally, this year’s study stretches
beyond North America into Europe and Asia-Pacific.
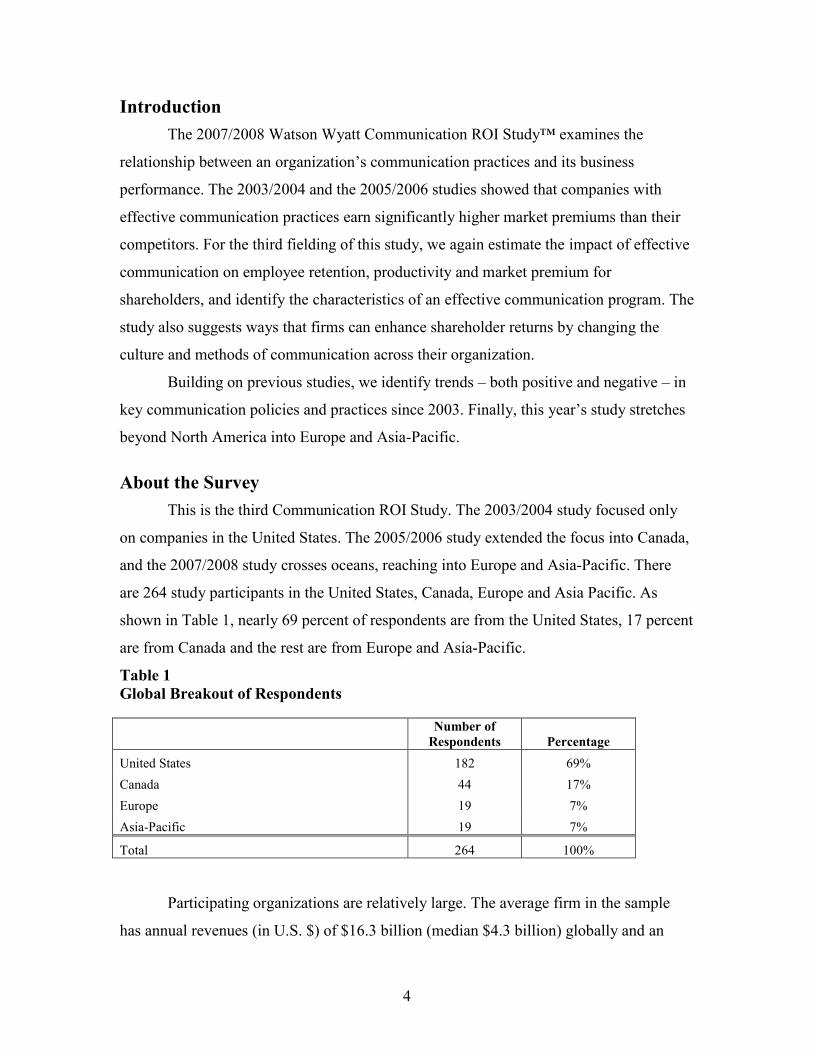
About the Survey This is the third Communication ROI Study. The 2003/2004 study focused only
on companies in the United States. The 2005/2006 study extended the focus into Canada,
and the 2007/2008 study crosses oceans, reaching into Europe and Asia-Pacific. There
are 264 study participants in the United States, Canada, Europe and Asia Pacific. As
shown in Table 1, nearly 69 percent of respondents are from the United States, 17 percent
are from Canada and the rest are from Europe and Asia-Pacific.
Table 1 Global Breakout of Respondents Number of
Respondents Percentage United States 182 69% Canada 44 17% Europe 19 7% Asia-Pacific 19 7%
Total 264 100% Participating organizations are relatively large. The average firm in the sample
has annual revenues (in U.S. $) of $16.3 billion (median $4.3 billion) globally and an

5
average of $5.2 billion (median $1.7 billion) in its home country (defined as the country
of the survey respondent).1 Table 2 breaks out respondents by organization size as
measured by the number of global employees. Nearly half the companies employ 10,000
or more employees globally. The breakdown of respondents by the number of global
employees for this year’s study is very similar to those in previous years.
Table 2 Percentage of Respondents by Employer Size
Number of Global Employees 2007 All Years
(2003 thru 2007)
Less than 1,000 14.5% 11.9%
1,000 to 2,499 11.2% 10.8%
2,500 to 4,999 12.2% 14.7%
5,000 to 9,999 18.2% 20.1%
10,000 to 24,999 20.6% 19.5%
More than 25,000 23.4% 23.0%
Table 3 indicates the average number of global employees and employees in the
respondent’s home country. The average respondent has 31,464 employees in its global
operation, of which 2,948 work part-time, and employs 17,273 workers in its home
country. Table 3 Average Number of Employees by Country/Region
Global Employees Home Country
Employees
United States 30,277 22,615
Canada 18,342 4,273
Europe 14,411 11,343
Asia-Pacific 83,149 7,445
Average 31,464 17,273
Median 9,000 5,687
1 Surveys are primarily fielded by individuals in the company’s corporate headquarters. However, the home country can include respondents in satellite offices of a global company. As such, the home country of a respondent may be different from their company’s corporate headquarters.
6
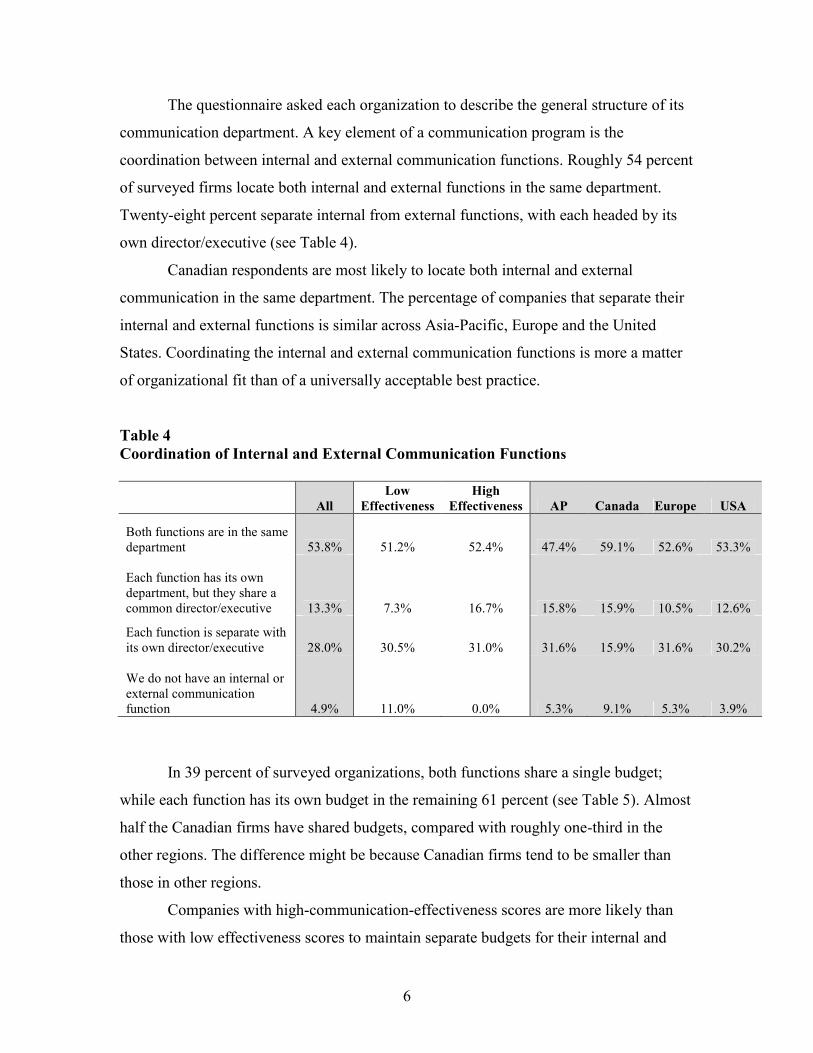
The questionnaire asked each organization to describe the general structure of its
communication department. A key element of a communication program is the
coordination between internal and external communication functions. Roughly 54 percent
of surveyed firms locate both internal and external functions in the same department.
Twenty-eight percent separate internal from external functions, with each headed by its
own director/executive (see Table 4).
Canadian respondents are most likely to locate both internal and external
communication in the same department. The percentage of companies that separate their
internal and external functions is similar across Asia-Pacific, Europe and the United
States. Coordinating the internal and external communication functions is more a matter
of organizational fit than of a universally acceptable best practice.
Table 4 Coordination of Internal and External Communication Functions
All Low
Effectiveness High
Effectiveness AP Canada Europe USA
Both functions are in the same department 53.8% 51.2% 52.4% 47.4% 59.1% 52.6% 53.3%
Each function has its own department, but they share a common director/executive 13.3% 7.3% 16.7% 15.8% 15.9% 10.5% 12.6%
Each function is separate with its own director/executive 28.0% 30.5% 31.0% 31.6% 15.9% 31.6% 30.2% We do not have an internal or external communication function 4.9% 11.0% 0.0% 5.3% 9.1% 5.3% 3.9%
In 39 percent of surveyed organizations, both functions share a single budget;
while each function has its own budget in the remaining 61 percent (see Table 5). Almost
half the Canadian firms have shared budgets, compared with roughly one-third in the
other regions. The difference might be because Canadian firms tend to be smaller than
those in other regions.
Companies with high-communication-effectiveness scores are more likely than
those with low effectiveness scores to maintain separate budgets for their internal and

7
external communication functions. This might be partly because a disproportionately low
percentage of Canadian respondents fall into the high effectiveness category – 26.2
percent versus 33.3 percent for the entire sample. However, given that Canadian
respondents make up only 17 percent of the total, the “Canadian effect” would not
entirely explain the propensity for high-effectiveness companies to maintain separate
budgets.
Table 5 Coordination of Internal and External Communication Budgets
All Low
Effectiveness High
Effectiveness AP Canada Europe USA Both functions share the same budget 39.0% 48.8% 33.3% 33.3% 48.8% 33.3% 37.8% Each function has its own budget 61.0% 51.3% 66.7% 66.7% 51.2% 66.7% 62.2%
Table 6 shows the average expenditures per employee in companies with separate
budgets for their internal and external communication functions. The average expenditure
is $158 per employee, adding up to a communication budget of roughly $1.2 million. Of
the total budget, roughly 60 percent is devoted to external communication and 40 percent
to internal communication. Companies with the most effective communication programs
spend more than twice as much per employee as low-effectiveness companies ($277 vs.
$116). Moreover, high-effectiveness companies spend a larger share of their budget on
internal communication (40 percent) than low-effectiveness companies (28 percent).
Table 6 Annual Budget per Global Employee for Internal and External Communication
U.S. Dollars Internal External
Total – Per Global Employee Total
All (N=114) $61 $97 $158 $1,225,000
Cx Effectiveness Group: High $112 $165 $277 $2,000,000 Medium $62 $104 $166 $1,250,000 Low $33 $83 $116 $750,000

8
Most responding companies (60 percent) centralize their communication staff in
the corporate office (see Table 7). This is consistent among both high- and low-
effectiveness companies. However, in nearly 38 percent of low-effectiveness companies,
the internal communication staff is either not centralized or only partially centralized,
compared with roughly 12 percent of high-effectiveness companies.
Centralization varies widely across regions. North American companies are much
more likely to centralize their staffing structure, while European companies appear to
prefer a decentralized model. This may reflect the language differences across European
borders, which necessitate a local communication staff able to customize corporate
communications in terms of languages and customs.
Table 7 Extent of Centralized Internal Communication Staff
All Low
Effectiveness High
Effectiveness AP Canada Europe USA
Not at all or to a small extent 22.6% 37.5% 11.9% 26.3% 23.3% 47.4% 19.4%
To a moderate extent 18.8% 8.8% 31.0% 26.3% 11.6% 15.8% 20.0%
To a great or very great extent 58.6% 53.8% 57.1% 47.4% 65.1% 36.8% 60.6%
We also asked executives in North American companies about their
organizations’ voluntary and involuntary turnover rates for management/professionals
and for all employees. As Figure 1 shows, average annual turnover rates were nearly 9
percent for management/professionals and 14.2 percent for all employees. The turnover
rates are limited to North American organizations to provide comparable rates over time.
Reported voluntary turnover rates were considerably higher in 2007 than in 2005. The
increase could reflect changes to the labor market environment and/or to the sector
composition of respondents between the two years. It is also consistent with Playing to
Win in a Global Economy 2007/2008 Global Strategic Rewards® Report,2 which states
that employee retention has become increasingly difficult in the United States. However,
when study participants were asked to rank their turnover rates against those of their
2 Playing to Win in a Global Economy 2007/2008 Global Strategic Rewards® Report, Page 17, Figure 13.

9
peers, relative rates appear comparable to those reported by respondents in 2005 (see
Figure 2). On average, roughly 90 percent of respondents indicated that their turnover
rate is at or below those of their competitors.
Figure 1 Voluntary and Involuntary Turnover Rates
5.0%
6.8%8.0%
10.9%
2.0% 2.0%3.0% 3.3%
0%
2%
4%
6%
8%
10%
12%
2005 2007 2005 2007
VoluntaryInvoluntary
Note: Limited to North American companies. Figure 2 Turnover Rates and Market Comparisons
93%95%
90%
87%
92%
94%
91%
94%
80%
100%
2005 2007 2005 2007
VoluntaryInvoluntary
Note: Limited to North American companies.
Table 8 shows the percentage of respondents in each industry for the 2007/2008
survey and the combined respondents for 2003 through 2007. The distribution of
Management/professional All employees
Management/professional All employees

10
companies across industry sectors in the 2007 sample is very similar to the distributions
in all years. However, this year’s sample has a slightly higher proportion of financial and
IT & telecommunications companies. Table 8 Percentage of Respondents by Industry Sector
2007
All Years (2003 – 2007)
Basic materials 1.7% 2.6%
Finance/insurance/real estate 23.5% 20.7%
General services 3.4% 6.9%
Government/public services 5.6% 5.1%
Health care 12.9% 11.7%
IT & telecommunications 15.6% 12.3%
Manufacturing 19.6% 21.2%
Media & entertainment 2.2% 2.4%
Utilities 5.6% 6.9%
Wholesale & retail trade 10.1% 10.4%
The Methodology Behind Communication Effectiveness The 2007 Communication ROI survey asked respondents more than 150 questions
about their organization’s overall effectiveness in communication along several
dimensions and about their policies and practices. Most of the questions in the 2007 study
were used in at least two and often all three studies. This enables us to identify and
measure important trends and to rely mostly on tried and tested constructs for scale
reliability.
Creating Reliable Scales to Measure Communication Programs and Effectiveness This study uses the characteristics listed below to define communication
effectiveness. We developed a series of questions around each characteristic and assigned
an effectiveness score to each participant based on its responses.
Helping employees understand the business
Providing employees with financial information and objectives
Exhibiting strong leadership by management during organizational change
11
Aligning employees’ actions with customer needs
Educating employees about organizational culture and values
Explaining and promoting new programs and policies
Integrating new employees into the organization
Providing employees with information about the value of their total rewards program
In addition to communication effectiveness, we created and tested nine additional
scales using most of the questions from the survey. These scales represent different
aspects of communication policies and practices including:
Drives supervisors’/managers’ behavior
Drives employee behavior
Facilitates change
Focuses on continuous improvement
Connects to the business strategy
Follows a formal process
Uses employee feedback
Integrates total rewards
Leverages technology
Together with communication effectiveness, these scales represent the 10 boxes
in the hierarchy of effective communication discussed below (see Figure 4).
Before using the scores in these scales, we performed statistical tests to confirm
their reliability. We used the Cronbach alpha measure for scale reliability based on
internal consistency (Cronbach 1951). The Cronbach alpha coefficient is a measure
between 0 and 1 that increases along with correlation. For a scale to be considered
reliable, the alpha coefficient must be at least 0.70 (the standard criterion). The
Communication Effectiveness construct had an alpha of 0.87 (see Table 9). Other scales
also had Cronbach alphas greater than 0.70, indicating their reliability for measuring
aspects of communication programs. In Tables 14 through 22 below, we provide
additional information on the specific survey items used to create each scale.

12
Table 9 Scale Reliability for all Scores Used in Communication ROI Report Scale Cronbach Alpha
Communication effectiveness 0.87
Drives supervisors’/managers’ behavior 0.81
Drives employee behavior 0.83
Facilitates change 0.82
Focuses on continuous improvement 0.79
Connects to the business strategy 0.81
Follows a formal process 0.85
Uses employee feedback 0.79
Integrates total rewards 0.77
Leverages technology 0.78
After determining that the items formed reliable scales, we scored each
organization that completed the survey on all the scales listed above. We assigned an
overall score to each company by summing an equally weighted value of its responses to
the items in each scale. The communication effectiveness score captures all facets of
effective communication in a single summary measure. Firms scoring the highest
effectiveness score are the most effective communicators. Although all the activities are
crucial to enhancing communication, no single activity guarantees a successful
communication program. Instead, the most successful organizations integrate these
tactics and processes into a results-oriented and effective program.
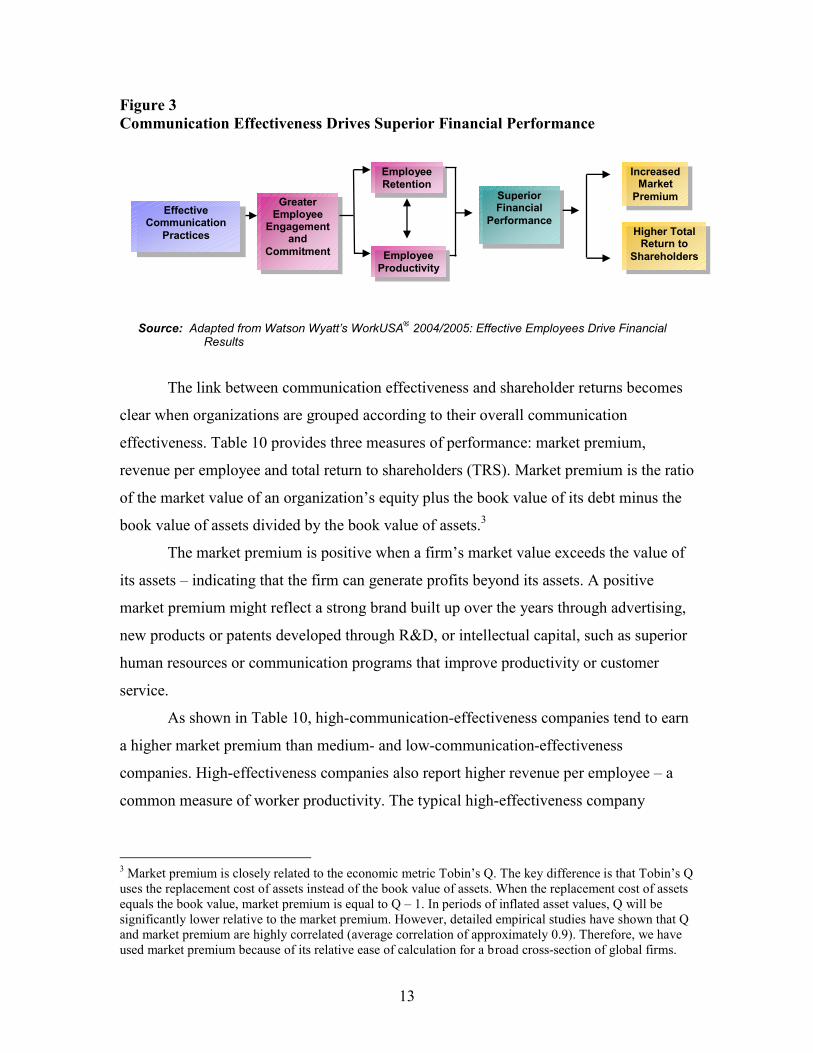
Linking Communication Effectiveness to Shareholder Value Figure 3 shows how effective communication practices enhance employee
engagement, commitment, retention and productivity. These improvements in turn create
better financial performance and, ultimately, greater returns to shareholders and higher
market premium.
13
Figure 3 Communication Effectiveness Drives Superior Financial Performance
The link between communication effectiveness and shareholder returns becomes
clear when organizations are grouped according to their overall communication
effectiveness. Table 10 provides three measures of performance: market premium,
revenue per employee and total return to shareholders (TRS). Market premium is the ratio
of the market value of an organization’s equity plus the book value of its debt minus the
book value of assets divided by the book value of assets.3
The market premium is positive when a firm’s market value exceeds the value of
its assets – indicating that the firm can generate profits beyond its assets. A positive
market premium might reflect a strong brand built up over the years through advertising,
new products or patents developed through R&D, or intellectual capital, such as superior
human resources or communication programs that improve productivity or customer
service.
As shown in Table 10, high-communication-effectiveness companies tend to earn
a higher market premium than medium- and low-communication-effectiveness
companies. High-effectiveness companies also report higher revenue per employee – a
common measure of worker productivity. The typical high-effectiveness company
3 Market premium is closely related to the economic metric Tobin’s Q. The key difference is that Tobin’s Q uses the replacement cost of assets instead of the book value of assets. When the replacement cost of assets equals the book value, market premium is equal to Q – 1. In periods of inflated asset values, Q will be significantly lower relative to the market premium. However, detailed empirical studies have shown that Q and market premium are highly correlated (average correlation of approximately 0.9). Therefore, we have used market premium because of its relative ease of calculation for a broad cross-section of global firms.
Source: Adapted from Watson Wyatt’s WorkUSA® 2004/2005: Effective Employees Drive Financial Results
Greater Employee
Engagement and
Commitment
Superior Financial
Performance
Increased Market
Premium
Higher Total Return to
Shareholders
Employee Retention
Employee Productivity
Effective Communication
Practices

14
generates about $420,000 in sales per employee compared with $282,000 for the typical
low-effectiveness company – a difference of about 49 percent.
When TRS is compared in terms of communication effectiveness, organizations
that communicate effectively earn higher total shareholder returns than their peers.
Companies that are the most effective communicators experienced a 91 percent TRS
from 2002 through 2006, compared with a 62 percent return for firms that communicate
less effectively. Investing $100 dollars in the typical high-communication-effectiveness
company in 2002 would return $191 dollars in 2006 — whereas investing the same
amount in a typical low-effectiveness company would return only $162. During the last
five years, shareholder returns were roughly 47 percent higher for the most effective
communicators than for the least effective communicators. Table 10 High Levels of Communication Effectiveness Lead to Greater Shareholder Value
Communication Effectiveness
Number of Companies Market Premium
Revenue per Employee ($000s)
5-Year TRS (2002-06)
High 57 32% $420 91.1
Medium 53 8% $363 77.1
Low 48 1% $282 62.0 Notes: Market premium is (the market value of equity plus book value of debt minus the book value of assets) divided by the book value of assets. Includes those publicly traded companies where financial information was available. Source: Watson Wyatt Worldwide 2007/2008 Communication ROI Survey and Standard & Poor’s Compustat database.
Survey participants reported their company’s turnover rates for
management/professionals and for all employees. As shown in Table 11, firms that
communicate most effectively report below-average turnover rates for both groups. This
result is consistent with the results of our 2003/2004 and 2005/2006 surveys. In 2007,
highly effective communicators were almost 80 percent more likely than less effective
communicators to say their turnover rate was lower than their competitors’ rates –
roughly equivalent to our 2003 study. In 2005, however, the difference between highly
effective communicators and less effective communicators was only about 20 percent.
This is partly because 2005/2006 respondents were much more likely than 2003

15
respondents to report having lower turnover rates than their competitors. This was
particularly true among the least effective communicators. Moreover, turnover rates were
lower in 2005 than in 2007, as shown earlier in Figure 1.
Table 11 Low Levels of Communication Effectiveness Lead to Greater Turnover Relative to Peers
Communication Effectiveness
Management/professional High Low Ratio
2007 64.7% 38.1% 1.70
2005 66.7% 52.8% 1.26
2003 51.7% 31.8% 1.63
All employees High Low Ratio
2007 65.0% 36.4% 1.79
2005 57.4% 49.8% 1.15
2003 51.6% 33.3% 1.55 Notes: Percentages represent firms answering “below” or “significantly below” when asked to compare their turnover rates with those of their competitors. Results include only U.S. responses in order to provide comparable rates over all three studies. The conclusions from Tables 10 and 11 are consistent with the model in Figure 3. In
companies whose communications are highly effective:
Employer turnover is lower.
Employee productivity is higher.
Profits are higher and market premium is significant.
Long-term (five-year) shareholder returns are superior.
The evidence demonstrates a strong correlation among these variables, supporting the
hypothesis that improved communication effectiveness leads to better financial
performance.
16
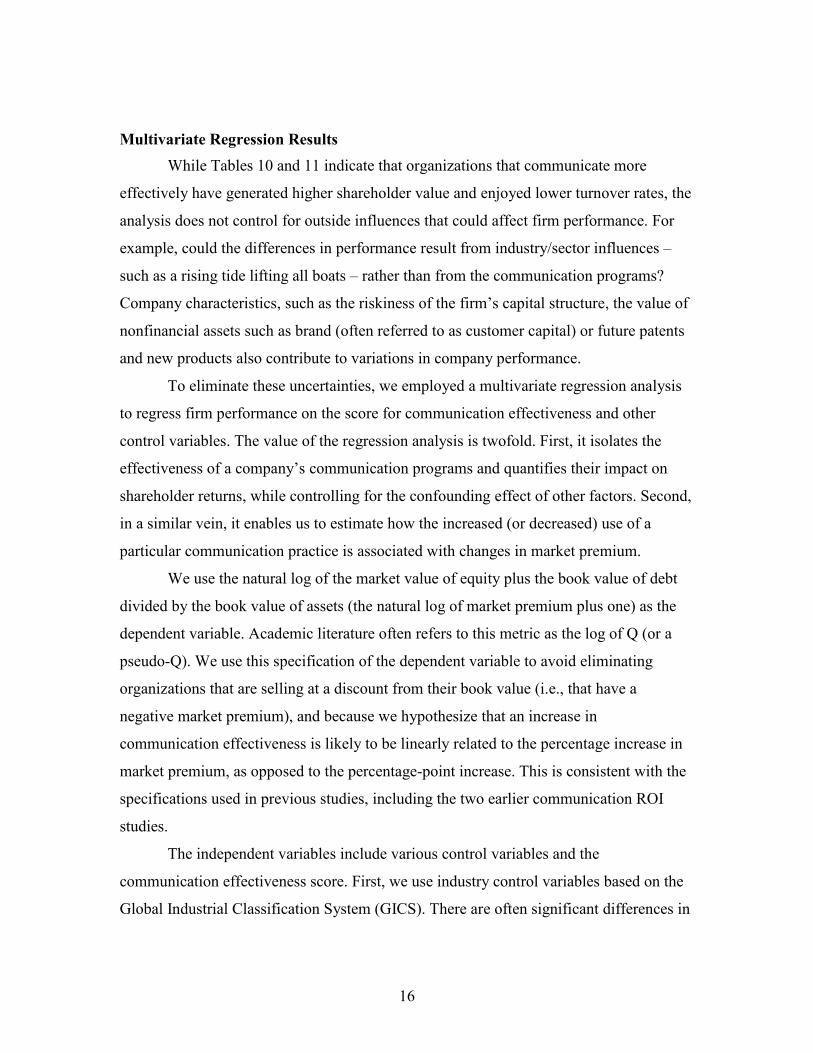
Multivariate Regression Results While Tables 10 and 11 indicate that organizations that communicate more
effectively have generated higher shareholder value and enjoyed lower turnover rates, the
analysis does not control for outside influences that could affect firm performance. For
example, could the differences in performance result from industry/sector influences –
such as a rising tide lifting all boats – rather than from the communication programs?
Company characteristics, such as the riskiness of the firm’s capital structure, the value of
nonfinancial assets such as brand (often referred to as customer capital) or future patents
and new products also contribute to variations in company performance.
To eliminate these uncertainties, we employed a multivariate regression analysis
to regress firm performance on the score for communication effectiveness and other
control variables. The value of the regression analysis is twofold. First, it isolates the
effectiveness of a company’s communication programs and quantifies their impact on
shareholder returns, while controlling for the confounding effect of other factors. Second,
in a similar vein, it enables us to estimate how the increased (or decreased) use of a
particular communication practice is associated with changes in market premium.
We use the natural log of the market value of equity plus the book value of debt
divided by the book value of assets (the natural log of market premium plus one) as the
dependent variable. Academic literature often refers to this metric as the log of Q (or a
pseudo-Q). We use this specification of the dependent variable to avoid eliminating
organizations that are selling at a discount from their book value (i.e., that have a
negative market premium), and because we hypothesize that an increase in
communication effectiveness is likely to be linearly related to the percentage increase in
market premium, as opposed to the percentage-point increase. This is consistent with the
specifications used in previous studies, including the two earlier communication ROI
studies.
The independent variables include various control variables and the
communication effectiveness score. First, we use industry control variables based on the
Global Industrial Classification System (GICS). There are often significant differences in

17
market premiums across industries that reflect differences in accounting conventions and
industry competitiveness.
A firm’s potential earning ability also depends on factors such as market position,
patents and expertise. The specification we used for this analysis controls for these
factors by including the ratio of R&D expenditures plus advertising expenditures relative
to total assets. Though these expenses do not purchase assets that appear on the balance
sheet, such as new equipment, they can create market value through branding and
creating new products and raise the observed market premium.
We also use a second control: capital intensity as measured by the ratio of assets
to employees. This enables us to control for the firm’s capital structure and, more
importantly, for expenditures on human capital. We have to resort to an indirect measure
of labor expenses because more direct measures are not publicly available.
The risk associated with a firm’s capital structure plays an important role in
variations in market premiums across organizations. All else being equal, firms with
more debt relative to assets are at higher risk of bankruptcy, and the higher debt limits
investment opportunities. As in earlier studies, we also include size as a control variable,
because larger firms tend to be in multiple lines of business. Previous research has shown
that firms with multiple lines of business generally have lower market premiums,
particularly if the lines are unrelated.
We estimate the relationship between communication effectiveness and
shareholder value for different model specifications. This approach checks the robustness
of the estimates by eliminating various control variables from the model specification.
The estimates in Table 12 are standardized to represent the effect on market premium of a
one-standard-deviation change in communication effectiveness (and any other
independent variable).
Regression 1 represents the global database and is the estimated impact used in
the report. Regressions 2 through 4 are for North American firms only and are directly
comparable to the regressions performed with the 2005 data – which are reproduced in
regressions 5 through 7 in Table 12. The estimates in Table 12 indicate that
communication effectiveness is significantly related to market premium, and the impact
is robust across various specifications. In addition, comparing the estimated impact in

18
regressions 2 through 4 with the estimated impact of communication effectiveness in
regressions 5 through 7 confirms that the relationship between communication
effectiveness and market premium has been fairly strong and stable across time periods –
the differences are well within the margin of error based on our sample sizes.
Table 12 Regression Results of Communication Effectiveness and Shareholder Value
2007 Analysis 2005 Analysis
STD Betas (t-values) (1)
(2)
(3)
(4) (5) (6) (7)
Comm. effective .1107 0.1343 0.1429 0.0937 0.1299 0.1191 0.1013 1.72 1.98 2.02 1.07 2.37 2.16 1.43
Research & development -.0051 -
0.0006 0.0639 -0.1978 0.1596 0.1418 0.4501 -0.07 -0.01 0.79 -2.24 2.41 2.23 6.37
Capital intensity -.3003 -
0.3678 -0.1350 -2.50 -2.98 -1.60 Leverage .1449 0.1763 0.1181 1.98 2.32 1.81
United States (=1) -.0218 -
0.0082 0.0189 -0.0337 0.04112 0.0360 -0.0572 -0.22 -0.12 0.26 -0.38 0.74 0.64 -0.81 Asia-Pacific (=1) .0780 0.94 Europe (=1) -0321 -0.41
Size -.1828 -
0.1677 -
0.2494 -.3422 -0.0442 -0.0599 0.0209 -2.56 -2.30 -3.49 -3.94 -0.74 -1.03 0.30
Industries1 X X X
X X
RSquare .5449 .5667 .5389 .1507
0.5824 0.5680 0.2247 Adj RSquare .4913 .5090 .5208 .1211 0.5429 0.5335 0.2051 N 136 120 120 120 163 163 163
F Value2 9.21 9.81 9.69 5.10 14.74 16.44 11.45 Notes: 1 Utilities is the base industry and Canada is the base country/region for all regressions. 2 All values are significant at the 1 percent level.

19
The coefficient presented in Table 12 is the estimated effect of a one-standard-
deviation change in communication effectiveness on the expected market premium –
approximately an 11 percent change. In the survey report, we convert this number to the
expected impact on equity market value by calculating the expected market premium for
the typical firm based on all parameters and coefficients and the corresponding market
value. We then increase the market premium by 11 percent (the estimated impact from
the regression analysis) and calculate the equity market value that the typical firm attains
based on the 11 percent increase. This enables us to solve for the percentage increase in
equity market value – in this case 15.7 percent. The conversion factor is a function of the
median market premium in the sample and the leverage for the typical firm. More
leverage increases the conversion factor (i.e., an 11 percent increase in market premium
increases the equity market value to more than 15.7 percent). Companies with lower
leverage will have a smaller impact on equity market value.
Effective Communication as a Leading Indicator of Financial Performance In any cross-sectional analysis of the relationship between two variables, A and B,
there are three possible explanations: A causes B, B causes A, or A and B are both caused
by some other factor, C. Our previous studies found a strong relationship between
communication effectiveness and firm financial performance. This correlation
demonstrates a relationship: firms that communicate effectively outperform their peers
financially. But this does not prove that communication effectiveness causes better
financial performance (A causes B). High-performing firms might spend more and thus
create more effective communication programs (B causes A), or superior financial
performance and more effective communication might both be caused by some other
factor (C) such as superior visionary leadership.
The correlation between communication effectiveness and financial performance
has been robust. Conducting multiple iterations enables us to take our analysis a step
further – to test whether communication effectiveness is a leading or lagging indicator of
financial performance. If more effective communication causes superior financial
performance, then a higher communication effectiveness score should be strongly
correlated with better future financial performance. If superior financial performance
creates better communication, then financial performance should be a strong predictor of

20
subsequent communication effectiveness. Finally, if another factor is causing both
effective communication and superior financial performance, then we would expect a
relatively strong contemporaneous correlation between variables, but correlation with the
future value of the other variable would be weak.
To perform this analysis, we compared the effectiveness scores from both the
2005 and the 2007 studies with the market premium for those same firms from two years
before the studies to the present. We pooled the data, lining it up in “event time.” There
was no evidence that superior financial performance leads to communication
effectiveness, nor was there a statistically significant linear relationship between past
performance and current communication effectiveness. Rather, we found a positive
correlation between current financial performance and current communication
effectiveness, as we have found in both studies. Finally, the correlation between
communication effectiveness and financial performance one year later was twice as large
as the contemporaneous correlation (i.e., measured at the same time). These data suggest
that communication effectiveness is a leading indicator of financial performance.
Does this finding prove that communication effectiveness causes superior
financial performance? It does not. It is difficult to prove causation in social science
research, because we cannot run controlled experiments like those performed in the
physical sciences. So it is important not to over-interpret the data. The appropriate
inference is that the evidence indicates that communication effectiveness is correlated
with subsequent financial performance and can be viewed as a leading indicator of
financial performance.
Given the strong relationship between communication effectiveness and financial
performance, however, it is useful to know what makes a communication program
effective. These results suggest that effective communication with employees and the
investment community matters. Firms that do it well can significantly boost shareholder
value. The rest of this analysis investigates the processes, tactics and programs associated
with effective communication.

21
Effective Communication Programs and Practices We use statistical analysis to uncover the relationship between communication
policies and programs and the communication effectiveness score. This analysis took two
forms: regression analysis to estimate the effect of each category on communication
effectiveness and statistical tests to identify differences in means between highly
effective and less effective communicators. We used the regression analysis to allocate
the estimated effect of communication effectiveness on firm performance to the
individual categories. We used the difference-in-means tests to confirm the data in the
supporting tables discussed throughout the paper. While the regression analysis clearly
demonstrates the effects of specific practices on effective communication, the statistics
describe the characteristics of effective communicators.
Estimating the Effect of Communication Dimensions on Market Value The questionnaire asked organizations for information about their communication
policies and practices. We grouped these policies and practices into reliable scales and
scored each respondent according to the responses to the items in each scale. The next
step was to analyze the relationship between these scales and the organization’s
communication effectiveness score. We accomplished this through regression analysis,
with the communication effectiveness score as the dependent variable and the other
scores as the independent variables.
Ordinary-least-squares regression analysis assumes that the independent variables
are orthogonal to each other. This assumption is never entirely true but is particularly
problematic with survey data. The scores based on the survey responses are significantly
correlated with each other because organizations that are strong in some areas tend to be
strong in others as well.
To facilitate the regression analysis, we performed factor analysis on the scales.
As a statistical tool, factor analysis combines items (in this case, the developed scales)
that are significantly correlated with each other based on their variance-covariance
matrix. We performed a principal components analysis and examined the scree pattern
and other statistics to determine the proper number of factors to use to combine the

22
scales. We also tested the factors formed, based on their rotated factor pattern, to ensure
that they formed a simple structure.
To determine the structure of a set of factors, we examined the relationship
between each scale and the factors. The stronger the correlation between an item (or, in
this case, a scale) and the factor formed, the more the item (or scale) is considered to load
on the factor. A simple structure implies that the items (or scales) load significantly
(typically assumed to have an absolute value between 0.3 and 1.0) on one and only one
factor. It is also desirable that each factor have at least three items (or scales) that load
significantly on that factor. Rotating three factors yielded the simplest structure.
In a standard variance-covariance matrix, the diagonal elements, which represent
the covariance of an item with itself, are equal to 1. When we performed our factor
analysis, we set the diagonal items equal to the R-squared of the regression with the scale
as the dependent variable and all of the other scales used in the factor analysis as the
independent variables. This adjustment reduces the risk of “overfitting” the data – in
other words, basing our analysis on a random error in the responses. As part of the
process of forming the factor scores, we rotated the factors using a Varimax rotation.
Two types of rotation methods are available to the researcher: oblique and
orthogonal. Orthogonal methods rotate the factors so that, to the greatest extent possible,
the factor scores formed from the scales are not correlated with each other, while oblique
rotation methods do not produce this result. In general, an orthogonal rotation method
may yield a less realistic result, because the underlying factors being measured probably
are correlated with each other. However, when the factor scores are used as independent
variables in a regression – as in this case – it is standard practice to use an orthogonal
rotation approach like the Varimax method to reduce the impact of multicolinearity in the
regression.
Our next step was to regress the communication effectiveness scores against the
factor scores formed from the scales through our factor analysis. This regression analysis
gave us an estimate of the effect of a one-standard-deviation change in the factor scores
on the organization’s communication effectiveness score. These factors are individually
and collectively significant at conventional levels.

23
The final stage in the process was to determine the relative impact of the
individual scales on the organization’s performance. The initial regression, reported in
Table 12, estimated the effect of a significant (one standard deviation) change in
communication effectiveness on organizational performance (15.7 percent). The next
regression (not presented here) estimated the effect of each factor on the communication
effectiveness score. We allocated the estimated effect based on the relative weight of
each factor. The factor scores, in turn, are based on a system of linear equations with the
values on the scales. Therefore, in allocating the estimated effect of each factor on firm
performance through its effect on communication effectiveness, we inverted that matrix
to determine the appropriate weight for each scale. The results of this process appear in
Table 13.
Table 13 Effect of the Communication Dimensions on Market Value
Category Estimated Change in Market Value
Behavioral Drives supervisors’/managers’ behavior 2.8% Drives employee behavior 3.1% Strategic Facilitates change 2.1%
Focuses on continuous improvement 1.6%
Connects to the business strategy 1.6% Foundation
Follows a formal process 1.1% Uses employee feedback 2.3% Integrates total rewards 0.8% Leverages technology 0.3%
Note: This is the change in market value associated with a one standard deviation improvement in each area.

24
Hierarchy of Effective Communication: The Characteristics of Highly Effective Communication
Organizations that communicate effectively are competent in several
communication practices. These practices collectively constitute the Hierarchy of
Effective Communication. However, while individual practices are critical to enhancing
communication across an organization, no one practice guarantees effective
communication. Rather it is the integration of all practices that delivers a results-oriented
and effective communication program.
Figure 4 Hierarchy of Effective Communication
Behavioral Tier Reaching the Pinnacle
The most important goal of an effective communication program is to motivate
employees and management to act upon and achieve the goals set by the organization.
This is the “behavioral” level of the hierarchy, and the pinnacle to which all world-class
communicators aspire.

25
Strategic Tier Planning for Success
To bring about employee engagement, organizations must be strategic in the way
they design their communication programs. Communication at this level facilitates
change and promotes continuous improvements in business operations.
Foundation Tier Building a Strong Base
The foundation of an effective communication program is built by establishing
formal communication processes, encouraging and using employee feedback, and
leveraging technology. An effective communication program also engages employees in
the business by establishing clear links between desired behaviors and the rewards
program.
Building the Foundation Driving superior shareholder returns through effective communication requires
building a strong foundation by addressing processes and resources. Organizations that
communicate effectively:
Follow a formal process or structure for communication
Use employee feedback to create a dialogue with employees
Use their communication programs to position their total rewards
Leverage technology to enhance the speed and accessibility of information
Follows a Formal Process Successful communicators handle process issues correctly: they develop their
programs proactively, document their communication strategy and coordinate their
internal and external messages to eliminate confusion. New employees are brought up to
speed quickly through a systematic orientation process and an organizational culture that
supports knowledge-sharing and information exchange. High-effectiveness organizations
also use internal surveys to verify that employees understand key messages. These
processes manage the development and flow of information and lay the groundwork for
all other practices.

26
Table 14 Follows a Formal Process
Short Question Description Low
Effectiveness Medium
Effectiveness High
Effectiveness Ratio High
to Low Internal and external communications are coordinated effectively 40.2% 71.8% 82.1% 2.0
This organization has a documented internal communication strategy 35.4% 64.0% 82.1% 2.3 Cx function is regularly called upon to provide communication counsel and insight to the CEO and senior management team 38.8% 55.8% 71.4% 1.8
Cx function communicates regularly with members of the senior management team to discuss business communication issues and opportunities 32.1% 48.8% 78.6% 2.4 Cx function communicates regularly with business unit leaders to discuss business communication issues and opportunities 23.5% 43.0% 67.9% 2.9 Internal cx programs developed primarily proactively 28.4% 50.0% 55.4% 2.0
Cx function is included by the CEO and senior management in major business decisions 27.2% 34.9% 59.5% 2.2
The organization’s culture effectively supports the sharing of knowledge across the organization 8.9% 30.9% 72.5% 8.2
We have a process in place to capture compliance/legislative/governance differences among countries to guide our communication efforts 3.9% 8.2% 16.3% 4.2
Note: Numbers indicate the percentage of respondents that gave a favorable response to that item, typically a response of 4 or 5 on a 5-point Likert scale.
Uses Employee Feedback Soliciting and acting on employee feedback at regular intervals gives employees a
voice and engages them in running the business. Distributing employee surveys is not
enough. In highly effective organizations, employees play an active role in determining
how their work gets done and have opportunities to provide input into how the business is
run. More importantly, acting on employees’ suggestions directly connects their actions
to the organization’s strategy and helps employees understand their role in achieving
business objectives.

27
Table 15 Uses Employee Feedback
Short Question Description Low
Effectiveness Medium
Effectiveness High
Effectiveness
Ratio High to
Low
This organization communicates the results of employee opinion surveys to employees 50.0% 80.3% 78.2% 1.6
Conducted internal surveys or focus groups to support change was effective 34.6% 42.9% 71.4% 2.1 The organization has developed action plans and implemented policy changes as a result of employee opinion survey results 22.6% 50.0% 67.9% 3.0
The organization actively collects information to assess the value of benefit programs to employees 38.5% 42.5% 63.6% 1.7 Employees are given are given the opportunity to provide meaningful input into how the work gets done 16.5% 27.2% 44.4% 2.7
Employees are given the opportunity to provide meaningful input into decisions that affect them 3.8% 12.3% 38.3% 10.1 Employees are given the opportunity to provide meaningful input into organization’s programs and changes to the way the business is run 3.8% 11.1% 24.7% 6.5
Note: Numbers indicate the percentage of respondents that gave a favorable response to that item, typically a response of 4 or 5 on a 5-point Likert scale.
Integrates Total Rewards Organizations that communicate effectively do a better job of communicating
total rewards to employees than other organizations. Rewards include more than pay and
benefits – they encompass the work environment, culture, development opportunities and
training. Organizations with highly engaged employees “package” rewards effectively to
attract and retain key talent. The payoffs can include lower turnover, higher productivity
and stronger financial performance. Moreover, the programs themselves communicate
important messages about the organization and its values to employees.
Effective communicators are more likely to develop an identifiable employer
brand and to use pay to engage and involve employees in improving business
performance. Developing and communicating the right total rewards package reinforces
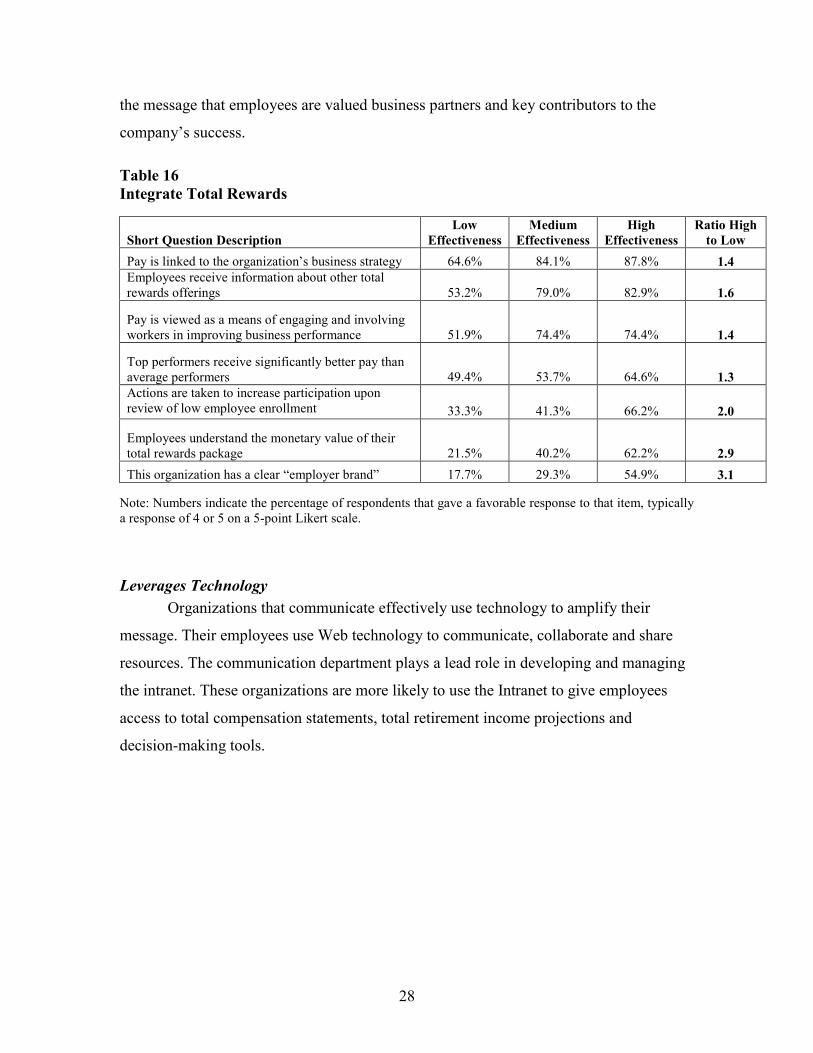
28
the message that employees are valued business partners and key contributors to the
company’s success. Table 16 Integrate Total Rewards
Short Question Description Low
Effectiveness Medium
Effectiveness High
Effectiveness Ratio High
to Low Pay is linked to the organization’s business strategy 64.6% 84.1% 87.8% 1.4 Employees receive information about other total rewards offerings 53.2% 79.0% 82.9% 1.6
Pay is viewed as a means of engaging and involving workers in improving business performance 51.9% 74.4% 74.4% 1.4
Top performers receive significantly better pay than average performers 49.4% 53.7% 64.6% 1.3 Actions are taken to increase participation upon review of low employee enrollment 33.3% 41.3% 66.2% 2.0
Employees understand the monetary value of their total rewards package 21.5% 40.2% 62.2% 2.9 This organization has a clear “employer brand” 17.7% 29.3% 54.9% 3.1
Note: Numbers indicate the percentage of respondents that gave a favorable response to that item, typically a response of 4 or 5 on a 5-point Likert scale.
Leverages Technology Organizations that communicate effectively use technology to amplify their
message. Their employees use Web technology to communicate, collaborate and share
resources. The communication department plays a lead role in developing and managing
the intranet. These organizations are more likely to use the Intranet to give employees
access to total compensation statements, total retirement income projections and
decision-making tools.

29
Table 17 Leverages Technology
Short Question Description Low
Effectiveness Medium
Effectiveness High
Effectiveness
Ratio High to
Low
Increased use of electronic communication 65.9% 82.6% 81.0% 1.2
Organization has a portal 64.2% 68.6% 72.8% 1.1 Offer personalized info on the importance of participating in the benefits programs 44.9% 55.6% 68.3% 1.5 The communication function plays a lead role in developing and managing the content of our intranet 43.0% 50.0% 69.9% 1.6 Employees use Web technology to gain access to relevant training/learning/development tools and materials 37.0% 52.3% 57.3% 1.5 Extensive use of conference calls, Webcasts, other 40.7% 45.3% 51.8% 1.3 This organization has a documented intranet/Internet communication strategy 24.4% 38.8% 71.4% 2.9 Employees use Web technology to communicate, collaborate and share resources inside the organization 39.5% 45.3% 49.4% 1.3 Offer personalized educational materials on income needs in retirement 29.5% 39.5% 53.8% 1.8 Offer personalized total retirement income projections 25.6% 36.6% 45.7% 1.8 Increased use of social media (blogs, podcasts, etc.) 21.3% 32.1% 40.2% 1.9
Offer personalized total rewards statements 15.2% 29.3% 45.1% 3.0 Extensive use of intranet using audio/video (streaming or mpeg) 18.5% 24.4% 34.9% 1.9
Extensive use of blogs, wikis, discussion boards 3.8% 3.5% 7.3% 2.0 Note: Numbers provided indicate the percentage of respondents that gave a favorable response to that item, typically a response of 4 or 5 on a 5-point Likert scale.

30
Evolving Through Strategic Communication Effective communication requires a strategic approach. The strategic tier focuses
on connecting all communication efforts to business objectives – thereby facilitating
organizational change – and then measuring the results.
Facilitates Change Organizations are constantly evolving in response to changes in the business
environment. Organizations that communicate effectively manage major changes better
than other organizations. The 2007/2008 study reaffirms the 2003/2004 and 2005/2006
findings that organizations that are good at facilitating change outperform their peers.
One key to success is fully utilizing the frontline leader to build employee support for the
change, because employees often view their immediate supervisor as a more credible
source of information. Companies that keep their managers informed and involved during
a change tend to realize a significant return on their efforts.
Unfortunately, while frontline managers play an important role in facilitating
organizational change, they often do not receive the necessary training and tools. High-
effectiveness firms involve their managers early in the process and give them the
information they need to manage the change. With effective support, frontline leaders can
be important in channeling communication throughout the organization.

31
Table 18 Facilitates Change
Short Question Description Low
Effectiveness Medium
Effectiveness High
Effectiveness
Ratio High to
Low Measures used to assess reorg – Employees understand the rationale for change 70.0% 76.9% 89.0% 1.3 Measures used to assess reorg – Employees understand how change will impact them personally 62.9% 80.8% 89.0% 1.4 Implemented new communication initiative to support change was effective 50.0% 71.4% 85.2% 1.7 Measures used to assess reorg – Employees understand what they need to do differently 51.4% 70.5% 83.6% 1.6 This organization explains to all employees the reasons behind major decisions 36.7% 67.9% 87.7% 2.4 Extent the internal communication function involved in the changes recently undertaken by your organization 36.8% 62.8% 80.8% 2.2 Managers support the organization’s vision through their actions and attitude 26.5% 48.7% 82.2% 3.1 Measures used to assess reorg – Evidence of desired changes in employee behavior 28.6% 46.2% 57.5% 2.0 Managers address the needs and concerns of remaining employees 14.7% 34.2% 72.2% 4.9 Managers enthusiastically implement new approaches to work 7.2% 28.9% 65.3% 9.0 Extensive use of objective measures of changed behavior 2.5% 9.6% 20.3% 8.1
Note: Numbers indicate the percentage of respondents that gave a favorable response to that item, typically a response of 4 or 5 on a 5-point Likert scale.
Focuses on Continuous Improvement Excellence is a moving target, and achieving it requires continuous improvement
and ongoing communication. Communication measurement is becoming more important
and more prevalent. Organizations that communicate effectively leverage information
such as customer feedback to help employees improve their performance.

32
Table 19 Focus on Continuous Improvement
Short Question Description Low
Effectiveness Medium
Effectiveness High
Effectiveness Ratio High
to Low Regularly measure effect of communication on employee engagement 62.2% 70.2% 83.1% 1.3 Extensive use of employee feedback via surveys 47.6% 56.5% 64.3% 1.4
Regularly measure whether information helps employees perform better 45.9% 46.8% 66.1% 1.4 Have a corporate scorecard with internal communication metrics 48.8% 56.0% 57.1% 1.2 Regularly measure employee behavior change 40.5% 42.6% 61.0% 1.5 Changes made as a result of employee opinion surveys are communicated effectively to employees 21.0% 39.5% 61.5% 2.9 Regularly measure effect of communication on business performance 10.8% 23.4% 55.9% 5.2 Extensive use of manager feedback via surveys 22.5% 25.9% 43.2% 1.9 Regularly measure effect of communication on retention of critical talent 8.1% 19.1% 33.9% 4.2 Regularly measure effect of communication on workforce productivity 10.8% 21.3% 27.1% 2.5 Extensive use of employee feedback via focus groups 6.2% 15.3% 28.0% 4.5 Extensive use of manager feedback via focus groups 5.0% 10.7% 22.0% 4.4 The organization makes extensive use of measurement to verify the communication function’s contribution to strategic business goals 3.7% 3.5% 19.5% 5.3 The organization benchmarks the performance of the communication function against other companies 3.7% 4.7% 12.2% 3.3
Note: Numbers indicate the percentage of respondents that gave a favorable response to that item, typically a response of 4 or 5 on a 5-point Likert scale.
Employee opinion surveys are still the preferred method for gathering feedback,
but many companies don’t use them to measure communication effectiveness or to
identify the links between effective communications and improved productivity and
business performance. The few companies that ask the right questions and link their
communication initiatives to business outcomes are seeing the difference. Organizations
with highly effective communications are over 5 times more likely to make extensive use
of measurements to verify communication’s contribution to organizational business

33
goals. They are also 3 times more likely to benchmark their practices than those that
communicate less effectively.
Continuous improvement relies on measurement, including hard measures such as
those obtained in communication audits, and objective measures of behavior change and
the degree to which communication helps employees improve their performance.
Organizations that communicate effectively ensure that the communication function
supports strategic business plans, making a strong business case for investment in the
communication function.
Connects to the Business Strategy An organization cannot successfully execute a business strategy if its employees
do not understand its vision and goals. Communication is an important link between
organizational leadership and employee performance, and highly effective organizations
directly connect communication with business objectives. Organizations that
communicate effectively use feedback from employees to enhance and implement key
business objectives. Their senior managers recognize the importance of communication
and employee engagement in achieving business objectives and are actively involved in
the communication process. Linking communication objectives to business goals can
significantly strengthen the business case for additional resources.

34
Table 20 Connect to the Business Strategy
Short Question Description Low
Effectiveness Medium
Effectiveness High
Effectiveness
Ratio High to
Low
This organization directly links its communication objectives to its business objectives 53.7% 80.2% 95.2% 1.8 Senior management recognizes the importance of communication in achieving business objectives and takes an active role in communicating 54.9% 77.9% 95.2% 1.7
Corporate communication is an essential part of this organization’s business strategy 42.7% 74.4% 88.1% 2.1
Measures used to assess reorg – Achieving overall revenue/savings goals 44.3% 51.3% 72.6% 1.6
Measures used to assess reorg – Retention of high performers 40.0% 51.3% 74.0% 1.8 The organization’s employee opinion surveys are designed to obtain feedback relating directly to key business objectives 27.4% 47.4% 69.2% 2.5
Measures used to assess reorg – Limited additional turnover 31.4% 41.0% 63.0% 2.0
Extent use increased employee participation related to the initiative 22.2% 32.5% 48.8% 2.2
Extent use customer measures (e.g., sales growth, customer satisfaction) 8.8% 12.2% 34.9% 4.0
Extent use operational measures (e.g., increased productivity) 6.3% 4.9% 25.6% 4.1
Extent use decreased turnover 10.0% 7.3% 14.6% 1.5
Extent use financial measures (e.g., revenue growth, profitability) 7.5% 3.6% 19.5% 2.6
Note: Numbers indicate the percentage of respondents that gave a favorable response to that item, typically a response of 4 or 5 on a 5-point Likert scale.
Effecting Change at a Behavioral Level Effective communication drives behavior change. The behavioral tier focuses on
the relationship between employees and their direct leaders. It also highlights how,
working through these leaders, organizations can use communication to draw a clear line
of sight between employees’ jobs and business outcomes.

35
Drives Supervisory/Managerial Behavior Formal processes are just one means of communicating with employees. Frontline
leaders have the most day-to-day contact with their employees and thus more
opportunities to communicate company goals, performance and objectives. Companies
with high levels of communication effectiveness treat managers as a distinct and highly
valued audience, give them information in advance and “package” the information in a
palatable form for delivery. These companies also recognize and reward managers for
being effective and attentive communicators almost five times more often than firms with
low levels of communication effectiveness. However, there is still considerable room for
improvement in this area. Table 21 Drives Supervisory/Managerial Behavior
Short Question Description Low
Effectiveness Medium
Effectiveness High
Effectiveness
Ratio High to
Low Managers are given information before it is shared with employees 58.5% 79.1% 90.4% 1.5 Managers support the executive management vision through their actions 32.9% 48.1% 77.8% 2.4 Managers are taking on a greater share of communication responsibility in this organization 42.7% 47.1% 67.5% 1.6 This organization does an effective job of “packaging” company/business information for managers to deliver to employees 25.6% 50.6% 69.9% 2.7 Managers enthusiastically implement new approaches to work 20.8% 33.3% 66.7% 3.2 Managers help provide feedback to employees about their job performance 19.0% 37.5% 63.0% 3.3 Measures used to assess reorg – Employee engagement relative to external benchmarks 17.1% 30.8% 47.9% 2.8 Managers help employees with career development 11.5% 28.8% 51.9% 4.5 Managers at all levels are rewarded for communicating effectively 4.9% 9.3% 23.8% 4.9
Note: Numbers indicate the percentage of respondents that gave a favorable response to that item, typically a response of 4 or 5 on a 5-point Likert scale.

36
Drives Employee Behavior Organizations that communicate effectively do a better job of creating a “line of
sight” for employees that helps drive behaviors to achieve desired financial results. Line
of sight means that employees understand the big picture and, more importantly, see how
their actions can help the organization attain its goals. Successfully communicating
organizations foster a culture of information exchange, and they consistently share
financial information, business plans and organizational goals with employees. Effective
communicators are twice more likely to share business plans and goals with employees
and five times more likely to share customer feedback than companies with low
communication effectiveness.
Employees with a clear line of sight are more likely to provide feedback that
supports the business strategy as the organization makes continuous improvements or
initiates major changes. In these organizations, employees also are more likely to initiate
appropriate actions because they understand how their work is directly linked to business
results. Their quick responses to changing circumstances gives the organization a major
advantage over competitors whose employees are shooting in the dark.
Table 22 Drives Employee Behavior
Short Question Description Low
Effectiveness Medium
Effectiveness High
Effectiveness Ratio High
to Low
This organization communicates openly to employees about matters that affect them 49.4% 75.3% 95.1% 1.9
The organization shares business plans and/or goals with employees 40.5% 57.5% 88.9% 2.2
The organization shares financial information with employees 39.2% 59.3% 85.2% 2.2 A systematic orientation program for new hires exists 30.8% 48.1% 62.8% 2.0
The organization is sharing more business-related information with employees than it did last year 35.9% 35.8% 60.8% 1.7 The organization shares customer feedback with employees 13.9% 31.3% 70.4% 5.1
Note: Numbers indicate the percentage of respondents that gave a favorable response to that item, typically a response of 4 or 5 on a 5-point Likert scale.
37
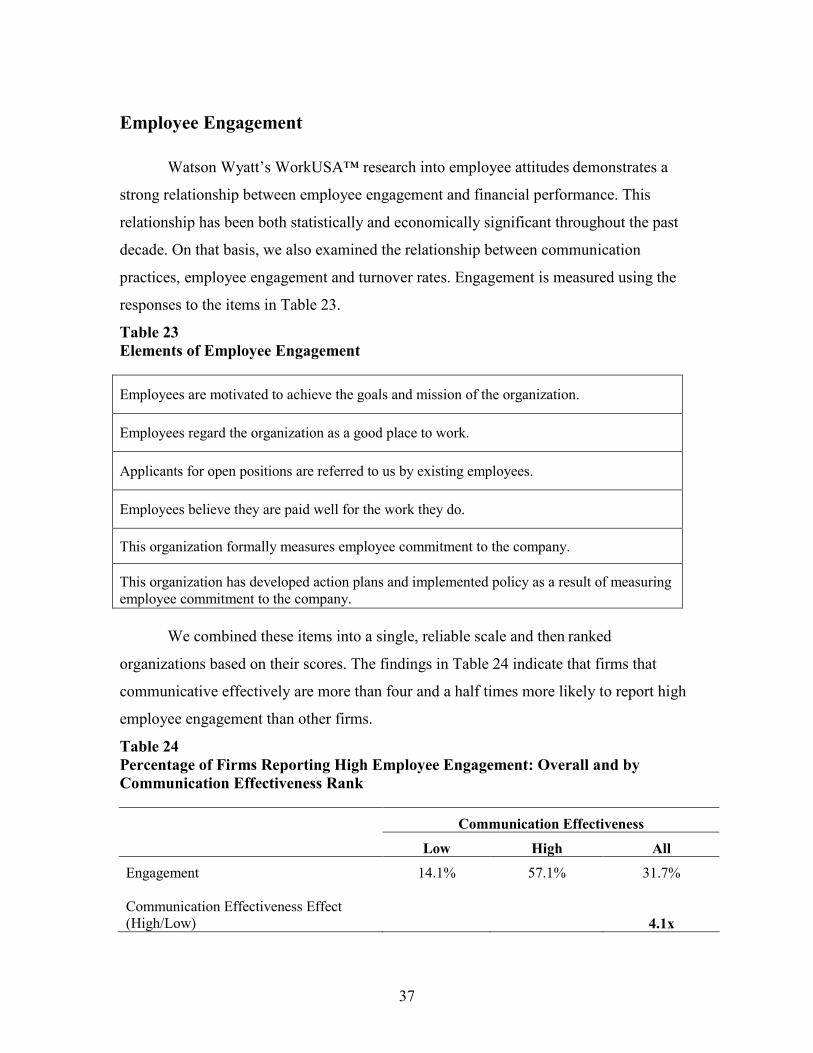
Employee Engagement
Watson Wyatt’s WorkUSA™ research into employee attitudes demonstrates a
strong relationship between employee engagement and financial performance. This
relationship has been both statistically and economically significant throughout the past
decade. On that basis, we also examined the relationship between communication
practices, employee engagement and turnover rates. Engagement is measured using the
responses to the items in Table 23.
Table 23 Elements of Employee Engagement
Employees are motivated to achieve the goals and mission of the organization.
Employees regard the organization as a good place to work.
Applicants for open positions are referred to us by existing employees.
Employees believe they are paid well for the work they do.
This organization formally measures employee commitment to the company.
This organization has developed action plans and implemented policy as a result of measuring employee commitment to the company.
We combined these items into a single, reliable scale and then ranked
organizations based on their scores. The findings in Table 24 indicate that firms that
communicative effectively are more than four and a half times more likely to report high
employee engagement than other firms.
Table 24 Percentage of Firms Reporting High Employee Engagement: Overall and by Communication Effectiveness Rank Communication Effectiveness
Low High All Engagement 14.1% 57.1% 31.7% Communication Effectiveness Effect (High/Low) 4.1x
38
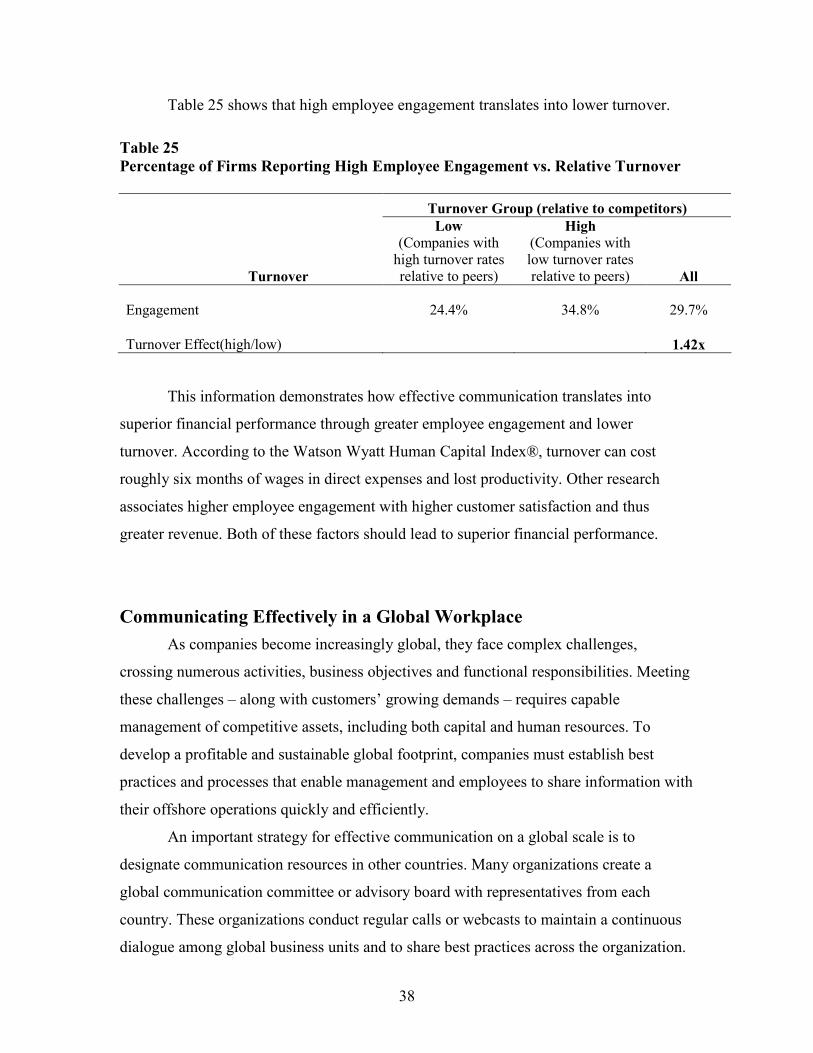
Table 25 shows that high employee engagement translates into lower turnover. Table 25 Percentage of Firms Reporting High Employee Engagement vs. Relative Turnover Turnover Group (relative to competitors)
Turnover
Low (Companies with
high turnover rates relative to peers)
High (Companies with low turnover rates relative to peers) All
Engagement 24.4% 34.8% 29.7%
Turnover Effect(high/low) 1.42x
This information demonstrates how effective communication translates into
superior financial performance through greater employee engagement and lower
turnover. According to the Watson Wyatt Human Capital Index®, turnover can cost
roughly six months of wages in direct expenses and lost productivity. Other research
associates higher employee engagement with higher customer satisfaction and thus
greater revenue. Both of these factors should lead to superior financial performance.
Communicating Effectively in a Global Workplace As companies become increasingly global, they face complex challenges,
crossing numerous activities, business objectives and functional responsibilities. Meeting
these challenges – along with customers’ growing demands – requires capable
management of competitive assets, including both capital and human resources. To
develop a profitable and sustainable global footprint, companies must establish best
practices and processes that enable management and employees to share information with
their offshore operations quickly and efficiently.
An important strategy for effective communication on a global scale is to
designate communication resources in other countries. Many organizations create a
global communication committee or advisory board with representatives from each
country. These organizations conduct regular calls or webcasts to maintain a continuous
dialogue among global business units and to share best practices across the organization.

39
Organizations that communicate effectively are more likely to have a documented global
employee communication strategy. When communicating globally, it is essential to set up
processes that capture and conform to each country’s legal and other requirements.
Table 26 Communicating With Global Employees/Operations
Short Question Description Low
Effectiveness Medium
Effectiveness High
Effectiveness
Ratio High to
Low
We have designated communication resources in other countries/offshore business units 13.9% 24.7% 32.5% 2.3 We have a global communication committee or advisory group with representatives from various countries 6.3% 11.9% 18.8% 3.0 We regularly meet or have conference calls/Webcasts with our global business unit communication colleagues 6.4% 21.2% 29.6% 4.6
We share best practices with our global business unit communication colleagues 10.1% 21.2% 36.3% 3.6 We have a documented global employee communication strategy 7.6% 16.5% 27.8% 3.7 We have a process to capture compliance differences among countries to guide communication efforts 3.9% 8.2% 16.3% 4.2
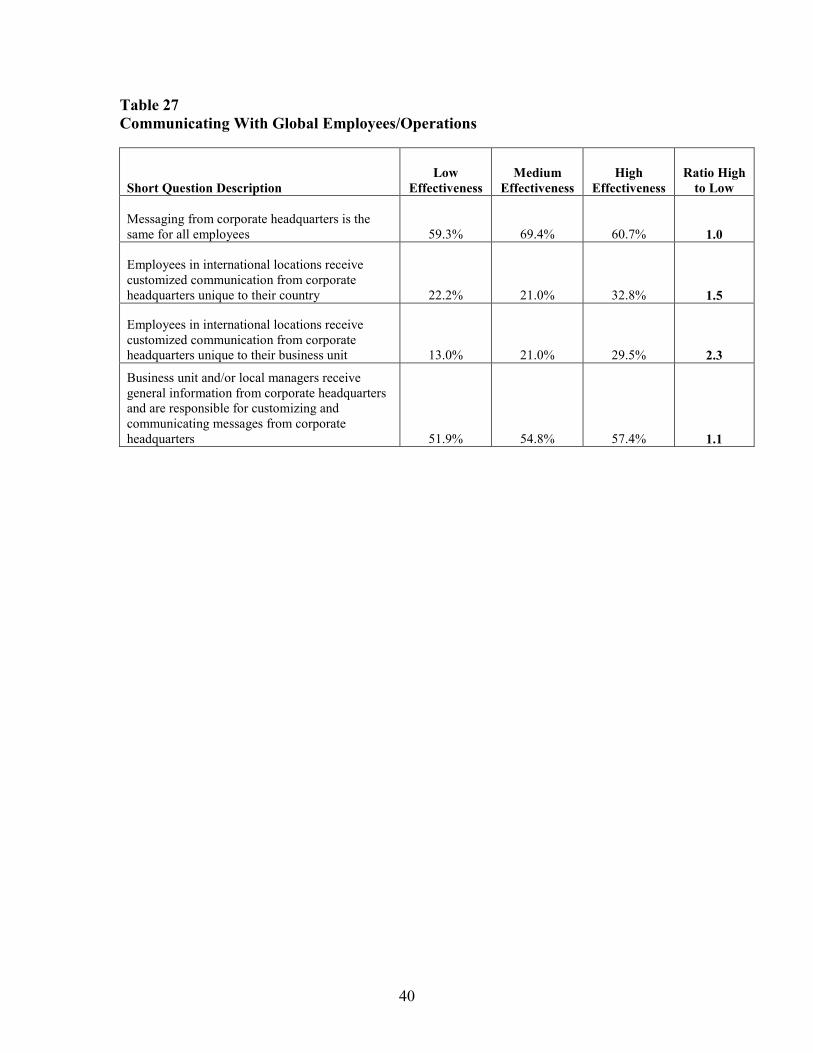
Providing employees with differentiated communication is critical to getting the
company’s message to its offshore facilities. Organizations that communicate effectively
use customized communication sent from corporate headquarters. These companies tailor
their communication for each offshore location, adapting communication to the local
environment and business unit. It is less effective for companies to share the same
message with all employees or for local managers to customize messages from corporate
headquarters.
40
Table 27 Communicating With Global Employees/Operations
Short Question Description Low
Effectiveness Medium
Effectiveness High
Effectiveness Ratio High
to Low
Messaging from corporate headquarters is the same for all employees 59.3% 69.4% 60.7% 1.0
Employees in international locations receive customized communication from corporate headquarters unique to their country 22.2% 21.0% 32.8% 1.5
Employees in international locations receive customized communication from corporate headquarters unique to their business unit 13.0% 21.0% 29.5% 2.3
Business unit and/or local managers receive general information from corporate headquarters and are responsible for customizing and communicating messages from corporate headquarters 51.9% 54.8% 57.4% 1.1
41
Trends: What We’ve Learned in Six Years of Communication ROI Studies
Overall, companies have made considerable progress in recent years in adopting
communication practices and strategies that span the nine best-practice components,
including foundational, strategic and behavioral practices. The good news includes some
positive trends around measurement, helping employees own their benefits, and planning
and implementing communication programs. Companies also have taken important steps
to address organizational change by giving communication an essential role in the change
process. Sharing the results of employee surveys also has become more widespread over
the last six years.
But there have been negative trends and lack of improvement over the last six
years as well. Notably, many organizations have made little progress in providing the
focus and direction employees need to help make their organization successful. This
includes systematic orientation programs for new hires and sharing business-related
information with employees. Companies also have been slow to adopt Web technologies
to communicate and share information within the organization and to offer personalized
retirement education. Finally, many companies still do not groom their managers to be
champions of communication initiatives and to take on communication responsibilities.
Tables 28 and 29 show communication trends since the 2003/2004 study. Both
tables show the percentage of favorable responses to the questions over the last three
studies. The last column shows the ratio of the average response of high-communication-
effectiveness companies to their low-effectiveness counterparts in 2007.

42
Table 28 Positive Trends in Communication Practices Linked Most Closely to High-Effectiveness Companies
Short Question Description Pyramid/ Construct 2003 2005 2007
Difference (2007-2003)
Ratio of High to Low Cx
Effectiveness in 2007
-
Actions are taken to increase participation upon review of low employee enrollment Reward 25.3% 30.1% 52.7% 27.3% 2.0
Regularly measure employee behavior change Improve 28.8% 42.3% 53.3% 24.4% 1.5
Employees use Web technology to gain access to relevant training/learning/development tools and materials Technology 36.5% 42.9% 56.6% 20.1% 1.5
The organization actively collects information to assess the value of benefit programs to employees Feedback 33.8% 43.4% 50.3% 16.5% 1.7
Extent was the internal communication function involved in the changes recently undertaken by your organization Change 47.2% 65.0% 62.9% 15.6% 2.2 Internal communication programs developed primarily proactively Formal 35.0% 36.4% 48.3% 13.3% 2.0
Offer personalized total rewards statements Technology 19.4% 30.2% 32.2% 12.7% 3.0
This organization has a documented internal communication strategy Formal 53.3% 61.5% 64.6% 11.3% 2.3
This organization communicates the results of employee opinion surveys to employees Feedback 57.1% 57.0% 67.1% 10.0% 1.6
Corporate communication is an essential part of this organization’s business strategy Strategy 58.3% 58.9% 68.0% 9.6% 2.1 The organization shares customer feedback with employees Drives 30.6% 32.6% 40.2% 9.6% 5.1
Implemented new communication initiative to support change and it was effective Change 60.2% 78.0% 69.7% 9.5% 1.7
Pay is linked to the organization’s business strategy Reward 70.2% 78.9% 79.5% 9.4% 1.4
Regularly measure whether information helps employees do their jobs better Improve 46.8% 44.0% 56.1% 9.3% 1.4
Managers help employees with career development Behavior 16.7% 26.5% 25.6% 8.9% 4.5
Conducted internal surveys or focus groups to support change was effective Feedback 47.4% 61.1% 56.2% 8.8% 2.1
Employees understand the monetary value of their total rewards package Reward 34.2% 39.3% 42.1% 7.9% 2.9
Managers are given information before it is shared with employees Behavior 69.3% 67.1% 76.8% 7.5% 1.5
Internal and external communication are coordinated effectively Formal 60.0% 58.9% 67.4% 7.4% 2.0
The organization has developed action plans and implemented policy changes as a result of employee opinion survey results Feedback 39.3% 49.3% 45.6% 6.4% 3.0
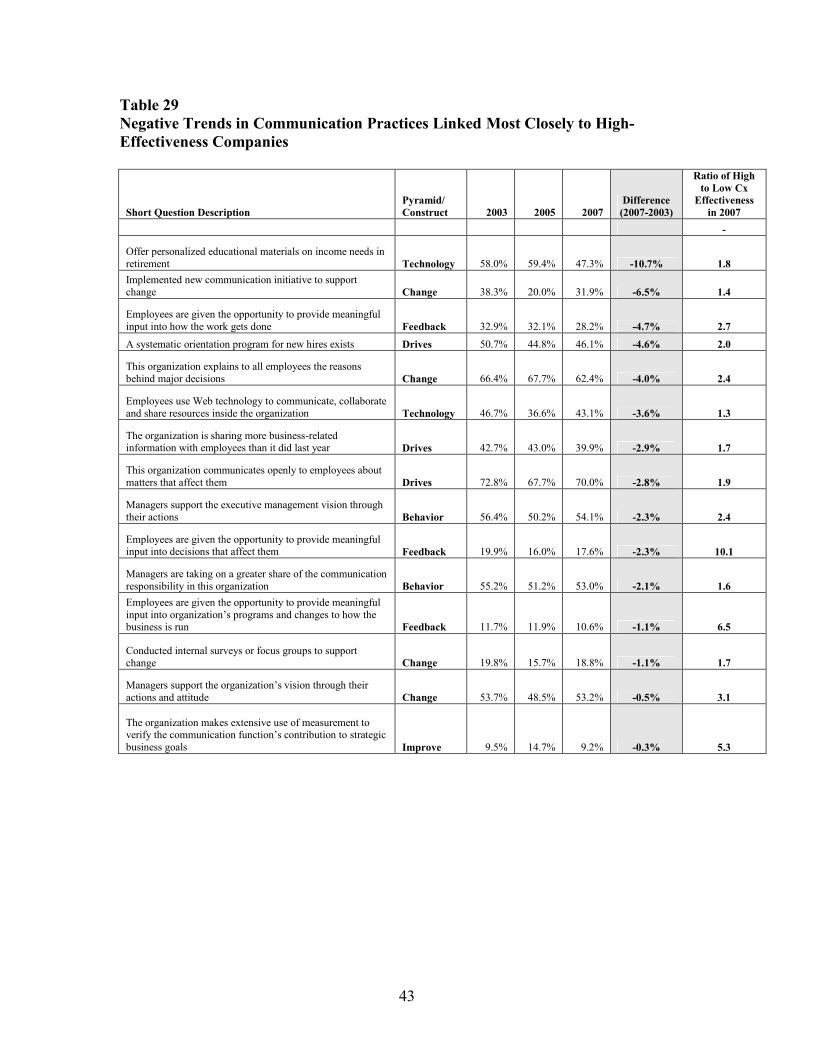
43
Table 29 Negative Trends in Communication Practices Linked Most Closely to High-Effectiveness Companies
Short Question Description Pyramid/ Construct 2003 2005 2007
Difference (2007-2003)
Ratio of High to Low Cx
Effectiveness in 2007
-
Offer personalized educational materials on income needs in retirement Technology 58.0% 59.4% 47.3% -10.7% 1.8 Implemented new communication initiative to support change Change 38.3% 20.0% 31.9% -6.5% 1.4
Employees are given the opportunity to provide meaningful input into how the work gets done Feedback 32.9% 32.1% 28.2% -4.7% 2.7 A systematic orientation program for new hires exists Drives 50.7% 44.8% 46.1% -4.6% 2.0
This organization explains to all employees the reasons behind major decisions Change 66.4% 67.7% 62.4% -4.0% 2.4
Employees use Web technology to communicate, collaborate and share resources inside the organization Technology 46.7% 36.6% 43.1% -3.6% 1.3
The organization is sharing more business-related information with employees than it did last year Drives 42.7% 43.0% 39.9% -2.9% 1.7
This organization communicates openly to employees about matters that affect them Drives 72.8% 67.7% 70.0% -2.8% 1.9
Managers support the executive management vision through their actions Behavior 56.4% 50.2% 54.1% -2.3% 2.4
Employees are given the opportunity to provide meaningful input into decisions that affect them Feedback 19.9% 16.0% 17.6% -2.3% 10.1
Managers are taking on a greater share of the communication responsibility in this organization Behavior 55.2% 51.2% 53.0% -2.1% 1.6 Employees are given the opportunity to provide meaningful input into organization’s programs and changes to how the business is run Feedback 11.7% 11.9% 10.6% -1.1% 6.5
Conducted internal surveys or focus groups to support change Change 19.8% 15.7% 18.8% -1.1% 1.7
Managers support the organization’s vision through their actions and attitude Change 53.7% 48.5% 53.2% -0.5% 3.1
The organization makes extensive use of measurement to verify the communication function’s contribution to strategic business goals Improve 9.5% 14.7% 9.2% -0.3% 5.3

44
Conclusion The 2007/2008 Communication ROI Study reaffirms our earlier findings – the
way a company shares information with employees can positively affect its financial
performance. For the third time, we found that effective communication practices are
associated with higher shareholder returns, increased market premiums and higher
revenue per employee. So companies that take the initiative and invest in improving their
employee communication practices position themselves to gain a significant advantage
over their competitors. The study also reconfirmed that effective communication is a
leading indicator of financial performance.
Successful programs that drive employee behavior, engage managers and
supervisors in the communication process, and use employee feedback offer the greatest
return on investment. However, all nine dimensions in the Hierarchy of Effective
Communication add value and merit attention as you develop or update your
communication strategy and implementation plan for the coming year.
By continuing to conduct this groundbreaking study, Watson Wyatt provides
business leaders with the evidence they need to position organizational communication as
an important business function that can potentially improve financial performance. The
study also helps communication professionals understand the relative return on
investment for effective communication practices, enables them to compare their
organization’s practices with North American norms and encourages them to work
alongside senior managers in designing programs that deliver optimum results.
The bottom line: It’s all about engaging employees and driving behavior change
to achieve business results. Investing in communication and improving the effectiveness
of your communication practices are crucial steps to higher financial performance.

45
APPENDIX – REGIONAL DETAIL
Building the Foundation
Table A1 Follows a Formal Process
Short Question Description AP CANADA Europe USA Internal and external communication are coordinated effectively 68.4% 54.5% 61.1% 67.4% This organization has a documented internal communication strategy 68.4% 45.5% 57.9% 64.6% Cx function is regularly called upon to provide communication counsel and insight to the CEO and senior management team 36.8% 58.1% 57.9% 56.4%
Cx function communicates regularly with members of the senior management team to discuss business communication issues and opportunities 42.1% 48.8% 57.9% 54.7% Cx function communicates regularly with business unit leaders to discuss business communication issues and opportunities 42.1% 48.8% 42.1% 46.4% Internal cx programs developed primarily proactively 38.9% 34.1% 42.1% 48.3% Cx function is included by the CEO and senior management in major business decisions 42.1% 53.5% 26.3% 38.9% The organization’s culture effectively supports the sharing of knowledge across the organization 47.1% 31.6% 53.3% 36.5%
We have a process in place to capture the compliance/legislative/governance differences between countries to guide our communication efforts 23.5% 0.0% 25.0% 8.8%
Table A2 Uses Employee Feedback
Short Question Description AP CANADA Europe USA This organization communicates the results from employee opinion surveys to employees 66.7% 78.4% 93.3% 67.1% Conducted internal surveys or focus groups to support change was effective 30.8% 44.4% 66.7% 56.2% The organization has developed action plans and implemented policy changes as a result of employee opinion survey results 60.0% 54.1% 53.3% 45.6% The organization actively collects information to assess the value of the benefit programs to employees 41.2% 47.4% 30.8% 50.3% Employees are given the opportunity to provide meaningful input in how the work gets done 17.6% 38.5% 33.3% 28.2% Employees are given the opportunity to provide meaningful input in decisions that affect them 23.5% 17.9% 20.0% 17.6% Employees are given the opportunity to provide meaningful input in organization’s programs and changes to how the business is run 17.6% 23.1% 13.3% 10.6%

46
Table A3 Integrates Total Rewards
Short Question Description AP CANADA Europe USA Pay is linked to the organization's business strategy 100.0% 66.7% 80.0% 79.5% Employees receive information on other total rewards offerings 72.2% 69.2% 53.3% 74.1% Pay is viewed as a means of engaging and involving people in improving business performance 88.9% 51.3% 60.0% 69.0% Top performers receive significantly better pay than average performers 66.7% 51.3% 80.0% 53.8% Actions are taken to increase participation upon review of low employee enrollment 23.5% 37.8% 28.6% 52.7% Employees understand the monetary value of their total rewards package 44.4% 43.6% 26.7% 42.1% This organization has a clear “employer brand” 38.9% 33.3% 26.7% 34.5%
Table A4 Leverages Technology
Short Question Description AP CANADA Europe USA Increased use of electronic communication 78.9% 77.3% 68.4% 77.2% Organization has a portal 70.6% 71.4% 81.3% 66.5% Offer personalized info on the importance of participating in the benefits programs 27.8% 53.8% 28.6% 62.4% The cx function plays a lead role in developing and managing the content of our intranet 33.3% 31.0% 68.8% 61.0% Employees use Web technology to gain access to relevant training/learning/development tools and materials 38.9% 28.6% 31.3% 56.6% Extent use conference calls, Webcasts, other 22.2% 28.6% 31.3% 54.0% This organization has a documented intranet/Internet communication strategy 63.2% 31.8% 47.4% 47.2% Employees use Web technology to communicate, collaborate and share resources inside the organization 50.0% 42.9% 62.5% 43.1% Offer personalized educational materials on income needs in retirement 16.7% 33.3% 15.4% 47.3% Offer personalized total retirement income projections 16.7% 38.5% 14.3% 39.4% Increased use of social media (blogs, podcasts, etc.) 26.3% 30.0% 31.6% 31.5% Offer personalized total rewards statements 38.9% 20.5% 20.0% 32.2% Extent use intranet using audio/video (streaming or mpeg) 38.9% 14.3% 18.8% 28.2% Extent use blogs, wikis, discussion boards 11.1% 0.0% 6.3% 5.3%

47
Evolving Through Strategic Communication
Table A5 Facilitates Change
Short Question Description AP CANADA Europe USA Measures used to assess reorg - Employees understand the rationale for change 86.7% 75.8% 76.9% 78.8% Measures used to assess reorg - Employees understand how it will impact them personally 80.0% 69.7% 76.9% 79.4% Implemented new communication initiative to support change was effective 66.7% 80.0% 100.0% 69.7% Measures used to assess reorg - Employees understand what they need to do differently 86.7% 60.6% 69.2% 68.8% This organization explains to all employees the reasons behind major decisions 70.6% 61.5% 86.7% 62.4% Extent was the internal communication function involved in the changes recently undertaken by your organization 46.7% 68.8% 30.8% 62.9% Managers support the organization’s vision through their actions and attitude 66.7% 51.6% 38.5% 53.2% Measures used to assess reorg - Evidence of desired changes in employee behavior 60.0% 33.3% 46.2% 45.0% Managers address the needs and concerns of remaining employees 46.7% 45.2% 23.1% 40.8% Managers enthusiastically implement new approaches to work 46.7% 32.3% 30.8% 33.5% Extent use objective measures of changed behavior 22.2% 2.4% 6.7% 11.8%

48
Table A6 Focus on Continuous Improvement
Short Question Description AP CANADA Europe USA Regularly measure its effect on employee engagement 83.3% 85.0% 90.0% 68.2% Extent use employee feedback via surveys 55.6% 66.7% 47.1% 53.7% Regularly measure whether information helps employees do their jobs better 50.0% 50.0% 60.0% 56.1% Have a corporate scorecard with internal cx metrics 70.6% 59.5% 52.9% 51.1% Regularly measure employee behavior change 33.3% 35.0% 60.0% 53.3% Changes made as a result of employee opinion surveys are communicated effectively to employees 53.3% 48.6% 53.3% 38.3% Regularly measure its effect on business performance 58.3% 25.0% 40.0% 31.8% Extent use manager feedback via surveys 33.3% 33.3% 12.5% 30.6% Regularly measure its effect on the retention of critical talent 25.0% 35.0% 30.0% 18.7% Regularly measure its effect on workforce productivity 25.0% 30.0% 10.0% 19.6% Extent use employee feedback via focus groups 38.9% 21.4% 18.8% 12.6% Extent use manager feedback via focus groups 27.8% 16.7% 12.5% 9.8% The organization makes extensive use of measurement to verify the communication function’s contribution to strategic business goals 11.1% 7.1% 5.9% 9.2% The organization benchmarks the performance of the communication function against other companies 11.1% 2.4% 5.9% 8.1%
Table A7 Connects to the Business Strategy
Short Question Description AP CANADA Europe USA This organization directly links its communication objectives to its business objectives 63.2% 68.2% 84.2% 79.4% Senior management recognizes the importance of communication in achieving business objectives and takes an active role in doing so 78.9% 84.1% 84.2% 73.5% Corporate communication is an essential part of this organization’s business strategy 78.9% 68.2% 68.4% 68.0% Measures used to assess reorg - Achieving overall revenue/savings goals 66.7% 60.6% 46.2% 55.0% Measures used to assess reorg - Retention of high performers 66.7% 45.5% 46.2% 56.9% The organization's employee opinion surveys are designed to obtain feedback relating directly to key business objectives 66.7% 59.5% 60.0% 44.3% Measures used to assess reorg - Limited additional turnover 53.3% 33.3% 23.1% 48.8% Extent use increased employee participation related to the initiative 27.8% 31.0% 42.9% 35.4% Extent use customer measures (e.g., sales growth, customer satisfaction) 33.3% 19.0% 20.0% 16.9% Extent use operational measures (e.g., increased productivity) 22.2% 15.0% 13.3% 10.4% Extent use decreased turnover 22.2% 7.5% 14.3% 9.7% Extent use financial measures (e.g., revenue growth, profitability) 22.2% 17.1% 6.7% 7.5%

49
Effecting Change at a Behavioral Level
Table A8 Drives Supervisory/Managerial Behavior
Short Question Description AP CANADA Europe USA Managers are given information prior to it being shared with employees 73.7% 69.8% 89.5% 76.8% Managers support the executive management vision through their actions 64.7% 43.6% 53.3% 54.1% Managers are taking on a greater share of the communication responsibility in this organization 47.4% 57.1% 42.1% 53.0%
This organization does an effective job of “packaging” company/business information for managers to deliver to employees 47.4% 35.7% 47.4% 54.1% Managers enthusiastically implement new approaches to work 52.9% 48.7% 46.7% 36.9% Managers help provide feedback to employees about their job performance 64.7% 38.5% 40.0% 37.9% Measures used to assess reorg - Employee engagement relative to external benchmarks 33.3% 39.4% 30.8% 30.6% Managers help employees with career development 64.7% 35.9% 40.0% 25.6% Managers at all levels are rewarded for communicating effectively 15.8% 9.1% 5.3% 14.4%
Table A9 Drives Employee Behavior
Short Question Description AP CANADA Europe USA This organization communicates openly to employees about matters that affect them 88.2% 82.1% 73.3% 70.0% The organization shares business plans and/or goals with employees 64.7% 64.1% 66.7% 61.5% The organization shares financial information with employees 52.9% 64.1% 66.7% 61.2% A systematic orientation program for new hires exists 58.8% 50.0% 40.0% 46.1% The organization is sharing more business-related information with employees than it did last year 56.3% 56.4% 46.7% 39.9% The organization shares customer feedback with employees 47.1% 33.3% 26.7% 40.2%