
Secondary recrystallization of Goss texture in magnetostrictive Fe–Ga-based sheets
7
Secondary recrystallization of Goss texture in magnetostrictive Fe–Ga-based sheets Chao Yuan, Xue-Xu Gao*, Ji-Heng Li, Xiao-Qian Bao Received: 27 May 2013 / Revised: 17 September 2013 / Accepted: 16 April 2014 Ó The Nonferrous Metals Society of China and Springer-Verlag Berlin Heidelberg 2014 Abstract To avoid the unfavorable effect of precipitates on magnetic properties, low addition of 0.16 wt% NbC was employed in Fe 82.5 Ga 17.5 alloy, and 0.27 mm sheets were successfully prepared by a rolling process. Strong Goss texture was obtained in Fe–Ga sheets by two-stage annealing process. The sulfur annealing in quartz ampoules was made to produce the preferred growth of Goss texture, with a 51 % increase in the observed saturation magneto- striction, from 87 9 10 -6 in the Ar-annealed sheets to 132 9 10 -6 in the S-annealed sheets. However, large amounts of S-rich and Nb-rich precipitates were formed in the S-annealed sheets. High-temperature annealing of the S-annealed sheets at 1,200 °C under a flow hydrogen– argon atmosphere could effectively eliminate the precipi- tates and promote the selective growth of (110) grains due to the low surface energy. Large grains (*2 cm) of sec- ondary recrystallization were achieved in the final annealed sheets, with the maximum average saturation magneto- striction of 180 9 10 -6 . Keywords Fe–Ga alloy; Goss texture; Magnetostriction; Secondary recrystallization 1 Introduction In 2000, it was first reported that the addition of Ga could greatly increase the magnetostriction of a-Fe, and the maximum magnetostriction was as high as 400 9 10 -6 at a low applied magnetic field of *20 kAm -1 along h100i crystal orientation [1–3]. More importantly, Fe–Ga alloy has a strong mechanical strength of about 500 MPa [4], which is not obtained in other energy transducer materials, such as Terfenol-D and piezoelectric ceramic. The high magnetostriction combined with good mechanical proper- ties makes Fe–Ga alloy a unique material, and draws considerable interest due to its potential applications in sensors, actuators, and energy harvesting [5]. There are several researches concerned with bulk alloys [3, 6] and wires [7], and the ternary addition is of great importance for the magnetic properties in the Fe–Ga alloys [8, 9]. Owing to their high conductivity, Fe–Ga alloys need to be formed into thin sheets to avoid eddy current losses. Since the maximum magnetostriction and easy axis occur along the h001i orientation, it is desirable to obtain the g- fiber, h100i//RD (rolling direction) in Fe–Ga sheets, including Goss texture ({110}h001i) or cubic texture ({100}h001i). Efforts were made to fabricate g-fiber-tex- tured Fe–Ga sheets by conventional rolling process [10– 18]. Secondary recrystallization, also called abnormal grain growth (AGG), is widely used to obtain Goss-textured sheets in electrical steel. In previous studies [15, 16], NbC was reported to promote the AGG of Goss grains in Fe–Ga alloy sheets in a process that was similar to the inhibition of normal grain growth (NGG) due to the precipitation of second-phase particles in Fe–Si steel, and single-like grain growth of Goss grain was obtained combined with the S-induced surface energy effect [17]. However, owing to the low ductility of binary Fe–Ga alloy, the addition of Nb C. Yuan, X.-X. Gao*, J.-H. Li, X.-Q. Bao State Key Laboratory of Advanced Metals and Materials, University of Science and Technology Beijing, Beijing 100083, China e-mail: [email protected] C. Yuan e-mail: [email protected] 123 Rare Met. RARE METALS DOI 10.1007/s12598-014-0284-5 www.editorialmanager.com/rmet
Transcript of Secondary recrystallization of Goss texture in magnetostrictive Fe–Ga-based sheets

Secondary recrystallization of Goss texture in magnetostrictiveFe–Ga-based sheets
Chao Yuan, Xue-Xu Gao*, Ji-Heng Li,
Xiao-Qian Bao
Received: 27 May 2013 / Revised: 17 September 2013 / Accepted: 16 April 2014
� The Nonferrous Metals Society of China and Springer-Verlag Berlin Heidelberg 2014
Abstract To avoid the unfavorable effect of precipitates
on magnetic properties, low addition of 0.16 wt% NbC was
employed in Fe82.5Ga17.5 alloy, and 0.27 mm sheets were
successfully prepared by a rolling process. Strong Goss
texture was obtained in Fe–Ga sheets by two-stage
annealing process. The sulfur annealing in quartz ampoules
was made to produce the preferred growth of Goss texture,
with a 51 % increase in the observed saturation magneto-
striction, from 87 9 10-6 in the Ar-annealed sheets to
132 9 10-6 in the S-annealed sheets. However, large
amounts of S-rich and Nb-rich precipitates were formed in
the S-annealed sheets. High-temperature annealing of the
S-annealed sheets at 1,200 �C under a flow hydrogen–
argon atmosphere could effectively eliminate the precipi-
tates and promote the selective growth of (110) grains due
to the low surface energy. Large grains (*2 cm) of sec-
ondary recrystallization were achieved in the final annealed
sheets, with the maximum average saturation magneto-
striction of 180 9 10-6.
Keywords Fe–Ga alloy; Goss texture; Magnetostriction;
Secondary recrystallization
1 Introduction
In 2000, it was first reported that the addition of Ga could
greatly increase the magnetostriction of a-Fe, and the
maximum magnetostriction was as high as 400 9 10-6 at a
low applied magnetic field of *20 kA�m-1 along h100icrystal orientation [1–3]. More importantly, Fe–Ga alloy
has a strong mechanical strength of about 500 MPa [4],
which is not obtained in other energy transducer materials,
such as Terfenol-D and piezoelectric ceramic. The high
magnetostriction combined with good mechanical proper-
ties makes Fe–Ga alloy a unique material, and draws
considerable interest due to its potential applications in
sensors, actuators, and energy harvesting [5]. There are
several researches concerned with bulk alloys [3, 6] and
wires [7], and the ternary addition is of great importance
for the magnetic properties in the Fe–Ga alloys [8, 9].
Owing to their high conductivity, Fe–Ga alloys need to
be formed into thin sheets to avoid eddy current losses.
Since the maximum magnetostriction and easy axis occur
along the h001i orientation, it is desirable to obtain the g-
fiber, h100i//RD (rolling direction) in Fe–Ga sheets,
including Goss texture ({110}h001i) or cubic texture
({100}h001i). Efforts were made to fabricate g-fiber-tex-
tured Fe–Ga sheets by conventional rolling process [10–
18]. Secondary recrystallization, also called abnormal grain
growth (AGG), is widely used to obtain Goss-textured
sheets in electrical steel. In previous studies [15, 16], NbC
was reported to promote the AGG of Goss grains in Fe–Ga
alloy sheets in a process that was similar to the inhibition of
normal grain growth (NGG) due to the precipitation of
second-phase particles in Fe–Si steel, and single-like grain
growth of Goss grain was obtained combined with the
S-induced surface energy effect [17]. However, owing to
the low ductility of binary Fe–Ga alloy, the addition of Nb
C. Yuan, X.-X. Gao*, J.-H. Li, X.-Q. Bao
State Key Laboratory of Advanced Metals and Materials,
University of Science and Technology Beijing, Beijing 100083,
China
e-mail: [email protected]
C. Yuan
e-mail: [email protected]
123
Rare Met. RARE METALSDOI 10.1007/s12598-014-0284-5 www.editorialmanager.com/rmet

or NbC was as much as 1 at% (equal to *1.8 wt%) to
suppress the grain boundary fracture and improve the rol-
lability [14–18], compared with the much lower addition of
0.09 wt% Nb [19] as inhibitors in Fe–Si steel. The exces-
sive Nb would result in a large amount of Nb-rich pre-
cipitates, due to the low solubility of Nb in Fe–Ga alloy
[20]. As precipitates in magnetic material would restrain
the domain motion, causing higher coercivity and core
losses, their removal would be beneficial for improving the
efficiency of transducer. However, a few studies were
undertaken to reduce the addition of NbC and eliminate
Nb-rich precipitates during the annealing process, in order
to avoid the probable unfavorable effect on Fe–Ga ultra-
sonic transducer.
In this work, 0.27 mm Fe–Ga sheets were successfully
prepared by a rolling process with the low addition of NbC
(0.16 wt%). Compared with previous work [14–18], the
addition amount of 0.16 wt% was less than 1/10 of the
previous contents (*1.8 wt%), resulting in easy elimina-
tion of Nb-rich precipitates. Two-stage annealing process
was made to produce Goss-textured sheets. The preferred
Goss texture was obtained during first stage of S-annealing
in quartz ampoules. Hydrogen was introduced to promote
Goss grain growth and eliminate Nb-rich precipitates dur-
ing the second stage of high-temperature annealing.
Finally, strong secondary recrystallization of Goss texture
was obtained with few precipitates in the sheets.
2 Experimental
The 0.16 wt% NbC doped Fe82.5Ga17.5 ingots were pre-
pared from Fe (99.9 % purity), Ga (99.99 % purity) and the
master alloys of Fe–C and Nb–Fe by induction melting
under Ar atmosphere. The cast ingot was hot forged to a
thickness of 20 mm, followed by a rolling process of hot
rolling (1,100 �C) to 1.8 mm, intermediate annealing
(830 �C for 1 h), warm rolling (500 �C) to 0.6 mm, and
cold rolling to a final thickness of 0.27 mm. Two-stage
annealing process was made to fabricate Goss textured Fe–
Ga sheets. The first stage was made in quartz ampoules
with elemental S enclosed (*1 mg�cm-2) under Ar
(0.3 9 105 Pa), and a slow heating rate of 15 �C�h-1
between 900 and 1,080 �C was employed to promote the
selective growth of Goss grains. To investigate the effect of
S on textural evolution during the first stage, the same
annealing protocol was carried out for another ampoule
without the elemental S. To promote further grain growth
and eliminate precipitates in the S-annealed sheets, the
second stage of high-temperature annealing was performed
at 1,200 �C with various annealing time under H2/Ar-
mixed (25 vol% H2) gas flow, followed by furnace cooling
to around 400 �C and air cooling to room temperature. The
illustration of annealing process is shown in Fig. 1, and
digital photographs of final annealed sheets are shown in
Fig. 2.
The phase on the surface was detected by X-ray dif-
fraction (XRD), after polishing the surface with SiC sand
paper. Scanning electron microscopy (SEM) and energy
dispersive X-ray spectroscopy (EDX) were employed to
investigate the precipitates in the sheets. The X-ray pole
made on the sheets of dimension, 10 mm 9 20 mm, was
employed to obtain orientation distribution function (ODF)
to get the information of macrotexture. The magnetostric-
tion was measured by strain-gages positioned along the
RD, and the active area of strain-gages was
2.8 mm 9 2.0 mm. The saturation magnetostriction is the
value of (3/2)kS = k// - k\, where k// and k\ are
the magnetostriction when the magnetic fields parallel and
perpendicular to the RD are applied, respectively.
3 Results and discussion
The XRD patterns for the sheets after annealing are shown
in Fig. 3. As it can be seen, for the sheets after both first-
and second-stage annealing steps, the main phase is the a-
Fe (A2) phase, and no other phase related with Nb is found,
which may be attributed to its low content. Notably, much
higher diffraction intensity ratio of (110) grains to (200)
grains can be observed in the S-annealed than that in the
Ar-annealed sheets after the first-stage annealing, in
Fig. 3a. Although the preferred growth of (110) grains is
obtained in the S-annealed sheets, (110) grains are not
dominant after the first stage annealing, and weak patterns
for (200) and (211) grains are observed. After the second
stage of high-temperature annealing, the (110) grains in the
S-annealed sheets further develop, resulting in the domi-
nant patterns for (110) grains, as shown in Fig. 3b.
Fig. 1 Illustration of two-stage annealing process
C. Yuan et al.
123 Rare Met.
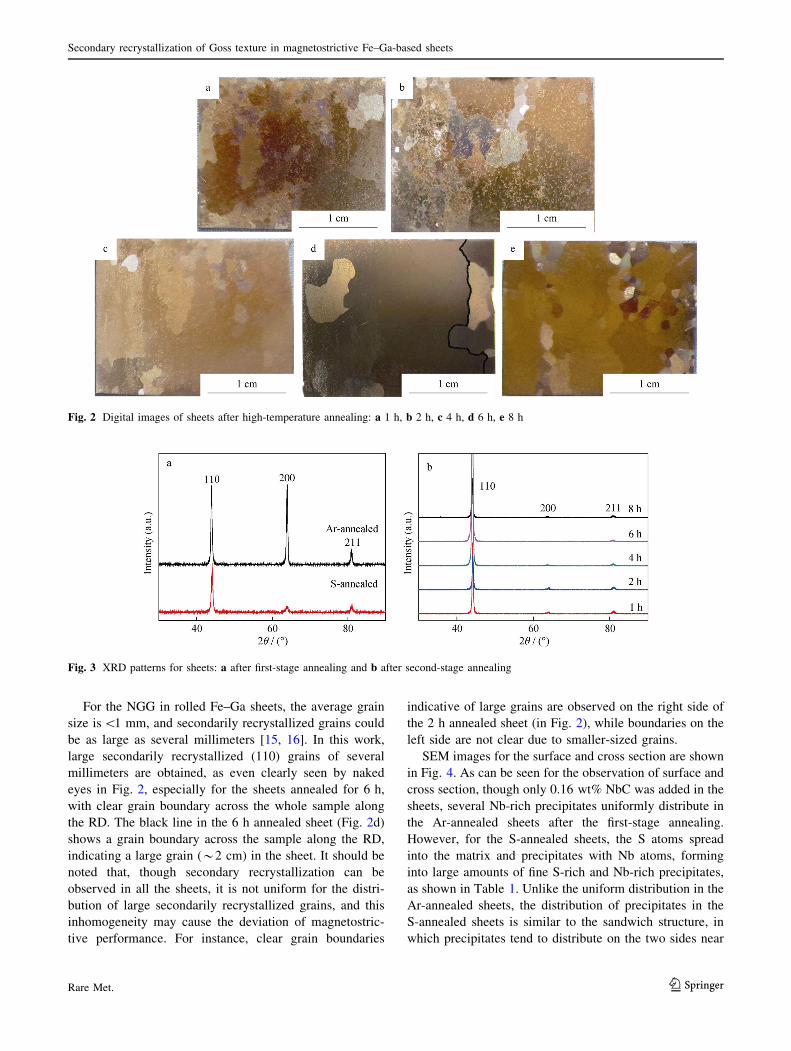
For the NGG in rolled Fe–Ga sheets, the average grain
size is\1 mm, and secondarily recrystallized grains could
be as large as several millimeters [15, 16]. In this work,
large secondarily recrystallized (110) grains of several
millimeters are obtained, as even clearly seen by naked
eyes in Fig. 2, especially for the sheets annealed for 6 h,
with clear grain boundary across the whole sample along
the RD. The black line in the 6 h annealed sheet (Fig. 2d)
shows a grain boundary across the sample along the RD,
indicating a large grain (*2 cm) in the sheet. It should be
noted that, though secondary recrystallization can be
observed in all the sheets, it is not uniform for the distri-
bution of large secondarily recrystallized grains, and this
inhomogeneity may cause the deviation of magnetostric-
tive performance. For instance, clear grain boundaries
indicative of large grains are observed on the right side of
the 2 h annealed sheet (in Fig. 2), while boundaries on the
left side are not clear due to smaller-sized grains.
SEM images for the surface and cross section are shown
in Fig. 4. As can be seen for the observation of surface and
cross section, though only 0.16 wt% NbC was added in the
sheets, several Nb-rich precipitates uniformly distribute in
the Ar-annealed sheets after the first-stage annealing.
However, for the S-annealed sheets, the S atoms spread
into the matrix and precipitates with Nb atoms, forming
into large amounts of fine S-rich and Nb-rich precipitates,
as shown in Table 1. Unlike the uniform distribution in the
Ar-annealed sheets, the distribution of precipitates in the
S-annealed sheets is similar to the sandwich structure, in
which precipitates tend to distribute on the two sides near
Fig. 2 Digital images of sheets after high-temperature annealing: a 1 h, b 2 h, c 4 h, d 6 h, e 8 h
Fig. 3 XRD patterns for sheets: a after first-stage annealing and b after second-stage annealing
Secondary recrystallization of Goss texture in magnetostrictive Fe–Ga-based sheets
123Rare Met.

the surface as shown in Fig. 4d. The chemical composition
of precipitates on the cross sections after the first-stage
annealing is shown in Table 1.
In previous studies with the S-induced selective grain
growth in Fe–Ga–B sheets, Na and Flatau [18] reported the
segregation of S on the surface in addition to obvious XRD
patterns for FeS, and the layer of S-segregation was only a
few nanometers by XPS and AES analysis. However, in
this work, no obvious XRD pattern for sulfide is found
(Fig. 3a), which may be due to the low content. Besides,
the S-rich and Nb-rich precipitates are found in several tens
of microns away from the surface, as shown in Fig. 4d and
Table 1.
Since the nonmagnetic particles would restrain the
domain motion, they cause core losses and other unfavor-
able effects on transducer; thus, hydrogen was introduced
to eliminate the Nb-rich precipitates. As expected, though
the Nb-rich precipitates are observed both in the Ar-
annealed and S-annealed sheets after the first-stage
annealing, they could hardly be found after annealing at
1,200 �C for 6 h under H2/Ar atmosphere, as shown in
Fig. 4e, f. The elimination of Nb-rich precipitates may be
similar to the behavior of AlN or MnS in Fe–Si steel during
high-temperature annealing in dry H2. Owing to the strong
reduction effect of H2, N or S atoms are eliminated by the
type of NH3 or H2S, and Al or Mn atoms dissolve into the
matrix, and thus, few precipitates remain in the sheets after
hydrogen annealing, avoiding the unfavorable effect of
precipitates on magnetic properties. As mentioned above in
Table 1, the S atoms are prone to precipitate with Nb
atoms. The S and C atoms could be eliminated due to the
strong reduction effect of H2, increasing the solubility of
Nb atoms, and thus Nb-rich precipitates uniformly dissolve
into the matrix, avoiding the unfavorable effect of precip-
itates on magnetic properties.
To maximize the magnetostrictive performance, the tex-
ture along the RD is also of great importance, and g-fiber
texture ({110}h001i or {100}h001i) is preferred. The ODF
plots (u2 = 45�) from the X-ray pole figure of the specimen
are shown in Fig. 5. As shown in Fig. 5a, the main texture for
Ar-annealed sheets after the first-annealing stage is the
rotating cubic texture ({001}h110i), accompanied with
strong c-fiber texture (h111i//ND), consisting of {111}h110iand {111}h112i. However, for the S-annealed sheets, the
main texture becomes the preferred Goss texture
({110}h001i) as shown in Fig. 5b, consistent with the pre-
ferred pattern for the (110) grains as found from the XRD
results (Fig. 3a).
It was reported that the S-induced surface energy effect
could play an important role in the selective grain growth
in Fe–Si electrical steel [21, 22], also in Fe–Ga-rolled
sheets [11, 17, 18]. Except for the surface energy effect, the
dispersion of NbC particles would play as inhibitors
causing the local pinning of non-Goss grain boundaries,
Fig. 4 SEM images after first-stage annealing: a surface and b cross section of Ar-annealed, c surface and d cross section of S-annealed; after
second-stage annealing for 6 h: e surface and f cross section
Table 1 Chemical composition of precipitates on cross section
(wt%)
Precipitates Fe Ga Nb S
Ar-annealed 9.24 2.51 88.25 –
S-annealed 34.38 5.87 33.69 26.06
C. Yuan et al.
123 Rare Met.

which promoted the preferred growth of Goss texture.
Compared with the most previous studies using much
higher content of NbC (1 at%, equal to *1.8 wt%) in Fe–
Ga sheets [15–18], only 0.16 wt% NbC was used in this
study, and this is much closer to the addition of only
0.09 wt% Nb as inhibitors in Fe–Si steel [19]. However,
the single effect of NbC could not effectively promote the
development of Goss texture in this work, as shown in
Fig. 5a. Thus, the selective growth of Goss texture during
the first-stage annealing may be attributed to the combined
effects of the dispersion of NbC particles and the S-induced
surface energy effect. However, further study is needed to
distinguish which one plays the primary role in the texture
evolution during the first-stage annealing.
As shown in Fig. 5b, although the preferred Goss texture
develops after the first stage of S-annealing, Goss texture is
not dominant, and other weak textures are found. Thus, high-
temperature annealing was made to promote the further
growth of Goss texture. As expected, Goss grains further
develop during high-temperature annealing under flow H2/
Ar atmosphere, and become dominant with a maximum
intensity value of 51 in the 6 h annealed sheets, as shown in
Fig. 5c. The ODF plot is also consistent with the XRD results
as shown in Fig. 3b, which shows dominant patterns for
(110) grains. It was reported that the preferred (110) grain
growth occurred under very clean surface condition because
of the lower surface energy compared with (100) and (111)
grains [21]. Hydrogen would purify the surface, causing the
constant surface with little contamination. Thus, the pre-
ferred (110) grain growth may be attributed to the low sur-
face energy, and unlike that in Ref. [10], the preferred (110)
grain growth does not vary with the annealing time, as shown
in Fig. 3b. Considering that there are only a few particles as
inhibitors (Fig. 4f), the surface energy effect is considered to
be the key factor in the development of (110) grain growth
during the second-stage annealing.
The measured magnetostriction data are shown in
Fig. 6. Although the thickness is 0.27 mm, the annealed
Fig. 5 ODF plots (u2 = 45�) after first-stage annealing: Ar-annealed a and S-annealed b; after second-stage annealing for 6 h c
Fig. 6 Magnetostriction versus applied magnetic field curves (k// and k\) after first-stage annealing a and measured saturation magnetostriction
(k// - k\) and average values (k// - k\) after second-stage annealing b
Secondary recrystallization of Goss texture in magnetostrictive Fe–Ga-based sheets
123Rare Met.

sheets are strong enough to keep straight in a field below
80 kA�m-1, and the measurement error range is below
2–3 9 10-6 for the same gage within several times of
measurement. Figure 6a gives the magnetostrictive curves
versus magnetic field after first stage annealing. Because of
the preferred Goss texture in Fig. 5b, a 51 % increase of
saturation magnetostriction (k// - k\) is observed, i.e.,
from 87 9 10-6 in the Ar-annealed sheet to 132 9 10-6 in
the S-annealed sheet. For the magnetostrictive measure-
ment after the second-stage annealing, owing to the inho-
mogeneity of development in the secondary
recrystallization in Fig. 2, three strain gages parallel to
each other along the RD were used to measure the mag-
netostrictive strain. The measured saturation magneto-
striction values (3/2)kS = k// - k\ as a function of
dwelling time at 1,200 �C are shown in Fig. 6b. The
measured maximum (3/2)kS is 203 9 10-6 for the 4 h
annealed sheet. The average values for (3/2)kS are above
165 9 10-6 for the 4–8 h annealed sheets, with a maxi-
mum of 180 9 10-6 for the 6 h annealed sheet. However,
large deviation for (3/2)kS is observed, especially for the
annealing times of 2 and 4 h, which may be due to the
inhomogeneity of secondary recrystallization. In addition,
other minor orientations could be found in the XRD pat-
terns (Fig. 3b) and the ODF plot (Fig. 5c), which would
also cause the deviation of magnetostriction. Further study
is needed to improve the homogeneity of magnetostriction,
and the homogeneity of secondary recrystallization may be
the key factor. Although there is a large deviation in sat-
uration magnetostriction, with the thickness \0.3 mm, the
average value for (3/2)kS above 165 9 10-6 is large
enough for ultrasonic application.
4 Conclusion
The Fe82.5Ga17.5 alloy sheets with low addition of
0.16 wt% NbC were successfully prepared with a final
thickness of 0.27 mm by a rolling process, and the two-
stage annealing process was used to fabricate the Goss
textured sheets. Sulfur annealing in quartz ampoules pro-
duced a preferred growth of Goss texture, and a 51 %
increase was observed in saturation magnetostriction, from
87 9 10-6 in the Ar-annealed sheets to 132 9 10-6 in the
S-annealed sheets. A large number of fine S-rich and Nb-
rich precipitates were found in the S-annealed sheets after
the first-stage annealing, and hydrogen during the high-
temperature annealing stage could eliminate precipitates.
Owing to the lower surface energy of (110) grains under
clean surface condition, the preferred (110) grain growth
was observed, and large grains (*2 cm) of secondary
recrystallization were obtained with the maximum average
values for magnetostriction of 180 9 10-6.
Acknowledgments This study was financially supported by the
National Basic Research Program of China (No. 2011CB606304), the
National Natural Science Foundation of China (No. 51271019), the
Fundamental Research Funds for the Central Universities (No. FRF-
SD-12-025A), and the National Natural Science Foundation for Post-
doctoral Scientists of China (No. 2011M500229).
References
[1] Clark AE, Restorff JB, Wun-Fogle M, Lograsso TA, Schlagel
DL. Magnetostrictive properties of body-centered cubic Fe–Ga
and Fe–Ga–Al alloys. IEEE Trans Magn. 2000;36(5):3238.
[2] Srisukhumbowornchai N, Guruswamy S. Large magnetostric-
tion in directionally solidified FeGa and FeGaAl Alloys. J Appl
Phys. 2001;90(11):5680.
[3] Clark AE, Hathaway KB, Wun-Fogle M, Restorff JB, Lograsso
TA, Keppens VM, Petculescu G, Taylor RA. Extraordinary
magnetoelasticity and lattice softening in bcc Fe–Ga alloys.
J Appl Phys. 2003;93(10):8621.
[4] Kellogg RA, Russell AM, Lograsso TA, Flatau AB, Calrk AE,
Wun-Fogle M. Tensile properties of magnetostrictive iron–gal-
lium alloys. Acta Mater. 2004;52:5043.
[5] Hu QX, Yu DB, Yang HC, Li KS. Development of magneto-
strictive properties of Fe–Ga alloy. Chin J Rare Met.
2013;37(1):164.
[6] Li C, Liu JH, Wang ZB, Jiang CB. Crystal growth of high
magnetostrictive polycrystalline Fe81Ga19 alloys. J Magn Magn
Mater. 2012;324(6):1177.
[7] Li JH, Gao XX, Zhu J, Bao XQ, Cheng L, Xie JX. Wiedemann
effect of Fe–Ga based magnetostrictive wires. Chin Phys B.
2012;21(8):087501.
[8] Clark AE, Restorff JB, Wun-Fogle M, Hathaway KB, Lograsso TA,
Huang M, Summers E. Magnetostriction of ternary Fe–Ga–X
(X = C, V, Cr, Mn Co, Rh) alloys. J Appl Phys.
2007;101(9):09C507.
[9] Huang M, Lograsso TA, Clark AE, Restorff JB, Wun-Fogle M.
Effect of interstitial additions on magnetostriction in Fe–Ga
alloys. J Appl Phys. 2008;103(7):07B314.
[10] Summers E, Meloy R, Na SM. Magnetostriction and texture
relationships in annealed galfenol alloys. J Appl Phys.
2009;105(7):07A922.
[11] Na SM, Suh SJ, Flatau AB. Surface segregation and texture
development in rolled Fe–Ga alloy. J Magn Magn Mater.
2007;310(2):2630.
[12] Srisukhumbowornchai N, Guruswamy S. Crystallographic tex-
tures in rolled and annealed Fe–Ga and Fe–Al Alloys. Metall
Mater Trans A. 2004;35(9):2963.
[13] Li JH, Gao XX, Zhu J, Bao XQ, Xia T, Zhang MC. Ductility,
texture and large magnetostriction of Fe–Ga-based sheets. Scr
Mater. 2010;63(2):246.
[14] Li JH, Gao XX, Zhu J, He CX, Qiao JW, Zhang MC. Texture
evolution and magnetostriction in rolled (Fe81Ga19)99Nb1 alloy.
J Alloy Compd. 2009;476(1):529.
[15] Na SM, Yoo JH, Flatau AB. Abnormal (110) grain growth and
magnetostriction in recrystallized Galfenol with dispersed nio-
bium carbide. IEEE Trans Magn. 2009;45(10):4132.
[16] Meloy R, Summers E. Magnetic property-texture relationships in
galfenol rolled sheet stacks. J Appl Phys. 2011;109(7):07A930.
[17] Na SM, Flatau AB. Single grain growth and large magneto-
striction in secondarily recrystallized Fe–Ga thin sheet with
sharp Goss (011)[100] orientation. Scr Mater. 2012;66(5):307.
[18] Na SM, Flatau AB. Surface-energy-induced selective growth of
(001) grains in magnetostrictive ternary Fe–Ga-based alloys.
Smart Mater Struct. 2012;21(5):055024.
C. Yuan et al.
123 Rare Met.

[19] Hulka K, Vlad C, Doniga A. The role of niobium as micro-
alloying element in electrical sheet. Steel Res. 2002;73(10):4
53.
[20] Na SM, Passel A, Downey P, Flatau A. Magnetostrictive Fe–Ga
alloy strips with a preferred orientation for lamination actuators.
Phys Status Solidi A. 2013;210(6):1076.
[21] Kohler D. Promotion of cubic grain growth in 3 % silicon iron
by control of annealing atmosphere composition. J Appl Phys.
1960;31(5):408S.
[22] Kramer JJ. Nucleation and growth effects in thin ferromagnetic
sheets: a review focusing on surface energy-induced secondary
recrystallization. Metall Trans A. 1992;23(7):1987.
Secondary recrystallization of Goss texture in magnetostrictive Fe–Ga-based sheets
123Rare Met.


![Surface recrystallization of single crystal nickel-based ...recrystallization behavior of SC superalloys are rarely reported [9,10]. Typically, recrystallization behavior of alloys](https://static.fdocuments.us/doc/165x107/5f2652b9bf73cd24c24d8552/surface-recrystallization-of-single-crystal-nickel-based-recrystallization-behavior.jpg)