SECONDARY EXPLOSION HAZARDS DURING BLASTING IN OIL … · Secondary Explosion Hazards During...
62
UNITED STATES BUREAU OF MINES UNITED STATES DEPARTMENT OF THE INTERIOR REPORT OF INVESTIGATIONS/1995 RI 9632 Secondary Explosion Hazards During Blasting in Oil Shale and Sulfide Ore Mines
Transcript of SECONDARY EXPLOSION HAZARDS DURING BLASTING IN OIL … · Secondary Explosion Hazards During...
UNITED STATES BUREAU OF MINES
UNITED STATES DEPARTMENT OF THE INTERIOR
REPORT OF INVESTIGATIONS/1995RI 9632
Secondary Explosion Hazards During Blastingin Oil Shale and Sulfide Ore Mines
U.S. Department of the InteriorMission Statement
As the Nation’s principal conservation agency, the Department of theInterior has responsibility for most of our nationally-owned publiclands and natural resources. This includes fostering sound use of ourland and water resources; protecting our fish, wildlife, and biologicaldiversity; preserving the environmental and cultural values of ournational parks and historical places; and providing for the enjoymentof life through outdoor recreation. The Department assesses ourenergy and mineral resources and works to ensure that theirdevelopment is in the best interests of all our people by encouragingstewardship and citizen participation in their care. The Departmentalso has a major responsibility for American Indian reservationcommunities and for people who live in island territories under U.S.administration.
Report of Investigations 9632
Secondary Explosion Hazards During Blasting in Oil Shale and Sulfide Ore Mines
By Eric S. Weiss, Kenneth L. Cashdollar, Michael J. Sapko,and Eugene M. Bazala
UNITED STATES DEPARTMENT OF ENERGY
PITTSBURGH RESEARCH CENTER

International Standard Serial NumberISSN 1066-5552

CONTENTSPage
Abstract . . . . . . . . . . . . . . . . . . . . . . . . . . . . . . . . . . . . . . . . . . . . . . . . . . . . . . . . . . . . . . . . . . . . . . . . . . . . . . . . . . . . . . 1Introduction . . . . . . . . . . . . . . . . . . . . . . . . . . . . . . . . . . . . . . . . . . . . . . . . . . . . . . . . . . . . . . . . . . . . . . . . . . . . . . . . . . . . 2
Oil shale mining. . . . . . . . . . . . . . . . . . . . . . . . . . . . . . . . . . . . . . . . . . . . . . . . . . . . . . . . . . . . . . . . . . . . . . . . . . . . . . . 2Historical development of oil shale. . . . . . . . . . . . . . . . . . . . . . . . . . . . . . . . . . . . . . . . . . . . . . . . . . . . . . . . . . . . . . . 2Properties of oil shale. . . . . . . . . . . . . . . . . . . . . . . . . . . . . . . . . . . . . . . . . . . . . . . . . . . . . . . . . . . . . . . . . . . . . . . . 4
Sulfide ore mining. . . . . . . . . . . . . . . . . . . . . . . . . . . . . . . . . . . . . . . . . . . . . . . . . . . . . . . . . . . . . . . . . . . . . . . . . . . . . 4Explosion hazards of oil shale dusts. . . . . . . . . . . . . . . . . . . . . . . . . . . . . . . . . . . . . . . . . . . . . . . . . . . . . . . . . . . . . . . . . . . 5
Large-scale experimental mine data. . . . . . . . . . . . . . . . . . . . . . . . . . . . . . . . . . . . . . . . . . . . . . . . . . . . . . . . . . . . . . . . . 6Laboratory data. . . . . . . . . . . . . . . . . . . . . . . . . . . . . . . . . . . . . . . . . . . . . . . . . . . . . . . . . . . . . . . . . . . . . . . . . . . . . . . 7
Dust, pressure, and flame during blasting in oil shale mines. . . . . . . . . . . . . . . . . . . . . . . . . . . . . . . . . . . . . . . . . . . . . . . . . . 11Gas generation during oil shale mining. . . . . . . . . . . . . . . . . . . . . . . . . . . . . . . . . . . . . . . . . . . . . . . . . . . . . . . . . . . . . . . . . 20
Horse Draw oil shale mine. . . . . . . . . . . . . . . . . . . . . . . . . . . . . . . . . . . . . . . . . . . . . . . . . . . . . . . . . . . . . . . . . . . . . . . 20White River oil shale project. . . . . . . . . . . . . . . . . . . . . . . . . . . . . . . . . . . . . . . . . . . . . . . . . . . . . . . . . . . . . . . . . . . . . . 20
Gas monitoring system. . . . . . . . . . . . . . . . . . . . . . . . . . . . . . . . . . . . . . . . . . . . . . . . . . . . . . . . . . . . . . . . . . . . . . . . 21Methane emissions during mining operations. . . . . . . . . . . . . . . . . . . . . . . . . . . . . . . . . . . . . . . . . . . . . . . . . . . . . . . . 23Methane emissions from core analyses. . . . . . . . . . . . . . . . . . . . . . . . . . . . . . . . . . . . . . . . . . . . . . . . . . . . . . . . . . . . 23
Development of safer explosives for gassy oil shale mines. . . . . . . . . . . . . . . . . . . . . . . . . . . . . . . . . . . . . . . . . . . . . . . . . . . 24Initial explosives . . . . . . . . . . . . . . . . . . . . . . . . . . . . . . . . . . . . . . . . . . . . . . . . . . . . . . . . . . . . . . . . . . . . . . . . . . . . . . 25Bruceton Experimental Mine tests. . . . . . . . . . . . . . . . . . . . . . . . . . . . . . . . . . . . . . . . . . . . . . . . . . . . . . . . . . . . . . . . . . 25
Minimum charge weight for ignition. . . . . . . . . . . . . . . . . . . . . . . . . . . . . . . . . . . . . . . . . . . . . . . . . . . . . . . . . . . . . . 25Stemming. . . . . . . . . . . . . . . . . . . . . . . . . . . . . . . . . . . . . . . . . . . . . . . . . . . . . . . . . . . . . . . . . . . . . . . . . . . . . . . . . 26
Full-scale field studies with ANFO. . . . . . . . . . . . . . . . . . . . . . . . . . . . . . . . . . . . . . . . . . . . . . . . . . . . . . . . . . . . . . . . . 28Low-incendive explosives. . . . . . . . . . . . . . . . . . . . . . . . . . . . . . . . . . . . . . . . . . . . . . . . . . . . . . . . . . . . . . . . . . . . . . . . 29Lake Lynn cannon gallery tests. . . . . . . . . . . . . . . . . . . . . . . . . . . . . . . . . . . . . . . . . . . . . . . . . . . . . . . . . . . . . . . . . . . . 32Full-scale field tests with a low-incendive blend. . . . . . . . . . . . . . . . . . . . . . . . . . . . . . . . . . . . . . . . . . . . . . . . . . . . . . . . 35
Unocal's Long Ridge Mine tests. . . . . . . . . . . . . . . . . . . . . . . . . . . . . . . . . . . . . . . . . . . . . . . . . . . . . . . . . . . . . . . . . 35Occidental's Logan Wash Mine tests. . . . . . . . . . . . . . . . . . . . . . . . . . . . . . . . . . . . . . . . . . . . . . . . . . . . . . . . . . . . . . 38
Explosion hazards of sulfide ore dusts. . . . . . . . . . . . . . . . . . . . . . . . . . . . . . . . . . . . . . . . . . . . . . . . . . . . . . . . . . . . . . . . . 40Laboratory data. . . . . . . . . . . . . . . . . . . . . . . . . . . . . . . . . . . . . . . . . . . . . . . . . . . . . . . . . . . . . . . . . . . . . . . . . . . . . . . 41Large-scale experimental mine data. . . . . . . . . . . . . . . . . . . . . . . . . . . . . . . . . . . . . . . . . . . . . . . . . . . . . . . . . . . . . . . . . 44
Full-scale validation tests in sulfide ore mines. . . . . . . . . . . . . . . . . . . . . . . . . . . . . . . . . . . . . . . . . . . . . . . . . . . . . . . . . . . . 45Recommendations. . . . . . . . . . . . . . . . . . . . . . . . . . . . . . . . . . . . . . . . . . . . . . . . . . . . . . . . . . . . . . . . . . . . . . . . . . . . . . . . 47Conclusions . . . . . . . . . . . . . . . . . . . . . . . . . . . . . . . . . . . . . . . . . . . . . . . . . . . . . . . . . . . . . . . . . . . . . . . . . . . . . . . . . . . . 48Acknowledgments. . . . . . . . . . . . . . . . . . . . . . . . . . . . . . . . . . . . . . . . . . . . . . . . . . . . . . . . . . . . . . . . . . . . . . . . . . . . . . . . 49References. . . . . . . . . . . . . . . . . . . . . . . . . . . . . . . . . . . . . . . . . . . . . . . . . . . . . . . . . . . . . . . . . . . . . . . . . . . . . . . . . . . . . 50Appendix.—Abbreviations used in this report. . . . . . . . . . . . . . . . . . . . . . . . . . . . . . . . . . . . . . . . . . . . . . . . . . . . . . . . . . . . 53
ILLUSTRATIONS
1. Map showing four basins of the Green River Oil Shale Formation and locations of oil shale mines. . . . . . . . . . . . . . . . . . 32. Optical microscope photograph of oil shale particles and the corresponding SEM x-ray maps for the elements
calcium, silicon, and aluminum. . . . . . . . . . . . . . . . . . . . . . . . . . . . . . . . . . . . . . . . . . . . . . . . . . . . . . . . . . . . . . . . . 53. Plan view of the Bruceton Experimental Mine. . . . . . . . . . . . . . . . . . . . . . . . . . . . . . . . . . . . . . . . . . . . . . . . . . . . . . . . 64. Side view of the face area in the main entry of the Bruceton Experimental Mine showing instrumentation
positions . . . . . . . . . . . . . . . . . . . . . . . . . . . . . . . . . . . . . . . . . . . . . . . . . . . . . . . . . . . . . . . . . . . . . . . . . . . . . . . . . 75. Vertical cross section of the Pittsburgh Research Center's 20-L dust explosibility test chamber. . . . . . . . . . . . . . . . . . . . . 76. Explosibility data from 20-L chamber for three oil shales. . . . . . . . . . . . . . . . . . . . . . . . . . . . . . . . . . . . . . . . . . . . . . . . 97. Summary explosibility data from 20-L chamber for four oil shales compared with high- and low-volatile
bituminous coals and anthracite. . . . . . . . . . . . . . . . . . . . . . . . . . . . . . . . . . . . . . . . . . . . . . . . . . . . . . . . . . . . . . . . 98. Minimum explosible concentrations for hybrid mixtures of coal or oil shale dusts with methane gas from
20-L chamber. . . . . . . . . . . . . . . . . . . . . . . . . . . . . . . . . . . . . . . . . . . . . . . . . . . . . . . . . . . . . . . . . . . . . . . . . . . . . . 109. Map of part of the Colony Oil Shale Mine showing entry and blasting area. . . . . . . . . . . . . . . . . . . . . . . . . . . . . . . . . . . 12
ILLUSTRATIONS—Continued
ii
Page
10. Map of blasting area showing instrumentation and sampling pan positions for blast 3 at Colony Mine. . . . . . . . . . . . . . . . 1211. Map of blasting area showing instrumentation positions and faces for blasts 4 and 5 at Long Ridge Mine. . . . . . . . . . . . . 1312. Map of blasting area showing instrumentation positions for blast 6 at Colony Mine. . . . . . . . . . . . . . . . . . . . . . . . . . . . . 1313. Diagram of Long Ridge Mine face showing blasting pattern for blasts 4 and 5. . . . . . . . . . . . . . . . . . . . . . . . . . . . . . . . . 1514. Diagram of Colony Mine face showing blasting pattern for blast 6. . . . . . . . . . . . . . . . . . . . . . . . . . . . . . . . . . . . . . . . . 1515. Mine face before blast 6. . . . . . . . . . . . . . . . . . . . . . . . . . . . . . . . . . . . . . . . . . . . . . . . . . . . . . . . . . . . . . . . . . . . . . . 1616. Mine face after blast 6, showing rubblization. . . . . . . . . . . . . . . . . . . . . . . . . . . . . . . . . . . . . . . . . . . . . . . . . . . . . . . . . 1617. Pittsburgh Research Center researchers with large boulders in the rubble pile. . . . . . . . . . . . . . . . . . . . . . . . . . . . . . . . . . 1718. Summary of floor dust loadings (minus 20-mesh fraction) after five blasts. . . . . . . . . . . . . . . . . . . . . . . . . . . . . . . . . . . . 1719. Pressure generated by blast 3. . . . . . . . . . . . . . . . . . . . . . . . . . . . . . . . . . . . . . . . . . . . . . . . . . . . . . . . . . . . . . . . . . . . 1820. Frames from high-speed movie during blast 6. . . . . . . . . . . . . . . . . . . . . . . . . . . . . . . . . . . . . . . . . . . . . . . . . . . . . . . . 1921. Isometric view of White River Shale Project mine. . . . . . . . . . . . . . . . . . . . . . . . . . . . . . . . . . . . . . . . . . . . . . . . . . . . . 2122. Gas monitoring trailer near air shaft at White River Mine. . . . . . . . . . . . . . . . . . . . . . . . . . . . . . . . . . . . . . . . . . . . . . . . 2223. Flow diagram of gas sampling system. . . . . . . . . . . . . . . . . . . . . . . . . . . . . . . . . . . . . . . . . . . . . . . . . . . . . . . . . . . . . . 2224. Typical methane released during blasting at White River Mine as measured underground in the east heading. . . . . . . . . . . 2325. Methane released from core sections taken near the White River shaft. . . . . . . . . . . . . . . . . . . . . . . . . . . . . . . . . . . . . . . 2426. Plan view of the face area in the main entry of the Bruceton Experimental Mine used for gas and predispersed
dust tests. . . . . . . . . . . . . . . . . . . . . . . . . . . . . . . . . . . . . . . . . . . . . . . . . . . . . . . . . . . . . . . . . . . . . . . . . . . . . . . . . 2627. Static pressure traces for typical mine dust explosions in the Bruceton Experimental Mine using oil shale. . . . . . . . . . . . . 2628. Floor dust loadings (minus 20-mesh fraction) of unstemmed and stemmed ANFO face blasts compared with
pre-1988 unstemmed ANFO blast data. . . . . . . . . . . . . . . . . . . . . . . . . . . . . . . . . . . . . . . . . . . . . . . . . . . . . . . . . . . . 3029. Flame exiting from cannon after detonation of blasting agent. . . . . . . . . . . . . . . . . . . . . . . . . . . . . . . . . . . . . . . . . . . . . 3230. Coal dust ignited by unstemmed ANFO at the Lake Lynn cannon gallery showing flame exiting from both ends. . . . . . . . 3331. Map of Long Ridge Mine showing instrumentation locations for full-face blast in heading 6. . . . . . . . . . . . . . . . . . . . . . . 3732. Diagram of Long Ridge Mine face showing blasting pattern in heading 5 for 1990 tests. . . . . . . . . . . . . . . . . . . . . . . . . . 3733. Explosives being loaded into borehole at Long Ridge Mine. . . . . . . . . . . . . . . . . . . . . . . . . . . . . . . . . . . . . . . . . . . . . . 3734. Map of Logan Wash Mine showing instrumentation locations for 1990 tests. . . . . . . . . . . . . . . . . . . . . . . . . . . . . . . . . . 3835. Diagram showing drill pattern used during Logan Wash face blasts. . . . . . . . . . . . . . . . . . . . . . . . . . . . . . . . . . . . . . . . . 3936. Explosibility data for 1983 pyritic and sulfide ore dusts from the 20-L chamber. . . . . . . . . . . . . . . . . . . . . . . . . . . . . . . . 4237. Explosibility data for 1985 and 1987 sulfide ore dusts from the 20-L chamber. . . . . . . . . . . . . . . . . . . . . . . . . . . . . . . . . 4238. Explosibility data for 1989 pyritic and sulfide ore dusts from the 20-L chamber. . . . . . . . . . . . . . . . . . . . . . . . . . . . . . . . 4339. Explosibility data from the 20-L chamber for a mixture of 80-pct sulfide ore and 20-pct rock dust compared
with data for sulfide ore. . . . . . . . . . . . . . . . . . . . . . . . . . . . . . . . . . . . . . . . . . . . . . . . . . . . . . . . . . . . . . . . . . . . . . 45
TABLES
1. Properties of the oil shale and comparison dusts. . . . . . . . . . . . . . . . . . . . . . . . . . . . . . . . . . . . . . . . . . . . . . . . . . . . . . 82. Laboratory explosibility data for oil shales and comparison dusts. . . . . . . . . . . . . . . . . . . . . . . . . . . . . . . . . . . . . . . . . . 103. Full-face blasts during oil shale mine field tests. . . . . . . . . . . . . . . . . . . . . . . . . . . . . . . . . . . . . . . . . . . . . . . . . . . . . . . 114. Methane liberated during blasting at White River. . . . . . . . . . . . . . . . . . . . . . . . . . . . . . . . . . . . . . . . . . . . . . . . . . . . . . 235. Minimum charge weights required for ignition in the Bruceton Experimental Mine. . . . . . . . . . . . . . . . . . . . . . . . . . . . . 276. Effectiveness of various stemming materials in suppressing ignitions when detonating explosives into a
flammable gas zone. . . . . . . . . . . . . . . . . . . . . . . . . . . . . . . . . . . . . . . . . . . . . . . . . . . . . . . . . . . . . . . . . . . . . . . . . 277. Ideal detonation properties of emulsion and other explosives. . . . . . . . . . . . . . . . . . . . . . . . . . . . . . . . . . . . . . . . . . . . . 308. Ideal detonation properties of various ANFO formulations. . . . . . . . . . . . . . . . . . . . . . . . . . . . . . . . . . . . . . . . . . . . . . . 319. Crawshaw-Jones data for various explosive products. . . . . . . . . . . . . . . . . . . . . . . . . . . . . . . . . . . . . . . . . . . . . . . . . . . 31
10. Gelled water inert stemming weights to prevent methane-air ignitions in the Lake Lynn cannon gallery. . . . . . . . . . . . . . . 3411. Relative incendivity of unstemmed explosives in a flammable coal dust cloud at the Lake Lynn cannon gallery. . . . . . . . . 3512. Chemical and size data for sulfide ores. . . . . . . . . . . . . . . . . . . . . . . . . . . . . . . . . . . . . . . . . . . . . . . . . . . . . . . . . . . . . 4113. Laboratory explosibility data for sulfide ores and comparison dusts. . . . . . . . . . . . . . . . . . . . . . . . . . . . . . . . . . . . . . . . . 4414. Predispersed sulfide ore dust tests in the Bruceton Experimental Mine. . . . . . . . . . . . . . . . . . . . . . . . . . . . . . . . . . . . . . . 45

iii
UNIT OF MEASURE ABBREVIATIONS USED IN THIS REPORT
bar/s bar per second L/t liter per ton (metric)
cal/g calorie per gram m meter
cm centimeter m/s meter per second
fr/s frame per second m square meter2
ft foot m cubic meter3
g gram m /min cubic meter per minute3
g/cm gram per cubic centimeter m /t cubic meter per ton (metric)3 3
g/m gram per cubic meter mbar millibar3
gal/st gallon per short ton min minute
gr/ft grain per foot mm millimeter
h hour mol/kg mole per kilogram
J joule ms millisecond
K kelvin pct percent
kbar kilobar s second
kg kilogram t ton (metric)
kg/m kilogram per cubic meter t/d ton (metric) per day3
kJ kilojoule vol pct volume percent
km kilometer wt pct weight percent
km square kilometer µm micrometer2
L liter EC degree Celsius
Mention of any company name or product does not constitute endorsement by the U.S. Department of Energy Pittsburgh ResearchCenter.
Visit our Mining Health and Safety Research site on the Internet, accessible via http://www.usbm.gov.
SECONDARY EXPLOSION HAZARDS DURING BLASTINGIN OIL SHALE AND SULFIDE ORE MINES
By Eric S. Weiss, Kenneth L. Cashdollar, Michael J. Sapko, and Eugene M. Bazala1 2 3 4
ABSTRACT
The data presented in this report are the results, to date, of an ongoing Pittsburgh Research Center Disaster5
Prevention research program on the explosion hazards associated with blasting operations in noncoal mines.Laboratory and experimental mine tests have shown that oil shale and sulfide ore dusts can be ignited given theproper predispersed dust concentrations, particle size, and kerogen or sulfur content. Methane (CH ) gas may also4
be present in deep oil shale formations and can pose a significant added hazard to underground blasting operations.The most common explosive used for blasting in oil shale had been ANFO, a combination of ammonium nitrateand fuel oil; blasting in sulfide ore had used ANFO and/or dynamites.
Tests conducted at the cannon gallery at Lake Lynn Laboratory near Fairchance, Fayette County, PA, provideda means of evaluating the relative incendivity characteristics of new and existing explosive products. Threeexplosives—a pumpable emulsion-ANFO blend, a packaged water gel, and an emulsion blasting agent—exhibitedlow-incendive qualities compared with other more highly incendive products such as ANFO and some dynamites.Based on the data collected during numerous full-scale blasts in oil shale and sulfide ore mines, the low-incendiveproducts significantly reduced or eliminated the ignition hazards while at the same time providing effectivefragmentation of the rock.
Based on the positive results from the gallery and field testing, low-incendive explosives, coupled with goodblasting procedures, show promise in reducing dust and/or gas ignitions associated with blasting operations in oilshale and sulfide ore mining applications.
Mining engineer.1
Supervisory research physicist.2
Research supervisor.3
Physical science technician.4
Pittsburgh Research Center, U.S. Department of Energy, Pittsburgh, PA.This work originated under the U.S. Bureau of Mines prior to transferring to the U.S. Department of Energy on April 4, 1996.5
2
INTRODUCTION
OIL SHALE MINING Historical Development of Oil Shale
Alternative fuel sources have been viewed over the past several Worldwide, oil shale formations are found on nearly everydecades as possible replacements for, or additions to, the crude continent. The U.S. Geological Survey (6, pp. 85-98) estimatedU.S. petroleum supply. The development of alternative fuels that over 4×10 t of oil shale exists in worldwide deposits havingcould also benefit our national security by reducing the reliance on a potential shale oil yield of approximately 3×10 L. Among theforeign oil. This lack of energy self-reliance was demonstrated fossil fuels, oil shale reserves are second only to coal reserves inquite effectively during the 1973 oil embargo by the oil exporting terms of heating value or energy. The larger deposits are locatednations. During this period, a resurgence in the U.S. oil shale in Asia, Africa, North America, South America, Europe, Australia,industry occurred. The embargo catalyzed the United States to and New Zealand. The Green River formation in Colorado,seriously consider developing an industry to derive oil from shaleWyoming, and Utah is the largest concentration of high-grade oilrock. shale in the world.
Oil shale must be heated to convert the solid hydrocarbon The shale oil industry has experienced many high (boom) and(kerogen) in the rock to crude shale oil. The retorting technology low (bust) cycles over the years. As early as the 14th century, oilcan be accomplished either in situ or at a surface facility. The in shales of Austria and Switzerland were heated to produce a rocksitu retorting process (1-2) is conducted within the shale oil, which was then refined to an ointment (6, p. 108). In the6
formation. For aboveground retorting (3) operations, the shale United States, Native Americans and early pioneers used pieces ofrock is removed from the ground and transported to the surface oil shale in their campfires (7). Many oil shale processing plantsfacility. Both methods require extensive underground facilities (6, p. 108) existed in the Atlantic States before Drake's first oilwhich are generally developed through blasting operations. Many well in Pennsylvania in 1859. These plants converted easternpotential hazards are encountered when conducting large-scaleU.S. oil shale into fuel oils. In 1874, transcontinental rail workersunderground mining and blasting activities, not the least of which also discovered and used the western U.S. oil shale from the Greenare the explosives used for these blasting operations. Due to the River formation in Wyoming in their campfires (6, p. 108). Thehigh volume of material that is required to be extracted in these discovery by Drake and others of crude petroleum in the Unitedlarge mine entries, blasting agents are generally utilized instead of States in the late 1800's and subsequent discoveries of abundantthe more expensive cap-sensitive explosive products. A blastingquantities of inexpensive oil in the Texas and Arabian oilfieldsagent is defined as any material or mixture consisting of fuel and were the primary reasons for the bust in the oil shale industry inoxidizer intended for blasting, which as mixed for use or shipment the United States and why it had not developed commercially, ascannot be detonated by means of a No. 8 test blasting detonator was the case in many foreign countries. The People's Republic of(0.40 to 0.45 g pentaerythritol tetranitrate (PETN) base charge) China, for example, has large deposits of oil shale and has beenwhen unconfined. An explosive material is considered to be cap-producing shale oil for over 60 years (8). Much of China's oilsensitive if it detonates with a No. 8 test detonator. Much of the shale overlies thick seams of coal. Because the coal and oil shaleknowledge gained in studying the explosion hazards in oil shale are mined together, production costs for shale oil in China are lowmining can be directly applied to other noncoal mining (8-9). Pulverized oil shale is also mixed with coal and burnedoperations, such as sulfide ore mining. directly for power generation in China. In Estonia, most of the oil
The Pittsburgh Research Center, as part of its Disaster shale is burned under boilers and contributes significantly toPrevention research program to improve safety for underground Estonia's electrical power needs (6, p. 108).mine workers, initiated numerous research programs (4-5) from In the United States during World War II, when concerns werethe 1970's through the early 1990's under the former U.S. Bureau raised regarding the reliability of imported fuel supplies, the U.S.of Mines (USBM) to define the fire and explosion hazards Congress enacted the Synthetic Liquid Fuels Act of 1944, whichinherent in the mining of oil shale. In addition, the Mine Safety authorized the USBM to develop domestic oil shale. The USBMand Health Administration (MSHA) had reservations about the established a facility at the Anvil Points Mine located in the Roanapplicability of existing metal/nonmetal mine safety regulations to Cliffs west of Rifle, CO (10-11). Many technological advances inoil shale mining. MSHA, therefore, requested that the USBM the mining and processing of oil shale were developed at this siteconduct additional research to evaluate the adequacy of these (10-14). To further promote private development of oil shale, theregulations. This report focuses only on the hazards associated Federal Prototype Oil Shale Leasing Program was enacted by thewith the extraction of the oil shale through underground mining U . S .operations and summarizes oil shale research conducted by theP i t t s b u r g h R e s e a r c h C e n t e r
Italic numbers in parentheses refer to items in the list of references preceding the6
appendix.
since the previous reports (4-5). Some of the data presented herehave been published previously in various forums and are cited inthe text.
15
17
3
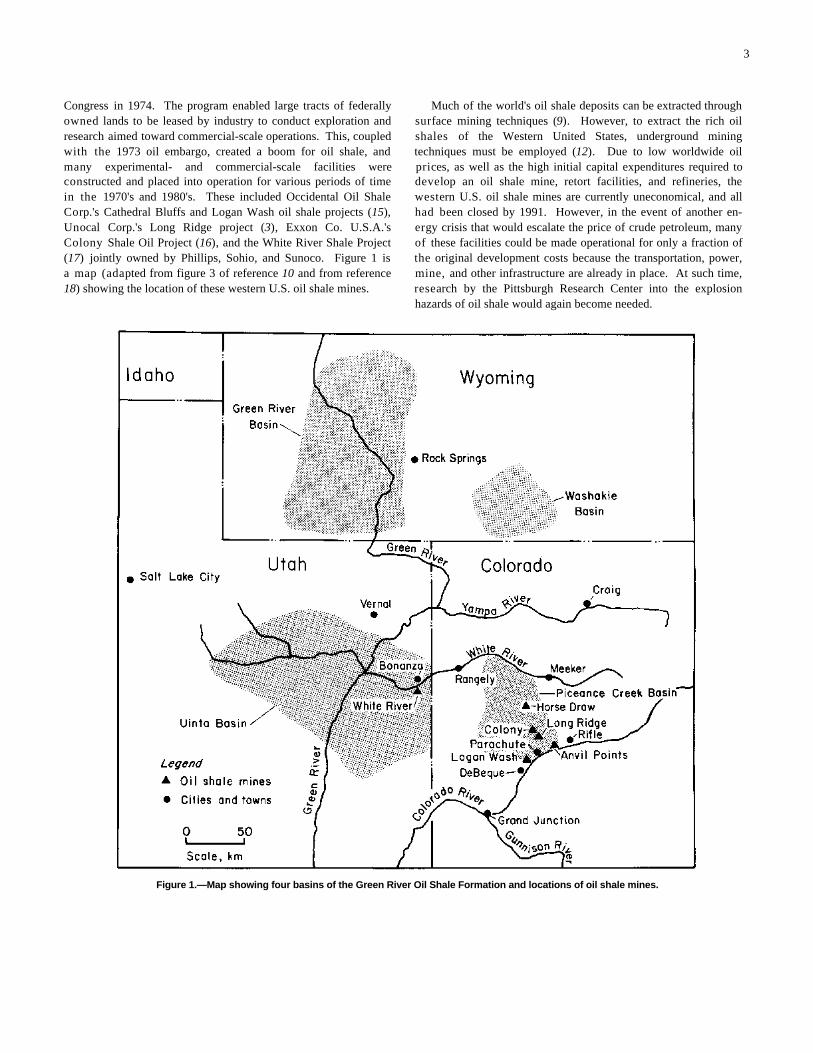
Figure 1.—Map showing four basins of the Green River Oil Shale Formation and locations of oil shale mines.
Congress in 1974. The program enabled large tracts of federally Much of the world's oil shale deposits can be extracted throughowned lands to be leased by industry to conduct exploration and surface mining techniques (9). However, to extract the rich oilresearch aimed toward commercial-scale operations. This, coupled shales of the Western United States, underground miningwith the 1973 oil embargo, created a boom for oil shale, and techniques must be employed (12). Due to low worldwide oilmany experimental- and commercial-scale facilities were prices, as well as the high initial capital expenditures required toconstructed and placed into operation for various periods of timedevelop an oil shale mine, retort facilities, and refineries, thein the 1970's and 1980's. These included Occidental Oil Shale western U.S. oil shale mines are currently uneconomical, and allCorp.'s Cathedral Bluffs and Logan Wash oil shale projects (15), had been closed by 1991. However, in the event of another en-Unocal Corp.'s Long Ridge project (3), Exxon Co. U.S.A.'s ergy crisis that would escalate the price of crude petroleum, manyColony Shale Oil Project (16), and the White River Shale Project of these facilities could be made operational for only a fraction of(17) jointly owned by Phillips, Sohio, and Sunoco. Figure 1 is the original development costs because the transportation, power,a map (adapted from figure 3 of reference 10 and from reference mine, and other infrastructure are already in place. At such time,18) showing the location of these western U.S. oil shale mines. research by the Pittsburgh Research Center into the explosion
hazards of oil shale would again become needed.

4
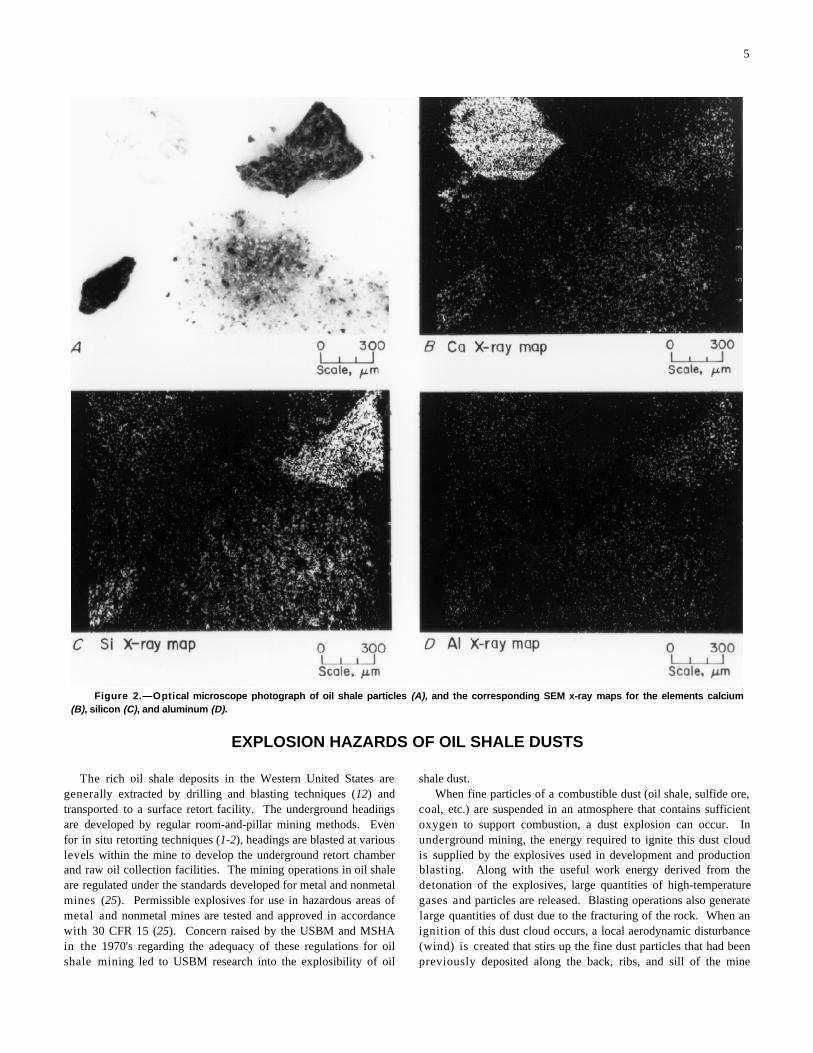
Properties of Oil Shale the x rays from a particular element to form an image showing the
To better understand the fire and explosion hazards of oil shale, figure 2A. A comparison of the three x-ray images correspondingthe physical and chemical nature of oil shale must first be to the 600-µm transparent particle shows that the particle containsexamined. Note that the research was conducted with oil shales a large amount of Ca and only trace amounts of Si and Al.from the Green River formation (19-21), and discussions in the Therefore, that particle is most likely calcitic in composition. In theremainder of this report are limited to only that formation. Theupper right quadrant of figure 2A is an opaque dark particle. ThisGreen River formation covers about 88,000 km in Colorado, particle is clearly much more heterogeneous in structure than the2
Utah, and Wyoming (figure 1). This formation is divided into four calcitic particle. Some areas of the particle appear quite dark andmajor basins: the Piceance Creek Basin in Colorado, the Uintaare probably high in kerogen content; lighter areas are probablyBasin in Utah, and the Green River and Washakie Basins in mineral matter. The corresponding x-ray maps show a largeWyoming. These oil shale formations were deposited in the amount of Si and lesser amounts of Ca and Al for this particle.Tertiary period on the bottom of the ancient Lake Uinta. ContraryTherefore, the mineral matter in this particle is probably mainlyto its name, oil shale is not a shale rock and does not directly quartz. The dark particle in the lower left quadrant of figure 2A iscontain oil. Oil shale actually is a lake-deposited sediment that even higher in kerogen content, with only a small amount of Sicontains organic matter (6, pp. 85-98). As the mineral silts and mineral matter as shown by the x-ray maps. The lower rightorganic matter were deposited simultaneously, heat and pressure quadrant of figure 2A contains a large number of very smallformed the deposits into a stable mix of minerals and solid organicparticles from the minus 400-mesh sieved fraction. Probably eachmatter. These oil shales are a marlstone consisting mainly of of these small, individual mineral particles is fairly homogeneousdolomite, quartz, and calcite. The solid organic material is known in structure, with most of them high in mineral content as shownas kerogen. by the x-ray maps.
The kerogen is comprised of hydrogen and carbon moleculesthat are tied to oxygen and sulfur atoms. The kerogen is bound SULFIDE ORE MININGwithin the mineral matrix of the oil shale rock. When the oil shaleis heated (pyrolyzed) above 200 EC, vaporized shale oil and other Sulfide mines provide several metallic ores, particularly of thegaseous products are formed from the kerogen. These oil vaporsnonferrous metals such as lead (Pb), zinc (Zn), and copper (Cu).are condensed and further processed to obtain the final fuel That is why the sulfide ore mines are also called base metal mines.product. The amounts of oil and gas that can be derived from the Some of the minerals that compose sulfide ores are pyrite (FeS ),oil shale can be estimated by the standard Fischer assay (22-23). pyrrhotite (~FeS), galena (PbS), sphalerite (ZnS), and chalcopyriteThe standard notation for oil yield or assay by this method is (CuFeS ). Although there is iron in the sulfide ores, it is usuallygallons of oil per short ton of shale. not recovered. In addition to the base metals, some sulfide ore7
The kerogen and minerals within the oil shale rock are shown mines produce small amounts of precious metals, such as silverin figure 2A, which is an optical microscope photograph of (Ag) and gold (Au). As in the oil shale mines, developmentalparticles from pulverized oil shale. Three large individual particles headings and production stopes are mined by blasting.and a group of minus 400-mesh fine particles are shown in figure This report summarizes research conducted by the Pittsburgh2A. The structural heterogeneity of oil shale is clearly illustrated by Research Center during the 1980's and early 1990's on sulfide orethe optical photomicrograph and the three accompanying scanningexplosibility and the investigation of less incendive blasting agentselectron microscope (SEM) x-ray maps (24) for the elements for mining.calcium (Ca), silicon (Si), and aluminum (Al). In the upper leftportion of figure 2A is a 600-µm particle that is opticallytransparent. The three corresponding SEM x-ray maps (figures 2B,C, and D) were made by collecting only
To convert from gallons per short ton to liters per metric ton, multiply by 4.17.7
distribution of that element over the same field of view as in
2
2
8
Some of the data were presented in an unpublished report entitled “Hazards of8
Secondary Dust Explosions in Sulfide Ore Mining” by E. S. Weiss, K. L. Cashdollar, and M.J. Sapko (Pittsburgh Research Center Internal Report No. 4646, Jan. 1987).
5
Figure 2.—Optical microscope photograph of oil shale particles (A), and the corresponding SEM x-ray maps for the elements calcium(B), silicon (C), and aluminum (D).
EXPLOSION HAZARDS OF OIL SHALE DUSTS
The rich oil shale deposits in the Western United States are shale dust.generally extracted by drilling and blasting techniques (12) and When fine particles of a combustible dust (oil shale, sulfide ore,transported to a surface retort facility. The underground headings coal, etc.) are suspended in an atmosphere that contains sufficientare developed by regular room-and-pillar mining methods. Evenoxygen to support combustion, a dust explosion can occur. Infor in situ retorting techniques (1-2), headings are blasted at various underground mining, the energy required to ignite this dust cloudlevels within the mine to develop the underground retort chamber is supplied by the explosives used in development and productionand raw oil collection facilities. The mining operations in oil shale blasting. Along with the useful work energy derived from theare regulated under the standards developed for metal and nonmetal detonation of the explosives, large quantities of high-temperaturemines (25). Permissible explosives for use in hazardous areas of gases and particles are released. Blasting operations also generatemetal and nonmetal mines are tested and approved in accordance large quantities of dust due to the fracturing of the rock. When anwith 30 CFR 15 (25). Concern raised by the USBM and MSHA ignition of this dust cloud occurs, a local aerodynamic disturbancein the 1970's regarding the adequacy of these regulations for oil (wind) is created that stirs up the fine dust particles that had beenshale mining led to USBM research into the explosibility of oil previously deposited along the back, ribs, and sill of the mine
6
Figure 3.—Plan view of the Bruceton Experimental Mine.
workings. The flame front from the initial localized dust explosion minus 20-mesh (<850 µm) and 57 to 85 pct minus 200-meshthen develops into a secondary explosion, consuming this new dust (<75 µm). For the coarse dusts, 90 pct of the dust was minuscloud and propagating through the mine heading. 20-mesh and 27 pct minus 200-mesh. Data from the BEM tests
LARGE-SCALE EXPERIMENTAL MINE DATA shale dusts that assayed less than ~85 L/t (~20 gal/st). This is to
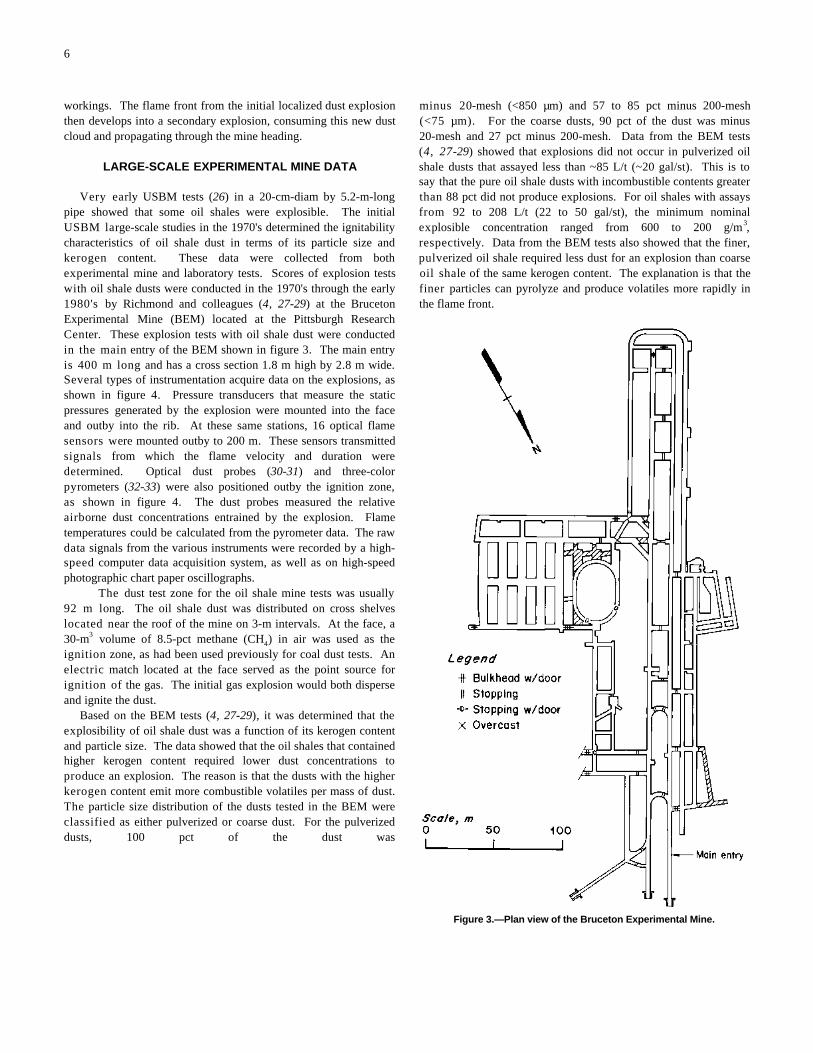
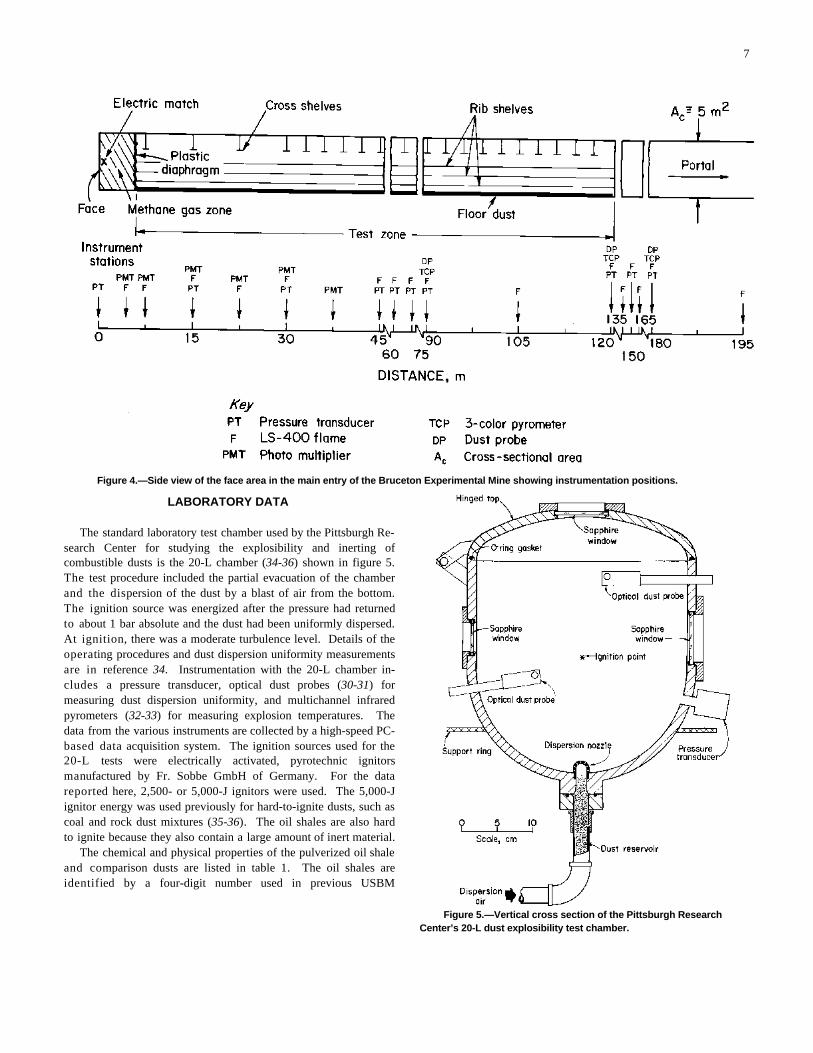
Very early USBM tests (26) in a 20-cm-diam by 5.2-m-long than 88 pct did not produce explosions. For oil shales with assayspipe showed that some oil shales were explosible. The initialfrom 92 to 208 L/t (22 to 50 gal/st), the minimum nominalUSBM large-scale studies in the 1970's determined the ignitability explosible concentration ranged from 600 to 200 g/m ,characteristics of oil shale dust in terms of its particle size and respectively. Data from the BEM tests also showed that the finer,kerogen content. These data were collected from both pulverized oil shale required less dust for an explosion than coarseexperimental mine and laboratory tests. Scores of explosion tests oil shale of the same kerogen content. The explanation is that thewith oil shale dusts were conducted in the 1970's through the early finer particles can pyrolyze and produce volatiles more rapidly in1980's by Richmond and colleagues (4, 27-29) at the Bruceton the flame front.Experimental Mine (BEM) located at the Pittsburgh ResearchCenter. These explosion tests with oil shale dust were conductedin the main entry of the BEM shown in figure 3. The main entryis 400 m long and has a cross section 1.8 m high by 2.8 m wide.Several types of instrumentation acquire data on the explosions, asshown in figure 4. Pressure transducers that measure the staticpressures generated by the explosion were mounted into the faceand outby into the rib. At these same stations, 16 optical flamesensors were mounted outby to 200 m. These sensors transmittedsignals from which the flame velocity and duration weredetermined. Optical dust probes (30-31) and three-colorpyrometers (32-33) were also positioned outby the ignition zone,as shown in figure 4. The dust probes measured the relativeairborne dust concentrations entrained by the explosion. Flametemperatures could be calculated from the pyrometer data. The rawdata signals from the various instruments were recorded by a high-speed computer data acquisition system, as well as on high-speedphotographic chart paper oscillographs.
The dust test zone for the oil shale mine tests was usually92 m long. The oil shale dust was distributed on cross shelveslocated near the roof of the mine on 3-m intervals. At the face, a30-m volume of 8.5-pct methane (CH ) in air was used as the3
4
ignition zone, as had been used previously for coal dust tests. Anelectric match located at the face served as the point source forignition of the gas. The initial gas explosion would both disperseand ignite the dust.
Based on the BEM tests (4, 27-29), it was determined that theexplosibility of oil shale dust was a function of its kerogen contentand particle size. The data showed that the oil shales that containedhigher kerogen content required lower dust concentrations toproduce an explosion. The reason is that the dusts with the higherkerogen content emit more combustible volatiles per mass of dust.The particle size distribution of the dusts tested in the BEM wereclassified as either pulverized or coarse dust. For the pulverizeddusts, 100 pct of the dust was
(4, 27-29) showed that explosions did not occur in pulverized oil
say that the pure oil shale dusts with incombustible contents greater
3
7
Figure 4.—Side view of the face area in the main entry of the Bruceton Experimental Mine showing instrumentation positions.
Figure 5.—Vertical cross section of the Pittsburgh ResearchCenter’s 20-L dust explosibility test chamber.
LABORATORY DATA
The standard laboratory test chamber used by the Pittsburgh Re-search Center for studying the explosibility and inerting ofcombustible dusts is the 20-L chamber (34-36) shown in figure 5.The test procedure included the partial evacuation of the chamberand the dispersion of the dust by a blast of air from the bottom.The ignition source was energized after the pressure had returnedto about 1 bar absolute and the dust had been uniformly dispersed.At ignition, there was a moderate turbulence level. Details of theoperating procedures and dust dispersion uniformity measurementsare in reference 34. Instrumentation with the 20-L chamber in-cludes a pressure transducer, optical dust probes (30-31) formeasuring dust dispersion uniformity, and multichannel infraredpyrometers (32-33) for measuring explosion temperatures. Thedata from the various instruments are collected by a high-speed PC-based data acquisition system. The ignition sources used for the20-L tests were electrically activated, pyrotechnic ignitorsmanufactured by Fr. Sobbe GmbH of Germany. For the datareported here, 2,500- or 5,000-J ignitors were used. The 5,000-Jignitor energy was used previously for hard-to-ignite dusts, such ascoal and rock dust mixtures (35-36). The oil shales are also hardto ignite because they also contain a large amount of inert material.
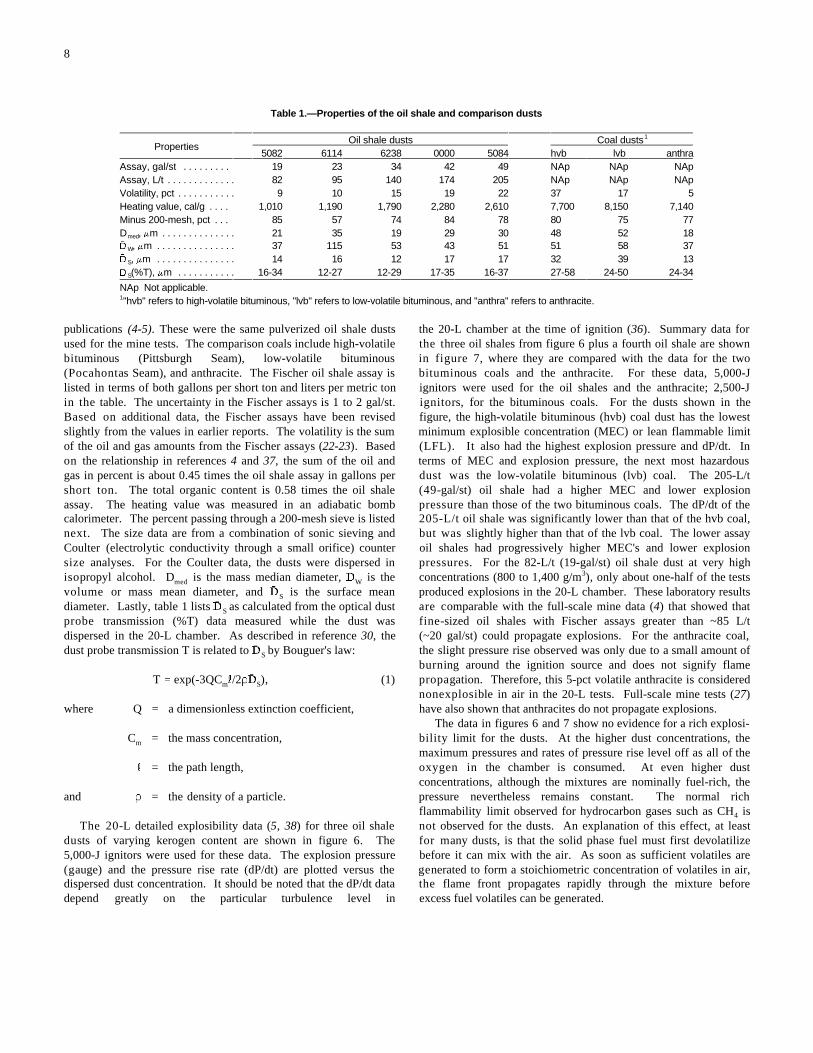
The chemical and physical properties of the pulverized oil shaleand comparison dusts are listed in table 1. The oil shales areidentified by a four-digit number used in previous USBM
8
Table 1.—Properties of the oil shale and comparison dusts
PropertiesOil shale dusts Coal dusts1
5082 6114 6238 0000 5084 hvb lvb anthraAssay, gal/st . . . . . . . . . 19 23 34 42 49 NAp NAp NApAssay, L/t . . . . . . . . . . . . . 82 95 140 174 205 NAp NAp NApVolatility, pct . . . . . . . . . . . 9 10 15 19 22 37 17 5Heating value, cal/g . . . . 1,010 1,190 1,790 2,280 2,610 7,700 8,150 7,140Minus 200-mesh, pct . . . 85 57 74 84 78 80 75 77D , Fm . . . . . . . . . . . . . .med 21 35 19 29 30 48 52 18ö , Fm . . . . . . . . . . . . . . .W 37 115 53 43 51 51 58 37ö , Fm . . . . . . . . . . . . . . .S 14 16 12 17 17 32 39 13ö (%T), Fm . . . . . . . . . . .S 16-34 12-27 12-29 17-35 16-37 27-58 24-50 24-34
NAp Not applicable."hvb" refers to high-volatile bituminous, "lvb" refers to low-volatile bituminous, and "anthra" refers to anthracite.1
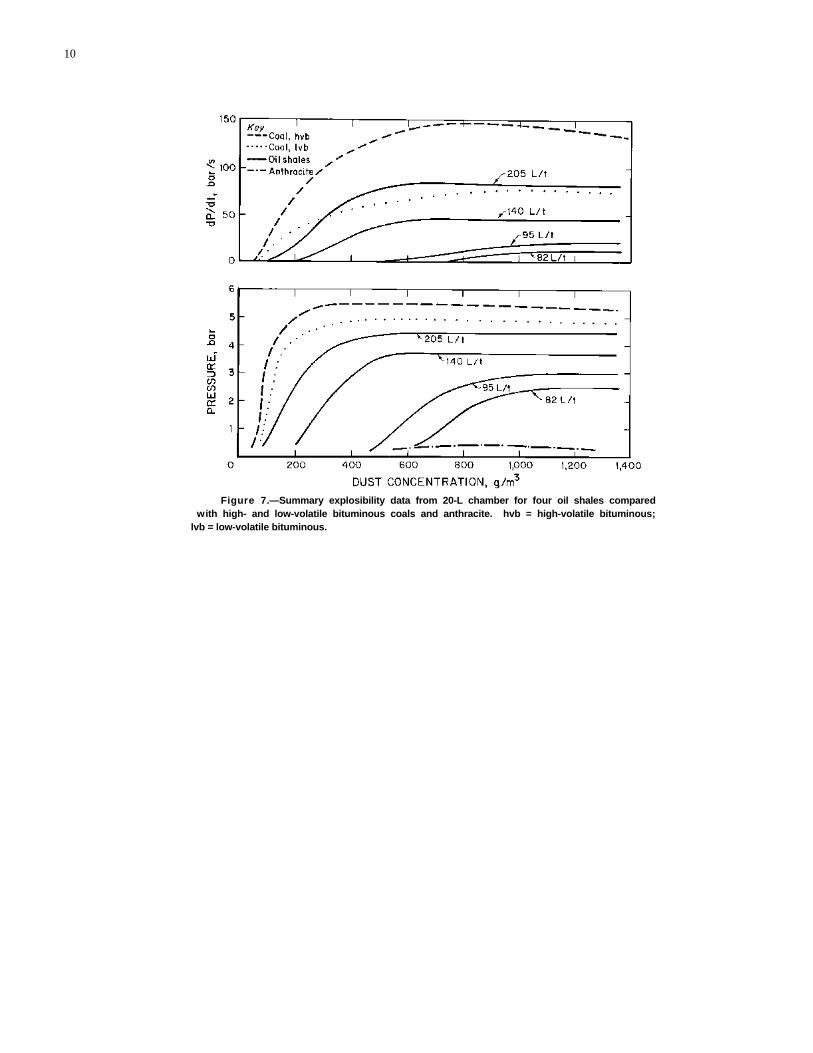
publications (4-5). These were the same pulverized oil shale dusts the 20-L chamber at the time of ignition (36). Summary data forused for the mine tests. The comparison coals include high-volatile the three oil shales from figure 6 plus a fourth oil shale are shownbituminous (Pittsburgh Seam), low-volatile bituminous in figure 7, where they are compared with the data for the two(Pocahontas Seam), and anthracite. The Fischer oil shale assay is bituminous coals and the anthracite. For these data, 5,000-Jlisted in terms of both gallons per short ton and liters per metric ton ignitors were used for the oil shales and the anthracite; 2,500-Jin the table. The uncertainty in the Fischer assays is 1 to 2 gal/st. ignitors, for the bituminous coals. For the dusts shown in theBased on additional data, the Fischer assays have been revised figure, the high-volatile bituminous (hvb) coal dust has the lowestslightly from the values in earlier reports. The volatility is the sum minimum explosible concentration (MEC) or lean flammable limitof the oil and gas amounts from the Fischer assays (22-23). Based (LFL). It also had the highest explosion pressure and dP/dt. Inon the relationship in references 4 and 37, the sum of the oil and terms of MEC and explosion pressure, the next most hazardousgas in percent is about 0.45 times the oil shale assay in gallons per dust was the low-volatile bituminous (lvb) coal. The 205-L/tshort ton. The total organic content is 0.58 times the oil shale (49-gal/st) oil shale had a higher MEC and lower explosionassay. The heating value was measured in an adiabatic bombpressure than those of the two bituminous coals. The dP/dt of thecalorimeter. The percent passing through a 200-mesh sieve is listed205-L/t oil shale was significantly lower than that of the hvb coal,next. The size data are from a combination of sonic sieving and but was slightly higher than that of the lvb coal. The lower assayCoulter (electrolytic conductivity through a small orifice) counter oil shales had progressively higher MEC's and lower explosionsize analyses. For the Coulter data, the dusts were dispersed inpressures. For the 82-L/t (19-gal/st) oil shale dust at very highisopropyl alcohol. D is the mass median diameter, ö is the concentrations (800 to 1,400 g/m ), only about one-half of the testsmed W
volume or mass mean diameter, and ö is the surface mean produced explosions in the 20-L chamber. These laboratory resultsS
diameter. Lastly, table 1 lists ö as calculated from the optical dust are comparable with the full-scale mine data (4) that showed thatS
probe transmission (%T) data measured while the dust was fine-sized oil shales with Fischer assays greater than ~85 L/tdispersed in the 20-L chamber. As described in reference 30, the (~20 gal/st) could propagate explosions. For the anthracite coal,dust probe transmission T is related to ö by Bouguer's law: the slight pressure rise observed was only due to a small amount ofS
T ' exp(-3QC R/2Dö ), (1) propagation. Therefore, this 5-pct volatile anthracite is consideredm S
where Q = a dimensionless extinction coefficient, have also shown that anthracites do not propagate explosions.
C = the mass concentration, bility limit for the dusts. At the higher dust concentrations, them
R = the path length, oxygen in the chamber is consumed. At even higher dust
and D = the density of a particle. pressure nevertheless remains constant. The normal rich
The 20-L detailed explosibility data (5, 38) for three oil shale not observed for the dusts. An explanation of this effect, at leastdusts of varying kerogen content are shown in figure 6. Thefor many dusts, is that the solid phase fuel must first devolatilize5,000-J ignitors were used for these data. The explosion pressure before it can mix with the air. As soon as sufficient volatiles are(gauge) and the pressure rise rate (dP/dt) are plotted versus the generated to form a stoichiometric concentration of volatiles in air,dispersed dust concentration. It should be noted that the dP/dt data the flame front propagates rapidly through the mixture beforedepend greatly on the particular turbulence level in excess fuel volatiles can be generated.
3
burning around the ignition source and does not signify flame
nonexplosible in air in the 20-L tests. Full-scale mine tests (27)
The data in figures 6 and 7 show no evidence for a rich explosi-
maximum pressures and rates of pressure rise level off as all of the
concentrations, although the mixtures are nominally fuel-rich, the
flammability limit observed for hydrocarbon gases such as CH is4

9
Figure 6.—Explosibility data from 20-L chamber for three oil shales.
10
Figure 7.—Summary explosibility data from 20-L chamber for four oil shales compared with high- and low-volatile bituminous coals and anthracite. hvb = high-volatile bituminous;lvb = low-volatile bituminous.
11
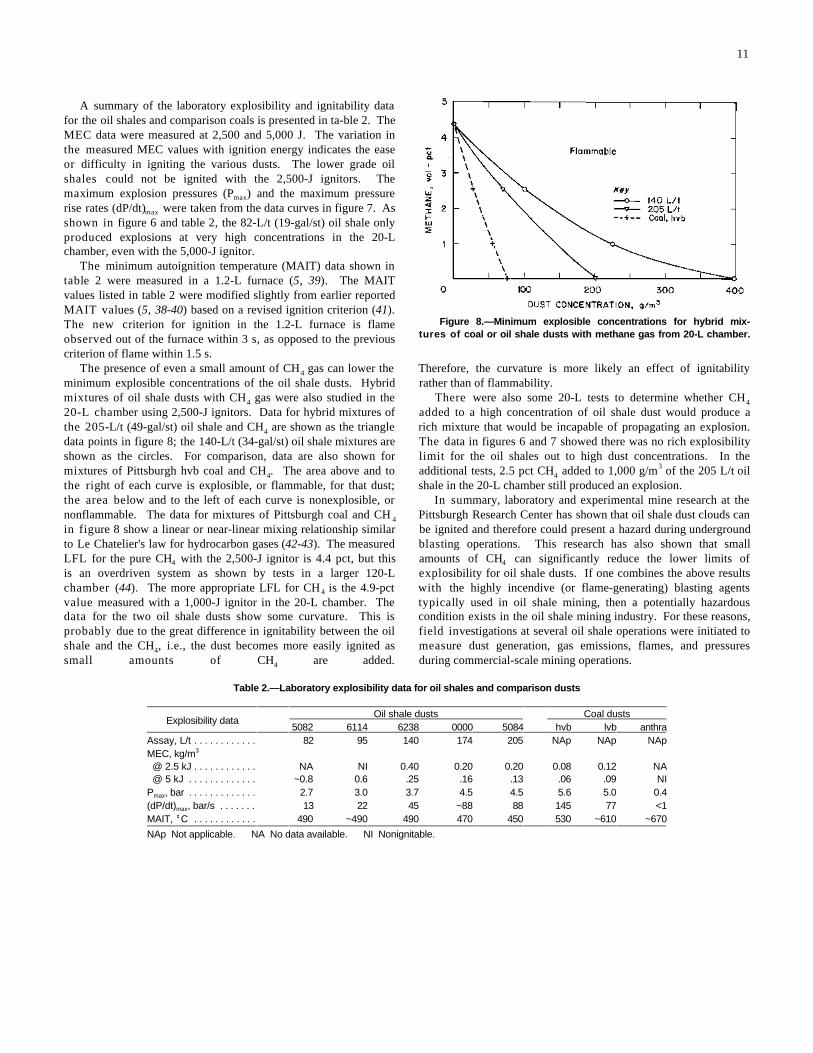
Figure 8.—Minimum explosible concentrations for hybrid mix-tures of coal or oil shale dusts with methane gas from 20-L chamber.
A summary of the laboratory explosibility and ignitability datafor the oil shales and comparison coals is presented in ta-ble 2. TheMEC data were measured at 2,500 and 5,000 J. The variation inthe measured MEC values with ignition energy indicates the easeor difficulty in igniting the various dusts. The lower grade oilshales could not be ignited with the 2,500-J ignitors. Themaximum explosion pressures (P ) and the maximum pressuremax
rise rates (dP/dt) were taken from the data curves in figure 7. Asmax
shown in figure 6 and table 2, the 82-L/t (19-gal/st) oil shale onlyproduced explosions at very high concentrations in the 20-Lchamber, even with the 5,000-J ignitor.
The minimum autoignition temperature (MAIT) data shown intable 2 were measured in a 1.2-L furnace (5, 39). The MAITvalues listed in table 2 were modified slightly from earlier reportedMAIT values (5, 38-40) based on a revised ignition criterion (41).The new criterion for ignition in the 1.2-L furnace is flameobserved out of the furnace within 3 s, as opposed to the previouscriterion of flame within 1.5 s.
The presence of even a small amount of CH gas can lower the Therefore, the curvature is more likely an effect of ignitability4
minimum explosible concentrations of the oil shale dusts. Hybrid rather than of flammability.mixtures of oil shale dusts with CH gas were also studied in the There were also some 20-L tests to determine whether CH4
20-L chamber using 2,500-J ignitors. Data for hybrid mixtures ofadded to a high concentration of oil shale dust would produce athe 205-L/t (49-gal/st) oil shale and CH are shown as the triangle rich mixture that would be incapable of propagating an explosion.4
data points in figure 8; the 140-L/t (34-gal/st) oil shale mixtures areThe data in figures 6 and 7 showed there was no rich explosibilityshown as the circles. For comparison, data are also shown forlimit for the oil shales out to high dust concentrations. In themixtures of Pittsburgh hvb coal and CH . The area above and to additional tests, 2.5 pct CH added to 1,000 g/m of the 205 L/t oil4
the right of each curve is explosible, or flammable, for that dust; shale in the 20-L chamber still produced an explosion.the area below and to the left of each curve is nonexplosible, or In summary, laboratory and experimental mine research at thenonflammable. The data for mixtures of Pittsburgh coal and CH Pittsburgh Research Center has shown that oil shale dust clouds can4
in figure 8 show a linear or near-linear mixing relationship similar be ignited and therefore could present a hazard during undergroundto Le Chatelier's law for hydrocarbon gases (42-43). The measured blasting operations. This research has also shown that smallLFL for the pure CH with the 2,500-J ignitor is 4.4 pct, but this amounts of CH can significantly reduce the lower limits of4
is an overdriven system as shown by tests in a larger 120-Lexplosibility for oil shale dusts. If one combines the above resultschamber (44). The more appropriate LFL for CH is the 4.9-pct with the highly incendive (or flame-generating) blasting agents4
value measured with a 1,000-J ignitor in the 20-L chamber. The typically used in oil shale mining, then a potentially hazardousdata for the two oil shale dusts show some curvature. This is condition exists in the oil shale mining industry. For these reasons,probably due to the great difference in ignitability between the oil field investigations at several oil shale operations were initiated toshale and the CH , i.e., the dust becomes more easily ignited as measure dust generation, gas emissions, flames, and pressures4
small amounts of CH are added. during commercial-scale mining operations.4
4
43
4
Table 2.—Laboratory explosibility data for oil shales and comparison dusts
Explosibility dataOil shale dusts Coal dusts
5082 6114 6238 0000 5084 hvb lvb anthraAssay, L/t . . . . . . . . . . . . 82 95 140 174 205 NAp NAp NApMEC, kg/m3
@ 2.5 kJ . . . . . . . . . . . . @ 5 kJ . . . . . . . . . . . . .
NA NI 0.40 0.20 0.20 0.08 0.12 NA~0.8 0.6 .25 .16 .13 .06 .09 NI
P , bar . . . . . . . . . . . . .max 2.7 3.0 3.7 4.5 4.5 5.6 5.0 0.4(dP/dt) , bar/s . . . . . . .max 13 22 45 ~88 88 145 77 <1MAIT, EC . . . . . . . . . . . . 490 ~490 490 470 450 530 ~610 ~670
NAp Not applicable. NA No data available. NI Nonignitable.
12
DUST, PRESSURE, AND FLAME DURING BLASTING IN OIL SHALE MINES
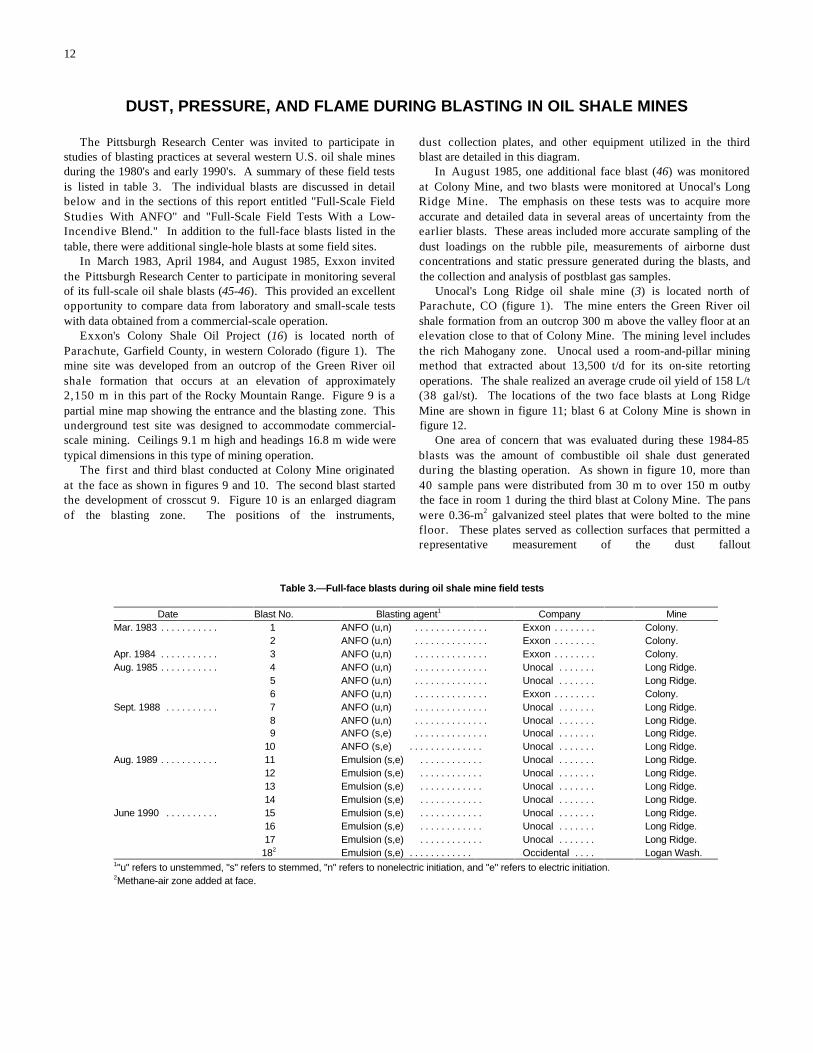
The Pittsburgh Research Center was invited to participate in dust collection plates, and other equipment utilized in the thirdstudies of blasting practices at several western U.S. oil shale mines blast are detailed in this diagram.during the 1980's and early 1990's. A summary of these field tests In August 1985, one additional face blast (46) was monitoredis listed in table 3. The individual blasts are discussed in detail at Colony Mine, and two blasts were monitored at Unocal's Longbelow and in the sections of this report entitled "Full-Scale Field Ridge Mine. The emphasis on these tests was to acquire moreStudies With ANFO" and "Full-Scale Field Tests With a Low- accurate and detailed data in several areas of uncertainty from theIncendive Blend." In addition to the full-face blasts listed in the earlier blasts. These areas included more accurate sampling of thetable, there were additional single-hole blasts at some field sites. dust loadings on the rubble pile, measurements of airborne dust
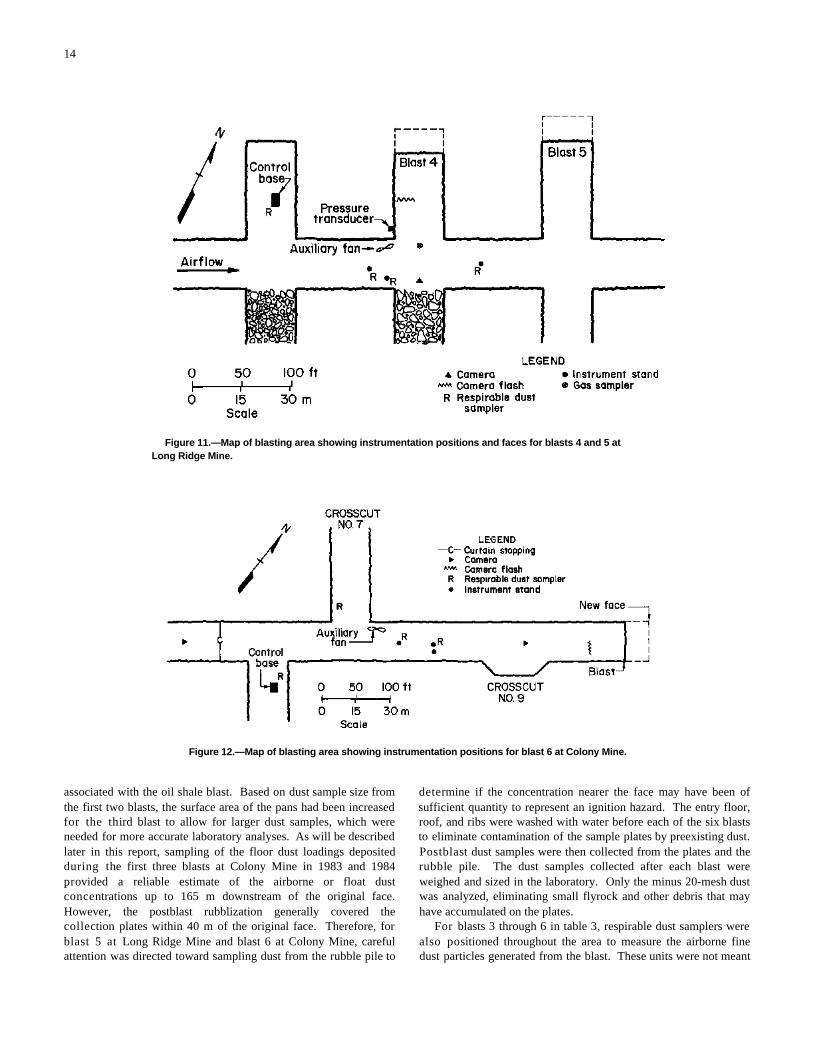
In March 1983, April 1984, and August 1985, Exxon invited concentrations and static pressure generated during the blasts, andthe Pittsburgh Research Center to participate in monitoring several the collection and analysis of postblast gas samples.of its full-scale oil shale blasts (45-46). This provided an excellent Unocal's Long Ridge oil shale mine (3) is located north ofopportunity to compare data from laboratory and small-scale tests Parachute, CO (figure 1). The mine enters the Green River oilwith data obtained from a commercial-scale operation. shale formation from an outcrop 300 m above the valley floor at an
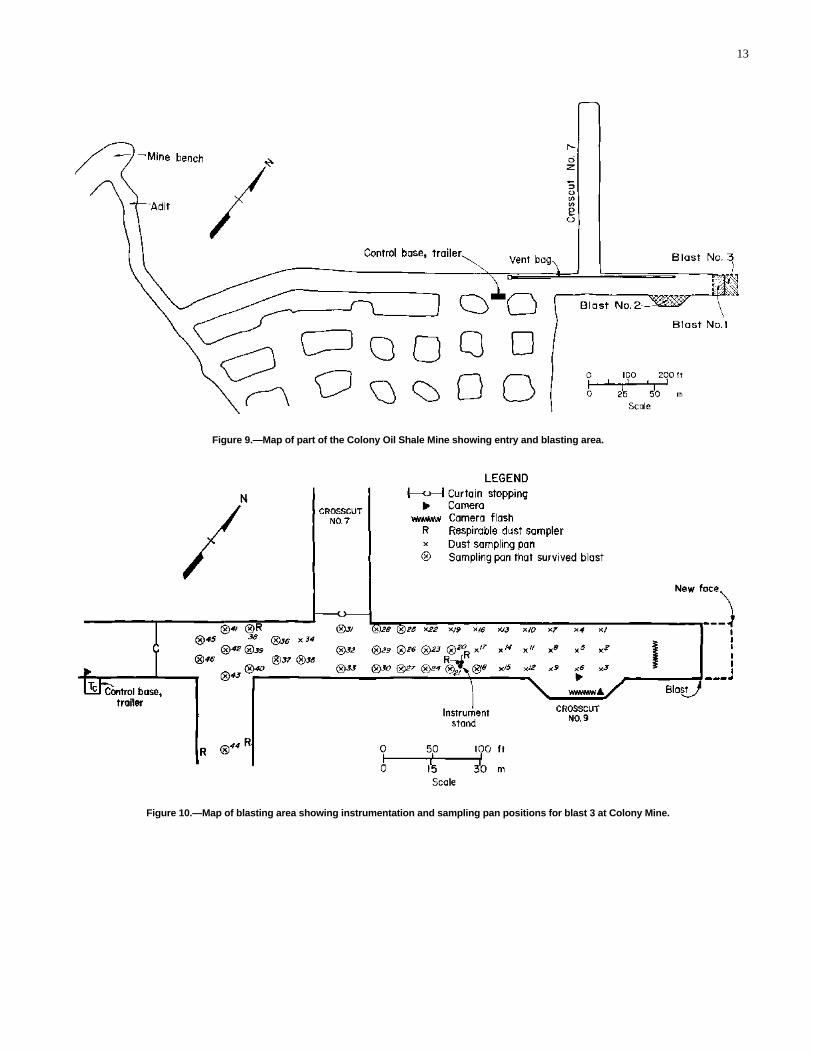
Exxon's Colony Shale Oil Project (16) is located north of elevation close to that of Colony Mine. The mining level includesParachute, Garfield County, in western Colorado (figure 1). The the rich Mahogany zone. Unocal used a room-and-pillar miningmine site was developed from an outcrop of the Green River oil method that extracted about 13,500 t/d for its on-site retortingshale formation that occurs at an elevation of approximately operations. The shale realized an average crude oil yield of 158 L/t2,150 m in this part of the Rocky Mountain Range. Figure 9 is a(38 gal/st). The locations of the two face blasts at Long Ridgepartial mine map showing the entrance and the blasting zone. This Mine are shown in figure 11; blast 6 at Colony Mine is shown inunderground test site was designed to accommodate commercial- figure 12.scale mining. Ceilings 9.1 m high and headings 16.8 m wide were One area of concern that was evaluated during these 1984-85typical dimensions in this type of mining operation. blasts was the amount of combustible oil shale dust generated
The first and third blast conducted at Colony Mine originated during the blasting operation. As shown in figure 10, more thanat the face as shown in figures 9 and 10. The second blast started 40 sample pans were distributed from 30 m to over 150 m outbythe development of crosscut 9. Figure 10 is an enlarged diagram the face in room 1 during the third blast at Colony Mine. The pansof the blasting zone. The positions of the instruments, were 0.36-m galvanized steel plates that were bolted to the mine2
floor. These plates served as collection surfaces that permitted arepresentative measurement of the dust fallout
Table 3.—Full-face blasts during oil shale mine field tests
Date Blast No. Blasting agent Company Mine1
Mar. 1983 . . . . . . . . . . . 1 ANFO (u,n) . . . . . . . . . . . . . . Exxon . . . . . . . . Colony.2 ANFO (u,n) . . . . . . . . . . . . . . Exxon . . . . . . . . Colony.
Apr. 1984 . . . . . . . . . . . 3 ANFO (u,n) . . . . . . . . . . . . . . Exxon . . . . . . . . Colony.Aug. 1985 . . . . . . . . . . . 4 ANFO (u,n) . . . . . . . . . . . . . . Unocal . . . . . . . Long Ridge.
5 ANFO (u,n) . . . . . . . . . . . . . . Unocal . . . . . . . Long Ridge.6 ANFO (u,n) . . . . . . . . . . . . . . Exxon . . . . . . . . Colony.
Sept. 1988 . . . . . . . . . . 7 ANFO (u,n) . . . . . . . . . . . . . . Unocal . . . . . . . Long Ridge.8 ANFO (u,n) . . . . . . . . . . . . . . Unocal . . . . . . . Long Ridge.9 ANFO (s,e) . . . . . . . . . . . . . . Unocal . . . . . . . Long Ridge.
10 ANFO (s,e) . . . . . . . . . . . . . . Unocal . . . . . . . Long Ridge.Aug. 1989 . . . . . . . . . . . 11 Emulsion (s,e) . . . . . . . . . . . . Unocal . . . . . . . Long Ridge.
12 Emulsion (s,e) . . . . . . . . . . . . Unocal . . . . . . . Long Ridge.13 Emulsion (s,e) . . . . . . . . . . . . Unocal . . . . . . . Long Ridge.14 Emulsion (s,e) . . . . . . . . . . . . Unocal . . . . . . . Long Ridge.
June 1990 . . . . . . . . . . 15 Emulsion (s,e) . . . . . . . . . . . . Unocal . . . . . . . Long Ridge.16 Emulsion (s,e) . . . . . . . . . . . . Unocal . . . . . . . Long Ridge.17 Emulsion (s,e) . . . . . . . . . . . . Unocal . . . . . . . Long Ridge.
18 Emulsion (s,e) . . . . . . . . . . . .2 Occidental . . . . Logan Wash.
"u" refers to unstemmed, "s" refers to stemmed, "n" refers to nonelectric initiation, and "e" refers to electric initiation.1
Methane-air zone added at face.2
13
Figure 9.—Map of part of the Colony Oil Shale Mine showing entry and blasting area.
Figure 10.—Map of blasting area showing instrumentation and sampling pan positions for blast 3 at Colony Mine.
14
Figure 11.—Map of blasting area showing instrumentation positions and faces for blasts 4 and 5 atLong Ridge Mine.
Figure 12.—Map of blasting area showing instrumentation positions for blast 6 at Colony Mine.
associated with the oil shale blast. Based on dust sample size from determine if the concentration nearer the face may have been ofthe first two blasts, the surface area of the pans had been increased sufficient quantity to represent an ignition hazard. The entry floor,for the third blast to allow for larger dust samples, which were roof, and ribs were washed with water before each of the six blastsneeded for more accurate laboratory analyses. As will be described to eliminate contamination of the sample plates by preexisting dust.later in this report, sampling of the floor dust loadings deposited Postblast dust samples were then collected from the plates and theduring the first three blasts at Colony Mine in 1983 and 1984rubble pile. The dust samples collected after each blast wereprovided a reliable estimate of the airborne or float dust weighed and sized in the laboratory. Only the minus 20-mesh dustconcentrations up to 165 m downstream of the original face. was analyzed, eliminating small flyrock and other debris that mayHowever, the postblast rubblization generally covered the have accumulated on the plates.collection plates within 40 m of the original face. Therefore, for For blasts 3 through 6 in table 3, respirable dust samplers wereblast 5 at Long Ridge Mine and blast 6 at Colony Mine, careful also positioned throughout the area to measure the airborne fineattention was directed toward sampling dust from the rubble pile to dust particles generated from the blast. These units were not meant
15
to represent the respirable dust to which miners would be exposed blast heading at the rear of crosscut 9 to observe the turbulent dustbecause miners were not present during the blasting. The total dust clouds resulting from the explosion and also to observe the blastsamples collected from the filter cassettes and cyclone cups wereeffect on a roof-mounted ventilation bag. A multiple flash bulbweighed, and the filters were also analyzed for quartz content. The system was used for each camera to provide the necessary lighting.sampler units were turned on approximately 0.5 h before the event The flash sequence was designed to start 1 s before detonation andand continued sampling for 1.5 h. to illu minate each camera's field of view for approximately 8 s.
The instrument stand for blast 3 was positioned approxi- mately This was accomplished by using long-duration flash bulbs and75 m outby the face near the rib as shown in figure 10. This firing sequential series of these flash bulbs through the use of timelocation permitted relative safety from flyrock and other debris that delay relays. During blasts 4 and 5, two cameras were mounted towould be generated by the blast. The risk of damage to the the mine roof (see figure 11) about 40 m outby the face toinstruments from flyrock was the reason for positioning the stands document any flame occurrence. One camera was filming at a ratein the crosscuts in blasts 4 and 5 (see figure 11). For blast 6 at of 32 fr/s; the other, at a rate of 64 fr/s. A multiple flash bulbColony Mine, one stand was located approximately 85 m outby thesystem was also used during these tests to illuminate the blast face.face at midentry; the other stand was 15 m further down the entry During blast 6, a camera was mounted on the mine roof 38 m(see figure 12). For this blast, the instrument stands were in direct outby the face (see figure 12).line of sight to the face. Instrumentation on or near the stand A prototype high-speed, evacuated-vial gas sampling systemlocations consisted of drag probes, optical dust probes, pressure was field tested for the first time during blasts 4, 5, and 6. Thistransducers, and cameras. Data from the various instruments were system was capable of obtaining 18 test tube samples in the entryrecorded on a high-speed chart recorder. Two drag probes of at preset time intervals. The sample time and the interval betweendifferent sensitivities were used in the measurement of the dynamic samples could be adjusted in advance. The unit was activated bypressure during blast 3. One drag probe utilized a 9-cm-diam the initial blast wave and programmed to draw gas samples everytarget disk; the other, a 20-cm-diam disk. 2 min immediately following the preshear detonation.
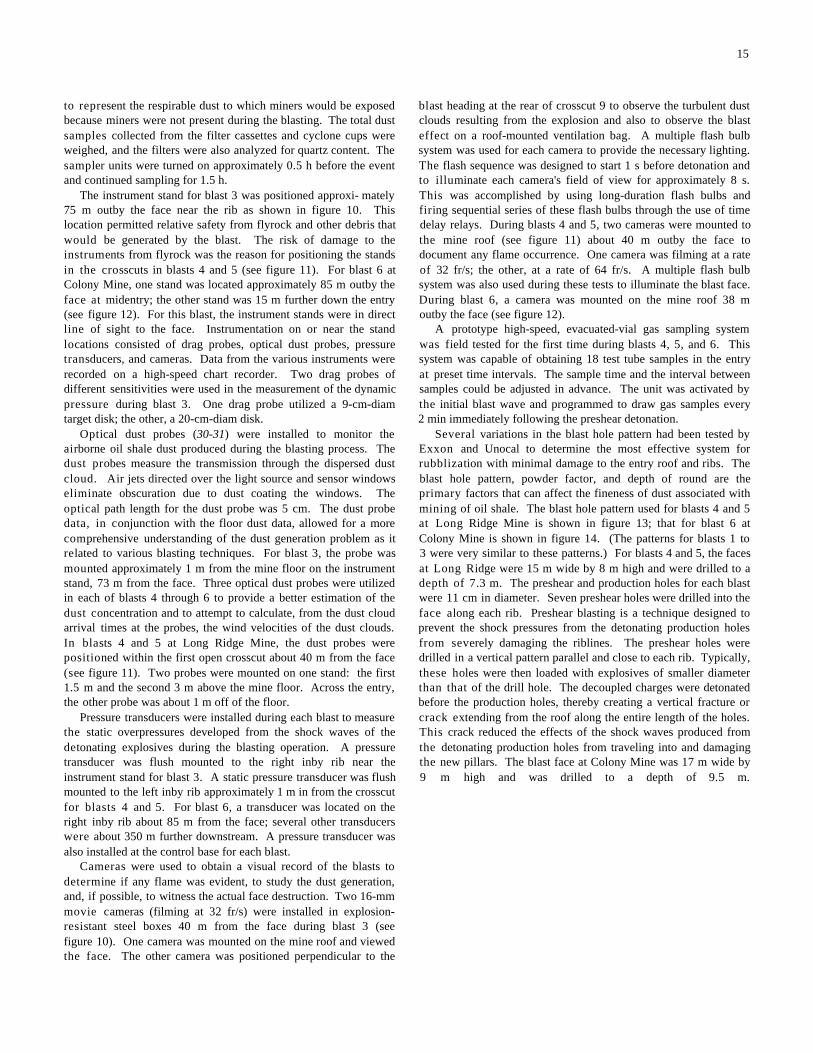
Optical dust probes (30-31) were installed to monitor the Several variations in the blast hole pattern had been tested byairborne oil shale dust produced during the blasting process. TheExxon and Unocal to determine the most effective system fordust probes measure the transmission through the dispersed dustrubblization with minimal damage to the entry roof and ribs. Thecloud. Air jets directed over the light source and sensor windows blast hole pattern, powder factor, and depth of round are theeliminate obscuration due to dust coating the windows. The primary factors that can affect the fineness of dust associated withoptical path length for the dust probe was 5 cm. The dust probe mining of oil shale. The blast hole pattern used for blasts 4 and 5data, in conjunction with the floor dust data, allowed for a more at Long Ridge Mine is shown in figure 13; that for blast 6 atcomprehensive understanding of the dust generation problem as it Colony Mine is shown in figure 14. (The patterns for blasts 1 torelated to various blasting techniques. For blast 3, the probe was 3 were very similar to these patterns.) For blasts 4 and 5, the facesmounted approximately 1 m from the mine floor on the instrument at Long Ridge were 15 m wide by 8 m high and were drilled to astand, 73 m from the face. Three optical dust probes were utilized depth of 7.3 m. The preshear and production holes for each blastin each of blasts 4 through 6 to provide a better estimation of the were 11 cm in diameter. Seven preshear holes were drilled into thedust concentration and to attempt to calculate, from the dust cloudface along each rib. Preshear blasting is a technique designed toarrival times at the probes, the wind velocities of the dust clouds. prevent the shock pressures from the detonating production holesIn blasts 4 and 5 at Long Ridge Mine, the dust probes were from severely damaging the riblines. The preshear holes werepositioned within the first open crosscut about 40 m from the face drilled in a vertical pattern parallel and close to each rib. Typically,(see figure 11). Two probes were mounted on one stand: the first these holes were then loaded with explosives of smaller diameter1.5 m and the second 3 m above the mine floor. Across the entry, than that of the drill hole. The decoupled charges were detonatedthe other probe was about 1 m off of the floor. before the production holes, thereby creating a vertical fracture or
Pressure transducers were installed during each blast to measurecrack extending from the roof along the entire length of the holes.the static overpressures developed from the shock waves of the This crack reduced the effects of the shock waves produced fromdetonating explosives during the blasting operation. A pressure the detonating production holes from traveling into and damagingtransducer was flush mounted to the right inby rib near the the new pillars. The blast face at Colony Mine was 17 m wide byinstrument stand for blast 3. A static pressure transducer was flush 9 m high and was drilled to a depth of 9.5 m.mounted to the left inby rib approximately 1 m in from the crosscutfor blasts 4 and 5. For blast 6, a transducer was located on theright inby rib about 85 m from the face; several other transducerswere about 350 m further downstream. A pressure transducer wasalso installed at the control base for each blast.
Cameras were used to obtain a visual record of the blasts todetermine if any flame was evident, to study the dust generation,and, if possible, to witness the actual face destruction. Two 16-mmmovie cameras (filming at 32 fr/s) were installed in explosion-resistant steel boxes 40 m from the face during blast 3 (seefigure 10). One camera was mounted on the mine roof and viewedthe face. The other camera was positioned perpendicular to the
16
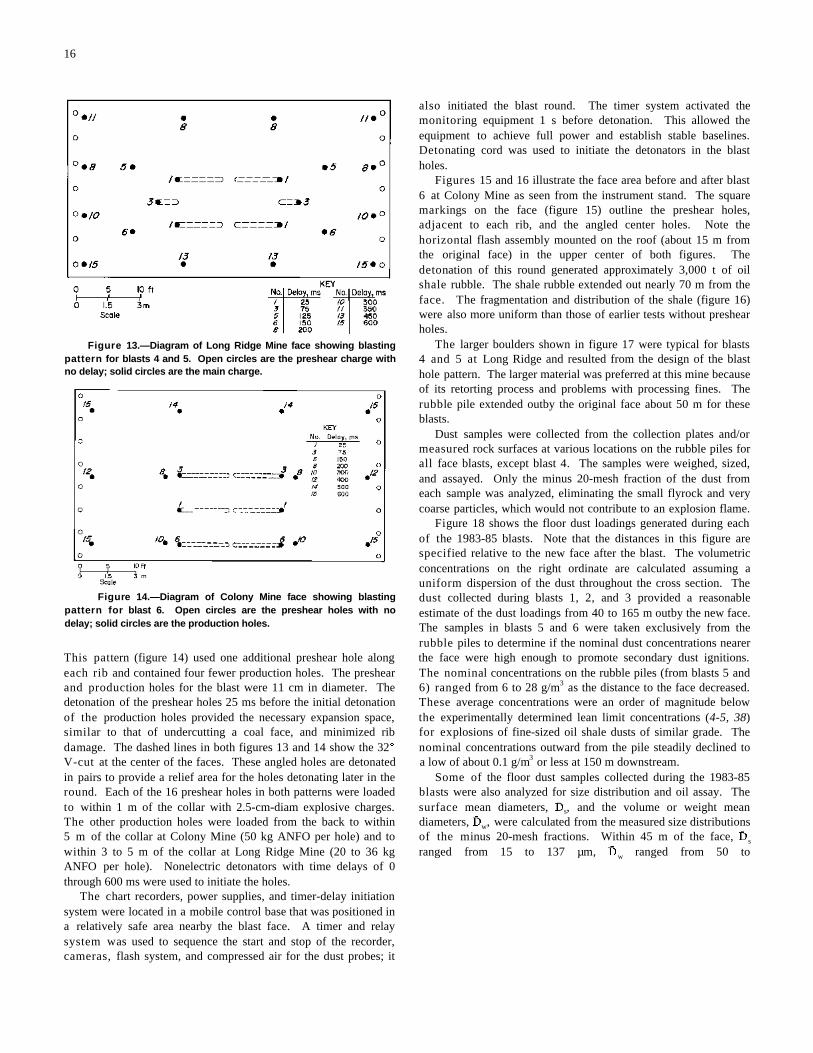
Figure 13.—Diagram of Long Ridge Mine face showing blastingpattern for blasts 4 and 5. Open circles are the preshear charge withno delay; solid circles are the main charge.
Figure 14.—Diagram of Colony Mine face showing blastingpattern for blast 6. Open circles are the preshear holes with nodelay; solid circles are the production holes.
This pattern (figure 14) used one additional preshear hole along the face were high enough to promote secondary dust ignitions.each rib and contained four fewer production holes. The preshearThe nominal concentrations on the rubble piles (from blasts 5 andand production holes for the blast were 11 cm in diameter. The 6) ranged from 6 to 28 g/m as the distance to the face decreased.detonation of the preshear holes 25 ms before the initial detonationThese average concentrations were an order of magnitude belowof the production holes provided the necessary expansion space, the experimentally determined lean limit concentrations (4-5, 38)similar to that of undercutting a coal face, and minimized rib for explosions of fine-sized oil shale dusts of similar grade. Thedamage. The dashed lines in both figures 13 and 14 show the 32E nominal concentrations outward from the pile steadily declined toV-cut at the center of the faces. These angled holes are detonated a low of about 0.1 g/m or less at 150 m downstream.in pairs to provide a relief area for the holes detonating later in the Some of the floor dust samples collected during the 1983-85round. Each of the 16 preshear holes in both patterns were loaded blasts were also analyzed for size distribution and oil assay. Theto within 1 m of the collar with 2.5-cm-diam explosive charges. surface mean diameters, ö , and the volume or weight meanThe other production holes were loaded from the back to within diameters, ö , were calculated from the measured size distributions5 m of the collar at Colony Mine (50 kg ANFO per hole) and to of the minus 20-mesh fractions. Within 45 m of the face, ö
within 3 to 5 m of the collar at Long Ridge Mine (20 to 36 kg ranged from 15 to 137 µm, ö ranged from 50 toANFO per hole). Nonelectric detonators with time delays of 0through 600 ms were used to initiate the holes.
The chart recorders, power supplies, and timer-delay initiationsystem were located in a mobile control base that was positioned ina relatively safe area nearby the blast face. A timer and relaysystem was used to sequence the start and stop of the recorder,cameras, flash system, and compressed air for the dust probes; it
also initiated the blast round. The timer system activated themonitoring equipment 1 s before detonation. This allowed theequipment to achieve full power and establish stable baselines.Detonating cord was used to initiate the detonators in the blastholes.
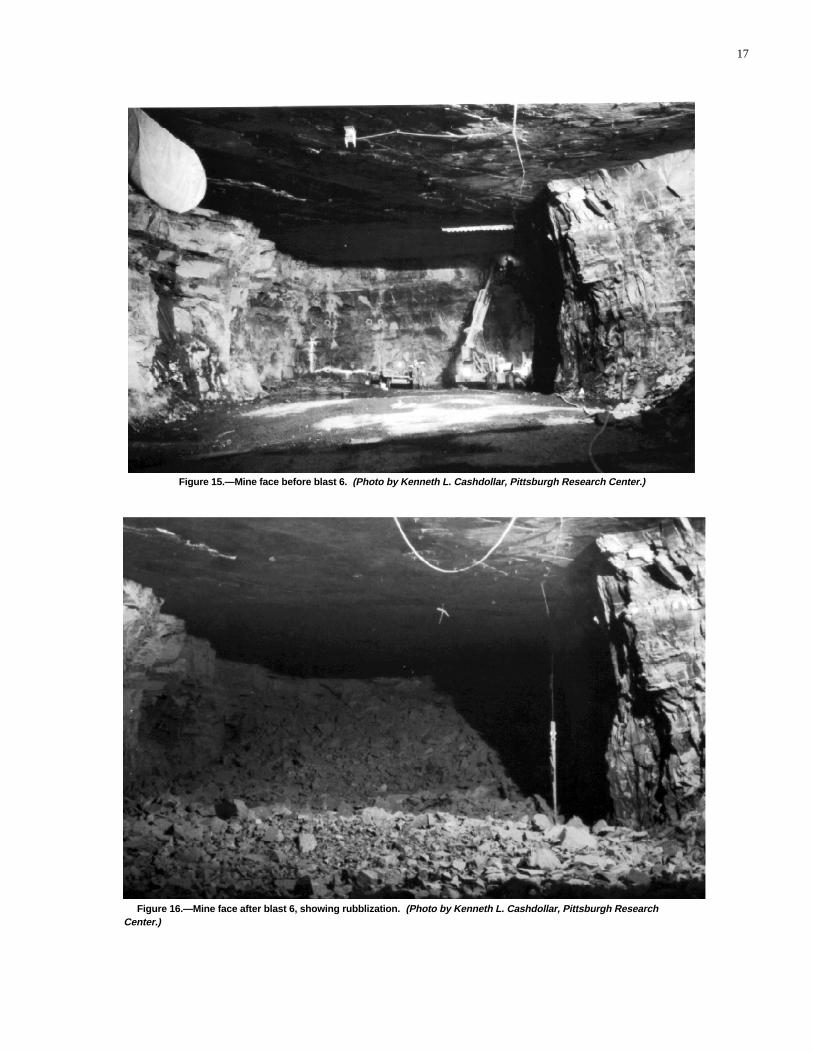
Figures 15 and 16 illustrate the face area before and after blast6 at Colony Mine as seen from the instrument stand. The squaremarkings on the face (figure 15) outline the preshear holes,adjacent to each rib, and the angled center holes. Note thehorizontal flash assembly mounted on the roof (about 15 m fromthe original face) in the upper center of both figures. Thedetonation of this round generated approximately 3,000 t of oilshale rubble. The shale rubble extended out nearly 70 m from theface. The fragmentation and distribution of the shale (figure 16)were also more uniform than those of earlier tests without preshearholes.
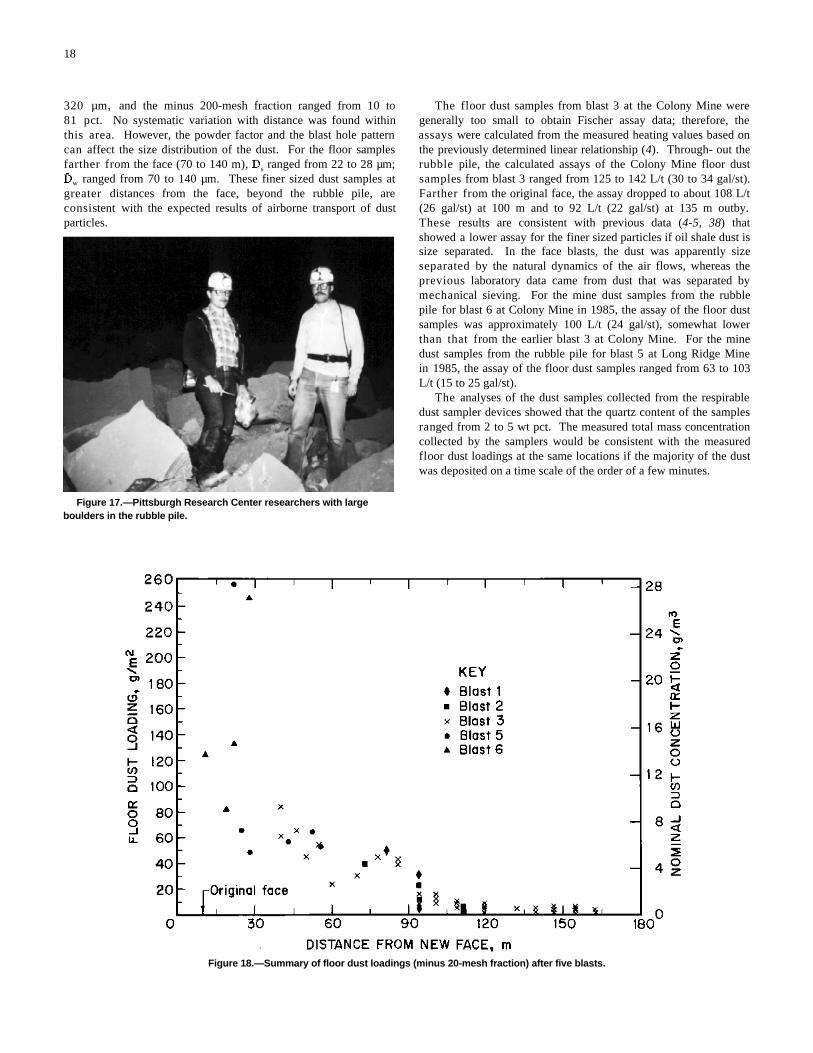
The larger boulders shown in figure 17 were typical for blasts4 and 5 at Long Ridge and resulted from the design of the blasthole pattern. The larger material was preferred at this mine becauseof its retorting process and problems with processing fines. Therubble pile extended outby the original face about 50 m for theseblasts.
Dust samples were collected from the collection plates and/ormeasured rock surfaces at various locations on the rubble piles forall face blasts, except blast 4. The samples were weighed, sized,and assayed. Only the minus 20-mesh fraction of the dust fromeach sample was analyzed, eliminating the small flyrock and verycoarse particles, which would not contribute to an explosion flame.
Figure 18 shows the floor dust loadings generated during eachof the 1983-85 blasts. Note that the distances in this figure arespecified relative to the new face after the blast. The volumetricconcentrations on the right ordinate are calculated assuming auniform dispersion of the dust throughout the cross section. Thedust collected during blasts 1, 2, and 3 provided a reasonableestimate of the dust loadings from 40 to 165 m outby the new face.The samples in blasts 5 and 6 were taken exclusively from therubble piles to determine if the nominal dust concentrations nearer
3
3
s
w
s
w
17
Figure 15.—Mine face before blast 6. (Photo by Kenneth L. Cashdollar, Pittsburgh Research Center.)
Figure 16.—Mine face after blast 6, showing rubblization. (Photo by Kenneth L. Cashdollar, Pittsburgh ResearchCenter.)
18
Figure 17.—Pittsburgh Research Center researchers with largeboulders in the rubble pile.
Figure 18.—Summary of floor dust loadings (minus 20-mesh fraction) after five blasts.
320 µm, and the minus 200-mesh fraction ranged from 10 to The floor dust samples from blast 3 at the Colony Mine were81 pct. No systematic variation with distance was found within generally too small to obtain Fischer assay data; therefore, thethis area. However, the powder factor and the blast hole pattern assays were calculated from the measured heating values based oncan affect the size distribution of the dust. For the floor samples the previously determined linear relationship (4). Through- out thefarther from the face (70 to 140 m), ö ranged from 22 to 28 µm; rubble pile, the calculated assays of the Colony Mine floor dusts
ö ranged from 70 to 140 µm. These finer sized dust samples at samples from blast 3 ranged from 125 to 142 L/t (30 to 34 gal/st).w
greater distances from the face, beyond the rubble pile, are Farther from the original face, the assay dropped to about 108 L/tconsistent with the expected results of airborne transport of dust (26 gal/st) at 100 m and to 92 L/t (22 gal/st) at 135 m outby.particles. These results are consistent with previous data (4-5, 38) that
showed a lower assay for the finer sized particles if oil shale dust issize separated. In the face blasts, the dust was apparently sizeseparated by the natural dynamics of the air flows, whereas theprevious laboratory data came from dust that was separated bymechanical sieving. For the mine dust samples from the rubblepile for blast 6 at Colony Mine in 1985, the assay of the floor dustsamples was approximately 100 L/t (24 gal/st), somewhat lowerthan that from the earlier blast 3 at Colony Mine. For the minedust samples from the rubble pile for blast 5 at Long Ridge Minein 1985, the assay of the floor dust samples ranged from 63 to 103L/t (15 to 25 gal/st).
The analyses of the dust samples collected from the respirabledust sampler devices showed that the quartz content of the samplesranged from 2 to 5 wt pct. The measured total mass concentrationcollected by the samplers would be consistent with the measuredfloor dust loadings at the same locations if the majority of the dustwas deposited on a time scale of the order of a few minutes.

19
Figure 19.—Pressure generated by blast 3.
For blasts 4, 5, and 6, very low dust concentrations wererebounding pressure waves gradually faded. In blasts 4, 5, and 6,calculated from the high transmission data (95 to 99 pct) recordedby the optical dust probes. However, even these transmissions overa 5-cm optical path length of the probe would correspond to a verylow visibility over a distance of a few meters. The measuredtransmission values of 95 to 99 pct are consistent with themeasured floor dust loadings at the positions of the dust probes.Close to the face, there were probably higher airborne dustconcentrations, as shown by the billowing clouds in the high-speedmovies and the higher floor dust loadings on the rubble pile nearthe face.
Figure 19 is a plot of the signal from the pressure transducerduring blast 3. Approximately 0.25 s after the blast initiation, thestatic wall pressure rose to a peak of 100 mbar. This pressure pulseis believed to be associated with the preshear holes and the initialcenter angled holes, since it would take about 0.25 s for thepressure pulse at the face to travel at the speed of sound in air to theinstrument stand 73 m from the face. The small signals earlier than0.25 s were probably associated with vibrations of the solid minerock itself, inasmuch as the speed of sound in rock is about 20times the speed of air. The dynamic pressure measured by the dragprobes was approximately 26 mbar, corresponding to a windvelocity of about 60 m/s.
The static pressure was approximately 0.3 bar at about 25 mfrom the face for blasts 4 and 5 at Long Ridge Mine. The pressure65 m from the face was 40 mbar; the pressure 115 m from the facewas approximately 20 mbar. At Colony Mine, the measuredpressure was about 100 mbar at a distance of 85 m from the faceduring blast 6. This pressure was nearly the same as the pressuresmeasured during blasts 1 and 3 that occurred in the same blastingzone. The peak pressure recorded at the control base located145 m from the face in blast 6 at Colony Mine was about 50 mbar.Additional transducers were mounted on several test stoppingslocated over 430 m from the blast face during blast 6. Themaximum recorded pressure exerted against these ventilationstoppings was about 11 mbar. A cyclic pressure wave wasdeveloped from blast 6 that was clearly evident after viewing themovie film taken of a ventilation curtain located about 155 m fromthe face. The curtain was being alternatively pulsed outward, theninward as it encountered the successive shock waves generatedfrom the face detonations and rebounding pressure waves. Thepulses decreased in intensity and the interval between pulsesb e c a m e lo n g e r a s t h e
the pressure decayed approximately linearly with distance, exceptwhen it reached an area with multiple rooms and passageways,where it decayed more rapidly. A computer model could bedeveloped to predict the pressures that would be generated for aparticular blasting pattern and powder factor; these predictionscould be applied in the construction of durable ventilationstoppings for these large headings.
The use of the prototype high-speed, evacuated vial sam- plingsystem resulted in very limited samples. During two of the threeblasts, flyrock damaged the unit and/or severed the pneumatic linesand supports. In one blast, however, the unit was able to obtain 18gas samples over a 34-min period. Analyses of these samplesshowed trace amounts of hydrogen (H ) and CH , perhaps2 4
generated from the cracking of the shale kerogen as it was heatedby the explosives. Another source of these gases would be thedetonation byproducts from the explosives. These measurementswere in the absence of any net ventilation flow and would bereduced greatly after the main fans were turned on. The CH4
amounts were negligible compared with those in gassy mines, suchas the Horse Draw and White River Mines (4, 29). This wasexpected since both the Colony and Long Ridge Mines were nearoutcrops and had not detected any CH .4
The two 16-mm movie cameras were successful in observingthe face during each blast. Frames from the movies of blast 6 areshown in figure 20. The start of the blasting sequence was clearlyevident by the brilliant flash (figure 20A) of the detonating cord asit initiated the time delay detonators in the preshear and productionholes. Figure 20B shows flame from an unstemmed blast holeduring the detonation of the angled holes in the centerapproximately 45 ms into the blasting sequence. Figure 20Cshows the blasting face about 110 ms after ignition. The lightingon the upper right of these photographs (figure 20B and C) is dueto the multiple flash system; that on the left is due to the flameexiting from the borehole. Flame was evident for at least 220 msafter ignition, at which time the dust and rock totally obscured theview of the cameras. Similar results were observed during blast 3in this mine and during blasts 4 and 5 at Long Ridge Mine. Theflame luminosity lasted too long to result solely from theexplosives themselves; it is uncertain from the film whether theflame was the result of afterburning of the detonating cord orburning oil shale dust clouds. It is possible that there werelocalized areas where the dust concentrations were above the lowerlimit requirements for an oil shale dust ignition. However, anyignitions that may have resulted from these dust clouds would havebeen small localized occurrences that would not be able topropagate very far based on the measured average floor dustloadings. There was no evidence of flame luminosity after the endof the blasting sequence.

20
Figure 20.—Frames from high-speed movie during blast 6. A , initial face detonation; B, luminosity at face at 45 ms; C, lumi-nosity at face at 110 ms, with horizontal flash system in upperright of frame.
21
Exxon's Colony Mine and Unocal's Long Ridge Mine were (4). The combination of CH liberated from the fragmentation ofknown to be nongassy due to their proximity to the outcrops. the blasted shale, the background CH emissions con- tinuouslyHowever, CH posed an explosion hazard in other oil shale mines, released from the developed headings, and the fine-sized dust4
which will be discussed in the next section of this report.generated in localized high concentration clouds at the face wouldExperimental results have shown that the presence of CH , even in pose a potential localized ignition hazard during some underground4
small quantities, will significantly decrease the lean limit oil shale mining operations.concentration of oil shale dust required to initiate an explosion
4
4
GAS GENERATION DURING OIL SHALE MINING
HORSE DRAW OIL SHALE MINE and background, were calculated and compared with the mass of
Generally, CH was not associated with the early oil shale mines As the mining progressed in the various levels of Horse Draw4
in the Green River formation. All of the mines were developed Mine, the tube bundles were extended to provide data on the CHfrom oil shale outcrops, and CH was never detected. In 1977, a levels in the vicinity of the blast face. A CH emission rate of 1.64
732-m-deep shaft was driven into the Piceance Creek oil shale m /t of oil shale was determined to be a reasonable value for thebasin at Horse Draw, in Rio Blanco County, Colorado (47-48). ventilation design based on the data gathered by the gas monitoringCH was encountered at this location, confirming earlier core data trailer (52). This value was in the same range as that reported from4
(49-50). Because this area was at least 24 km from an outcrop and outgassing of cores taken nearby in the formation (49-50).located below two aquifers, the CH did not have the opportunity Continuous background CH emissions ranged between 0.37 and4
to migrate out of the formation. Matta and others (50) indicated 0.51 m /min both during the mining operations and shortly afterthat the amount of CH present in any particular formation is the cessation of mining in late 1981 (53).4
proportional to its kerogen content, distance from an outcrop, and In 1988 and 1992, further gas samples were collected anddepth. An increase in any one or more factors increased theanalyzed as part of a continuing study of background CHpotential for CH to be encountered in the formation. emissions (54). At the Horse Draw oil shale mine site in Colorado,4
From April 1979 to October 1981, Multi-Mineral Corp. had several gas samples and air velocity measurements were taken fromoperated Horse Draw Mine under a cooperative agreement with the a vent pipe protruding through a concrete shaft seal (part of theUSBM and the Bureau of Land Management. Part of Weichman's 1986 site reclamation). All mining at Horse Draw had ended inresearch (51) was directed toward analyses of cores for CH late 1981. Natural ventilation occurred in the mine due to the4
content. Unlike the study of Matta and others (50), no conclusive temperature gradient between the outside ambient air and thedata could be obtained to link CH content to the kerogen content atmosphere inside the mine. This natural draft could vary between4
or depth of formation. However, the differences in the CH 50 and 100 m /min. Analyses of the 1988 samples showed that the4
content from the two studies may be due to geological conditions, mine continued to liberate CH at a rate of approximately 0.74such as fractures and/or the numerous occurrences of leached m /min. Samples collected in 1992 showed that the mine was stillnacholite zones. These zones of porous nacholite may store CH liberating CH at a rate of 0.63 m /min. Although these rates were4
in quantities above those predicted from the original study. Oil somewhat higher than the previous data (53), they are believed toshale, unlike coal, has a low permeability, and the CH would not be more accurate since all venting was through a single small4
easily be liberated in advance of mining. opening instead of several conduit openings as in the earlierIt is important to detect CH in a mining operation for safety sampling studies.4
reasons. Once CH is detected, it should be quantitatively4
monitored during the mining operations and, if possible, correlated WHITE RIVER OIL SHALE PROJECTwith the CH content found in cores. If this approach is successful,4
the quantity of CH to be expected in future mining operations can In 1984, the Pittsburgh Research Center monitored gas4
be better predicted. emissions during development blasting operations at the WhiteIn 1980, the Pittsburgh Research Center installed a gas River Shale Oil Project. An isometric view of the White River
monitoring system (52) at Horse Draw Mine to quantify the Shale Project (17) mine is shown in figure 21. The project isamounts of CH generated during blasting operations. A gas located on Federal leases Ua and Ub in Uinta County, UT. The air4
monitoring trailer was set up on the surface. Carbon monoxide shaft shown on the left of figure 21 is about 335 m deep. The(CO) and CH were monitored continuously by means of tube mine was designed to extract over 180,000 t of oil shale per day4
bundles into the mine. Gas concentration data were recorded infrom the rich Mahogany zone of the Green River formation.analog fashion on strip charts. Pitot probes were installed in Room-and-pillar mining was to be used, leaving rooms about 18 mexhaust fan ducts at various levels to measure the air flows in order high by 16 m wide after benching. The development headingsto compute the gas emissions at those levels. During undergroundwere 4 m high by 6 m wide and drilled to a depth of 3 m forblasting, the personnel were evacuated to the surface, but the gas blasting rounds.emission and air flow data continued to be collected through thetube bundles to the surface trailer. By continuous monitoring, the Gas Monitoring Systemtotal gas emissions, including emissions from blasting, mucking,
oil shale realized from the blast round and from core samples.
4
43
43
4
3
43
43
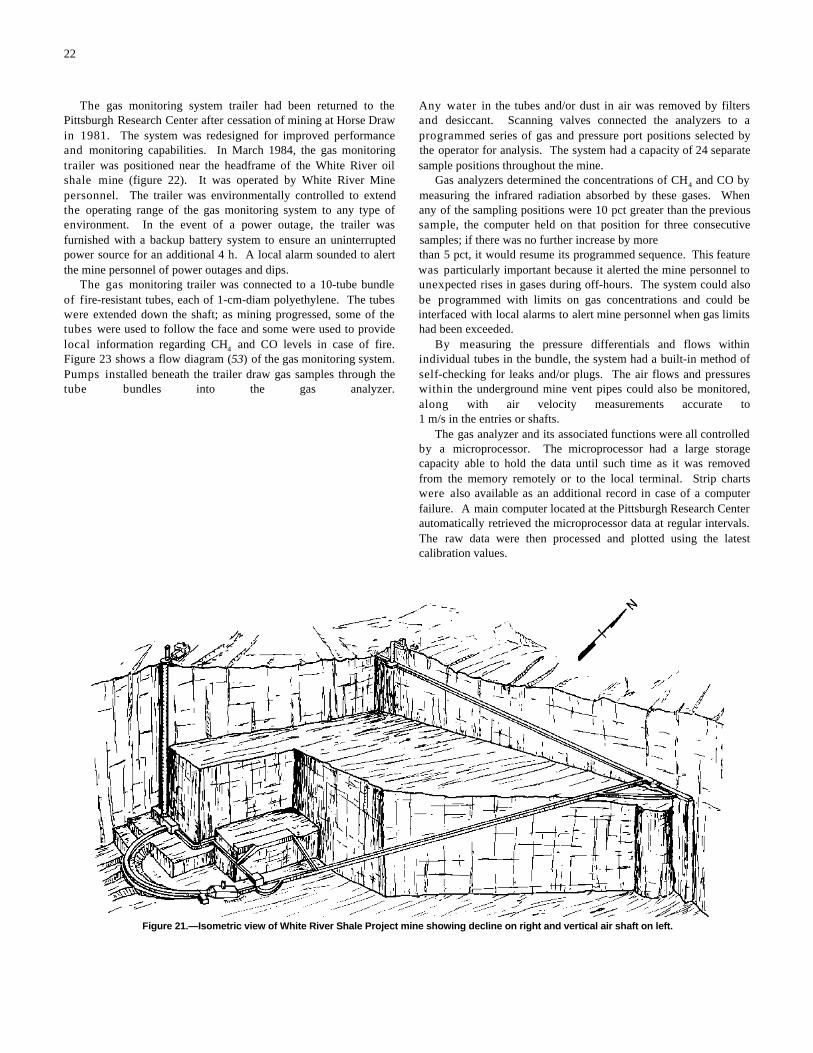
22
Figure 21.—Isometric view of White River Shale Project mine showing decline on right and vertical air shaft on left.
The gas monitoring system trailer had been returned to theAny water in the tubes and/or dust in air was removed by filtersPittsburgh Research Center after cessation of mining at Horse Drawand desiccant. Scanning valves connected the analyzers to ain 1981. The system was redesigned for improved performanceprogrammed series of gas and pressure port positions selected byand monitoring capabilities. In March 1984, the gas monitoring the operator for analysis. The system had a capacity of 24 separatetrailer was positioned near the headframe of the White River oil sample positions throughout the mine.shale mine (figure 22). It was operated by White River Mine Gas analyzers determined the concentrations of CH and CO bypersonnel. The trailer was environmentally controlled to extend measuring the infrared radiation absorbed by these gases. Whenthe operating range of the gas monitoring system to any type of any of the sampling positions were 10 pct greater than the previousenvironment. In the event of a power outage, the trailer was sample, the computer held on that position for three consecutivefurnished with a backup battery system to ensure an uninterrupted samples; if there was no further increase by more power source for an additional 4 h. A local alarm sounded to alert than 5 pct, it would resume its programmed sequence. This featurethe mine personnel of power outages and dips. was particularly important because it alerted the mine personnel to
The gas monitoring trailer was connected to a 10-tube bundleunexpected rises in gases during off-hours. The system could alsoof fire-resistant tubes, each of 1-cm-diam polyethylene. The tubes be programmed with limits on gas concentrations and could bewere extended down the shaft; as mining progressed, some of the interfaced with local alarms to alert mine personnel when gas limitstubes were used to follow the face and some were used to provide had been exceeded.local information regarding CH and CO levels in case of fire. By measuring the pressure differentials and flows within4
Figure 23 shows a flow diagram (53) of the gas monitoring system. individual tubes in the bundle, the system had a built-in method ofPumps installed beneath the trailer draw gas samples through the self-checking for leaks and/or plugs. The air flows and pressurestube bundles into the gas analyzer. within the underground mine vent pipes could also be monitored,
4
along with air velocity measurements accurate to1 m/s in the entries or shafts.
The gas analyzer and its associated functions were all controlledby a microprocessor. The microprocessor had a large storagecapacity able to hold the data until such time as it was removedfrom the memory remotely or to the local terminal. Strip chartswere also available as an additional record in case of a computerfailure. A main computer located at the Pittsburgh Research Centerautomatically retrieved the microprocessor data at regular intervals.The raw data were then processed and plotted using the latestcalibration values.

23
Figure 22.—Gas monitoring trailer near air shaft at White River Mine.
Figure 23.—Flow diagram of gas sampling system. (Drawing shows sampling through A NN valve.)
Methane Emissions During Mining Operations A typical plot of CH emissions following a blast at the White4
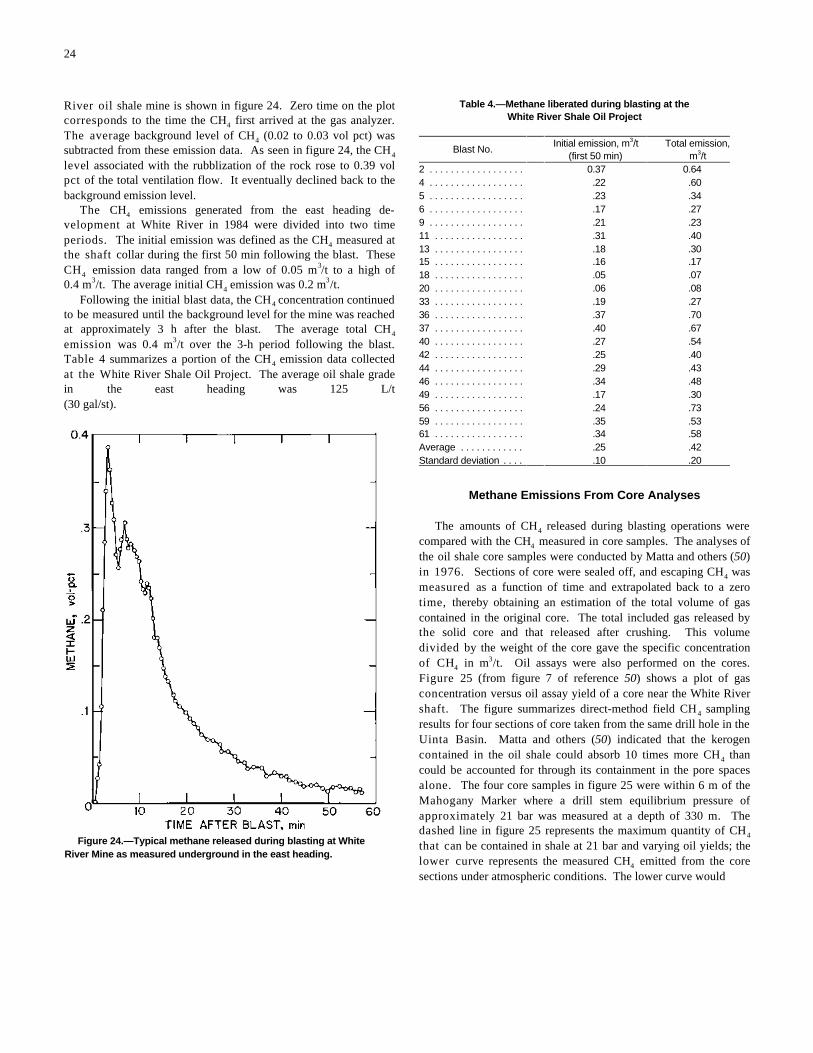
24
Figure 24.—Typical methane released during blasting at WhiteRiver Mine as measured underground in the east heading.
River oil shale mine is shown in figure 24. Zero time on the plotcorresponds to the time the CH first arrived at the gas analyzer.4
The average background level of CH (0.02 to 0.03 vol pct) was4
subtracted from these emission data. As seen in figure 24, the CH4
level associated with the rubblization of the rock rose to 0.39 volpct of the total ventilation flow. It eventually declined back to thebackground emission level.
The CH emissions generated from the east heading de-4
velopment at White River in 1984 were divided into two timeperiods. The initial emission was defined as the CH measured at4
the shaft collar during the first 50 min following the blast. TheseCH emission data ranged from a low of 0.05 m /t to a high of4
3
0.4 m /t. The average initial CH emission was 0.2 m /t.3 34
Following the initial blast data, the CH concentration continued4
to be measured until the background level for the mine was reachedat approximately 3 h after the blast. The average total CH4
emission was 0.4 m /t over the 3-h period following the blast.3
Table 4 summarizes a portion of the CH emission data collected4
at the White River Shale Oil Project. The average oil shale gradein the east heading was 125 L/t(30 gal/st).
Table 4.—Methane liberated during blasting at theWhite River Shale Oil Project
Blast No.Initial emission, m /t Total emission,3
(first 50 min) m /t 3
2 . . . . . . . . . . . . . . . . . . 0.37 0.644 . . . . . . . . . . . . . . . . . . .22 .605 . . . . . . . . . . . . . . . . . . .23 .346 . . . . . . . . . . . . . . . . . . .17 .279 . . . . . . . . . . . . . . . . . . .21 .2311 . . . . . . . . . . . . . . . . . .31 .4013 . . . . . . . . . . . . . . . . . .18 .3015 . . . . . . . . . . . . . . . . . .16 .1718 . . . . . . . . . . . . . . . . . .05 .0720 . . . . . . . . . . . . . . . . . .06 .0833 . . . . . . . . . . . . . . . . . .19 .2736 . . . . . . . . . . . . . . . . . .37 .7037 . . . . . . . . . . . . . . . . . .40 .6740 . . . . . . . . . . . . . . . . . .27 .5442 . . . . . . . . . . . . . . . . . .25 .4044 . . . . . . . . . . . . . . . . . .29 .4346 . . . . . . . . . . . . . . . . . .34 .4849 . . . . . . . . . . . . . . . . . .17 .3056 . . . . . . . . . . . . . . . . . .24 .7359 . . . . . . . . . . . . . . . . . .35 .5361 . . . . . . . . . . . . . . . . . .34 .58Average . . . . . . . . . . . . .25 .42Standard deviation . . . . .10 .20
Methane Emissions From Core Analyses
The amounts of CH released during blasting operations were4
compared with the CH measured in core samples. The analyses of4
the oil shale core samples were conducted by Matta and others (50)in 1976. Sections of core were sealed off, and escaping CH was4
measured as a function of time and extrapolated back to a zerotime, thereby obtaining an estimation of the total volume of gascontained in the original core. The total included gas released bythe solid core and that released after crushing. This volumedivided by the weight of the core gave the specific concentrationof CH in m /t. Oil assays were also performed on the cores.4
3
Figure 25 (from figure 7 of reference 50) shows a plot of gasconcentration versus oil assay yield of a core near the White Rivershaft. The figure summarizes direct-method field CH sampling4
results for four sections of core taken from the same drill hole in theUinta Basin. Matta and others (50) indicated that the kerogencontained in the oil shale could absorb 10 times more CH than4
could be accounted for through its containment in the pore spacesalone. The four core samples in figure 25 were within 6 m of theMahogany Marker where a drill stem equilibrium pressure ofapproximately 21 bar was measured at a depth of 330 m. Thedashed line in figure 25 represents the maximum quantity of CH4
that can be contained in shale at 21 bar and varying oil yields; thelower curve represents the measured CH emitted from the core4
sections under atmospheric conditions. The lower curve would
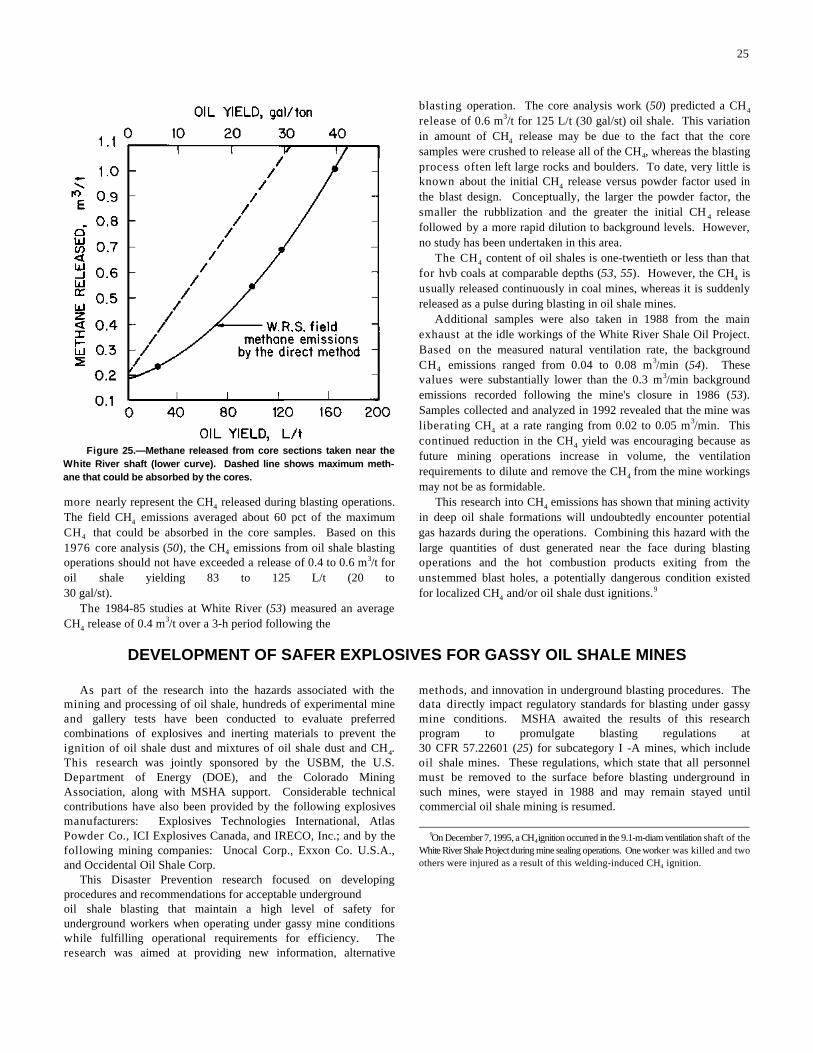
25
Figure 25.—Methane released from core sections taken near theWhite River shaft (lower curve). Dashed line shows maximum meth-ane that could be absorbed by the cores.
more nearly represent the CH released during blasting operations. This research into CH emissions has shown that mining activity4
The field CH emissions averaged about 60 pct of the maximum in deep oil shale formations will undoubtedly encounter potential4
CH that could be absorbed in the core samples. Based on this gas hazards during the operations. Combining this hazard with the4
1976 core analysis (50), the CH emissions from oil shale blasting large quantities of dust generated near the face during blasting4
operations should not have exceeded a release of 0.4 to 0.6 m /t for operations and the hot combustion products exiting from the3
oil shale yielding 83 to 125 L/t (20 to unstemmed blast holes, a potentially dangerous condition existed30 gal/st). for localized CH and/or oil shale dust ignitions.
The 1984-85 studies at White River (53) measured an averageCH release of 0.4 m /t over a 3-h period following the4
3
blasting operation. The core analysis work (50) predicted a CH4release of 0.6 m /t for 125 L/t (30 gal/st) oil shale. This variation3
in amount of CH release may be due to the fact that the core4
samples were crushed to release all of the CH , whereas the blasting4
process often left large rocks and boulders. To date, very little isknown about the initial CH release versus powder factor used in4
the blast design. Conceptually, the larger the powder factor, thesmaller the rubblization and the greater the initial CH release4
followed by a more rapid dilution to background levels. However,no study has been undertaken in this area.
The CH content of oil shales is one-twentieth or less than that4
for hvb coals at comparable depths (53, 55). However, the CH is4
usually released continuously in coal mines, whereas it is suddenlyreleased as a pulse during blasting in oil shale mines.
Additional samples were also taken in 1988 from the mainexhaust at the idle workings of the White River Shale Oil Project.Based on the measured natural ventilation rate, the backgroundCH emissions ranged from 0.04 to 0.08 m /min (54). These4
3
values were substantially lower than the 0.3 m/min background3
emissions recorded following the mine's closure in 1986 (53).Samples collected and analyzed in 1992 revealed that the mine wasliberating CH at a rate ranging from 0.02 to 0.05 m /min. This4
3
continued reduction in the CH yield was encouraging because as4
future mining operations increase in volume, the ventilationrequirements to dilute and remove the CH from the mine workings4
may not be as formidable.
4
49
DEVELOPMENT OF SAFER EXPLOSIVES FOR GASSY OIL SHALE MINES
As part of the research into the hazards associated with the methods, and innovation in underground blasting procedures. Themining and processing of oil shale, hundreds of experimental mine data directly impact regulatory standards for blasting under gassyand gallery tests have been conducted to evaluate preferred mine conditions. MSHA awaited the results of this researchcombinations of explosives and inerting materials to prevent the program to promulgate blasting regulations atignition of oil shale dust and mixtures of oil shale dust and CH . 30 CFR 57.22601 (25) for subcategory I -A mines, which include4
This research was jointly sponsored by the USBM, the U.S. oil shale mines. These regulations, which state that all personnelDepartment of Energy (DOE), and the Colorado Mining must be removed to the surface before blasting underground inAssociation, along with MSHA support. Considerable technical such mines, were stayed in 1988 and may remain stayed untilcontributions have also been provided by the following explosives commercial oil shale mining is resumed.manufacturers: Explosives Technologies International, AtlasPowder Co., ICI Explosives Canada, and IRECO, Inc.; and by thefollowing mining companies: Unocal Corp., Exxon Co. U.S.A.,and Occidental Oil Shale Corp.
This Disaster Prevention research focused on developingprocedures and recommendations for acceptable undergroundoil shale blasting that maintain a high level of safety forunderground workers when operating under gassy mine conditionswhile fulfilling operational requirements for efficiency. Theresearch was aimed at providing new information, alternative
On December 7, 1995, a CH ignition occurred in the 9.1-m-diam ventilation shaft of the94
White River Shale Project during mine sealing operations. One worker was killed and twoothers were injured as a result of this welding-induced CH ignition.4
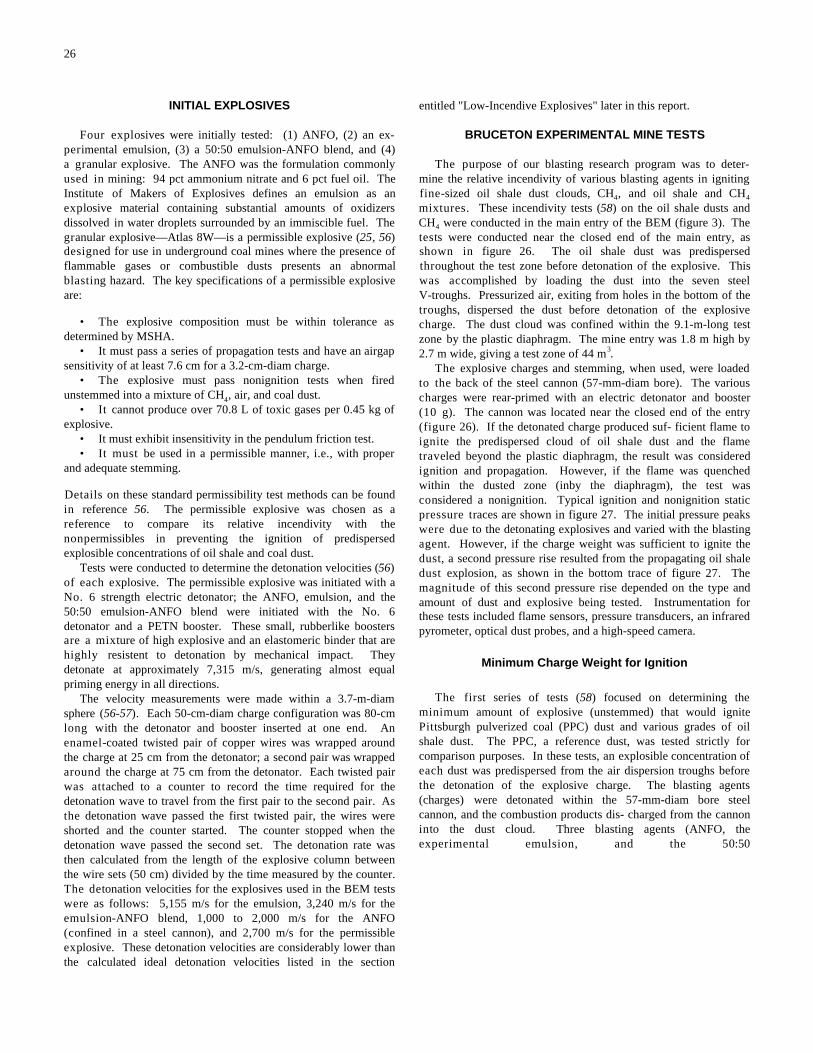
26
INITIAL EXPLOSIVES entitled "Low-Incendive Explosives" later in this report.
Four explosives were initially tested: (1) ANFO, (2) an ex- BRUCETON EXPERIMENTAL MINE TESTSperimental emulsion, (3) a 50:50 emulsion-ANFO blend, and (4)a granular explosive. The ANFO was the formulation commonly The purpose of our blasting research program was to deter-used in mining: 94 pct ammonium nitrate and 6 pct fuel oil. The mine the relative incendivity of various blasting agents in ignitingInstitute of Makers of Explosives defines an emulsion as an fine-sized oil shale dust clouds, CH , and oil shale and CHexplosive material containing substantial amounts of oxidizers mixtures. These incendivity tests (58) on the oil shale dusts anddissolved in water droplets surrounded by an immiscible fuel. The CH were conducted in the main entry of the BEM (figure 3). Thegranular explosive—Atlas 8W—is a permissible explosive (25, 56) tests were conducted near the closed end of the main entry, asdesigned for use in underground coal mines where the presence of shown in figure 26. The oil shale dust was predispersedflammable gases or combustible dusts presents an abnormal throughout the test zone before detonation of the explosive. Thisblasting hazard. The key specifications of a permissible explosive was accomplished by loading the dust into the seven steelare: V-troughs. Pressurized air, exiting from holes in the bottom of the
charge. The dust cloud was confined within the 9.1-m-long test• The explosive composition must be within tolerance asdetermined by MSHA.
• It must pass a series of propagation tests and have an airgapsensitivity of at least 7.6 cm for a 3.2-cm-diam charge.
• The explosive must pass nonignition tests when firedunstemmed into a mixture of CH , air, and coal dust.4
• It cannot produce over 70.8 L of toxic gases per 0.45 kg ofexplosive.
• It must exhibit insensitivity in the pendulum friction test.• It must be used in a permissible manner, i.e., with proper
and adequate stemming.
Details on these standard permissibility test methods can be foundin reference 56. The permissible explosive was chosen as areference to compare its relative incendivity with thenonpermissibles in preventing the ignition of predispersedexplosible concentrations of oil shale and coal dust.
Tests were conducted to determine the detonation velocities (56)of each explosive. The permissible explosive was initiated with aNo. 6 strength electric detonator; the ANFO, emulsion, and the50:50 emulsion-ANFO blend were initiated with the No. 6detonator and a PETN booster. These small, rubberlike boostersare a mixture of high explosive and an elastomeric binder that arehighly resistent to detonation by mechanical impact. Theydetonate at approximately 7,315 m/s, generating almost equalpriming energy in all directions.
The velocity measurements were made within a 3.7-m-diamsphere (56-57). Each 50-cm-diam charge configuration was 80-cmlong with the detonator and booster inserted at one end. Anenamel-coated twisted pair of copper wires was wrapped aroundthe charge at 25 cm from the detonator; a second pair was wrappedaround the charge at 75 cm from the detonator. Each twisted pairwas attached to a counter to record the time required for thedetonation wave to travel from the first pair to the second pair. Asthe detonation wave passed the first twisted pair, the wires wereshorted and the counter started. The counter stopped when thedetonation wave passed the second set. The detonation rate wasthen calculated from the length of the explosive column betweenthe wire sets (50 cm) divided by the time measured by the counter.The detonation velocities for the explosives used in the BEM testswere as follows: 5,155 m/s for the emulsion, 3,240 m/s for theemulsion-ANFO blend, 1,000 to 2,000 m/s for the ANFO(confined in a steel cannon), and 2,700 m/s for the permissibleexplosive. These detonation velocities are considerably lower thanthe calculated ideal detonation velocities listed in the section
4 4
4
troughs, dispersed the dust before detonation of the explosive
zone by the plastic diaphragm. The mine entry was 1.8 m high by2.7 m wide, giving a test zone of 44 m .3
The explosive charges and stemming, when used, were loadedto the back of the steel cannon (57-mm-diam bore). The variouscharges were rear-primed with an electric detonator and booster(10 g). The cannon was located near the closed end of the entry(figure 26). If the detonated charge produced suf- ficient flame toignite the predispersed cloud of oil shale dust and the flametraveled beyond the plastic diaphragm, the result was consideredignition and propagation. However, if the flame was quenchedwithin the dusted zone (inby the diaphragm), the test wasconsidered a nonignition. Typical ignition and nonignition staticpressure traces are shown in figure 27. The initial pressure peakswere due to the detonating explosives and varied with the blastingagent. However, if the charge weight was sufficient to ignite thedust, a second pressure rise resulted from the propagating oil shaledust explosion, as shown in the bottom trace of figure 27. Themagnitude of this second pressure rise depended on the type andamount of dust and explosive being tested. Instrumentation forthese tests included flame sensors, pressure transducers, an infraredpyrometer, optical dust probes, and a high-speed camera.
Minimum Charge Weight for Ignition
The first series of tests (58) focused on determining theminimum amount of explosive (unstemmed) that would ignitePittsburgh pulverized coal (PPC) dust and various grades of oilshale dust. The PPC, a reference dust, was tested strictly forcomparison purposes. In these tests, an explosible concentration ofeach dust was predispersed from the air dispersion troughs beforethe detonation of the explosive charge. The blasting agents(charges) were detonated within the 57-mm-diam bore steelcannon, and the combustion products dis- charged from the cannoninto the dust cloud. Three blasting agents (ANFO, theexperimental emulsion, and the 50:50
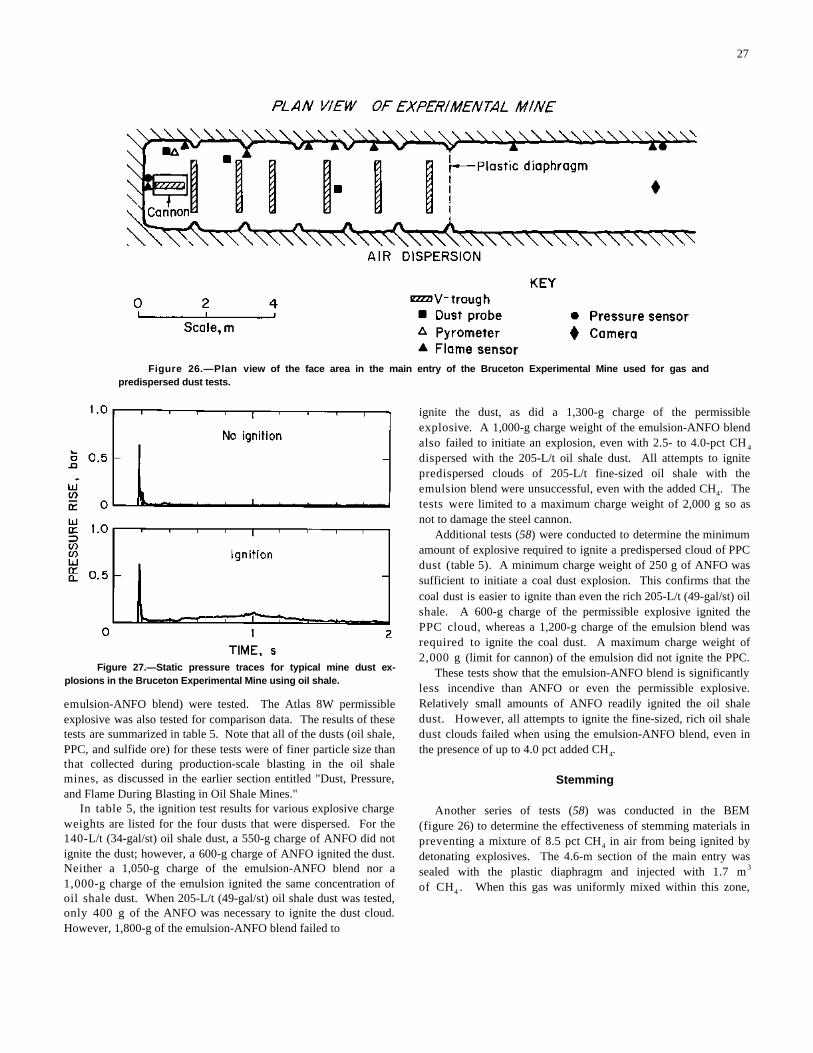
27
Figure 26.—Plan view of the face area in the main entry of the Bruceton Experimental Mine used for gas andpredispersed dust tests.
Figure 27.—Static pressure traces for typical mine dust ex-plosions in the Bruceton Experimental Mine using oil shale.
emulsion-ANFO blend) were tested. The Atlas 8W permissibleexplosive was also tested for comparison data. The results of thesetests are summarized in table 5. Note that all of the dusts (oil shale,PPC, and sulfide ore) for these tests were of finer particle size thanthat collected during production-scale blasting in the oil shalemines, as discussed in the earlier section entitled "Dust, Pressure,and Flame During Blasting in Oil Shale Mines."
In table 5, the ignition test results for various explosive chargeweights are listed for the four dusts that were dispersed. For the140-L/t (34-gal/st) oil shale dust, a 550-g charge of ANFO did notignite the dust; however, a 600-g charge of ANFO ignited the dust.Neither a 1,050-g charge of the emulsion-ANFO blend nor a1,000-g charge of the emulsion ignited the same concentration ofoil shale dust. When 205-L/t (49-gal/st) oil shale dust was tested,only 400 g of the ANFO was necessary to ignite the dust cloud.However, 1,800-g of the emulsion-ANFO blend failed to
ignite the dust, as did a 1,300-g charge of the permissibleexplosive. A 1,000-g charge weight of the emulsion-ANFO blendalso failed to initiate an explosion, even with 2.5- to 4.0-pct CH4dispersed with the 205-L/t oil shale dust. All attempts to ignitepredispersed clouds of 205-L/t fine-sized oil shale with theemulsion blend were unsuccessful, even with the added CH . The4
tests were limited to a maximum charge weight of 2,000 g so asnot to damage the steel cannon.
Additional tests (58) were conducted to determine the minimumamount of explosive required to ignite a predispersed cloud of PPCdust (table 5). A minimum charge weight of 250 g of ANFO wassufficient to initiate a coal dust explosion. This confirms that thecoal dust is easier to ignite than even the rich 205-L/t (49-gal/st) oilshale. A 600-g charge of the permissible explosive ignited thePPC cloud, whereas a 1,200-g charge of the emulsion blend wasrequired to ignite the coal dust. A maximum charge weight of2,000 g (limit for cannon) of the emulsion did not ignite the PPC.
These tests show that the emulsion-ANFO blend is significantlyless incendive than ANFO or even the permissible explosive.Relatively small amounts of ANFO readily ignited the oil shaledust. However, all attempts to ignite the fine-sized, rich oil shaledust clouds failed when using the emulsion-ANFO blend, even inthe presence of up to 4.0 pct added CH .4
Stemming
Another series of tests (58) was conducted in the BEM(figure 26) to determine the effectiveness of stemming materials inpreventing a mixture of 8.5 pct CH in air from being ignited by4
detonating explosives. The 4.6-m section of the main entry wassealed with the plastic diaphragm and injected with 1.7 m3
of CH . When this gas was uniformly mixed within this zone,4
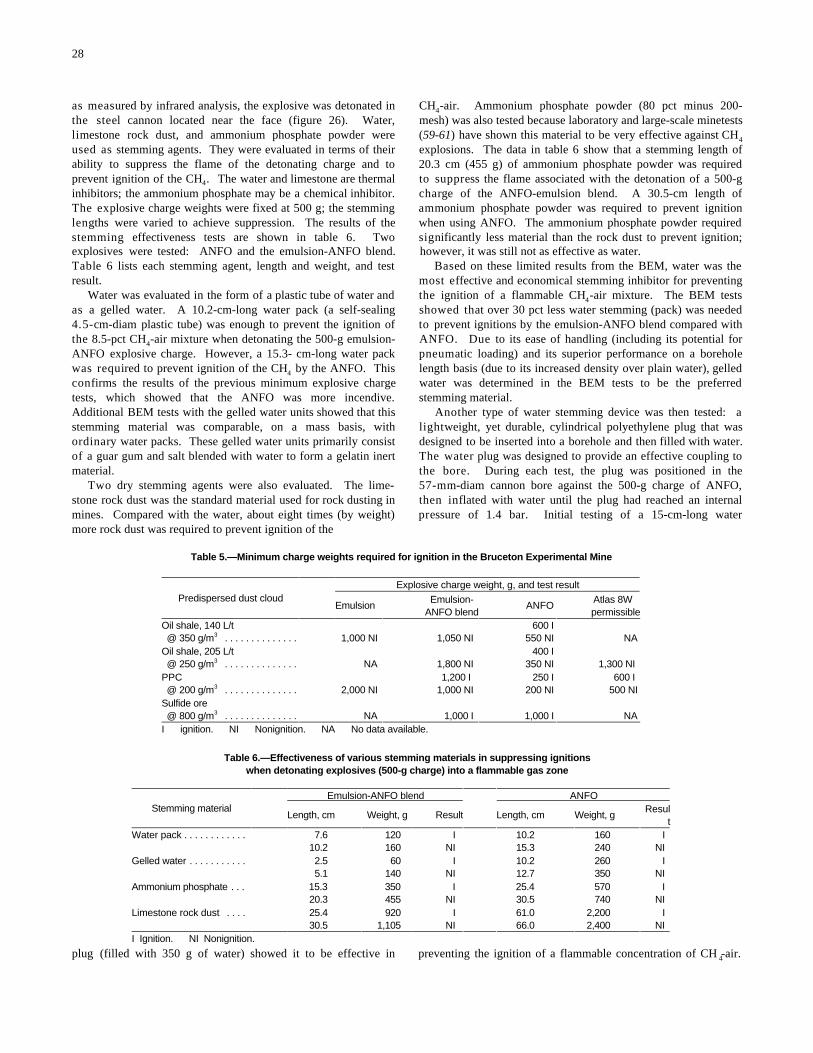
28
as measured by infrared analysis, the explosive was detonated in CH -air. Ammonium phosphate powder (80 pct minus 200-the steel cannon located near the face (figure 26). Water, mesh) was also tested because laboratory and large-scale minetestslimestone rock dust, and ammonium phosphate powder were (59-61) have shown this material to be very effective against CHused as stemming agents. They were evaluated in terms of their explosions. The data in table 6 show that a stemming length ofability to suppress the flame of the detonating charge and to 20.3 cm (455 g) of ammonium phosphate powder was requiredprevent ignition of the CH . The water and limestone are thermal to suppress the flame associated with the detonation of a 500-g4
inhibitors; the ammonium phosphate may be a chemical inhibitor.charge of the ANFO-emulsion blend. A 30.5-cm length ofThe explosive charge weights were fixed at 500 g; the stemming ammonium phosphate powder was required to prevent ignitionlengths were varied to achieve suppression. The results of the when using ANFO. The ammonium phosphate powder requiredstemming effectiveness tests are shown in table 6. Two significantly less material than the rock dust to prevent ignition;explosives were tested: ANFO and the emulsion-ANFO blend. however, it was still not as effective as water.Table 6 lists each stemming agent, length and weight, and test Based on these limited results from the BEM, water was theresult. most effective and economical stemming inhibitor for preventing
Water was evaluated in the form of a plastic tube of water and the ignition of a flammable CH -air mixture. The BEM testsas a gelled water. A 10.2-cm-long water pack (a self-sealing showed that over 30 pct less water stemming (pack) was needed4.5-cm-diam plastic tube) was enough to prevent the ignition of to prevent ignitions by the emulsion-ANFO blend compared withthe 8.5-pct CH -air mixture when detonating the 500-g emulsion- ANFO. Due to its ease of handling (including its potential for4
ANFO explosive charge. However, a 15.3- cm-long water pack pneumatic loading) and its superior performance on a boreholewas required to prevent ignition of the CH by the ANFO. This length basis (due to its increased density over plain water), gelled4
confirms the results of the previous minimum explosive charge water was determined in the BEM tests to be the preferredtests, which showed that the ANFO was more incendive. stemming material.Additional BEM tests with the gelled water units showed that this Another type of water stemming device was then tested: astemming material was comparable, on a mass basis, with lightweight, yet durable, cylindrical polyethylene plug that wasordinary water packs. These gelled water units primarily consist designed to be inserted into a borehole and then filled with water.of a guar gum and salt blended with water to form a gelatin inertThe water plug was designed to provide an effective coupling tomaterial. the bore. During each test, the plug was positioned in the
Two dry stemming agents were also evaluated. The lime-57-mm-diam cannon bore against the 500-g charge of ANFO,stone rock dust was the standard material used for rock dusting in then inflated with water until the plug had reached an internalmines. Compared with the water, about eight times (by weight) pressure of 1.4 bar. Initial testing of a 15-cm-long watermore rock dust was required to prevent ignition of the
4
4
4
Table 5.—Minimum charge weights required for ignition in the Bruceton Experimental Mine
Predispersed dust cloudExplosive charge weight, g, and test result
Emulsion ANFO Emulsion- Atlas 8W ANFO blend permissible
Oil shale, 140 L/t 600 I @ 350 g/m . . . . . . . . . . . . . .3 1,000 NI 1,050 NI 550 NI NA Oil shale, 205 L/t 400 I @ 250 g/m . . . . . . . . . . . . . .3 NA 1,800 NI 350 NI 1,300 NI PPC 1,200 I 250 I 600 I @ 200 g/m . . . . . . . . . . . . . .3 2,000 NI 1,000 NI 200 NI 500 NI Sulfide ore @ 800 g/m . . . . . . . . . . . . . .3 NA 1,000 I 1,000 I NA I ignition. NI Nonignition. NA No data available.
Table 6.—Effectiveness of various stemming materials in suppressing ignitionswhen detonating explosives (500-g charge) into a flammable gas zone
Stemming materialEmulsion-ANFO blend ANFO
Length, cm Weight, g Result Length, cm Weight, gResul
tWater pack . . . . . . . . . . . . 7.6 120 I 10.2 160 I
10.2 160 NI 15.3 240 NI Gelled water . . . . . . . . . . . 2.5 60 I 10.2 260 I
5.1 140 NI 12.7 350 NI Ammonium phosphate . . . 15.3 350 I 25.4 570 I
20.3 455 NI 30.5 740 NI Limestone rock dust . . . . 25.4 920 I 61.0 2,200 I
30.5 1,105 NI 66.0 2,400 NI I Ignition. NI Nonignition.
plug (filled with 350 g of water) showed it to be effective in preventing the ignition of a flammable concentration of CH -air.4
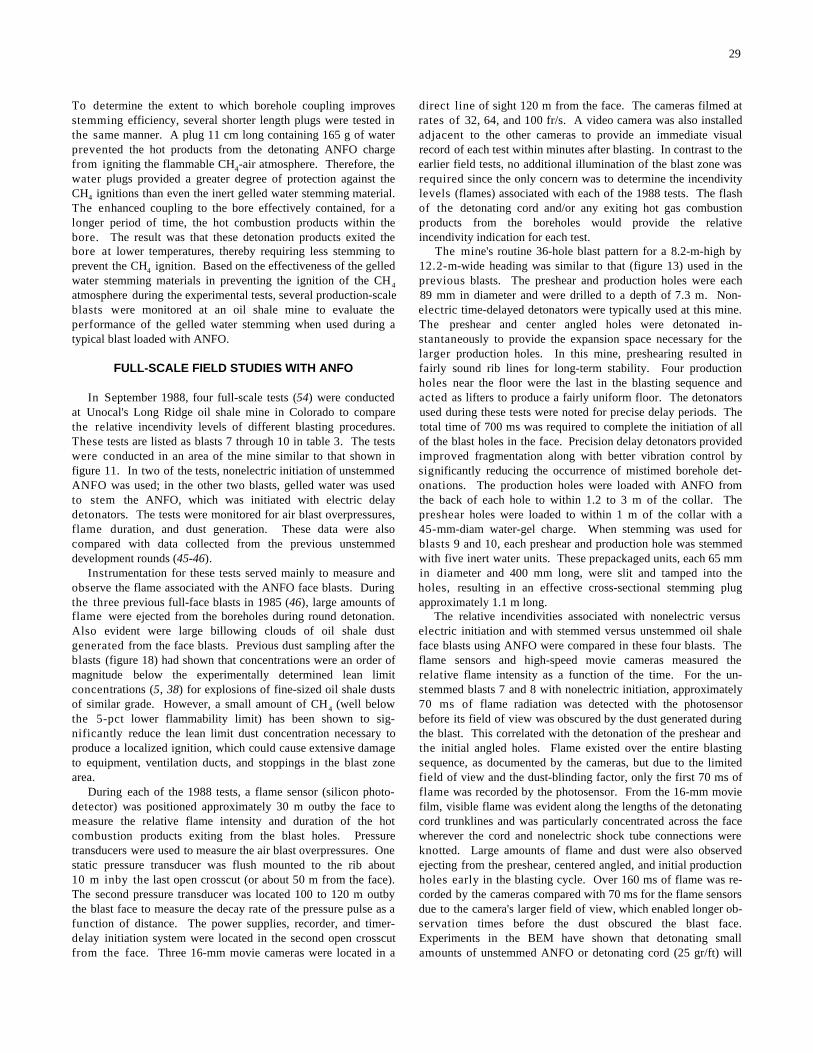
29
To determine the extent to which borehole coupling improves direct line of sight 120 m from the face. The cameras filmed atstemming efficiency, several shorter length plugs were tested in rates of 32, 64, and 100 fr/s. A video camera was also installedthe same manner. A plug 11 cm long containing 165 g of water adjacent to the other cameras to provide an immediate visualprevented the hot products from the detonating ANFO charge record of each test within minutes after blasting. In contrast to thefrom igniting the flammable CH -air atmosphere. Therefore, the earlier field tests, no additional illumination of the blast zone was4
water plugs provided a greater degree of protection against therequired since the only concern was to determine the incendivityCH ignitions than even the inert gelled water stemming material. levels (flames) associated with each of the 1988 tests. The flash4
The enhanced coupling to the bore effectively contained, for a of the detonating cord and/or any exiting hot gas combustionlonger period of time, the hot combustion products within the products from the boreholes would provide the relativebore. The result was that these detonation products exited the incendivity indication for each test.bore at lower temperatures, thereby requiring less stemming to The mine's routine 36-hole blast pattern for a 8.2-m-high byprevent the CH ignition. Based on the effectiveness of the gelled 12.2-m-wide heading was similar to that (figure 13) used in the4
water stemming materials in preventing the ignition of the CH previous blasts. The preshear and production holes were each4
atmosphere during the experimental tests, several production-scale 89 mm in diameter and were drilled to a depth of 7.3 m. Non-blasts were monitored at an oil shale mine to evaluate the electric time-delayed detonators were typically used at this mine.performance of the gelled water stemming when used during aThe preshear and center angled holes were detonated in-typical blast loaded with ANFO. stantaneously to provide the expansion space necessary for the
FULL-SCALE FIELD STUDIES WITH ANFO fairly sound rib lines for long-term stability. Four production
In September 1988, four full-scale tests (54) were conducted acted as lifters to produce a fairly uniform floor. The detonatorsat Unocal's Long Ridge oil shale mine in Colorado to compare used during these tests were noted for precise delay periods. Thethe relative incendivity levels of different blasting procedures. total time of 700 ms was required to complete the initiation of allThese tests are listed as blasts 7 through 10 in table 3. The tests of the blast holes in the face. Precision delay detonators providedwere conducted in an area of the mine similar to that shown in improved fragmentation along with better vibration control byfigure 11. In two of the tests, nonelectric initiation of unstemmed significantly reducing the occurrence of mistimed borehole det-ANFO was used; in the other two blasts, gelled water was usedonations. The production holes were loaded with ANFO fromto stem the ANFO, which was initiated with electric delay the back of each hole to within 1.2 to 3 m of the collar. Thedetonators. The tests were monitored for air blast overpressures,preshear holes were loaded to within 1 m of the collar with aflame duration, and dust generation. These data were also45-mm-diam water-gel charge. When stemming was used forcompared with data collected from the previous unstemmed blasts 9 and 10, each preshear and production hole was stemmeddevelopment rounds (45-46). with five inert water units. These prepackaged units, each 65 mm
Instrumentation for these tests served mainly to measure and in diameter and 400 mm long, were slit and tamped into theobserve the flame associated with the ANFO face blasts. During holes, resulting in an effective cross-sectional stemming plugthe three previous full-face blasts in 1985 (46), large amounts of approximately 1.1 m long.flame were ejected from the boreholes during round detonation. The relative incendivities associated with nonelectric versusAlso evident were large billowing clouds of oil shale dust electric initiation and with stemmed versus unstemmed oil shalegenerated from the face blasts. Previous dust sampling after the face blasts using ANFO were compared in these four blasts. Theblasts (figure 18) had shown that concentrations were an order of flame sensors and high-speed movie cameras measured themagnitude below the experimentally determined lean limit relative flame intensity as a function of the time. For the un-concentrations (5, 38) for explosions of fine-sized oil shale dusts stemmed blasts 7 and 8 with nonelectric initiation, approximatelyof similar grade. However, a small amount of CH (well below 70 ms of flame radiation was detected with the photosensor4
the 5-pct lower flammability limit) has been shown to sig- before its field of view was obscured by the dust generated duringnificantly reduce the lean limit dust concentration necessary to the blast. This correlated with the detonation of the preshear andproduce a localized ignition, which could cause extensive damage the initial angled holes. Flame existed over the entire blastingto equipment, ventilation ducts, and stoppings in the blast zone sequence, as documented by the cameras, but due to the limitedarea. field of view and the dust-blinding factor, only the first 70 ms of
During each of the 1988 tests, a flame sensor (silicon photo- flame was recorded by the photosensor. From the 16-mm moviedetector) was positioned approximately 30 m outby the face to film, visible flame was evident along the lengths of the detonatingmeasure the relative flame intensity and duration of the hot cord trunklines and was particularly concentrated across the facecombustion products exiting from the blast holes. Pressure wherever the cord and nonelectric shock tube connections weretransducers were used to measure the air blast overpressures. Oneknotted. Large amounts of flame and dust were also observedstatic pressure transducer was flush mounted to the rib about ejecting from the preshear, centered angled, and initial production10 m inby the last open crosscut (or about 50 m from the face). holes early in the blasting cycle. Over 160 ms of flame was re-The second pressure transducer was located 100 to 120 m outby corded by the cameras compared with 70 ms for the flame sensorsthe blast face to measure the decay rate of the pressure pulse as a due to the camera's larger field of view, which enabled longer ob-function of distance. The power supplies, recorder, and timer- servation times before the dust obscured the blast face.delay initiation system were located in the second open crosscut Experiments in the BEM have shown that detonating smallfrom the face. Three 16-mm movie cameras were located in a amounts of unstemmed ANFO or detonating cord (25 gr/ft) will
larger production holes. In this mine, preshearing resulted in
holes near the floor were the last in the blasting sequence and
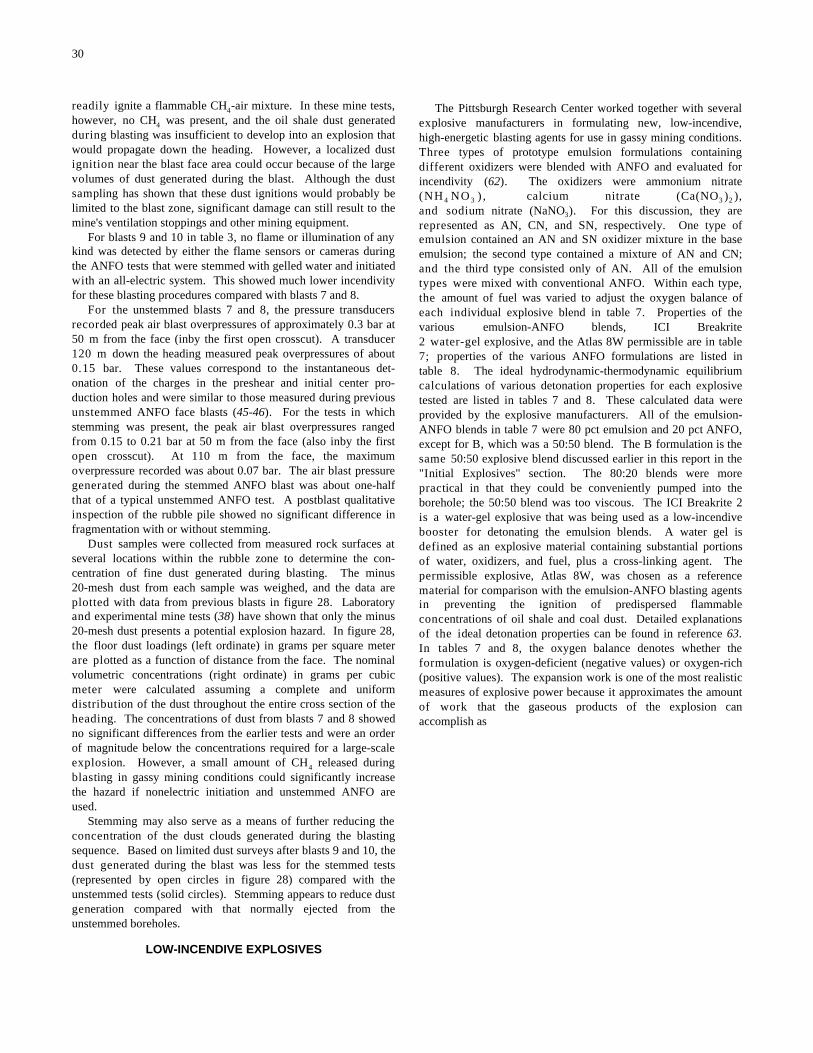
30
readily ignite a flammable CH -air mixture. In these mine tests,4
however, no CH was present, and the oil shale dust generated4
during blasting was insufficient to develop into an explosion thatwould propagate down the heading. However, a localized dustignition near the blast face area could occur because of the largevolumes of dust generated during the blast. Although the dustsampling has shown that these dust ignitions would probably belimited to the blast zone, significant damage can still result to themine's ventilation stoppings and other mining equipment.
For blasts 9 and 10 in table 3, no flame or illumination of anykind was detected by either the flame sensors or cameras duringthe ANFO tests that were stemmed with gelled water and initiatedwith an all-electric system. This showed much lower incendivityfor these blasting procedures compared with blasts 7 and 8.
For the unstemmed blasts 7 and 8, the pressure transducersrecorded peak air blast overpressures of approximately 0.3 bar at50 m from the face (inby the first open crosscut). A transducer120 m down the heading measured peak overpressures of about0.15 bar. These values correspond to the instantaneous det-onation of the charges in the preshear and initial center pro-duction holes and were similar to those measured during previousunstemmed ANFO face blasts (45-46). For the tests in whichstemming was present, the peak air blast overpressures rangedfrom 0.15 to 0.21 bar at 50 m from the face (also inby the firstopen crosscut). At 110 m from the face, the maximumoverpressure recorded was about 0.07 bar. The air blast pressuregenerated during the stemmed ANFO blast was about one-halfthat of a typical unstemmed ANFO test. A postblast qualitativeinspection of the rubble pile showed no significant difference infragmentation with or without stemming.
Dust samples were collected from measured rock surfaces atseveral locations within the rubble zone to determine the con-centration of fine dust generated during blasting. The minus20-mesh dust from each sample was weighed, and the data areplotted with data from previous blasts in figure 28. Laboratoryand experimental mine tests (38) have shown that only the minus20-mesh dust presents a potential explosion hazard. In figure 28,the floor dust loadings (left ordinate) in grams per square meterare plotted as a function of distance from the face. The nominalvolumetric concentrations (right ordinate) in grams per cubicmeter were calculated assuming a complete and uniformdistribution of the dust throughout the entire cross section of theheading. The concentrations of dust from blasts 7 and 8 showedno significant differences from the earlier tests and were an orderof magnitude below the concentrations required for a large-scaleexplosion. However, a small amount of CH released during4
blasting in gassy mining conditions could significantly increasethe hazard if nonelectric initiation and unstemmed ANFO areused.
Stemming may also serve as a means of further reducing theconcentration of the dust clouds generated during the blastingsequence. Based on limited dust surveys after blasts 9 and 10, thedust generated during the blast was less for the stemmed tests(represented by open circles in figure 28) compared with theunstemmed tests (solid circles). Stemming appears to reduce dustgeneration compared with that normally ejected from theunstemmed boreholes.
LOW-INCENDIVE EXPLOSIVES
The Pittsburgh Research Center worked together with severalexplosive manufacturers in formulating new, low-incendive,high-energetic blasting agents for use in gassy mining conditions.Three types of prototype emulsion formulations containingdifferent oxidizers were blended with ANFO and evaluated forincendivity (62). The oxidizers were ammonium nitrate(NH NO ), calcium nitrate (Ca(NO ) ),4 3 3 2
and sodium nitrate (NaNO ). For this discussion, they are3
represented as AN, CN, and SN, respectively. One type ofemulsion contained an AN and SN oxidizer mixture in the baseemulsion; the second type contained a mixture of AN and CN;and the third type consisted only of AN. All of the emulsiontypes were mixed with conventional ANFO. Within each type,the amount of fuel was varied to adjust the oxygen balance ofeach individual explosive blend in table 7. Properties of thevarious emulsion-ANFO blends, ICI Breakrite2 water-gel explosive, and the Atlas 8W permissible are in table7; properties of the various ANFO formulations are listed intable 8. The ideal hydrodynamic-thermodynamic equilibriumcalculations of various detonation properties for each explosivetested are listed in tables 7 and 8. These calculated data wereprovided by the explosive manufacturers. All of the emulsion-ANFO blends in table 7 were 80 pct emulsion and 20 pct ANFO,except for B, which was a 50:50 blend. The B formulation is thesame 50:50 explosive blend discussed earlier in this report in the"Initial Explosives" section. The 80:20 blends were morepractical in that they could be conveniently pumped into theborehole; the 50:50 blend was too viscous. The ICI Breakrite 2is a water-gel explosive that was being used as a low-incendivebooster for detonating the emulsion blends. A water gel isdefined as an explosive material containing substantial portionsof water, oxidizers, and fuel, plus a cross-linking agent. Thepermissible explosive, Atlas 8W, was chosen as a referencematerial for comparison with the emulsion-ANFO blasting agentsin preventing the ignition of predispersed flammableconcentrations of oil shale and coal dust. Detailed explanationsof the ideal detonation properties can be found in reference 63.In tables 7 and 8, the oxygen balance denotes whether theformulation is oxygen-deficient (negative values) or oxygen-rich(positive values). The expansion work is one of the most realisticmeasures of explosive power because it approximates the amountof work that the gaseous products of the explosion canaccomplish as
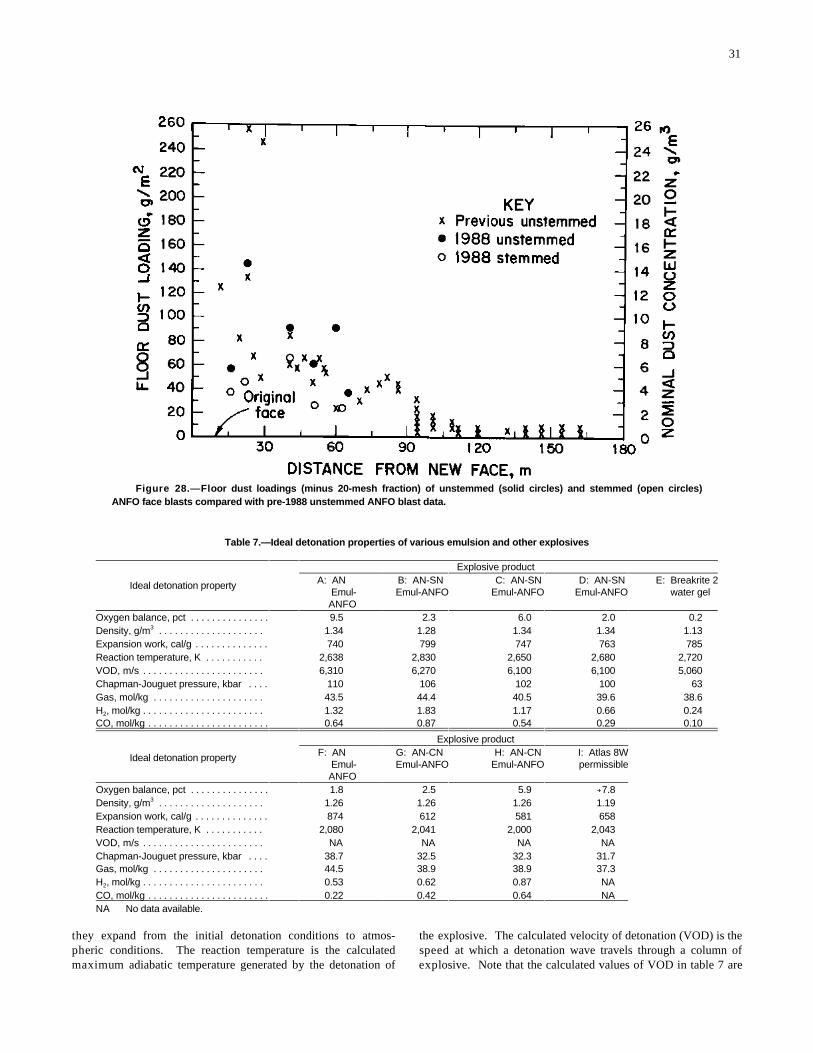
31
Figure 28.—Floor dust loadings (minus 20-mesh fraction) of unstemmed (solid circles) and stemmed (open circles)ANFO face blasts compared with pre-1988 unstemmed ANFO blast data.
Table 7.—Ideal detonation properties of various emulsion and other explosives
Ideal detonation property
Explosive productA: AN B: AN-SN C: AN-SN D: AN-SN E: Breakrite 2
Emul- Emul-ANFO Emul-ANFO Emul-ANFO water gel ANFO
Oxygen balance, pct . . . . . . . . . . . . . . . &9.5 &2.3 &6.0 &2.0 &0.2 Density, g/m . . . . . . . . . . . . . . . . . . . .3 1.34 1.28 1.34 1.34 1.13 Expansion work, cal/g . . . . . . . . . . . . . . 740 799 747 763 785 Reaction temperature, K . . . . . . . . . . . 2,638 2,830 2,650 2,680 2,720 VOD, m/s . . . . . . . . . . . . . . . . . . . . . . . 6,310 6,270 6,100 6,100 5,060 Chapman-Jouguet pressure, kbar . . . . 110 106 102 100 63 Gas, mol/kg . . . . . . . . . . . . . . . . . . . . . 43.5 44.4 40.5 39.6 38.6 H , mol/kg . . . . . . . . . . . . . . . . . . . . . . .2 1.32 1.83 1.17 0.66 0.24 CO, mol/kg . . . . . . . . . . . . . . . . . . . . . . . 0.64 0.87 0.54 0.29 0.10
Ideal detonation property
Explosive product F: AN G: AN-CN H: AN-CN I: Atlas 8W
Emul- Emul-ANFO Emul-ANFO permissibleANFO
Oxygen balance, pct . . . . . . . . . . . . . . . &1.8 &2.5 &5.9 %7.8 Density, g/m . . . . . . . . . . . . . . . . . . . .3 1.26 1.26 1.26 1.19 Expansion work, cal/g . . . . . . . . . . . . . . 874 612 581 658 Reaction temperature, K . . . . . . . . . . . 2,080 2,041 2,000 2,043 VOD, m/s . . . . . . . . . . . . . . . . . . . . . . . NA NA NA NA Chapman-Jouguet pressure, kbar . . . . 38.7 32.5 32.3 31.7 Gas, mol/kg . . . . . . . . . . . . . . . . . . . . . 44.5 38.9 38.9 37.3 H , mol/kg . . . . . . . . . . . . . . . . . . . . . . .2 0.53 0.62 0.87 NA CO, mol/kg . . . . . . . . . . . . . . . . . . . . . . . 0.22 0.42 0.64 NA NA No data available.
they expand from the initial detonation conditions to atmos- the explosive. The calculated velocity of detonation (VOD) is thepheric conditions. The reaction temperature is the calculated speed at which a detonation wave travels through a column ofmaximum adiabatic temperature generated by the detonation ofexplosive. Note that the calculated values of VOD in table 7 are
32
considerably higher than the experimental values listed earlier in To help understand this potential source of excess fuel (fromthe "Initial Explosives" section. The Chapman-Jouguet (C-J) the explosive) burning outside the cannon, experimental testspressure is the calculated pressure behind the rear boundary, orwere conducted in the Crawshaw-Jones apparatus (56), which isC-J plane, of the detonation front. Finally, tables 7 and 8 list the used for determining explosive gas production. The test wastotal gas produced per kilogram of explosive, the amount ofperformed by detonating 300 g of a given explosive in a steelhydrogen (H ) produced, and the amount of carbon monoxidecannon and collecting the expansion products in a 90-L evacu-2
(CO) produced. ated chamber. The gases were analyzed by standard gas chroma-
Table 8.—Ideal detonation properties of various ANFO formulations
ANFO ANFO ANFO ANFO96:4 95:5 94:6 92:8
Oxygen balance, pct . . . . . . . . . . . . . . . +5.4 +1.8 -1.8 -9.1Density, g/m . . . . . . . .3 0.85 0.85 0.85 0.85Expansion work, cal/g . . . . . . . . . . . . . . 785 875 906 850Reaction temper- ature, K . . . . . . . . . . . 2,820 3,060 3,140 2,990VOD, m/s . . . . . . . . . . . 4,420 4,620 4,760 4,770Chapman-Jouguet pressure, kbar . . . . . 42 46 48 49Gas, mol/kg . . . . . . . . . 43.4 43.3 43.8 45.7H , mol/kg . . . . . . . . . . .2 <0.01 <0.01 0.75 3.63CO, mol/kg . . . . . . . . . . <0.01 <0.01 0.33 1.75
Two important factors to consider when formulating low-incendive explosives are the oxygen balance and the detonationreaction temperature. As might be expected, a correlation be-tween the explosive's detonation reaction temperature and itsincendivity was evident from these limited number of explosiveproducts and will be discussed in the subsequent section entitled"Lake Lynn Cannon Gallery Tests." Some effects of the oxygenbalance of the explosive formulation will be discussed here.Table 7 indicates that in the negative oxygen balance cases(excess fuel), there was not enough oxygen to oxidize all of thefuel and to convert all of the CO to carbon dioxide (CO ); there-2
fore, H and CO were formed. The higher the negative oxygen2
balance, the more excess hot H and CO would be discharged2
from the borehole. It is believed that this excess hot fuel, par-ticularly the H with its very high diffusivity, expands from the2
borehole, mixes with the air, and then burns. Experimentally, thelean flammability limit for H at 25 EC is 4 pct for upward, 6 pct2
for horizontal, and 8 pct for downward propagation (64-65).Using the Burgess-Wheeler law (42, 64) to extrapolate to highertemperatures, the limits for upward propagation would be 1.9 pctat 500 EC and 0.6 pct at 800 EC. In addition, H -air self-ignites2
at temperatures above 500 EC (43).The detonation of a stoichiometric ANFO mixture (94.4 pct
AN and 5.6 pct FO) can be approximated by the followingreaction by using CH to approximate the fuel oil:2
3NH NO % CH 6 3N % 7H O % CO . (A)4 3 2 2 2 2
The amount and type of products will change as a function of theFO content. The ideal detonation properties calculated for AN:FOratios of 96:4, 95:5, 94:6, and 92:8 are listed in ta-ble 8. When the amount of FO falls below 5.6 pct, the reactionis oxygen-positive and nitric oxides are produced. By contrast,a negative oxygen balance (excess fuel) tends to generate H and2
CO (66).
tography. Table 9 lists the gas analyses from the Crawshaw-Jones tests for the ANFO formulations, the emulsion-ANFOblends, and the other explosives. There is relative agreement be-tween the experimental data for ANFO in table 9 and the cal-culations in table 8 in that the predicted H and CO concen-2
trations increase with increasing FO in both tables, even thoughthe experimental data show higher gas values for each formu-lation. For all except one of the emulsion blends tested, the datain table 9 show that the blends produced less H and CO than2
standard ANFO (94:6). The blend that produced more H and2
CO than standard ANFO was the emulsion blend A, which hada high negative oxygen balance (&9.5). Generally, the moreoxygen-balanced blends produced less H and CO than the2
negative oxygen blends when comparing similar formulations.Likewise, the blends that contained only AN in the base emulsiongenerally produced more H and CO than those containing SN or2
CN in the base emulsion when all other factors remainedrelatively constant. In general, relatively good agreement be-tween the experimental Crawshaw-Jones data (table 9) and theequilibrium calculations (table 7) was shown for the emulsionblends.
Table 9.—Crawshaw-Jones data for various explosive products
ExplosiveGases produced, mol/kg
H CO NO2 x
ANFO 96:4 . . . . 0.13 0.23 0.47ANFO 95:5 . . . . .81 .62 .31ANFO 94:6 . . . . 1.45 1.09 .14Blend A . . . . . . . 1.81 1.05 .02Blend B . . . . . . . .15 .44 1.64Blend D . . . . . .09 .20 .72Water gel E . . .78 .41 .04Blend F . . . . . . . .67 .54 .07Blend G . . . . . . .36 .38 .60Blend H . . . . . .80 .70 .26Permissible I . 1.53 1.54 .04
To study the possible ignition of the excess fuel from theexplosives, high-speed photographs were taken of the hot det-onation products exiting from a steel cannon (57-mm-diam bore).Results indicated that the time duration of the flame outside thecannon increased with increasing fuel content. Flame durationsranged from 5 to 10 ms for the near oxygen-balanced emulsionsto 30 to 40 ms for the fuel-rich formulations. It was believed thatthis longer lasting envelope of flame was contributing to theincendivity of these formulations. This flame envelope wasbelieved to be associated with the hot combustible fuels,particularly due to the high diffusivity of H , which mixed with2
atmospheric oxygen and burned outside the borehole.Because of the possibility that prilled ANFO (prill diameter
range from 1,100 to 1,600 µm) was less able to sustain a steadydetonation in the 57-mm-diam borehole compared with largerdiameter holes and thus might be contributing to the incendivity
33
Figure 29.—Flame exiting from cannon after detonation ofblasting agent. (Photo by Kenneth L. Cashdollar, Pittsburgh Re-search Center.)
through incomplete detonation, tests were conducted with aground ANFO (<840 µm) to obtain a higher bulk density in anattempt to approach more ideal detonation conditions. In-cendivity tests (similar to those described earlier in the sectionentitled "Bruceton Experimental Mine Tests") showed about thesame level of incendivity with either prill or ground AN for both5 and 6 pct FO formulations of ANFO.
LAKE LYNN CANNON GALLERY TESTS
To facilitate the continuing research into the development ofthe low-incendivity explosives, the testing program was relocatedfrom the BEM to a surface gallery at Lake Lynn Laboratory nearFairchance, Fayette County, PA. The use of the surface galleryeliminated the mandatory delays that were encountered during themine tests for the removal of the detonation and combustiongases.
The Lake Lynn cannon gallery (LLCG) is a 6.7-m-long by2.4-m-diam horizontal steel cylinder open at both ends. Mountedinside the LLCG near one end is a 1.5-m long by 0.6-m-diamsteel cannon with a 57-mm-diam by 1.2-m-long bore. Figure 29shows an example of flame exiting from the cannon afterdetonation of a blasting agent. In the standard LLCG tests, theflame and combustion products from a detonating explosivecharge exit the cannon toward the geometric center of the gallery,where combustible dust has been predispersed or an atmosphereof flammable CH -air is present. An example of coal dust ignited4
by unstemmed ANFO in the LLCG is shown in figure 30.Various explosives have been tested in the LLCG as possible
replacements for ANFO, which is an inexpensive blasting agentthat is used effectively in many noncoal mining operations.However, ANFO is also a highly incendive product when deto-nated and has resulted in numerous dust ignitions followingblasting operations, particularly in sulfide ore mines in Alaskaand Canada. Also, CH is present in some deep oil shale forma-4
tions (4, 52-53), and blasting with ANFO in these mines hasresulted in CH ignitions. For these reasons, research has been4
conducted to develop various replacement explosives and saferblasting procedures for use in these high-risk dust and gas areas.The research has focused on prototype emulsion and water-gelformulations as potential replacements for the ANFO that wastypically used in oil shale blasting operations and the dynamiteproduct that was commonly used in sulfide ore mines. The pro-totype explosive products generally exhibit good fragmentationcharacteristics and have relatively low incendivity levels com-pared with those of ANFO and dynamite. The results from thesepreliminary tests determine which explosives warrant furtherevaluation in actual full-scale mining operations.
One of the LLCG tests determined the amount of stemmingrequired to prevent the hot combustion products (from the ex-plosive) from igniting a flammable atmosphere of CH-air. For4
this incendivity test with CH , a fixed-weight 500-g explosive4
charge was loaded to the back of the steel cannon. Variousamounts of inert gelled water stemming (in 50-g increments) weretamped against the charge. The CH was then injected into4
the gallery and was contained between plastic diaphragms securedat both ends of the gallery. A small fan (with explosion-proofmotor housing) located inside the gallery mixed the CH with the4
air to provide a uniform flammable concentration. The CH4
concentration was continuously monitored by sampling througha small tube extending from the gallery to an infrared CH4
analyzer. The tests were made at a concentration of about 9.4 pctCH -in-air.4
For the dust incendivity tests in the LLCG, a 5.0-m-long steelV-trough was positioned on the gallery floor in front of thecannon. Detonating cord was attached to the bottom of the V-trough, and PPC dust was loaded on top of the cord. The ini-tiation of the detonating cord resulted in the dispersal of the dust.The unstemmed charge in the cannon was subsequently initiatedafter a 500-ms delay to allow sufficient time for the dust todisperse throughout the gallery. The objective of this test was todetermine the minimum amount of unstemmed charge that wouldignite the dust cloud (figure 30). The standard PPC dust wasused during these tests due to its low flammability limit, the easein which it dispersed, and its availability. This PPC dust has beenused for many years as a comparison standard for flammability(44). The unstemmed explosive charge weight that would ignitethe dust was only a relative indicator of the explosive'sincendivity characteristics compared with actual blastingoperations. The LLCG incendivity results were conservativebecause coal dust ignites more readily than oil shale or sulfide oredusts and there was no borehole expansion work done in thecannon as would occur in rock. However, previous data(described earlier in the section entitled "Bruceton ExperimentalMine Tests") had shown that the relative incendivity ranking ofvarious explosive products that were tested against predispersedcoal dust maintained their ranking compared with similar testsusing predispersed oil shale dust clouds of varying grade or assay.
The explosives were received from the manufacturer in a pre-packaged or bulk form. All of the explosives were tested in
34
Figure 30—Coal dust ignited by unstemmed ANFO at the Lake Lynn cannon gallery showing flame exiting from both ends. (Photoby Kenneth L. Cashdollar, Pittsburgh Research Center.)
approximately 50-mm-diam packages and were loaded and (for both the stemmed explosives detonating into CH and thetamped firmly to the back of the steel cannon. With the unstemmed explosives detonating into predispersed PPC dust)prepackaged explosives, the manufacturer delivered the product was verified by at least three LLCG tests.already packaged in the 50-mm diameter. The bulk repumpable Incendivity tests were conducted in the LLCG to determineproducts were generally delivered in 11-kg units, which, before preferred explosives that would reduce the probability of ig-loading into the cannon, were repackaged in nitions during blasting operations under gassy mine conditions.50-mm-diam polyethylene lay-flat tubing. All of the cap- Experiments in the LLCG have shown that the detonation ofsensitive charges were initiated with a No. 8 strength copper unstemmed 500-g charges of standard ANFO (94:6) readilydetonator. In addition to the detonator, a PETN-based booster ignited flammable concentrations of CH and/or fine oil shaleunit was used with the blasting agents. An incision was made dust. To study this incendivity level, tests were conducted withalong the length of the stemming package containing the inertvarious ANFO formulations. A 500-g charge of standard ANFOgelled water material. The stemming unit was then loaded into required 350 g of a tamped, gelled water stemming material tothe cannon bore and tamped firmly against the explosive charge, prevent the hot combustion products from igniting thewhich resulted in an effective coupling of the stemming and surrounding CH mixture in the LLCG. When the FO content ofexplosive to the cannon bore. The ANFO was prepared on-site the ANFO was increased to 8 pct, an increased amount of gelledwith an approximate loading density of water stemming (400 g total) was required to prevent the CH0.88 g/cm . The other explosives were supplied by the manu- ignition (table 10). Conversely, when the FO content was3
facturers with densities ranging from 1.25 to 1.34 g/cm for the decreased to 4 pct, only 250 g of tamped gelled water was3
emulsion-ANFO blends, 1.12 to 1.20 g/cm for the emulsions, necessary to prevent the CH ignition. However, as the3
1.3 g/cm for the water gels, and 0.95 g/cm for the semigelatin incendivity characteristics of the ANFO were reduced by3 3
dynamite product. decreasing the FO content, the production of toxic nitric oxidesThe LLCG tests were to be used as one of many relative in- was increased (table 9).
dicators of an explosive's incendivity characteristics and were not Incendivity tests were also conducted in the LLCG with newpart of any standardized testing schedule for evaluating and reformulated emulsion-ANFO blasting agents as receivedexplosives used during blasting operations in noncoal mines.from various explosive manufacturers. The pumpable blendsHowever, a degree of uniformity and reproducibility was strived consisted of 80 pct emulsion and 20 pct ANFO. Also tested wasfor during this testing program. Incendivity tests in the LLCG blend B, which was a 50:50 mix and too viscous for pumping.were conducted only when outside temperatures were above One technique designed to significant-7 EC. Likewise, reasonable attempts were made to maintain the ly reduce an explosive's incendivity is through oxygen balancingtemperature of the candidate explosive in the range of 7 to 15 EC.This was accomplished by storing the product in an undergroundexplosive magazine. To maintain reliability of the data withlimited testing, each data point corresponding to a nonignition
4
4
4
4
4
of the formulation. Comparing the oxygen balance percentagesfound in table 7 for the emulsion-ANFO blend A (&9.5 pct) withthe emulsion blend F (&1.8 pct), an increased amount of gelledwater inert stemming was required with the emulsion blend A to
35
prevent the CH -air ignition in the LLCG, as listed in table 10. minimum of hot particles after detonation. These products4
Substitution of materials in the formulation is another techniquecontained very little aluminum, which not only is a source of hotthat can reduce an explosive's incendivity. The blends thatcontained AN (blends A and F) in the base emulsion were moreincendive (table 10) than those that contained CN (blends G andH) or SN (blends B, C, and D), thus requiring more inertstemming to prevent ignition of the CH zone under the LLCG4
test conditions. A 500-g charge of these lower incendive blendsrequired only 100 to 150 g of tamped gelled water stemming toprevent the ignition of a 9.4 pct CH-in-air zone, compared with4
350 g for the standard ANFO. The lower incendive blends, asdetermined from the LLCG tests, were essentially oxygen-balanced and substituted AN with either SN or CN in theemulsion portion of the blend. In the LLCG tests, the emulsion-ANFO blends were generally the least incendive blasting agentstested because they required the least amount of stemming toprevent ignition of the CH . Emulsion blend D exhibited the4
lowest incendivity characteristics of any of the blends and wassubsequently field tested in several oil shale mines, as describedlater in this report.
Table 10.—Gelled water inert stemming weights to preventmethane-air ignitions in the Lake Lynn cannon gallery
Maximum stemming, Minimum stemming, g, for ignition g, for nonignition
ANFO 96:4 . . . . 200 250ANFO 95:5 . . . . 300 350ANFO 94:6 . . . . 300 350ANFO 92:8 . . . . 350 400Blend A . . . . . . . 400 450Blend B . . . . . . . 60 140Blend C . . . . . 100 150Blend D . . . . . 50 100Blend F . . . . . . . 250 300Blend G . . . . . . 100 150Blend H . . . . . 100 150Water-gel A . .1 250 300Water-gel B . .2 250 300Emulsion A . .3 250 300Emulsion B . .4 200 250Dynamite . . . .5 100 150Cap-sensitive water gel.1
Water gel blasting agent.2
Emulsion blasting agent.3
Cap-sensitive emulsion.4
Cap-sensitive semigelatin dynamite.5
NOTE.—Explosive charge for each test was 500 g.
Also listed in table 10 are two prototype water-gel-basedexplosives that were tested in the LLCG. These were formulatedto have a low-detonation temperature and to produce a
particles, but can also produce H as a detonation product.2
Atmospheric air and H can form a flammable mixture, which2
could extend the duration of flame from the detonating ex-plosives. Table 10 lists the amount of inert gelled water stem-ming material required to be tamped in front of the explosivecharge in the cannon bore to prevent ignition of the CH in the4
LLCG. Water-gel explosives A and B required 300 g of the inertstemming to prevent the CH ignition, compared with 100 to4
150 g for the emulsion-ANFO blends C, D, G, and H. StandardANFO (94:6) required 350 g of the gelled water material toprevent the CH ignition. The reaction temperatures, as4
determined from hydrodynamic-thermodynamic equilibriumcalculations provided by the explosive manufacturers, were 2,000to 2,680 K for the emulsion blends (C, D, G, and H) and2,675 K for the water-gel explosives; these temperatures weresignificantly lower than the 3,140 K for ANFO. However, thewater-gel explosives showed only marginal improvement relativeto standard ANFO in preventing the CH ignitions, whereas the4
stemming requirements to prevent the CH ignition with the4
emulsion blends were much lower than those for ANFO. Thewater-gel explosives contained dissolved AN, whereas theemulsion blends replaced the AN in the 80-pct base emulsionwith CN or SN. LLCG incendivity data have shown that theexplosive products that contained AN ignited the CH more4
readily than those that consisted of other less incendive materials.The emulsions A and B and the dynamite listed in table 10 willbe discussed below.
Table 11 lists the maximum unstemmed charge weight fornonignition and the minimum unstemmed charge weightfor ignition of an explosible, predispersed concentration(200 g/m ) of PPC dust in the LLCG. Coal dust was used during3
these tests due to its availability. The PPC dust is even morehazardous than oil shale or sulfide dust; it is more easily ignitedand requires less dust to form an explosible concentration.Therefore, the LLCG data in table 11 are conservative and areonly a relative indicator of an explosive product's incendivity.When detonating unstemmed charges from the steel cannon in theLLCG, all of the hot combustion products were ejected out of thebore and into the CH or dust atmosphere. When detonating in4
ore, much of the hot combustion products are rapidly cooledduring the fragmentation process by the rock, which is a naturalthermal sink. Standard ANFO detonated unstemmed from the57-mm-diam bore readily ignited the coal dust cloud in chargeweights as low as 100 g. It required 2,000 g of the unstemmedemulsion blend D to ignite the PPC dust; a 1,750-g charge didnot ignite the dust. With the water-gel explosives A and B, amaximum cannon charge weight of 2,000 g did not ignite thePPC dust cloud with either explosive. Unstemmed 800-g chargesof the emulsion A ignited the dust; 750-g charges did not.
36
Table 11.—Relative incendivity of unstemmed explosives in a flammable coal dust cloud at the Lake Lynn cannon gallery
ExplosiveMinimum charge, g, Maximum charge, g,
for ignition for nonignition ANFO 96:4 . . . . 100 NABlend D . . . . . . 2,000 1,750Water gel A . . .1 >2,000 2,000Water gel B . . .2 >2,000 2,000Emulsion A . . .3 850 750Emulsion B . . .4 500 400Dynamite . . . . . .5 300 250
NA No data available.Cap-sensitive water gel.1
Water-gel blasting agent.2
Emulsion blasting agent.3
Cap-sensitive emulsion.4
Cap-sensitive semigelatin dynamite.5
NOTE.—Maximum cannon charge weight was 2,000 g.
The two water-gel explosives, the ANFO-emulsion blend Dand the emulsion A, showed desirable low-incendive charac-teristics compared with those of ANFO when detonatedunstemmed into an explosible concentration of PPC dust in theLLCG. The water gel A and the emulsion A explosives havealso, to date, eliminated the dust ignition hazards associated withblasting operations in sulfide ore mines (as discussed later in thesection entitled "Full-Scale Validation Tests in Sulfide OreMines"). It is presently unclear why the water-gel explosivesexhibited lower incendivity characteristics relative to the coal dustthan to the CH . It is also uncertain why the dynamite showed4
low incendivity against CH in table 10, but high incendivity4
against coal dust in table 11.In the LLCG tests, a correlation appeared to exist between an
explosive's detonation reaction temperature and its incendivity.ANFO (94:6) was chosen as a reference explosive because it wasused extensively for blasting operations in oil shale mines andwas also used at times for blasting in sulfide ore mines. TheANFO (94:6) required 350 g of inert gelled water stemming toprevent the CH ignition in the LLCG tests. Comparing the4
minimum stemming requirement (table 10) for each explosivewith its ideal detonation reaction temperature (listed in tables 7and 8), the following correlation can be drawn. Explosives (95:5ANFO, 94:6 ANFO, 92:8 ANFO, and blend A) that requiredstemming of 350 g or more to prevent the CH ignition had4
detonation reaction temperatures ranging from 2,638 to 3,140 K(average of 2,957 K). Explosives (blends B, C, D, F, G, and H;96:4 ANFO; and water-gel A) that required 300 g or less of inertstemming to prevent the CH ignition had detonation reaction4
temperatures ranging from 2,000 to 2,830 K (average of2,478 K). Based on these limited data, an explosive's incendivitycan be correlated generally with its reaction temperature.However, many factors, including the water content of theexplosive product and the type of oxidizer used, influence thisdetonation reaction temperature. Of the four most incendive ex-plosives in table 10, the one (blend A) with the lowest reactiontemperature had a
large negative oxygen balance, which would make it moreincendive than other explosives with similar reaction tem-peratures. Therefore, the final comparison with incendivity mustinclude both reaction temperature and oxygen balance.
Tests were also conducted in the LLCG to evaluate theexplosives' luminosity because the extent of flame outside thecannon was presumably related to the incendivity. In these tests,500-g charges of various stemmed and unstemmed explosiveswere loaded into the cannon and detonated, thereby allowing thecombustion products to discharge into the gallery. An opticalflame sensor was mounted inside the gallery to measure, in termsof duration and intensity, the flame exiting from the cannon bore.With standard ANFO, the detonation of an unstemmed chargeproduced highly luminous byproducts that were observed forover 15 ms. The unstemmed water gel and ANFO-emulsionblend explosives each produced a 12-ms flame with a 50 pctlower relative luminosity than the ANFO. The explosives werethen stemmed with 150 g of a tamped inert gelled water materialto evaluate the effect of the stemming on the detonation by-product luminosity. The gelled water stemming contained thedetonation products within the bore for a longer period, resultingin a lowering of the temperatures of these products before exitingfrom the bore. The detonation of the stemmed ANFO charge stillresulted in 15 ms of luminosity; however, the intensity was at areduced level. The stemmed water gel and ANFO-emulsionblend explosive charges showed no evidence of any luminosityfrom the detonation byproducts exiting from the cannon bore.
In summary, the LLCG tests evidenced that an explosive'sformulation can be altered to result in a product that exhibits low-incendive characteristics relative to its tendency to ignitecombustible dusts and/or CH . The incendivity of an explosive4
product depends on many of the factors previously discussed,including oxygen balance, detonation reaction temperature, andtype of oxidizer used. Field evaluations with the explosiveproducts that exhibited lower incendivity characteristics were thenconducted during production-scale oil shale and base metalmining operations.
FULL-SCALE FIELD TESTS WITHA LOW-INCENDIVE BLEND
During the next phase of the program, full-scale validationtests (single-hole, multiple-hole, and full-face blasts) wereconducted using the emulsion blend D with the inert gelled waterstemming in two Colorado oil shale mines in the presence ofshale dust and/or CH (67).4
Unocal's Long Ridge Mine Tests
Field tests (67) were conducted at Unocal's Long Ridge oilshale mine in August 1989 (blasts 11 through 14 in table 3) tocompare the experimental, low-incendive emulsion blend with

37
the previous ANFO field data from 1988. Instrumentation was plastic chamber that contained a flammable CH -air atmosphere.similar to that used during the 1988 tests as described in the These tests were conducted underground at Exxon's Colony Mineprevious section on "Full-Scale Field Studies With ANFO." and are not listed in table 3. They were designed to evaluate theThese tests were designed to reduce the probability of hot incendivity of two blasting agents (ANFO and the emulsion-detonation products exiting from the blast holes while still ANFO blend) through the detonating of these charges in themaintaining effective rubblization. The blasting agent used was presence of a flammable 10 pct CH -air environment. Video andthe ANFO-emulsion blend D, which was 80 pct emulsion and 2016-mm high-speed movie cameras were used to document thepct ANFO, as listed in tables 7, 10, and 11. Each 76-mm-diam detonation of the various explosive products within these holes.by 7.3-m-deep production hole was loaded with the emulsion No flame was observed with the detonation of the emulsion-blend, stemmed with a 1-m plug of gelled water inert material ANFO blend D into the CH -air zone, even with a full,(approximately 2.7-kg inert per hole), and initiated with an unstemmed column (worst-case scenario) loading in horizontalelectric millisecond delay detonator. The holes were each primed holes 76 mm in diameter and 7.3 m deep. However, ignition ofwith a 1.4-kg, 6.4-cm-diam, cap-sensitive water-gel product ("E" the CH zone was evident after the initiation of the unstemmedin table 7). This product provided for a high-energy, low- A N F O c h a r g e i n t h eincendive booster while offering a much greater degree of 76-mm-diam holes.protection against CH and/or dust ignitions, particularly when Even though the indications were that a properly stemmed4
driving crosscuts, than the commonly used, highly incendive ANFO round produced no flame generation outside the bore-PETN boosters. holes (based on the 1988 full-face blasts conducted in the absence
Unocal's standard preshearing procedure was to use a high- of CH ), the potential for a CH and/or dust ignition is greatervelocity presplit powder loaded almost to the collar, as discussed when using ANFO instead of the emulsion blend (or similar low-in the previous section on "Full-Scale Field Studies With incendive blasting agent). If one or more boreholes in the patternANFO." This was replaced during the 1989 tests with the are inadvertently left unstemmed during the loading operations inexperimental emulsion-ANFO blend D using an air-cushioning a gassy mine condition, both the experimental (BEM and LLCG)technique. For these tests, each 76-mm-diam by 7.3-m-long test results (57-58, 62) and the oil shale mine single-hole resultspreshear hole was primed with the water-gel E booster, and about (67) showed that the unstemmed hole loaded with the emulsion4.5 kg of the emulsion-ANFO blend D was then pumped in on blend should provide a much reduced probability for an ignitiontop, followed up with a half a cartridge of the water-gel E than an unstemmed hole loaded with ANFO.product. The hole then was stemmed at the collar with three units In addition to the hazards related to using standard ANFOof tamped, inert gelled water material (1-m plug), which providedcharges, a permissible system will be required to initiate thea column (approximately 5.5 m long) of air between the charge rounds when blasting in gassy mine conditions. BEM tests haveand the stemming. shown that the detonating cord typically used to initiate the
As with the stemmed ANFO shots in 1988, no flame wasrounds in the current nongassy oil shale mines will readily igniteevident outside the boreholes in 1989 after the detonation of the flammable concentrations of CH . Therefore, a permissiblestemmed emulsion blend-loaded rounds (also in the absence of initiation system, such as the all-electric system used in coalCH ). Results showed that the rock fragmentation of the mines, will be required when blasting in a gassy oil shale mine.4
emulsion-ANFO blend D in 76-mm-diam holes was at least In June 1990, another test series (69) at Unocal's Long Ridgeequivalent to or better than that of the mine's standard ANFO Mine was conducted in headings 5, 6, and 7 of production panelround in 89-mm-diam holes. The air-cushioning technique also B, as shown in figure 31. These tests are listed as blasts 15showed very encouraging results during these tests in that core through 17 in table 3. The average cross-sectional area in theseborings of the rib line showed only minor fractures 0.3 to 0.5 m headings was about 110 m . The drill hole pattern used in eachdeep compared with cracks 3 to 4 m deep into the pillars during test was similar to Unocal's standard drill hole pattern. All of thethis mine's typical blasting operations. The stemming reduced the holes in each of the three drill patterns were 89 mm in diameterair blast overpressures in half and also reduced the quantity of by 7.3 m deep. As part of the drill pattern in headings 6 and 7,dust generated during the blasting sequence. six equally spaced preshear holes were drilled along each rib; in
For both the 1988 and 1989 full-face tests (62, 67), the drill heading 5, seven preshear holes were used (figure 32). Eachpatterns, column loadings, and sequencing of detonators were pattern utilized 23 production holes, including three pairs ofsimilar to that mine's typical blasting operation described byangled holes that were designed to provide a relief area for theBaloo in reference 68 and shown in figure 13. The primary dif- rock during the blasting sequence. Each hole was initiated withferences between the experimental face blasts in 1989 and the a precision delay electric detonator and a cap-sensitive boostermine's typical face blasts were smaller borehole diameters, electric ( w a t er - g e l E p r o d u c t ,initiation, and the use of the low-incendive blasting agent and 89 mm in diameter by 200 mm long). The emulsion blend Dstemming in both the preshear and production holes. was loaded into the holes using a pneumatic pumping unit
In addition to the full-scale performance tests, single-holecharges were detonated and allowed to discharge into a 7-m3
4
4
4
4
4 4
4
2
38
Figure 31.—Map of Long Ridge Mine showing instrumentationlocations for full-face blast in heading 6.
Figure 32.—Diagram of Long Ridge Mine face showingblasting pattern in heading 5 for 1990 tests.
Figure 33.—Explosives being loaded into borehole at LongRidge Mine.
(figure 33). Loading times were initially longer using the emul- not be documented by the outby cameras due to dustsion blend compared with those for ANFO; however, as the obscuration. The rounds were again initiated by a relay systemloading crew gained experience, the loading times improved that was designed to allow the instruments to establish stablesignificantly (2-h loading time for the third test compared with baselines and the cameras to achieve full operating speeds before1.5 h for ANFO loading). The powder factor for each round was initiation of the round. A portable PC was interfaced with thisadjusted slightly for each test to obtain optimal rubblization based system for easier and more accurate data gathering andon the geologic structures encountered in the headings. The subsequent analyses.average powder factor for the three tests was 1.1 kg/m of realized For each of the three tests, the video and 16-mm movie film3
shale. After loading the emulsion blasting agent, each hole was showed only short duration (<5 ms) detonation flashesthen stemmed with two gelled water units that were each 76 mm associated with several holes. The optical flame sensor supportedin diameter by 400 mm long. This stemming was tamped againstthe camera data in that it recorded very little luminositythe charge column. Typical nonelectric initiation was not utilizedduring these tests because the detonating cord used in this type ofsystem can ignite a flammable CH -air atmosphere, and these tests4
are designed to evaluate potential blasting agents and proceduresfor blasting in gassy mine conditions. Therefore, an all-electricinitiation system was used.
Instrumentation used to monitor these tests included pressuretransducers and optical flame sensors. Both video and high-speed 16-mm cameras (64 and 250 fr/s) were used to documentany evidence of flame outside of the boreholes. The cameraswere positioned approximately 120 m outby the face. The static pressure transducers were located 45 and120 m from the face. The optical flame sensor was positioned 25m from the face. This sensor was located relatively close to theface in an attempt to record any occurrence of flame that may
have been generated during the later stages of the round but could during each test, and that which it did show was very short-lived.

39
Figure 34—Map of Logan Wash Mine showinginstrumentation locations for 1990 tests.
Figure 35.—Diagram showing drill pattern used duringLogan Wash face blasts. (Numbers represent detonator delayperiods.)
The performance of the emulsion blend in terms of fragmentation accomplish this, a wooden framework was mounted around theand incendivity characteristics during these test blasts wasperimeter of the drift approximately 2.4 m outby the face. Aencouraging since there was uncertainty over the size-scaling portable foaming unit was then used to seal the gaps between theeffect in going to larger diameter holes. In similar full-face tests framework and the mine surfaces to prevent leakage during thein 1989 using the emulsion blend D at Unocal, each hole was CH injection period. Clear plastic sheeting was then attached as76 mm in diameter and stemmed with three gelled water units. a diaphragm to the framework, resulting in a relatively airtightIn these tests, no flame was observed during blasting. Therefore, 77-m containment zone. The CH was remotely injected into thein the 1990 tests, only two inert stemming units were used zone through two 12-mm-diam tubes from cylinders locatedbecause the 1989 single-hole test data at Exxon's mine showed noabout 150 m outby the face near the control base shown inevidence of flame even when detonating the emulsion blend D figure 34. A remotely operated fan with a sealed motor housingunstemmed into small containment zones of flammable CH -air. was used to mix the incoming CH with the air. During the gas4
However, the 1990 tests at Long Ridge Mine and subsequent injection, the CH concentration was monitored by samplingtests conducted the following week at Logan Wash Mine showed through a 6-mm-diam tube located inside the containment zone.that two gelled water units were insufficient to totally eliminateThe sample was drawn through the tube by a vacuum pump toflame outside the borehole. a gas analyzer located at the control base. When the required
The maximum static pressures recorded during the 1990 Long concentration was reached, the gas injection was stopped.Ridge tests using the stemmed emulsion blend D were consistent Instrumentation was similar to that used during the Unocalwith those from the 1989 tests and were only one-half the value tests (pressure transducers, cameras, and flame sensors). Ameasured during the earlier rounds (62) using unstemmed pressure transducer and flame sensor were located just inby theANFO. One pressure transducer was located inby the last open main heading and about 22 m from the CH zone at thecrosscut approximately 45 m from the face. The pressures rangedfrom 0.1 to 0.2 bar at this location with the stemmed emulsionblend D compared with 0.3 bar for a typical unstemmed ANFOround. At about 120 m from the face (at the second outbycrosscut), the pressure values for the three tests averaged about0.02 bar. The use of stemming not only cooled the byproductsof detonation, but also allowed for more work on the rock bycontaining the gas pressures within the borehole for a longerperiod of time. Another contributing factor to these lowerpressure values was the use of the air-cushioning technique on thepreshear holes. The advantage of this method was that lessexplosive was used per hole and the explosive was loaded onlyat the back of the hole with stemming at the collar.
A postblast analysis was conducted following each round toevaluate the effectiveness of the emulsion blend D compared withthe standard ANFO round. The three 1990 tests at Long RidgeMine using the stemmed emulsion blend D resulted infragmentation approximately equivalent to that of a typicalunstemmed ANFO round loaded in a similar drill pattern. Thedust generated during these tests appeared to be less than that ofthe standard unstemmed ANFO rounds and still at least an orderof magnitude lower than that required for a large-scale dustexplosion.
Occidental’s Logan Wash Mine Test
A full-face test and a multiple-hole spacing test were con-ducted at Occidental's Logan Wash oil shale mine (15) locatednortheast of De Beque, Mesa County, CO. This mine consistedof three interconnecting levels and had been primarily used todevelop and test an in situ retorting method (1-2). The 1990 tests(69) were conducted in a 25-m-long stub drift located off themain heading approximately 300 m inby the mine portal, as face. A video camera and two 16-mm cameras were positionedshown in figure 34. This stub drift had a cross-sectional area of 28 m from the face. A second pressure transducer was locatedabout 32 m . 150 m outby the face near the control base shown in figure 34.2
One purpose of the tests at Logan Wash was to evaluate theThe same computer and shotfire initiation system used at Unocaleffect of a full-face blast into a flammable CH -air zone. To was used during these tests.4
4
34
4
4
4
40
In preparation for the detonation of a full-face round into areduce the overpressure values by one-half. This, coupled withflammable CH -air zone, a baseline test was conducted with the the higher powder factor at Logan Wash, would account for the4
ignition of the CH -air only. Following the CH injection and higher overpressures recorded during these tests. The high4 4
gas analysis period, the shotfire system was armed and activated.powder factor resulted in relatively uniform fragmentation of theFor the baseline test, a small chemical ignitor was used to ignite shale in much reduced sizes than that obtained during the Longthe flammable CH -air mixture near the face. The static pressure Ridge tests.4
transducer located near the face recorded a slow pressure rise that Data from the flame sensor and cameras indicated withpeaked at 0.04 bar overpressure. The transducer located 150 m reasonable certainty that an ignition of the CH -air mixtureoutby the face recorded a maximum overpressure less than 0.01occurred as a result of the detonation of the full-face patternbar. The video and 16-mm cameras observed a fireball that stemmed with two inert gelled water units; at least, a bright flashbegan from the lower center ignition point, expanded throughout of light occurred at the start of the round. However, because ofthe containment zone, then traveled outby the drift. The optical the short distance from the face to the T-intersection at the mainflame sensor located nearer to the face recorded about 1.25 s of heading where the cameras and flame sensor were located, theflame associated with the CH burning. overpressures and debris generated during the detonation of the4
After the baseline test, a full-face round was detonated into around damaged the instruments and cameras shortly afterCH -air zone using the emulsion blend D in the boreholes. The initiation of the round. Several contributing factors may have4
drill pattern for the full-face test, shown in figure 35, consisted of enhanced the probability of an ignition. One factor would be thetwenty-six 89-mm-diam holes drilled to an average depth of high powder factor, which was over twice that normally used in3.7 m. The face along each rib line had five equally spaced typical operations. Another change from past tests was the use ofpreshear holes. Two pairs of angled holes were drilled in the larger diameter holes. It would appear that the 89-mm-diam holesmiddle of the face to provide an expansion relief zone to facilitate require at least as much or more stemming compared with the 76-the detonation of the later holes. Each hole was primed with the mm-diam holes to prevent the hot detonation gases from exitingwater-gel E booster and a precision delay electric detonator. Thefrom the hole and igniting the CH . The spacings of the drill16 production holes were then loaded with the emulsion blend D, holes in the face pattern may also have been a major contributorand two stemming units were tamped into each hole against the to the CH ignition. An explosive loaded in a hole can be desen-charge column. The powder factor for the face test was 2.4 kg/m sitized by the detonation of an adjacent hole should that hole be3
of realized shale. The powder factor was substantially greater too close. The result is that the desensitized charge will notthan the 1.1 kg/m powder factor used for the Unocal headings. detonate properly as evidenced by its lower velocities and may3
This high powder factor would present a higher CH ignitiondeflagrate rather than detonate. Separate tests to evaluate the4
risk. The air-cushioning technique was used for the 10 preshear spacing of blast holes are discussed below.holes, which were loaded at the back of each hole with 22 kg of A multiple-hole test (69) was conducted at Logan Wash Minethe emulsion blend D. These holes were then stemmed at the after the full-face test to measure the detonation velocities ofcollar with two units of the inert gelled water material. loaded holes spaced at various increments from one another. As
After loading the explosives, another plastic sheet was attached part of the field evaluation with the experimental, low-incendiveto the wooden framework of the 77-m gas containment zone. emulsion blend D, this test was designed to evaluate the3
The CH was then injected into the containment zone and mixed performance of the explosive and determine the minimum4
with the fan until the gas analyzer showed the concentration to be spacings required between blast holes. The minimum spacing10 pct CH -air, a worst-case scenario. Gas samples were also requirement is critical in preventing potential misfires because the4
taken for subsequent laboratory analyses; the results were detonation of the adjacent short delay rounds can desensitize theconsistent with the on-line analyzer readings. The round wasexplosive in the longer delay holes. Desensitization can occurinitiated with a permissible system consisting of electricwhen the sensitizing agent in the explosive, typically glassdetonators. microbubbles, is crushed from the shock waves produced from
A maximum static overpressure of about 0.9 bar was recorded the detonation of adjacent holes. The concentration of micro-on the transducer located 22 m from the face and inby the mainbubbles in a formulation determines the explosive's sensitivityheading. The second transducer located 150 m outby the face and the strength of the initiator required to detonate the explosive.recorded maximum overpressures less than 0.01 bar. Typical The spacing test entailed eight holes drilled horizontal-blasting overpressures with ANFO in this size drift from previous ly into two opposite oil shale ribs (four holes per rib). There wasoperations within the Logan Wash Mine were not available. a distance of 2.1, 1.5, and 1.0 m between the holes in each set;However, the overpressures obtained during this test did noteach hole was 6 m deep and 89 mm in diameter. Theappear to be unreasonable considering the high powder factor andthe small cross-sectional area of the drift. Previous tests (45-46,54) at the Long Ridge and Colony Mines have generatedoverpressures ranging from 0.1 to 0.3 bar when the pressuretransducers were located at similar distances from the face.However, the Long Ridge and Colony Mine headings had nearlyfour times the cross-sectional area of the Logan Wash Mine drift.Experimental results (70) have shown that doubling the area will
4
4
4
41
emulsion blend D was bulk loaded in the back 4.6 m of each holeand stemmed with a gelled water inert material to maximize theshock pressures to the surrounding strata. A velocity-of-detonation recorder (VODR) was used to measure the detonationvelocities in each hole. This method of recording the detonationvelocity within an explosive column can also be referred to as theresistance wire method (71). Constant current is supplied to twoinsulated conductors, such as the center wire and shield of thecoaxial cable used during these experiments. A continuouslength of coaxial cable was looped into each of the eight holesand then connected to the VODR. At the far end of the coaxialcable, which was located at the back of the first hole to bedetonated, the two conductors were shorted. As the detonationprogressed through the explosive column, the coaxial cableconductors were forced into contact as the cable was crushed.This shorting reduced the circuit voltage since this action reducedthe length of the electrical path and therefore the resistance of theprobe. Recording the change in voltage over time provided thedetonation rate. A sequential blaster machine initiated the holesat 10-ms intervals. Results from this first test indicated that aspacing of 2.1 m between holes had no detrimental effect on theperformance of the emulsion blend in the oil shale formation.However, the holes on 1.5-m or closer spacings did not detonateproperly, as evidenced by the lower velocities. Many of the holesin the Logan Wash full-face drill pattern (figure 35) were spacedless than 2 m apart. It was quite possible that the CH ignition4
during the full-face test may have been the result of the improperperformance of the explosive in some of the holes. Additionalspacing tests need to be conducted in oil shale to verify thesepreliminary findings. Future full-face tests using the emulsionblend D should be conducted with hole spacings of at least 2 m.
EXPLOSION HAZARDS OF SULFIDE ORE DUSTS
The Pittsburgh Research Center, at the request of the MSHA,However, a significant number of dust ignitions have been as-expanded its research program on developing safer explosives sociated with development headings and the secondary blastingand blasting procedures for gassy oil shale mine conditions to of ore at draw points. There are numerous documented accidentsinclude sulfide ore mines. Working in cooperation with several relating to the various hazards associated with the mining andexplosives manufacturers, the Pittsburgh Research Centerprocessing of these ores (79-82). Fortunately, the number ofcontinued to test various explosive formulations, including water- fatalities associated with these ignitions has been minimal due togel and emulsion products, in the LLCG to evaluate their relative the practice of evacuating mines before stope blasts. However,incendivity compared with standard ANFO and other explosives. many operators report extensive damage during many of the dust
There were some very early reports of sulfide mine dust ignitions. Even with minor dust ignitions, there was appreciableexplosions in the 1920's, as described in references 72 and 73. In lost production while a mine was checked for toxic levels ofrecent decades, there has been a significant increase in the number sulfur dioxide and hydrogen sulfide and the damage to theand severity of blast-induced sulfide dust ignitions in theventilation system was repaired to safely purge the mine of theseunderground workings of massive sulfide deposits in Europe, the toxic gases. However, dust ignitions have caused extensiveRepublic of South Africa, Australia, Canada, and, more recently, damage to ventilation ducts and stoppings and also to the miningthe United States. These recent sulfide dust explosions have beenequipment, thereby creating potentially hazardous situations forsummarized in a literature survey by Job (74) and in several the miners (81). The intense heat and flame associated with thesepapers by Enright (75-77). Another literature survey on explosions can ignite timber sets and other combustible materialsspontaneous combustion and sulfide mine fires was presented by in the area. The destructive pressures generated from a sulfideNinteman (78). The explosives normally used in sulfide ore dust ignition are generally limited to the blast face area and, inmining were dynamites and/or ANFO. Most of these dust most cases, do not extend significant distances into other areas ofignitions have occurred in open stopes where large-diameter drill the mine. This is due primarily to the significant decrease in theholes were used with bench blasting or vertical retreat mining. concentration of entrained sulfide ore dust outby the immediate
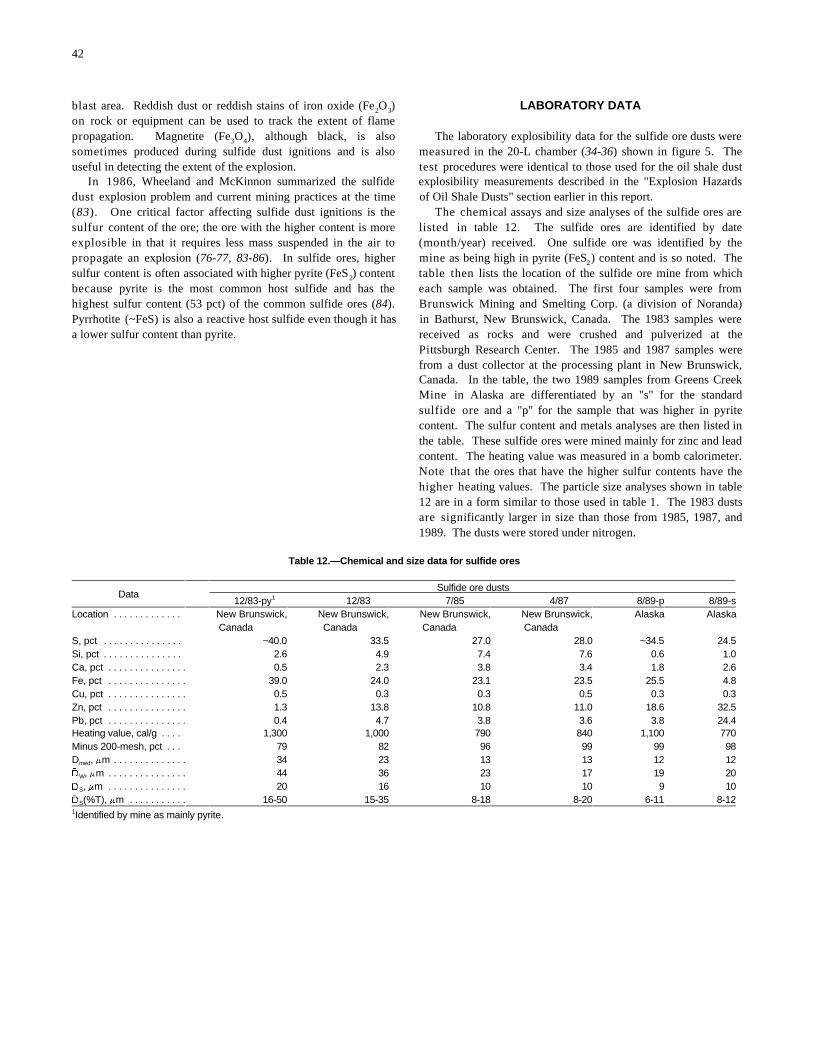
42
blast area. Reddish dust or reddish stains of iron oxide (Fe O ) LABORATORY DATA2 3
on rock or equipment can be used to track the extent of flamepropagation. Magnetite (Fe O ), although black, is also The laboratory explosibility data for the sulfide ore dusts were3 4
sometimes produced during sulfide dust ignitions and is also measured in the 20-L chamber (34-36) shown in figure 5. Theuseful in detecting the extent of the explosion. test procedures were identical to those used for the oil shale dust
In 1986, Wheeland and McKinnon summarized the sulfide explosibility measurements described in the "Explosion Hazardsdust explosion problem and current mining practices at the time of Oil Shale Dusts" section earlier in this report.(83). One critical factor affecting sulfide dust ignitions is the The chemical assays and size analyses of the sulfide ores aresulfur content of the ore; the ore with the higher content is morelisted in table 12. The sulfide ores are identified by dateexplosible in that it requires less mass suspended in the air to (month/year) received. One sulfide ore was identified by thepropagate an explosion (76-77, 83-86). In sulfide ores, higher mine as being high in pyrite (FeS ) content and is so noted. Thesulfur content is often associated with higher pyrite (FeS ) content table then lists the location of the sulfide ore mine from which2
because pyrite is the most common host sulfide and has the each sample was obtained. The first four samples were fromhighest sulfur content (53 pct) of the common sulfide ores (84). Brunswick Mining and Smelting Corp. (a division of Noranda)Pyrrhotite (~FeS) is also a reactive host sulfide even though it has in Bathurst, New Brunswick, Canada. The 1983 samples werea lower sulfur content than pyrite. received as rocks and were crushed and pulverized at the
2
Pittsburgh Research Center. The 1985 and 1987 samples werefrom a dust collector at the processing plant in New Brunswick,Canada. In the table, the two 1989 samples from Greens CreekMine in Alaska are differentiated by an "s" for the standardsulfide ore and a "p" for the sample that was higher in pyritecontent. The sulfur content and metals analyses are then listed inthe table. These sulfide ores were mined mainly for zinc and leadcontent. The heating value was measured in a bomb calorimeter.Note that the ores that have the higher sulfur contents have thehigher heating values. The particle size analyses shown in table12 are in a form similar to those used in table 1. The 1983 dustsare significantly larger in size than those from 1985, 1987, and1989. The dusts were stored under nitrogen.
Table 12.—Chemical and size data for sulfide ores
DataSulfide ore dusts
12/83-py 12/83 7/85 4/87 8/89-p 8/89-s1
Location . . . . . . . . . . . . . New Brunswick, New Brunswick, New Brunswick, New Brunswick, Alaska AlaskaCanada Canada Canada Canada
S, pct . . . . . . . . . . . . . . . ~40.0 33.5 27.0 28.0 ~34.5 24.5Si, pct . . . . . . . . . . . . . . . 2.6 4.9 7.4 7.6 0.6 1.0Ca, pct . . . . . . . . . . . . . . . 0.5 2.3 3.8 3.4 1.8 2.6Fe, pct . . . . . . . . . . . . . . . 39.0 24.0 23.1 23.5 25.5 4.8Cu, pct . . . . . . . . . . . . . . . 0.5 0.3 0.3 0.5 0.3 0.3Zn, pct . . . . . . . . . . . . . . . 1.3 13.8 10.8 11.0 18.6 32.5Pb, pct . . . . . . . . . . . . . . . 0.4 4.7 3.8 3.6 3.8 24.4Heating value, cal/g . . . . 1,300 1,000 790 840 1,100 770Minus 200-mesh, pct . . . 79 82 96 99 99 98D , Fm . . . . . . . . . . . . . .med 34 23 13 13 12 12ö , Fm . . . . . . . . . . . . . . .W 44 36 23 17 19 20ö , Fm . . . . . . . . . . . . . . .S 20 16 10 10 9 10ö (%T), Fm . . . . . . . . . . .S 16-50 15-35 8-18 8-20 6-11 8-12
Identified by mine as mainly pyrite.1
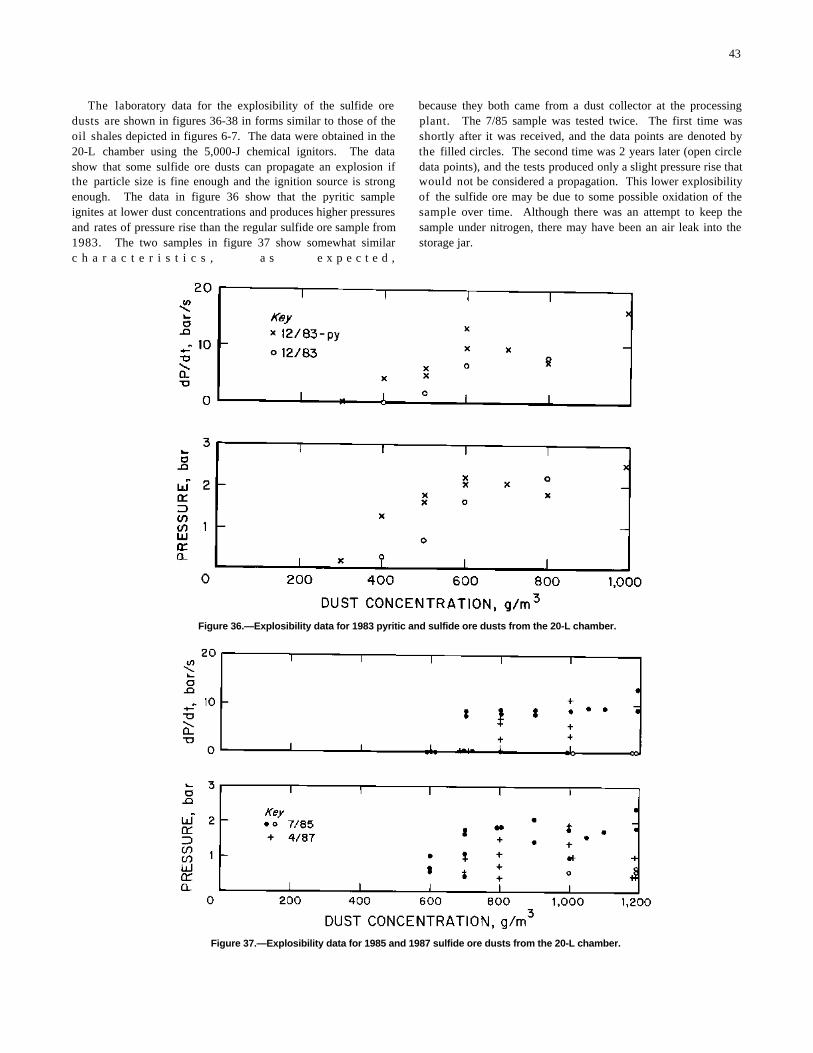
43
Figure 36.—Explosibility data for 1983 pyritic and sulfide ore dusts from the 20-L chamber.
Figure 37.—Explosibility data for 1985 and 1987 sulfide ore dusts from the 20-L chamber.
The laboratory data for the explosibility of the sulfide ore because they both came from a dust collector at the processingdusts are shown in figures 36-38 in forms similar to those of the plant. The 7/85 sample was tested twice. The first time wasoil shales depicted in figures 6-7. The data were obtained in the shortly after it was received, and the data points are denoted by20-L chamber using the 5,000-J chemical ignitors. The data the filled circles. The second time was 2 years later (open circleshow that some sulfide ore dusts can propagate an explosion if data points), and the tests produced only a slight pressure rise thatthe particle size is fine enough and the ignition source is strongwould not be considered a propagation. This lower explosibilityenough. The data in figure 36 show that the pyritic sample of the sulfide ore may be due to some possible oxidation of theignites at lower dust concentrations and produces higher pressures sample over time. Although there was an attempt to keep theand rates of pressure rise than the regular sulfide ore sample from sample under nitrogen, there may have been an air leak into the1983. The two samples in figure 37 show somewhat similar storage jar.c h a r a c t e r i s t i c s , a s e x p e c t e d ,
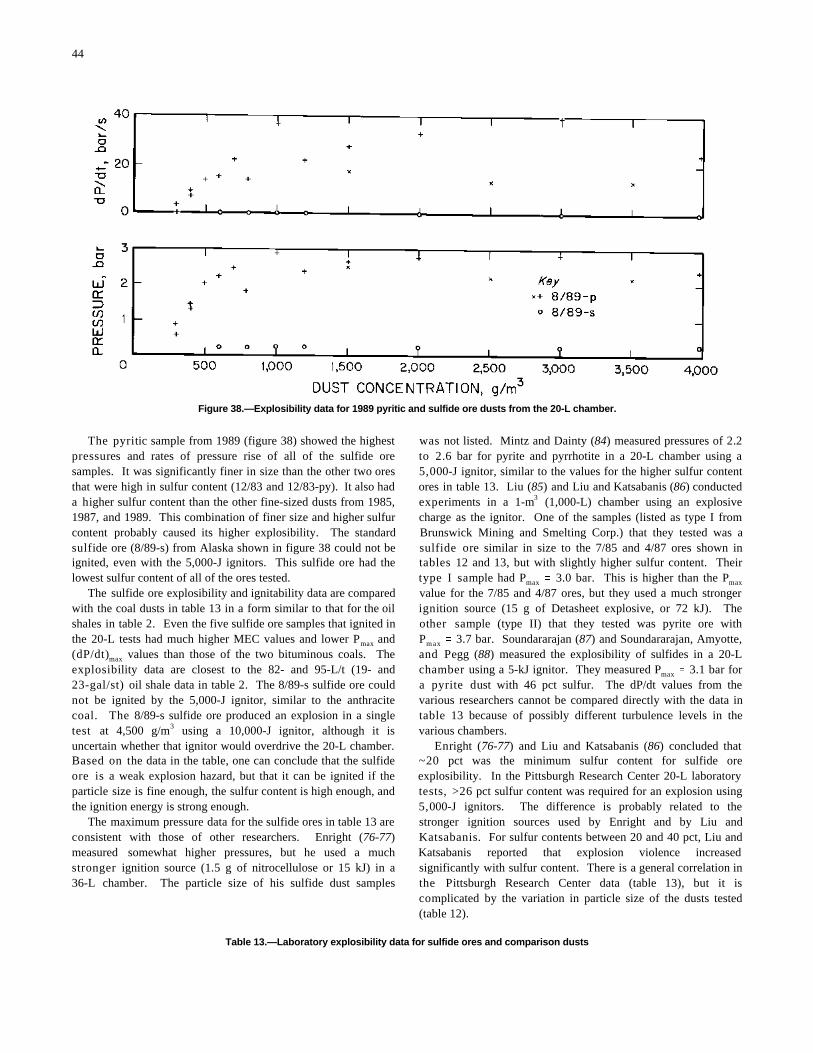
44
Figure 38.—Explosibility data for 1989 pyritic and sulfide ore dusts from the 20-L chamber.
The pyritic sample from 1989 (figure 38) showed the highest was not listed. Mintz and Dainty (84) measured pressures of 2.2pressures and rates of pressure rise of all of the sulfide ore to 2.6 bar for pyrite and pyrrhotite in a 20-L chamber using asamples. It was significantly finer in size than the other two ores 5,000-J ignitor, similar to the values for the higher sulfur contentthat were high in sulfur content (12/83 and 12/83-py). It also had ores in table 13. Liu (85) and Liu and Katsabanis (86) conducteda higher sulfur content than the other fine-sized dusts from 1985,experiments in a 1-m (1,000-L) chamber using an explosive1987, and 1989. This combination of finer size and higher sulfurcharge as the ignitor. One of the samples (listed as type I fromcontent probably caused its higher explosibility. The standard Brunswick Mining and Smelting Corp.) that they tested was asulfide ore (8/89-s) from Alaska shown in figure 38 could not be sulfide ore similar in size to the 7/85 and 4/87 ores shown inignited, even with the 5,000-J ignitors. This sulfide ore had the tables 12 and 13, but with slightly higher sulfur content. Theirlowest sulfur content of all of the ores tested. type I sample had P ' 3.0 bar. This is higher than the P
The sulfide ore explosibility and ignitability data are compared value for the 7/85 and 4/87 ores, but they used a much strongerwith the coal dusts in table 13 in a form similar to that for the oil ignition source (15 g of Detasheet explosive, or 72 kJ). Theshales in table 2. Even the five sulfide ore samples that ignited in other sample (type II) that they tested was pyrite ore withthe 20-L tests had much higher MEC values and lower P and P ' 3.7 bar. Soundararajan (87) and Soundararajan, Amyotte,max
(dP/dt) values than those of the two bituminous coals. Theand Pegg (88) measured the explosibility of sulfides in a 20-Lmax
explosibility data are closest to the 82- and 95-L/t (19- andchamber using a 5-kJ ignitor. They measured P ' 3.1 bar for23-gal/st) oil shale data in table 2. The 8/89-s sulfide ore could a pyrite dust with 46 pct sulfur. The dP/dt values from thenot be ignited by the 5,000-J ignitor, similar to the anthracite various researchers cannot be compared directly with the data incoal. The 8/89-s sulfide ore produced an explosion in a single table 13 because of possibly different turbulence levels in thetest at 4,500 g/m using a 10,000-J ignitor, although it is various chambers.3
uncertain whether that ignitor would overdrive the 20-L chamber. Enright (76-77) and Liu and Katsabanis (86) concluded thatBased on the data in the table, one can conclude that the sulfide ~20 pct was the minimum sulfur content for sulfide oreore is a weak explosion hazard, but that it can be ignited if the explosibility. In the Pittsburgh Research Center 20-L laboratoryparticle size is fine enough, the sulfur content is high enough, and tests, >26 pct sulfur content was required for an explosion usingthe ignition energy is strong enough. 5,000-J ignitors. The difference is probably related to the
The maximum pressure data for the sulfide ores in table 13 are stronger ignition sources used by Enright and by Liu andconsistent with those of other researchers. Enright (76-77) Katsabanis. For sulfur contents between 20 and 40 pct, Liu andmeasured somewhat higher pressures, but he used a much Katsabanis reported that explosion violence increasedstronger ignition source (1.5 g of nitrocellulose or 15 kJ) in a significantly with sulfur content. There is a general correlation in36-L chamber. The particle size of his sulfide dust samples the Pittsburgh Research Center data (table 13), but it is
3
max max
max
max
complicated by the variation in particle size of the dusts tested(table 12).
Table 13.—Laboratory explosibility data for sulfide ores and comparison dusts
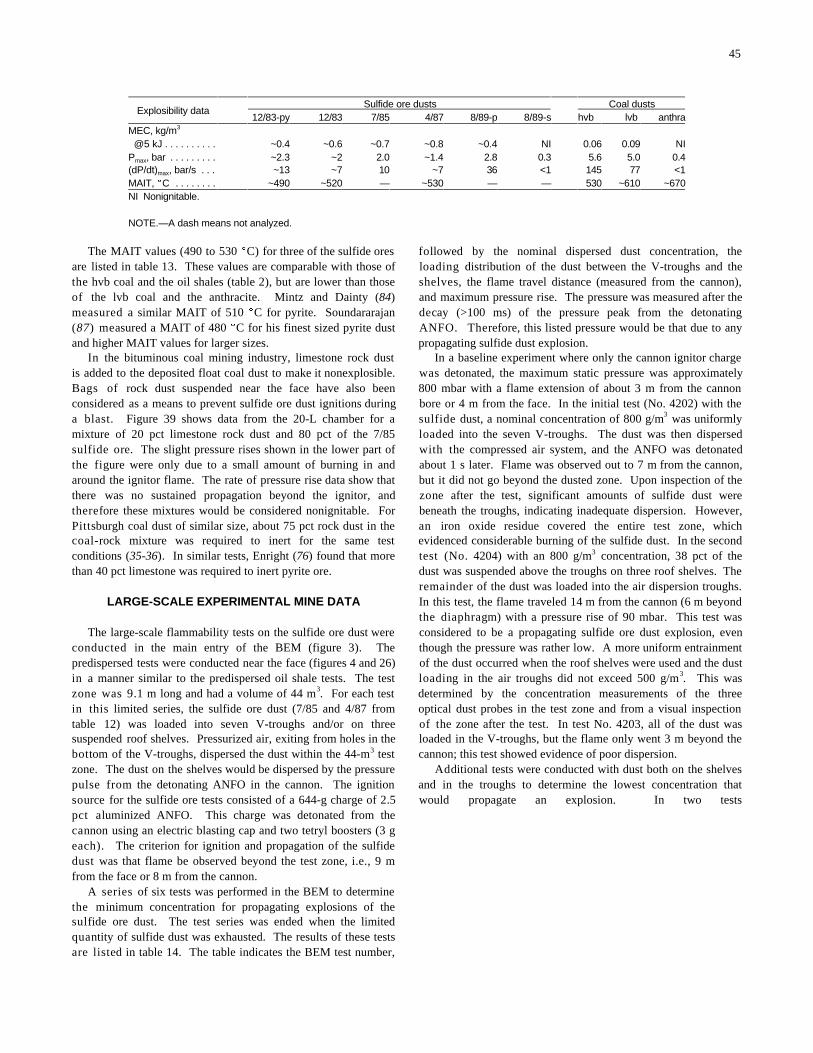
45
Explosibility dataSulfide ore dusts Coal dusts
12/83-py 12/83 7/85 4/87 8/89-p 8/89-s hvb lvb anthraMEC, kg/m3
@5 kJ . . . . . . . . . . ~0.4 ~0.6 ~0.7 ~0.8 ~0.4 NI 0.06 0.09 NIP , bar . . . . . . . . .max ~2.3 ~2 2.0 ~1.4 2.8 0.3 5.6 5.0 0.4(dP/dt) , bar/s . . .max ~13 ~7 10 ~7 36 <1 145 77 <1MAIT, EC . . . . . . . . ~490 ~520 — ~530 — — 530 ~610 ~670NI Nonignitable.
NOTE.—A dash means not analyzed.
The MAIT values (490 to 530 EC) for three of the sulfide ores followed by the nominal dispersed dust concentration, theare listed in table 13. These values are comparable with those of loading distribution of the dust between the V-troughs and thethe hvb coal and the oil shales (table 2), but are lower than those shelves, the flame travel distance (measured from the cannon),of the lvb coal and the anthracite. Mintz and Dainty (84) and maximum pressure rise. The pressure was measured after themeasured a similar MAIT of 510 EC for pyrite. Soundararajan decay (>100 ms) of the pressure peak from the detonating(87) measured a MAIT of 480 EC for his finest sized pyrite dust ANFO. Therefore, this listed pressure would be that due to anyand higher MAIT values for larger sizes. propagating sulfide dust explosion.
In the bituminous coal mining industry, limestone rock dust In a baseline experiment where only the cannon ignitor chargeis added to the deposited float coal dust to make it nonexplosible. was detonated, the maximum static pressure was approximatelyBags of rock dust suspended near the face have also been 800 mbar with a flame extension of about 3 m from the cannonconsidered as a means to prevent sulfide ore dust ignitions during bore or 4 m from the face. In the initial test (No. 4202) with thea blast. Figure 39 shows data from the 20-L chamber for a sulfide dust, a nominal concentration of 800 g/m was uniformlymixture of 20 pct limestone rock dust and 80 pct of the 7/85 loaded into the seven V-troughs. The dust was then dispersedsulfide ore. The slight pressure rises shown in the lower part of with the compressed air system, and the ANFO was detonatedthe figure were only due to a small amount of burning in and about 1 s later. Flame was observed out to 7 m from the cannon,around the ignitor flame. The rate of pressure rise data show that but it did not go beyond the dusted zone. Upon inspection of thethere was no sustained propagation beyond the ignitor, and zone after the test, significant amounts of sulfide dust weretherefore these mixtures would be considered nonignitable. For beneath the troughs, indicating inadequate dispersion. However,Pittsburgh coal dust of similar size, about 75 pct rock dust in the an iron oxide residue covered the entire test zone, whichcoal-rock mixture was required to inert for the same test evidenced considerable burning of the sulfide dust. In the secondconditions (35-36). In similar tests, Enright (76) found that more test (No. 4204) with an 800 g/m concentration, 38 pct of thethan 40 pct limestone was required to inert pyrite ore. dust was suspended above the troughs on three roof shelves. The
LARGE-SCALE EXPERIMENTAL MINE DATA In this test, the flame traveled 14 m from the cannon (6 m beyond
The large-scale flammability tests on the sulfide ore dust were considered to be a propagating sulfide ore dust explosion, evenconducted in the main entry of the BEM (figure 3). The though the pressure was rather low. A more uniform entrainmentpredispersed tests were conducted near the face (figures 4 and 26) of the dust occurred when the roof shelves were used and the dustin a manner similar to the predispersed oil shale tests. The test loading in the air troughs did not exceed 500 g/m . This waszone was 9.1 m long and had a volume of 44 m . For each test determined by the concentration measurements of the three3
in this limited series, the sulfide ore dust (7/85 and 4/87 from optical dust probes in the test zone and from a visual inspectiontable 12) was loaded into seven V-troughs and/or on three of the zone after the test. In test No. 4203, all of the dust wassuspended roof shelves. Pressurized air, exiting from holes in the loaded in the V-troughs, but the flame only went 3 m beyond thebottom of the V-troughs, dispersed the dust within the 44-m test cannon; this test showed evidence of poor dispersion.3
zone. The dust on the shelves would be dispersed by the pressure Additional tests were conducted with dust both on the shelvespulse from the detonating ANFO in the cannon. The ignition and in the troughs to determine the lowest concentration thatsource for the sulfide ore tests consisted of a 644-g charge of 2.5 would propagate an explosion. In two testspct aluminized ANFO. This charge was detonated from thecannon using an electric blasting cap and two tetryl boosters (3 geach). The criterion for ignition and propagation of the sulfidedust was that flame be observed beyond the test zone, i.e., 9 mfrom the face or 8 m from the cannon.
A series of six tests was performed in the BEM to determinethe minimum concentration for propagating explosions of thesulfide ore dust. The test series was ended when the limitedquantity of sulfide dust was exhausted. The results of these testsare listed in table 14. The table indicates the BEM test number,
3
3
remainder of the dust was loaded into the air dispersion troughs.
the diaphragm) with a pressure rise of 90 mbar. This test was
3
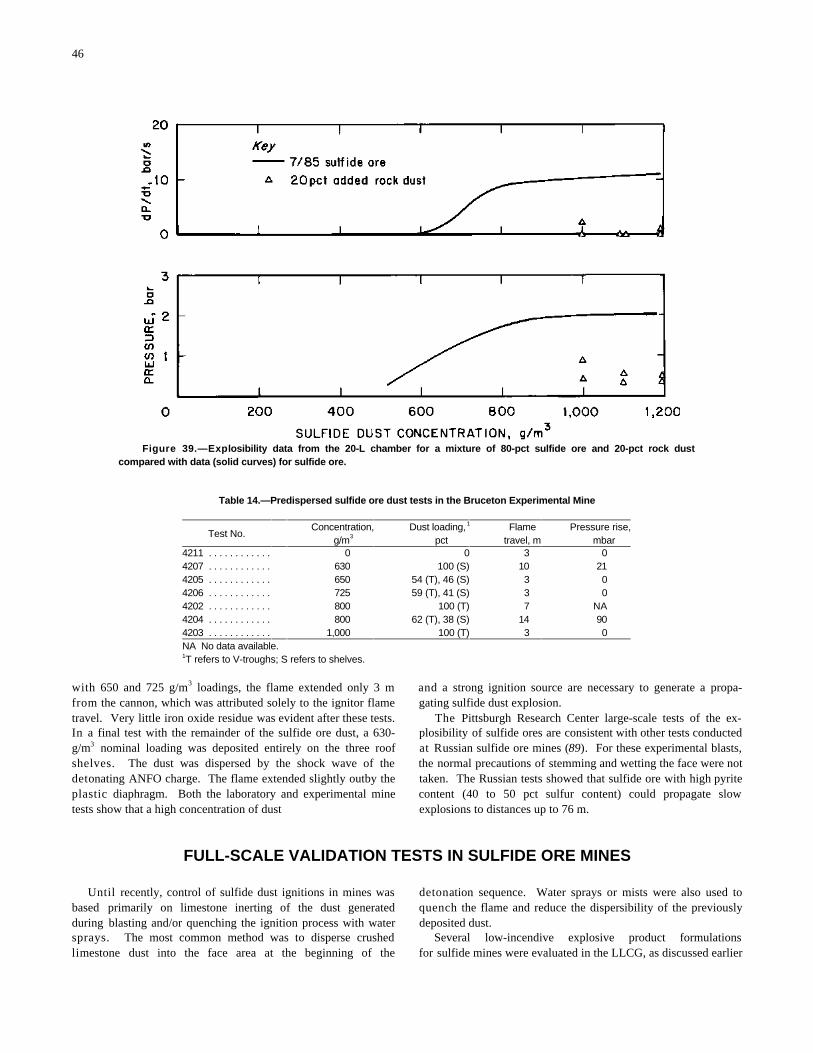
46
Figure 39.—Explosibility data from the 20-L chamber for a mixture of 80-pct sulfide ore and 20-pct rock dustcompared with data (solid curves) for sulfide ore.
Table 14.—Predispersed sulfide ore dust tests in the Bruceton Experimental Mine
Test No.Concentration, Dust loading, Flame Pressure rise,
g/m pct travel, m mbar 3
1
4211 . . . . . . . . . . . . 0 0 3 04207 . . . . . . . . . . . . 630 100 (S) 10 214205 . . . . . . . . . . . . 650 54 (T), 46 (S) 3 04206 . . . . . . . . . . . . 725 59 (T), 41 (S) 3 04202 . . . . . . . . . . . . 800 100 (T) 7 NA4204 . . . . . . . . . . . . 800 62 (T), 38 (S) 14 904203 . . . . . . . . . . . . 1,000 100 (T) 3 0NA No data available.T refers to V-troughs; S refers to shelves.1
with 650 and 725 g/m loadings, the flame extended only 3 m and a strong ignition source are necessary to generate a propa-3
from the cannon, which was attributed solely to the ignitor flame gating sulfide dust explosion.travel. Very little iron oxide residue was evident after these tests. The Pittsburgh Research Center large-scale tests of the ex-In a final test with the remainder of the sulfide ore dust, a 630- plosibility of sulfide ores are consistent with other tests conductedg/m nominal loading was deposited entirely on the three roof at Russian sulfide ore mines (89). For these experimental blasts,3
shelves. The dust was dispersed by the shock wave of the the normal precautions of stemming and wetting the face were notdetonating ANFO charge. The flame extended slightly outby the taken. The Russian tests showed that sulfide ore with high pyriteplastic diaphragm. Both the laboratory and experimental mine content (40 to 50 pct sulfur content) could propagate slowtests show that a high concentration of dust explosions to distances up to 76 m.
FULL-SCALE VALIDATION TESTS IN SULFIDE ORE MINES
Until recently, control of sulfide dust ignitions in mines was detonation sequence. Water sprays or mists were also used tobased primarily on limestone inerting of the dust generatedquench the flame and reduce the dispersibility of the previouslyduring blasting and/or quenching the ignition process with water deposited dust.sprays. The most common method was to disperse crushed Several low-incendive explosive product formulationslimestone dust into the face area at the beginning of the for sulfide mines were evaluated in the LLCG, as discussed earlier

47
in section entitled "Lake Lynn Cannon Gallery Tests." Several 3.The remainder of the drift within 30 m of the face wasof these explosives have undergone field testing and have been thoroughly washed down 45 min before blasting. Any venti-extremely successful in preventing dust ignitions in sulfide ore lation tube or bag in the drift was also thoroughly washed down.mines in areas most susceptible to these ignitions (69). 4. A water-mist spray system was hung from the rib no more
In July 1990, Kennecott Minerals Co., working together with than 23 m from the face and directed toward the face. This wasthe Pittsburgh Research Center and two explosives manufacturers, turned on at least 15 min before blasting.began an extensive testing program with a low-incendive water-gel explosive at its Greens Creek Mine, located on Admiralty These procedures were labor-intensive and, although reducingIsland 29 km southwest of Juneau, AK. The ore types that the number of incidents, did not eliminate them. In fact, the usecomprise the mineralized horizon at the Greens Creek Mine are of water caused other problems. The mine strata are composed ofbasically divided into two types (table 12): a massive sulfide ore a complex package of strongly altered volcanic rock thatthat is composed of 80 to 90 pct pyrite, and a massive sulfide ore degraded quickly when exposed to water. The preventivewith a high base metal content and a low pyrite (10 to 15 pct) measures designed to limit the sulfide dust ignitions seriouslycontent. Historically, the fine-grained, high-sulfur content areas degraded haulage roads, thereby affecting production.have created the greatest difficulty in controlling sulfide dust Production-scale evaluations of the low-incendive water-gel Aignitions. The dust generated during the mining cycle consistedexplosive product (tables 10 and 11) at the Greens Creek Mineprimarily of pyritic and lead-zinc sulfide. The mining zones began in July 1990. This water-gel explosive comes incontaining the various bodies of ore varied greatly in all respects; prepackaged cartridges rather than in bulk form. Approximatelydips ranged from flat to vertical, and thicknesses ranged from 125 kg of the 38-mm-diam by 400-mm-long water-gel explosive0.6 to 9.1 m. The dip of the ore body dictated the type of mining cartridges was used during each face blast. The water-gelmethod used. The three most frequently employed mining explosive A is cap-sensitive and does not require a booster.methods were drift and fill with back stoping (used in steeply Initially, the testing was limited to high-sulfur-bearing areas in thedipping sections), drift and fill (used in structures dipping mine that were prone to dust ignitions. The standard precautionsbetween 20E and 50E from horizontal), and room-and-pillar with already in use (outlined above) were employed with the initialbackfill (used in areas of flat-lying ore). In general, drifting testing. Nearly 4,750 kg (approximately 38 average rounds) ofrounds with burn cuts comprised 50 to 60 pct of mine the low-incendive water-gel explosive was consumed using theproduction. A typical production drift had dimensions of 3.7 by full precautions. No sulfide dust ignitions occurred. As testing3.7 m. Blasting was conducted using nonelectric detonators, progressed, the preventive control procedures were graduallyhigh-velocity detonation cord, and a fuse-detonator initiation sys- decreased. The water spray was first eliminated whiletem. The cross-sectional area of the drifts ranged from 9 to maintaining the washing down of the drift and the use of water28 m . The holes in the pattern were 41 mm in diameter and stemming. After successfully using an additional 8,430 kg (ap-2
were drilled 2.4 to 3 m deep. proximately 68 rounds) of the low-incendive water-gel A ex-The first sulfide dust ignition at the Greens Creek Mine oc- plosive with no dust ignitions, the use of water stemming was
curred in 1989 while using the mine's standard explosive: then dropped; wetting down of the area before blasting was con-semigelatin dynamite. Others occurred later, with minor injuries tinued. To date, Greens Creek Mine has consumed well overto employees primarily associated with the inhalation of 136,000 kg (approximately 1,100 rounds) of the low-incendivecombustion products. No major damage was sustained, but water-gel product and has experienced no sulfide dust ignitions.production delays resulted in losses averaging about $40,000 per The blasting efficiency of the water-gel product at Greensincident. When the Greens Creek Mine first began to experience Creek was very high. The water-gel explosive cartridges tampedproblems with sulfide dust ignitions, strong preventive measures well, and compaction ratios of 90 pct or greater were the norm.were instituted. Management designated areas of the mine that This high degree of coupling improved the brisance (shatteringpresented a potential hazard for a sulfide dust ignition. Once an power) and effective work characteristics of the explosive. Thisarea had been so designated, the procedures below were followed. kept undetonated particles to a minimum and enhanced the
1. The face, ribs, and back within 3 m of the face were powder factor ranged from 3 to 3.8 kg/m and averaged 3.6thoroughly washed down before loading. kg/m . The holes were initiated with long-period nonelectric
2. All loaded holes were stemmed with one filled water bag. detonators.
product's ability to control ignition of the sulfide dust. The3
3
In February 1991, a temporary gap in the supply of the water-gel explosive caused the Greens Creek Mine to return to the useof the mine's usual semigelatin dynamite explosive.
48
As a result, the mine experienced three sulfide dust ignitions in a washing down the drift to remove fine sulfide dust deposits.2-week period, even while the mine returned to the full list of Another benefit attributed to these low-incendive explosives waspreventive measures. Past experience had shown that extreme improved haulage roads because the use of water to control thecaution was warranted when blasting in the stope where these sulfide dust ignitions was greatly reduced.ignitions occurred. Two days following the last ignition, the Initial incendivity studies at the Greens Creek Mine with thesupply of the water-gel product was reestablished. The first new water-gel cartridges and bulk emulsion product were conductedround detonated in this stope using the water-gel product used the in 41-mm-diam holes and resulted in no sulfide dust ignitions.full precautions. No sulfide dust ignition occurred, and the However, to optimize explosive performance and rockprecautions were reduced to wetting down of the blast area andfragmentation, the blast holes were increased slightly to 44 mmbeyond, which also resulted in no dust ignitions. The Greens in diameter. Both the prepackaged and the bulk productsCreek personnel by then had developed confidence in the water- continued to provided excellent results in terms of lowgel product and undertook a project to test the product under incendivity and good fragmentation characteristics. Again, noextreme conditions. A stope had been mined to a point where a sulfide dust ignitions occurred when using the lower incendiveslash-while-retreating method was being employed. During the products in the 44-mm-diam holes.occurrence of the dust ignitions while using the gelatin dynamite, The lower incendive water-gel explosives have also been usedonly one slash, no greater than 3.7 m high by 3.1 m long by with success in two Canadian base metal mines to reduce the3.1 m deep, was taken. This procedure was in effect to minimizeprobability of sulfide dust ignitions following blasting operations.dust generation and, hopefully, to eliminate dust ignitions. These mines are the Westmin Resources Ltd.During the experiment to evaluate the ability of the low-incendive H-W Mine on Vancouver Island, British Columbia, and the Hud-water-gel product to eliminate ignitions, slashes on each side of son Bay Mining and Smelting Co. Ltd. Ruttan Operation nearthe initial drive were detonated at the same time with substantialLeaf Rapids, Manitoba. The Ruttan Operation had been av-delay. Four such experimental blasts were conducted with thiseraging 2.7 sulfide dust ignitions per month over a 16-monthconfiguration, and no sulfide dust ignitions occurred. Again, the period. During that time, the sulfide dust ignitions accounted foronly precaution taken was wetting down of the blast area and be- 14 pct of their blast delays, which averaged 2.6 h per occurrence.yond. All slash sizes were approximately 3.7 m by 3.1 m by Any blast that had produced sulfur dioxide (SO ) was considered1.8 m. After over 2 years of testing and full production use, no to be a sulfide dust ignition. Mine reentry following blastingsulfide dust ignitions have occurred at the Greens Creek Mine operations was restricted until the ventilation system had removedwhen using the water-gel product. and/or diluted the toxic gases to a safe level. The mine's policy
Greens Creek then began full-scale blasting evaluations with was to send mining personnel home if these toxic gases were nota bulk product (emulsion A in tables 10 and 11) that had been cleared within 4 h, which then resulted in lost production time.tested in the LLCG and shown to be another preferred lower This occurred one to two times monthly. Preliminary data showincendive product. No sulfide dust ignitions have occurred since no sulfide dust ignitions have occurred when using the low-the mine began using the bulk product. Greens Creek has since incendive water-gel product at these two Canadian mines.installed a 455-kg hopper and two more pumping systems for Because of the encouraging results in both base metal and oilface loading of the bulk product in the development rounds. shale mines, the Colorado Mining Association, DOE, theOverall blasting costs were significantly reduced when using the Canadian Institute of Mining and Metallurgy, the Canadian basebulk product compared with the water-gel cartridges. Pumping metal industry, MSHA, and various explosive manufacturersreduced the labor involved in the loading process by at least one-continue to support Pittsburgh Research Center research onhalf compared with the loading times with the prepackaged explosive incendivity, stemming, and initiation systems as acartridges. Preblast precautions have been even further reduced means of reducing the dust and/or gas ignition probability duringt o o n l y o c c a s i o n a l l y normal development blasting.
2
RECOMMENDATIONS
In 1984, an ad hoc committee representing oil shale producers, standard test method could be developed to evaluate theMSHA, the Pittsburgh Research Center, and explosive incendivity characteristics of new and/or existing explosivemanufacturers produced a report (90) outlining the need for formulations that may be used during blasting operations underresearch into the development of safe, effective blasting hazardous mining conditions, such as in the oil shale and sulfideprocedures for the oil shale industry. Many of the committee's ore mines. More experimental data on the temperatures andrecommended research directives have been accomplished by the extent of afterburning may lead to a more completePittsburgh Research Center, as summarized in this document. Inunderstanding of how best to prevent the ignition of flammableaddition to this research, the authors believe that research should gas or dust atmospheres.continue on the development of safer explosives and procedures Should the oil shale industry again become active, additionalfor blasting in the presence of combustible dusts and CH gas in full-scale validation field tests in operating mines need to be4
noncoal mines. Intermediate-scale research in the LLCG has beenconducted to further evaluate the incendivity and performance ofeffective in determining the incendivity of blasting agents. A the low-incendive explosive products and alternative blasting
49
procedures before formal recommendations are made. Most systems to stray electricity. This use of nonelectric initiationimportantly for oil shale mines, these tests need to be conducted eliminates one of the major causes of unwanted detonations inin the presence of CH to determine and confirm the amount of blasting, thus improving safety. However, nonelectric initiation4
stemming material required in each hole to prevent the gas systems, as they exist now, cannot be used in flammableignition. Additional studies also need to be conducted within the atmospheres due to the inherent potential for igniting that at-target strata to determine the minimum spacing requirement mosphere. A nonelectric initiation system that would not presentbetween blast holes with the various explosive products to avoid a hazard in gassy mines would greatly improve the safety ofshock-induced desensitization of the explosives in the adjacent blasting operations. Any proposed, new nonelectric initiationblast holes. This may then require modifying drill patterns and systems would have to be evaluated for safe use in gassy mines.powder factors to optimize the effectiveness of the explosive There is also a need to develop a toxic fumes standard forproduct while reducing the probability of combustible dust approval of various low-incendive blasting agents. Reduction inand/or CH ignitions. the amounts of toxic fumes generated in noncoal blasting4
The mine tests described in this report used an all-electric operations would improve safety, as well as increase efficiency byinitiation system because the current nonelectric systems will allowing work to commence sooner in the shot area. Severalignite flammable gas. However, it would be more beneficial to areas affecting toxic fumes should be examined. First, a standarddevelop a nonelectric initiation system for use in gassy method needs to be developed to determine the toxic fumesatmospheres. The majority of noncoal mine blasting operationsgenerated by blasting agents. Tests exist for cap-sensitivetoday rely on nonelectric methods for initiation of the explosives explosives, but not for blasting agents. Second, the toxicity ofmainly because of the immunity of nonelectric blasting fumes should be better defined. Currently, guidelines
exist that only limit the total quantity for as many as seven typesof fumes. Because the toxicity of some of these types of fumesis greater than that of others, the guidelines should follow sometype of weighted-average technique. Finally, the fumecharacteristics of the explosives need to be determined. Thiswould entail determining which types of explosives generate less,or more, toxic fumes than others and which parameters affect thedetonation of the explosives.
CONCLUSIONS
Our research has contributed to a better understanding of theheadings of typical oil shale operations. However, camerasfire and explosion hazards of blasting in commercial-scale monitoring these same full-scale tests have recorded high-underground oil shale and sulfide ore mining operations. The concentration dust clouds generated by the detonation of the blastdata were obtained through laboratory, gallery, and experimental holes. The ignition of these dust clouds by the hot detonationmine tests and through full-scale blasts in operating oil shale andproducts could result in an unwanted explosion near the blastsulfide ore mines. face. Inert gelled water stemming has been shown in full-scale oil
The experimental mine and laboratory tests have shown that shale field tests to reduce the dust generated from blasting and tooil shale and sulfide ore dust can be ignited given the proper also reduce the air blast overpressures in half. Sulfide ore dustspredispersed concentrations, particle size, and kerogen or sulfur also exhibit a higher degree of explosibility as the particle size be-content. In the Pittsburgh Research Center evaluations, comes finer and the sulfur content increases. Numerous docu-explosions did not occur in oil shale dusts with oil assays less mented sulfide dust ignitions have occurred following blastingthan ~85 L/t (~20 gal/st). For the sulfide ores, explosions did notoperations and have resulted in personnel injuries and productionoccur with sulfur contents less than about 20 to 25 pct, and equipment losses.depending on the particle size and ignitor strength. The oil shale The presence of CH in many of the deep oil shale formationsdusts with the higher kerogen content (higher assays) released poses a significant hazard to underground blasting operations. Amore volatiles when heated and thus required a lower entrained gas sampling system installed at the White River Shale Project indust concentration to ignite and propagate down the heading. Utah sampled the CH emission rates following blastingThese tests have also shown that the oil shale dusts with fineroperations. The average total CH emission rate was 0.4 m /t asparticle sizes required less entrained dust to ignite because the sampled over a 3-h period following the blast. Long-termsmaller particles were pyrolyzed at a faster rate by the ignitionbackground emission rates have been monitored at two deep oilzone flame front, thereby emitting the volatile gases at a faster shale mines. At Horse Draw Mine, CH was continuing to berate. Even though oil shale dust has been shown to be explosible liberated at a rate of 0.74 m /min overin the experimental mine tests, sampling of dust depositions 10 years after mine closure. At the White River Shale Project, onfollowing blasting in oil shale mines has shown that the dust the other hand, background CH emissions decreased from 0.3generated during blasting was an order of magnitude below the m /min following mine closure in 1986 to aboutconcentrations required to propagate an explosion in the large 0.06 m /min 2 years later. Both mines have experienced a CH
4
4
43
43
43
34

50
ignition following blasting. Experimental mine tests have shown shale blasts utilizing drill patterns with hole diameters up tothat even a small amount of CH can significantly reduce the 89 mm, the emulsion-ANFO blend appeared to be considerably4
lower explosible concentration for predispersed oil shale dusts. less incendive than the conventional blasting agent ANFO whileOur research also focused on developing safer explosives for still providing effective fragmentation.
blasting in gassy oil shale mines. Tests conducted at the LLCG As a direct result of this research, the Canadian base metalprovided a means of evaluating the relative incendivity industry and MSHA requested that the research on developmentcharacteristics of an explosive product. Two explosives, a pump- of safer explosives and blasting procedures for oil shale mines beable emulsion-ANFO blend and a prepackaged water gel, were applied to base metal mines in an attempt to reduce the frequencydetermined, through these tests, to exhibit low-incendive qualities of dust ignitions when blasting in high-sulfur-bearing ore. Manycompared with other more highly incendive products, such as of these mines had been experiencing several ignitions monthly,ANFO. These products were then evaluated in operating mines. resulting in significant production delays. Working in
Full-scale field testing of experimental low-incendive conjunction with explosive manufacturers, the Pittsburghexplosives was conducted at three oil shale mines in Colorado. Research Center has been involved in the recent development andBased on data and observations collected during numerous oil testing of a prototype water-gel explosive and an emulsion
blasting agent that have been shown through LLCG testing toexhibit low-incendive characteristics. Full-scale validation testswere conducted at a base metal mine in Alaska and several minesin Canada. After several years of testing and full-production use,no sulfide dust ignitions have occurred when using these low-incendive explosive products.
Based on positive experimental and field testing results, low-incendive explosives show promise as a means of greatlyreducing the occurrences of dust and/or gas ignitions followingblasting operations in oil shale and sulfide ore mines.
ACKNOWLEDGMENTS
The authors thank the management and operations personnelTechnologies International; D. Cranney, Manager of Research,of Exxon Co. U.S.A., Unocal Corp., Occidental Oil Shale Corp., and R. Hopler, Manager of Technical Services, IRECO Corp.;and Kennecott Minerals Co. for their valuable contributions of C. Wade, Technical Manager, Atlas Powder Co.; andtheir mines, materials, and time to this Disaster Prevention P. Rodriquez, Technical Manager, ICI Explosives Canada. Weresearch program. We especially wish to thank the following also thank Blasting Analysis International, Inc., for its con-specific individuals who contributed to the success of this tributions in measuring the detonation velocities at the Loganprogram: L. A. Weakly, Exxon Senior Staff Engineer; Wash site.A. Randle, Vice President, A. Salter, Superintendent, and We acknowledge T. Bartke, Director, and L. Dockter, Chem-G. Baloo, Mining Engineer, Unocal Energy Mining Div.; ical Engineer, Laramie Project Office of DOE; D. Cole, President,D. Starbuck, Senior Project Engineer, and L. Page, Mine Colorado Mining Association; and R. Fischer, Physical Scientist,Manager, White River Shale Oil Corp.; R. Zahradnic, President, and W. Bruce, Chief of Ventilation Div., MSHA's Denver SafetyOccidental Oil Shale Corp.; C. Graham, Vice President, and and Health Technology Center, for their continued support of thisD. VanHouten, Site Manager, Logan Wash, of the EMRx Corp.; project.J. Earnshaw, Superintendent, and J. Morrison and J. Vickery, We also acknowledge the Brunswick Mining and SmeltingProject Engineers, Greens Creek Mining Co. Corp. and Kennecott's Greens Creek Mine for the samples
Additionally, we thank the following for their consider- of sulfide ore. In addition, we thank the following Pittsburgh Re-able contributions to the development of the low-incendive search Center personnel: Ronald S. Conti, Fire Prevention En-explosive formulations and the full-scale testing program: gineer, for the autoignition temperature measurements, andB. Fox, Technical Manager, J. Heinlen, Technical Consult- Gregory M. Green, Physical Science Technician, for assistance inant, J. Dalton, Senior Programs Development Manager, the laboratory explosibility measurements.and G. Weimer, Marketing Representative, Explosive
51
REFERENCES
1. Zahradnik, R. L., and R. G. Vawter. Colorado Tract C-b Demonstration Project 24. Ng, D. L., K. L. Cashdollar, M. Hertzberg, and C. P. Lazzara. ElectronStatus and Plans. Paper in Proceedings of the 23rd Oil Shale Symp. (Golden, CO, May 1-2, Microscopy Studies of Explosion and Fire Residues. USBM IC 8936, 1983, 63 pp.1990). CO Sch. Mines Press, Golden, CO, 1990, pp. 96-99. 25. U.S. Code of Federal Regulations. Title 30—Mineral Resources; Chapter I—Mine
2. Britton, K. The Case for In-Situ. Paper in Proceedings of the 22nd Oil Shale Safety and Health Administration, Department of Labor; Subchapter B—Testing,Symp. (Golden, CO, Apr. 19-20, 1989). CO Sch. Mines Press, Golden, CO, 1989, pp. 161- Evaluation, and Approval of Mining Products;171. Part 15—Requirements for Approval of Explosives and Sheathed Explosive Units; and
3. Reeg, C. P., A. C. Randle, and J. H. Duir. Unocal's Parachute Creek Oil Shale Subchapter N—Metal and Nonmetal Mine Safety and Health;Project. Paper in Proceedings of the 23rd Oil Shale Symp. (Golden, CO, May 1-2, 1990). Part 57—Safety and Health Standards—Underground Metal and Nonmetal Mines; 1995.CO Sch. Mines Press, Golden, CO, 1990, pp. 68-95. 26. Allison, V. C., and A. D. Bauer. Explosibility of Oil-Shale Dust. USBM
4. Richmond, J. K., M. J. Sapko, and L. F. Miller. Fire and Explosion Properties RI 2758, 1926, 8 pp.of Oil Shale. USBM RI 8726, 1982, 39 pp. 27. Richmond, J. K., and L. F. Miller. Explosion and Fire Properties of Oil Shale.
5. Staff, Bureau of Mines. Fire and Explosion Hazards of Oil Shale. USBM RI 9281, Paper in Proceedings of the 10th Oil Shale Symp. (Golden, CO, Apr. 21-22, 1977). CO Sch.1989, 63 pp. Mines Press, Golden, CO, 1977, pp. 45-59.
6. Staff, Office of Technology Assessment. An Assessment of Oil Shale 28. Richmond, J. K., M. J. Sapko, L. F. Miller, A. L. Furno, and L. E. Dalverny.Technologies. Office of Technology Assessment, Congress of the United States, June Fire and Explosion Properties of Oil Shale, Part II. Paper in Proceedings of the 13th1980, pp. 85-115. Oil Shale Symp. (Golden, CO, Apr. 16-18, 1980). CO Sch. Mines Press, Golden, CO, 1980,
7. Russell, P. L. History of Western Oil Shale. Cent. Prof. Adv., pp. 193-207.E. Brunswick, NJ, 1980, p. 152. 29. Richmond, J. K., M. J. Sapko, L. F. Miller, and L. E. Dalverny. Explosion
8. Wang, J-Q, and Qian, J-L. Oil Shale Research in China. Paper in Proceedings Hazards in Gassy and Non-Gassy Oil Shale Mines. Paper in Proceedings of the 14th Oilof the 22nd Oil Shale Symp. (Golden, CO, Apr. 19-20, 1989). CO Sch. Mines Press, Golden, Shale Symp. (Golden, CO, Apr. 22-24, 1981). CO Sch. Mines Press, Golden, CO, 1981, pp.CO, 1989, 15 p. 61-74.
9. Hou, S. L. (ed.). Chinese Shale Oil Industry. The Hydrocarbon Processing 30. Cashdollar, K. L., I. Liebman, and R. S. Conti. Three Bureau of Mines OpticalPress, Beijing, China, 1986, 34 pp. Dust Probes. USBM RI 8542, 1981, 26 pp.
10. East, J. H., Jr., and E. D. Gardner. Oil-Shale Mining, Rifle, Colo., 1944-56. 31. Conti, R. S., K. L. Cashdollar, and I. Liebman. Improved Optical Probe forUSBM Bull. 611, 1964, 163 pp. Monitoring Dust Explosions. Rev. Sci. Instr., v. 53, No. 3, 1982,
11. Virgona, J. E. Decommissioning of the U.S. Department of Energy Anvil Points pp. 311-313.Oil Shale Research Facility. Paper in Proceedings of the 19th Oil Shale Symp. (Golden, 32. Cashdollar, K. L. Three-Wavelength Pyrometer for Measuring Flame Tem-CO, Apr. 21-22, 1986). CO Sch. Mines Press, Golden, CO, 1986, pp. 161-176. peratures. Appl. Opt., v. 18, No. 15, 1979, pp. 2595-2597.
12. Crookston, R. B., M. T. Atwood, R. E. Williams, and M. D. McGuire. An 33. Cashdollar, K. L., and M. Hertzberg. Infrared Pyrometers for Measuring DustEvaluation of the Fire and Explosion Hazards of Oil Shale Mining and Processing; volume Explosion Temperatures. Opt. Eng., v. 21, 1982, pp. 82-86.1: Analytical Studies and Accident Scenarios (contract J0275001, Tosco Corp.). USBM OFR 34. . 20-L Explosibility Test Chamber for Dusts and Gases. Rev. Sci. Instr.,12(1)-85, 1983, 268 pp.; NTIS PB 85-165492. v. 56, 1985, pp. 596-602.
13. Crookston, R. B., and M. D. McGuire. An Evaluation of the Fire and Explosion 35. Cashdollar, K. L., M. J. Sapko, E. S. Weiss, and M. Hertzberg. Laboratory andHazards of Oil Shale Mining and Processing; volume 2: Data Summary of Anvil Points Raw Mine Dust Explosion Research at the Bureau of Mines. Paper in Industrial DustShale Waste Pile Combustion (contract J0275001, Tosco Corp.). USBM OFR 12(2)-85, 1983,Explosions, STP 958, ASTM, Philadelphia, PA, 1987,144 pp.; NTIS PB 85-165959. pp. 107-123.
14. . An Evaluation of the Fire and Explosion Hazards of Oil Shale Mining and 36. Cashdollar, K. L., E. S. Weiss, and N. B. Greninger. Laboratory and Large-Processing; volume 3: Oil Shale Mine Dust Program (contract J0275001, Tosco Corp.). Scale Dust Explosion Research. Plant/Operations Progress, v. 11, series 4, 1992,USBM OFR 12(3)-85, 1983, 74 pp.; NTIS PB 85-165967. pp. 247-255.
15. Ridley, R. D. Progress in Occidental's Shale Oil Activities. Paper in Pro- 37. Stanfield, K. E., I. C. Frost, W. S. McAuley, and H. N. Smith. Properties ofceedings of the 11th Oil Shale Symp. (Golden, CO, Apr. 12-14, 1978). CO Sch. Mines Colorado Oil Shale. USBM RI 4825, 1951, 27 pp.Press, Golden, CO, 1978, pp. 169-175. 38. Cashdollar, K. L., M. Hertzberg, and R. S. Conti. Explosion Hazards of Oil
16. Marshall, P. W. Colony Development Operation Room-and-Pillar Oil Shale Shale Dusts: Limits, Pressures, and Ignitability. Paper in Proceedings of the 17th OilMining. Paper in Proceedings of the 7th Oil Shale Symp. (Golden, CO, Apr. 1974). CO Shale Symp. (Golden, CO, Apr. 16-18, 1984). CO Sch. Mines Press, Golden, CO, 1984, pp.Sch. Mines Press, Golden, CO, 1974, pp. 171-184. 243-254.
17. Cummings, K. B., L. J. Cato, and J. W. Gregory. Methane Monitoring at the White 39. Conti, R. S., K. L. Cashdollar, M. Hertzberg, and I. Liebman. Thermal andRiver Shale Project. MSHA Technical Report, Denver, CO, 1984, 17 pp. Electrical Ignitability of Dust Clouds. USBM RI 8798, 1983, 40 pp.
18. Sohio Withdraws From Shale Oil Project. Min. Eng., Apr. 1984, 40. Conti, R. S., and M. Hertzberg. Thermal Autoignition Temperatures From the p. 327. 1.2-L Furnace and Their Use in Evaluating the Explosion Potential of Dusts. Paper in
19. Tisot, P. R., and W. I. R. Murphy. Physical Structure of Green River Oil Shale. Industrial Dust Explosions, STP 958, ASTM, Philadelphia, PA, 1987, pp. 45-59.Chem. Eng. Prog., Symp. Ser., v. 61, 1965, pp. 25-32. 41. Conti, R. S., K. L. Cashdollar, and R. A. Thomas. Improved 6.8-L Furnace for
20. Meddaugh, W. S., and C. A. Salotti. Mineralogy and Geochemistry of Green River Measuring the Autoignition Temperatures of Dust Clouds. USBM RI 9467, 1993, 26 pp.Formation. Paper in Proceedings of the 16th Oil Shale Symp. (Golden, CO, Apr. 13-15,1983). CO Sch. Mines Press, Golden, CO, 1983, pp. 113-123.
21. Salotti, C. A., and R. S. Datta. Size Reduction of Green River Oil Shale.Paper in Proceedings of the 16th Oil Shale Symp. (Golden, CO, Apr. 13-15, 1983). CO Sch.Mines Press, Golden, CO, 1983, pp. 394-412.
22. Stanfield, K. E., and I. C. Frost. Method of Assaying Oil Shale by a ModifiedFischer Retort (Revision of RI 3977). USBM RI 4477, 1949, 13 pp.
23. American Society for Testing and Materials. Standard Test Method for Oil FromOil Shale (Resource Evaluation by the USBM Fischer Assay Procedure), D3904. Section in1993 Annual Book of ASTM Standards: V. 05.03, Petroleum Products and Lubricants (III),pp. 617-626.
52
42. Zabetakis, M. G. Flammability Characteristics of Combustible Gases and 62. Weiss, E. S., and M. J. Sapko. Oxygen Balanced Emulsion-ANFO Blends for UseVapors. USBM Bull. 627, 1965, 121 pp. in Flammable Atmospheres. Paper in Proceedings of the Sixth Annu. Symp. on Explosive
43. Kuchta, J. M. Investigation of Fire and Explosion Accidents in the Chemical, and Blasting Research. Soc. Explosives Eng., 1990, pp. 193-204.Mining, and Fuel-Related Industries—A Manual. USBM Bull. 680, 1986, 84 pp. 63. E. I. du Pont de Nemours and Co., Inc. (ed). Blasters' Handbook (175th
44. Hertzberg, M., K. L. Cashdollar, and I. A. Zlochower. Flammability Limit Anniversary ed., Wilmington, DE: Technical Service Section, 1978), pp. 31-54.Measurements for Dusts and Gases: Ignition Energy Requirements and Pressure 64. Hertzberg, M., and K. L. Cashdollar. Flammability Behavior and PressureDependences. Paper in Proceedings of the 21st Int. Symp. on Combustion. Combustion Development of Hydrogen Mixtures in Containment Volumes. Paper in Thermal-HydraulicsInst., Pittsburgh, PA, 1986, pp. 303-313. of Nuclear Reactors, v. 1, (Proceedings of the Second Int. Topical Meet. on Nuclear
45. Weiss, E. S., K. L. Cashdollar, and M. J. Sapko. Dust and Pressure Generated Reactor Thermal-Hydraulics, Santa Barbara, CA, Jan. 11-14, 1983) Am. Nuclear Soc., LaDuring Commercial Oil Shale Mine Blasting. Paper in Proceedings of the 18th Oil Shale Grange, IL, 1983, pp. 29-37.Symp. (Grand Junction, CO, Apr. 22-24, 1985). CO Sch. Mines Press, Golden, CO, 1985, pp. 65. Cashdollar, K. L., M. Hertzberg, I. A. Zlochower, C. E. Lucci, G. M. Green, and68-76. R. A. Thomas. Laboratory Flammability Studies of Mixtures of Hydrogen, Nitrous Oxide,
46. . Dust and Pressure Generated During Commercial Oil Shale Mine Blasting: and Air. Contract report WHC-SD-WM-ES-219, Westinghouse Hanford Co., Richland, WA,Part II. Paper in Proceedings of the 19th Oil Shale Symp. (Golden, CO, Apr. 21-22, 1992, 71 pp.1986). CO Sch. Mines Press, Golden, CO, 1986, pp. 47-58. 66. Van Dolah, R. W., N. E. Hanna, E. J. Murphy, and G. H. Damon. Further Studies
47. Cox, K. C. Experiences in Equipping a 96-Inch Diameter Shaft and Mining Bulk of Ammonium Nitrate - Fuel Oil Composition. Tech. Series Bull. No. 98 (Univ. MO Sch.Samples of Oil Shale, Dawsonite, and Nahcolite. Paper in Proceedings of the 12th Oil Mines and Metall., 1960) 90 pp.Shale Symp., Denver, CO, Apr. 17-20, 1979, 67. Weiss, E. S., E. M. Bazala, and M. J. Sapko. Development of Low Incendivepp. 179-183. Blasting Agents for Use Under Gassy Oil Shale Mine Conditions. Paper in Proceedings of
48. Vinson, R. P., K. C. Cox, and F. N. Kissell. Methane Encountered at the Bureau the 23rd Oil Shale Symp. (Golden, CO, May 1-2, 1990). CO Sch. Mines Press, Golden, CO,of Mines Oil Shale Shaft. Paper in Proceedings of the 12th Oil Shale Symp., Denver, CO, 1990, pp. 26-40.Apr. 17-20, 1979, pp. 339-341. 68. Baloo, G. L. Development of Production Drill Bits and Blast Rounds. Paper in
49. Kissell, F. N. The Potential Hazards of Methane Gas in Oil Shale Mines. Paper Proceedings of the 22nd Oil Shale Symp. (Golden, CO, Apr. 19-20, 1989). CO Sch. Minesin Proceedings of the Environmental Oil Shale Symp., CO Sch. Mines, Denver, CO, v. 70, Press, Golden, CO, 1989, pp. 85-100.No. 4, Oct. 1975, pp. 19-27. 69.Weiss, E. S., K. L. Cashdollar, M. J. Sapko, and E. M. Bazala. Field
50. Matta, J. E., J. C. LaScola, and F. N. Kissell. Methane Absorption in Oil Shale Evaluations With a Low Incendive Blasting Agent in Oil Shale Mines. Paper inand Its Potential Mine Hazard. USBM RI 8243, 1977, 13 pp. Proceedings of the 24th Oil Shale Symp. (Golden, CO, Apr. 23-24, 1991). CO Sch. Mines
51. Weichman, B. Mining in the Saline Zone. Am. Min. Congr., San Francisco, CA,Press, Golden, CO, 1991, pp. 56-72.Sept. 21-24, 1980, 10 pp. 70. Sapko, M. J., E. S. Weiss, and R. W. Watson. Size Scaling of Gas Explosions:
52. Sapko, M. J., J. K. Richmond, and J. P. McDonnell. Continuous Monitoring of Bruceton Experimental Mine Versus the Lake Lynn Mine. USBM RI 9136, 1987, 23 pp.Methane in a Deep Oil Shale Mine. Paper in Proceedings of the 15th Oil Shale Symp. 71. Santis, L. D., and R. A. Cortese. A Method of Measuring Continuous Detonation(Golden, CO, Apr. 28-30, 1982). CO Sch. Mines Press, Golden, CO, 1982, pp. 320-340.Rates Using Off-the-Shelf Items. Paper in Proceedings of the 22nd Annu. Conf. on
53. Sapko, M. J., E. S. Weiss, and K. L. Cashdollar. Methane Released During Explosives and Blasting Technique (Orlando, FL, Feb. 4-8, 1996). Soc. Expl. Eng., 1996,Blasting at the White River Shale Project. Paper in Proceedings of the 19th Oil Shale 11 pp.Symp. (Golden, CO, Apr. 21-22, 1986). CO Sch. Mines Press, Golden, CO, 1986, pp. 59-68. 72. Gardner, E. D. and E. Stein. Explosibility of Sulfide Dusts in Metal Mines.
54. Weiss, E. S., M. J. Sapko, and E. M. Bazala. Assessment of Gas and Dust USBM RI 2863, 1928, 11 pp.Explosion Hazards in Oil Shale Mining Using ANFO. Paper in Proceedings of the 22nd Oil 73. Nagy, J. The Explosion Hazards in Mining. MSHA IR 1119, 1981, 69 pp.Shale Symp. (Golden, CO, Apr. 19-20, 1989). CO Sch. Mines Press, Golden, CO, 1989, pp. 74. Job, A. L. Heat Generation and Dust Explosions in the Mining of Sulfide Ores -101-108. A Literature Survey. Can. Dept. Energy, Mines and Resources, Ottawa, Ontario, Canada.
55. Kim, A. G. Estimating Methane Content of Bituminous Coalbeds From AdsorptionCANMET Rep. MRP/MRL 75-35 (LS), Apr. 1975, 33 pp.Data. USBM RI 8245, 1977, 22 pp. 75. Enright, R. J. Sulfide Dust Explosions in Metalliferous Mines. Proc.
56. Mason, C. M., and E. G. Aiken. Methods for Evaluating Explosives and Hazardous Australas. Inst. Min. Metall., No. 289, Oct. 1984, pp. 253-257.Materials. USBM IC 8541, 1972, pp. 26-29. 76. . Practical and Theoretical Aspects of Sulphide Dust Explosions. Can.
57. Weiss, E. S., M. J. Sapko, and R. W. Watson. Blasting Agents for Use in Dept. Energy, Mines and Resources, Ottawa, Ontario, Canada. CANMET Rep. of ContractFlammable Atmospheres. Paper in Proceedings of the 15th Conf. on Explosives and 23440-7-9046, Apr. 1988, 144 pp.Blasting Technique, New Orleans, LA, Feb. 5-10, 1989. Soc. Expl. Eng., 1989, pp. 329- 77. . Hazards Associated With Sulphide Dust Explosions. Paper in Proceedings338. of Minesafe Int. 1990, Perth, Australia, Sept. 10-14, 1990, 10 pp.
58. . Preferred Explosives for Blasting in Oil Shale Mines. Paper in Int. 78. Ninteman, D. J. Spontaneous Oxidation and Combustion of Sulfide Ores inConf. on Oil Shale and Shale Oil in conjunction with the Proceedings of the 21st Oil Underground Mines. USBM IC 8775, 1978, 36 pp.Shale Symp. (Beijing, China, May 16-19, 1988). Chem. Ind. Press, China, 1988, pp. 584- 79. Holding, W. An Approach to the Potential Problem of Sulphide Dust Ignitions591. at Prieska Copper Mine. Paper in Proceedings of the Int. Mine Ventilation Congr.,
59. Hertzberg, M., K. L. Cashdollar, C. P. Lazzara, and A. C. Smith. Inhibition Johannesburg, Rep. of South Africa, 1975, pp. 207-211.and Extinction of Coal Dust and Methane Explosions. USBM RI 8708, 1982, 29 pp. 80. Day, P. R., and W. Webster. Two Potential Safety Problems Which May Occur When
60. Hertzberg, M., K. L. Cashdollar, I. Zlochower, and D. L. Ng. Inhibition and Blasting Big Boreholes Underground. Paper in Proceedings of the Fifth Annu. DistrictExtinction of Explosions in Heterogeneous Mixtures. Paper in Proceedings of the 20th Four Meet. of the Can. Inst. of Min. and Metall., Flin Flon, Manitoba, Canada, Sept. 20,Int. Symp. on Combustion, Combustion Inst., Pittsburgh, PA, 1985, pp. 1691-1700.1980, pp. 1-16.
61. Liebman, I., and J. K. Richmond. Ranking of Extinguishing Agents Against Coal 81. DuRussel, E. N. Generation of Sulphur Dioxide in Blasting at Fox Mine. Can.Dust Explosions. Paper in Proceedings of the 18th Int. Conf. of Sci. Res. in the Field Inst. of Min. and Metall., CIM Bull., v. 74, Aug. 1981, pp. 80-82.of Safety at Work in the Min. Ind. (Dubrovnik, Yugoslavia, Oct. 7-14, 1979), 82. Byberg, K. G. Sulfide Dust Explosion as Referenced to the Geco Operations ofpp. 239-247. Noranda Minerals Inc., Manitouwadge, Ontario. Paper in
53
Proceedings of the M.A.P.A.O. Annu. Meet., Toronto, Ontario, Canada, 87. Soundararajan, R. Explosibility Characteristics of the Iron Sulphides: FeSMay 29, 1986, 26 pp. and FeS. Ph.D. Thesis, Tech. Univ. of Nova Scotia, Halifax, Nova Scotia, Canada, 1996,
83. Wheeland, K. G., and D. McKinnon. The Cause, Prevention, and Control of 185 pp.Secondary Dust Explosions of Sulphide Ores. Paper at Sulphide Dust Explosion Conf., 88. Soundararajan, R., P. R. Amyotte, and M. J. Pegg. Explosibility Hazard of IronManitouwadge, Ontario, Canada, Oct. 23-24, 1986, 22 pp. Sulphide Dusts as a Function of Particle Size. J. Hazardous Mater., to be published in
84. Mintz, K. J., and E. D. Dainty. Sulphide Ore Dust Explosion Research in 1996.Canada. Paper in Proceedings of the 23rd International Conference of Safety in Mines 89. Polikarpov, A. D., and E. I. Chernyavskii. Rasprostranenie plameni priResearch Institutes, Washington, DC, Sept. 11-15, 1989, comp. by E. T. Wallace and T. vzryvakh sul'fidnoi pyli v gornykh vyrabotkakh (Flame Propagation Around Sulfide DustH. Koslosky. USBM OFR 27-89, 1989, Explosions in Underground Workings). Izvestiia vysshikh uchebnykh zavedenii - Gornyipp. 888-895; NTIS PB 89-225262/AS. zhurnal (Proceedings of Higher Educational Institutions - Mining Journal), No. 4, 1982,
85. Liu, Q. Investigation of the Explosibility of Sulfide Dusts. Ph.D. Thesis, pp. 36-38 (in Russian).Queen's Univ. at Kingston, Ontario, Canada, 1991, 246 pp. 90. Blasting in Oil Shale Mines. Report by representatives of MSHA, USBM, oil
86. Liu, Q., and P. D. Katsabanis. Hazard Evaluation of Sulphide Dust Explosions. shale industry, and Institute of Makers of Explosives. Sept. 1984, 11 pp. AvailableJ. Hazardous Mater., v. 33, 1993, pp. 35-49. from Eric S. Weiss, Pittsburgh Research Center.
2

54
APPENDIX.—ABBREVIATIONS USED IN THIS REPORT
ANFO ammonium nitrate-fuel oil MEC minimum explosible concentration
BEM Bruceton Experimental Mine MSHA Mine Safety and Health Administration
CFR Code of Federal Regulations PETN pentaerythritol tetranitrate
DOE U.S. Department of Energy PPC Pittsburgh pulverized coal
hvb high-volatile bituminous SEM scanning electron microscope
LFL lean flammable limit USBM U.S. Bureau of Mines
LLCG Lake Lynn cannon gallery VOD velocity of detonation
lvb low-volatile bituminous VODR velocity-of-detonation recorder
MAIT minimum autoignition temperature

55
Cover photo: Logan Wash oil shale mine at outcrop near DeBeque, Mesa County, CO. (Photo by Kenneth L. Cashdollar,Pittsburgh Research Center.)