Second-order effects plus pan-European political swings...
12
Second-order effects plus pan-European political swings: An analysis of European Parliament elections across time Simon Hix a, 1 , Michael Marsh b, * a Department of Government, London School of Economics and Political Science, Houghton Street, London, WC2A 2AE, United Kingdom b Faculty of Arts, Humanities & Social Sciences, Arts Building, Trinity College, Dublin 2, Ireland article info Article history: Received 22 September 2010 Accepted 24 September 2010 Keywords: Elections European Union Second-order Political behaviour Parties Party families European Parliment abstract After seven waves of European Parliament elections and European Union enlargement to 27 states, the time is ripe to analyse the temporal robustness of the second-order model. We pool all the elections in a single evaluation and also look at election-by-election variations. We analyse changes in party performance over time in all EU states as well as in the ‘original 10’, to see whether any cross-time changes are driven by the changing composition of the EU. We also look for pan-European trends in each election, as a way identifying ‘European effects’ distinct from second-order effects. There are few consistent winners and losers, although socialist parties performed worse in the last three elections than their size and government status would predict. Ó 2010 Elsevier Ltd. All rights reserved. 1. Introduction: pan-European swings in European parliament elections? The seventh set of European Parliament elections were held on June 2009. While there is evidence that ‘Europe’ was more prominent in the campaigns than it once might have been (Shuck et al, 2011) these contests were still dominated by domestic issues, parties, politicians and government performance rather than issues on the EU agenda, the positions of the political groups in the Euro- pean Parliament, or the performance of individual MEPs. The classic ‘second-order national elections’ model of European Parliament elections – which sees these elections as fought in the shadow of the (first-order) national government elections – certainly seemed as robust as ever in June 2009. The two main propositions of the second- order model held strong in the 2009 elections: that (1) governing parties lose vote-share compared to the preceding national election, and (2) large parties also lose vote-share compared to the preceding national election, regardless of whether they are in government or opposition. Yet, something else occurred in June 2009 that does not fit so neatly into the standard second-order national elec- tions model of European Parliament elections. Across Europe, socialist parties were seen to have performed particularly badly, whether in government or opposition. The British Labour Party (in government) and the French Socialists (in opposition) slumped to historic lows in the polls, of 16 and 17 per cent, respectively. The German SPD (in government) fell to 21 per cent, and the new Democratic Party in Italy (in opposition) lagged behind Berlusconi’s new People of Freedom party by almost 10 per cent. Social democratic parties came third in Finland, the Netherlands and Poland, fourth in Flanders, fifth in Estonia, and were well beaten by centre-right parties in Austria, Bulgaria, the Czech Republic, Hungary, Lithuania, Luxembourg, Portugal, Slovenia, and Spain. Socialist parties in opposition topped the polls in Sweden, Denmark, Greece, Wallonia, Latvia, Malta, Romania, and Slovakia, and the small Labour Party * Corresponding author. Tel.: þ353 01 8961070. E-mail addresses: [email protected] (S. Hix), [email protected] (M. Marsh). 1 Tel.: þ44 20 7955 7657. Contents lists available at ScienceDirect Electoral Studies journal homepage: www.elsevier.com/locate/electstud 0261-3794/$ – see front matter Ó 2010 Elsevier Ltd. All rights reserved. doi:10.1016/j.electstud.2010.09.017 Electoral Studies 30 (2011) 4–15
Transcript of Second-order effects plus pan-European political swings...

Second-order effects plus pan-European political swings: An analysis
of European Parliament elections across time
Simon Hix a,1, Michael Marsh b,*
aDepartment of Government, London School of Economics and Political Science, Houghton Street, London, WC2A 2AE, United Kingdomb Faculty of Arts, Humanities & Social Sciences, Arts Building, Trinity College, Dublin 2, Ireland
a r t i c l e i n f o
Article history:
Received 22 September 2010
Accepted 24 September 2010
Keywords:
Elections
European Union
Second-order
Political behaviour
Parties
Party families
European Parliment
a b s t r a c t
After seven waves of European Parliament elections and European Union enlargement to
27 states, the time is ripe to analyse the temporal robustness of the second-order model.
We pool all the elections in a single evaluation and also look at election-by-election
variations. We analyse changes in party performance over time in all EU states as well as in
the ‘original 10’, to see whether any cross-time changes are driven by the changing
composition of the EU. We also look for pan-European trends in each election, as a way
identifying ‘European effects’ distinct from second-order effects. There are few consistent
winners and losers, although socialist parties performed worse in the last three elections
than their size and government status would predict.
! 2010 Elsevier Ltd. All rights reserved.
1. Introduction: pan-European swings in European
parliament elections?
The seventh set of European Parliament elections were
held on June 2009. While there is evidence that ‘Europe’
was more prominent in the campaigns than it once might
have been (Shuck et al, 2011) these contests were still
dominated by domestic issues, parties, politicians and
government performance rather than issues on the EU
agenda, the positions of the political groups in the Euro-
pean Parliament, or the performance of individual MEPs.
The classic ‘second-order national elections’ model of
European Parliament elections –which sees these elections
as fought in the shadow of the (first-order) national
government elections – certainly seemed as robust as ever
in June 2009. The two main propositions of the second-
order model held strong in the 2009 elections: that (1)
governing parties lose vote-share compared to the
preceding national election, and (2) large parties also lose
vote-share compared to the preceding national election,
regardless of whether they are in government or
opposition.
Yet, something else occurred in June 2009 that does not
fit so neatly into the standard second-order national elec-
tions model of European Parliament elections. Across
Europe, socialist parties were seen to have performed
particularly badly, whether in government or opposition.
The British Labour Party (in government) and the French
Socialists (in opposition) slumped to historic lows in the
polls, of 16 and 17 per cent, respectively. The German SPD
(in government) fell to 21 per cent, and the newDemocratic
Party in Italy (in opposition) lagged behind Berlusconi’s
new People of Freedom party by almost 10 per cent. Social
democratic parties came third in Finland, the Netherlands
and Poland, fourth in Flanders, fifth in Estonia, and were
well beaten by centre-right parties in Austria, Bulgaria, the
Czech Republic, Hungary, Lithuania, Luxembourg, Portugal,
Slovenia, and Spain. Socialist parties in opposition topped
the polls in Sweden, Denmark, Greece, Wallonia, Latvia,
Malta, Romania, and Slovakia, and the small Labour Party
* Corresponding author. Tel.: þ353 01 8961070.
E-mail addresses: [email protected] (S. Hix), [email protected] (M. Marsh).1 Tel.: þ44 20 7955 7657.
Contents lists available at ScienceDirect
Electoral Studies
journal homepage: www.elsevier .com/locate/e lectstud
0261-3794/$ – see front matter ! 2010 Elsevier Ltd. All rights reserved.
doi:10.1016/j.electstud.2010.09.017
Electoral Studies 30 (2011) 4–15

gained two seats in Ireland, but these successes counted for
little against the losses for the centre-left in the other
member states. In terms of the proportion of MEPs, the
socialist group in the European Parliament that emerged
from the June 2009 elections was the smallest it had ever
been (with only 25 per cent of the MEPs).
It appears that something pan-European happened in
June 2009. Perhaps this was a collective response by
European citizens to the global economic and financial
crisis of 2008–09, which encouraged them to flock to the
apparent economic security of centre-right parties, as they
had done in response to the recession in the 1970s. From
the point of view of understanding European Parliament
elections, though, the cause of the socialists’ defeat in 2009
is perhaps less significant than whether this pan-European
effect was a unique occurrence. After all, there had been an
alleged ‘green tide’ in the 1989 European Parliament elec-
tions and a sudden rise of anti-European parties in the 1994
elections (e.g. Curtice, 1989; Lodge, 1996; Taggart, 1998). In
the standard models of European Parliament elections,
which focus on average governing party and party-size
effects and pool results from all European Parliament
elections, have pan-European swings in European Parlia-
ment elections been ignored? If, indeed, there have been
certain pan-European shifts in the behaviour of voters in
European Parliament elections, either towards or away
from particular families of parties, then European Parlia-
ment elections might in fact be more ‘European’ than the
standard model of these elections assumes (cf. Blondel
et al., 1997; Carrubba and Timpone, 2005; Schmitt, 2005;
Clark and Rohrschneider, 2009).
What we consequently do in this paper is look in detail
at the aggregate level performance of parties in European
Parliament elections across time. After thirty years of these
elections we have almost 800 outcomes (in terms of
national party voter shares) to look at. This provides a rich
source of data to investigate the robustness over time of the
second-order national elections model as well as whether
pan-European swings between party families in particular
elections can be identified. Certainly, the European Union
(EU) has changed dramatically in thirty years, both in terms
of the powers of the EU and of the European Parliament
itself as well as in terms of the composition of the EU.2 To
investigate whether any cross-time effects in the data are
driven by EU composition effects we compare the cross-
time patterns of all EU member states to those of the
‘original 10’ EUmember states (the ninemembers of the EU
who held elections in 1979, plus Greece, who held its first
European Parliament election in 1981).3
The rest of the paper is organised as follows. We first
focus on the two standard second-order effects across time:
(1) the performance of governments, and (2) the effect of
party size. We then turn to party families, and whether
there were any party-family swings in particular elections,
and whether there are any systematic party-family trends
over time.
2. Second-order effects: governing status and party
size
Because European Parliament elections do not lead to
the formation of a government, these contests are far less
important for voters, the media and national politicians
than are elections for national parliaments. The standard
‘second-order national elections’ model consequently
posits that European Parliament elections are relatively low
salience contests, fought in the shadow of the contest for
the main (first-order) national election by the same parties
as contest national elections, with a subsequent focus on
the national arena rather than European level issues, the
performance of the political groups in the European
Parliament, or the policy positions of national parties
towards the EU. At micro-level, this encourages voters to
behave differently from how they would if a national
parliament election were held at the same time. The fact
that a national government is not being elected frees them
to express their opposition to a particular government, or
to vote sincerely, by supporting their most-preferred
(small) party rather than their second or third most-
preferred (large) party which has a chance of winning
a national parliament election; or to signal their prefer-
ences on a particular policy issue they care about which the
main parties are ignoring, such as the environment, or
immigration (cf. Reif and Schmitt, 1980; Reif, 1984; van der
Eijk and Franklin, 1996; Marsh, 1998; Ferrara and
Weishaupt, 2004). In consequence, and broadly speaking,
the second-order national election model predicts that
European Parliament elections should not have much to do
with ‘Europe’. The exception to this would be where
European issues were a normal part of the national elec-
toral contest, and there is evidence that this was charac-
teristic of 2009 (de Vries et al, 2011) but in that case we
would still expect European Parliament election outcomes
to follow a second-order pattern.
The aggregate result, as Hix and Marsh (2007, p. 496)
explain, is that:
The classic second-order elections theory predicts three
aggregate outcomes in European elections: (1) parties in
government at the time of a European Parliament
election will receive a smaller share of the vote than
they did in the previous national election; (2) the larger
a political party, in terms of its vote-share in the
previous national election, the more votes it will lose in
the subsequent European election; and (3) the timing of
a European election in a national election cycle will
determine the size of the effects in (1) and (2).
We focus our analysis on the first two hypotheses. With
each hypothesis we first look at aggregate effects, pooling
all seven sets of European Parliament elections in all EU
member states. Having looked at the aggregate pattern we
then investigate trends over time, or fluctuations from the
aggregate pattern, by looking at each set of elections
separately. Of course, even if the expected aggregate results
2 Franklin (2001), for example, finds that enlargement of the EU to
states who on average have lower levels of voter turnout in European
elections than the original EU member states explains almost all the
aggregate decline in turnout in European Parliament elections.3 The nine EU member states in 1979 were Belgium, Denmark, France,
Germany, Ireland, Italy, Luxembourg, the Netherlands, and the United
Kingdom.
S. Hix, M. Marsh / Electoral Studies 30 (2011) 4–15 5

hold this does not demonstrate the truth of the underlying
micro-level assumptions. Wewill return to this point in our
conclusion.
To investigate the first of hypothesis, Fig. 1 shows the
performance of all governments in all European Parliament
elections between 1979 and 2009 relative to their previous
national election performance (combining the vote-shares
of parties in coalition governments), plotted against the
timing of the European Parliament election in the national
election cycle.4 On average, governments in European
Parliament elections were 7.5 per cent down on their vote-
share in the previous national election. Moreover, govern-
ment losses were greater the further into the national
election cycle the European Parliament elections were held,
as the quadratic regression line shows in the figure. In other
words, the swing against parties in government in Euro-
pean Parliament elections may be varied, but is unambig-
uous. One significant feature here is the absence of a clear
mid-term trough: there is a honeymoon, apparently, but
not a clear recovery in the time close to the next general
election.5 The fall in their support is not linked to the
electoral cycle in the way it once was (e.g. Marsh, 1998).
To look at changes in the extent of losses since 1979,
Fig. 2 plots the average losses of governments in each
European Parliament election separately: for all EU
member states in the top panel of the figure, and for only
the ‘original 10’ countries in the bottom panel.6 The ratio-
nale for this comparison is to see whether cross-time
effects are driven by the changing composition of the EU
rather than a change in the overall fit of the second-order
model. For example, the second-order model might not fit
some of the new EU member states as well as the original
10, in which case any changes in the fit of the second-order
model over time might be a result of enlargement of the EU
rather than a decline in the fit of the model for European
Parliament elections in the original 10.
Looking at the cross-time trends, despite the fact that Reif
and Schmitt (1980) advanced the second-order national
model in the aftermath of the first European Parliament
elections, the 1979 elections were in fact the least second-
order of all seven sets of elections, where government
performance is concerned. In fact, the anti-government
effect in European Parliament elections increased signifi-
cantly between 1979 and 1994, fell slightly in 1999, but then
re-emerged clearly again in 2004 and 2009.
One way of interpreting this pattern is that there was
a novelty effect during the first European Parliament elec-
tions, as a result of widespread excitement and media
coverage surrounding the first experiment in supranational
democracy (e.g. Blumler and Fox, 1980). This effect may
have continued, although to a lesser extent, in each new
country that joined in the EU and held their first elections
to the European Parliament. But after these novelty effects
had worn off, the standard second-order effect kicked in
and has remained pretty stable over 25 years.
-30
-20
-10
010
20
0 .2 .4 .6 .8 1
National electoral cycle
Fig. 1. Performance of governments in European Parliament elections.
Fig. 2. Government performance across time.
4 This figure plots the results from the first model in Table A4 in the
Appendix. We have ignored those cases where European Parliament and
general elections are coincident, as they always are on Luxembourg and
have been occasionally in Greece (1981), Ireland (1989) and Belgium
(1999), for example.5 In fact, the regression with the polynomial term performs only
marginally better than a simple linear model: adjusted R-squared is 0.059
as opposed to 0.049. Neither model performs well in predicting losses.6 In the box plots in the figures, the lines in the middle of each box are
the median effects, the left and right of the boxes are the 25th and 75th
percentiles of the distributions, respectively, the ends of the ‘whiskers’
mark plus/minus 1.5 median or (if these are smaller, the extreme cases)
and the outliers beyond these points are indicated with dots.
S. Hix, M. Marsh / Electoral Studies 30 (2011) 4–156

Furthermore, this changing cross-time effect cannot be
explained by the altered composition of the EU. There are
only small differences in the trends shown in Fig. 2A (for
all EU countries) and Fig. 2B (for the original 10 countries
holding elections to the first European Parliament, nine of
them in 1979 and Greece in 1981). The swings against
governments were slightly larger in the 1999 and 2009
elections in the original 10 member states than the
average anti-government swings in these elections across
all 15 and 27 member states respectively. However, there
was a slightly smaller swing against the governing parties
in the original 10 countries in the 2004 elections,
compared to the average of all 25 countries in that
election.7
In general, over the past 30 years, despite the increasing
policy competences of the EU and the increasing powers of
the European Parliament to shape outcomes on these
policies, swings against national governments have actu-
ally increased in European Parliament elections rather than
decreased. The enlargement of the EU from 10 to 27
member states in this period has not had any major effect
on this general pattern.
While the losses suffered by government parties could
be due to a second-order effect, it could also be that
governments are simply paying the price of being in
government, and that these losses are simply a forerunner
of what is in store for them at the next election. The
weakness of a clear cyclical pattern is perhaps more in
accord with a more significant decline in government
support than a temporary loss. Schmitt (2009) makes the
same point about 2004, demonstrating that government
losses tend to grow as the national cycle unfolds.
Van der Eijk and van Egmond (2007) (see also van
Egmond, 2007) examined pattern of vote switching
between parties using polling data about a hypothetical
general election at the same time as the European Parlia-
ment election as the point of comparison and concluded
that there was no sign of significant switching from
government to opposition parties. However, Ferrara and
Weishaupt (2004) demonstrated that government losses
in European Parliament elections were greater than would
be expected from a thesis of secular decline. This finding is
reinforced if we look at losses suffered by governments in
all elections prior to 2009. These were typically greater in
the European Parliament election than in the subsequent
national election: 9.2 percentage points in the European as
against 8.0 in the subsequent national election.8 These
differences are not large, but certainly run counter to the
idea that government losses are not in any way a second-
order effect.
Turning to the second main hypothesis from the
second-order national election model, relating to the
effect of party size on party performance, Fig. 3 plots
party gains/losses in European Parliament elections
(compared to the preceding national general election
performance) against party vote-shares in the preceding
national general election, for all parties in all elections
between 1979 and 2009.9 The cubic effect of party size
on party performance in European Parliament elections
is clearly visible at the aggregate level: with very large
parties losing more votes than medium-sized parties,
and small parties gaining votes compared to both
medium-sized parties and large parties (cf. Marsh, 1998;
Hix and Marsh, 2007). Also, although this effect is
stronger for governing parties than opposition parties, it
is nonetheless apparent, though weaker, for opposition
parties too. In other words, large parties lose votes in
European Parliament elections, while small parties gain
votes, regardless of whether these parties are in
government or opposition.
Having presented the pooled analysis of the effect of
party size on performance on European Parliament elec-
tions, Fig. 4 looks at this effect for each election separately,
for all EU member states. Here, the same regression model
is estimated and plotted separately for each European
Parliament election, for parties in government compared to
parties in opposition. The full results of these models are
presented in Table A4 in the Appendix.
The main second-order effect is robust across all the
elections, in that large parties did worse than small parties.
Nevertheless, there are some interesting election-specific
differences, particularly in relation to government/opposi-
tion differences in the impact of party size. For example, in
the third European Parliament elections, in 1989, the effect
of being in government was not particularly strong, in that
large parties in both government and opposition lost
similar amounts of votes. But, in each set of elections since
then, the effect of party size on election performance for
governing parties as opposed to opposition parties has
been consistent.
.
.
..
.
.
..
.
.
........
.
.
..........
.
.
.
.
.
.....
......
.
...
........
.
......
.
...
.
.
.
.
.
.
.....
.
...
....
..
.
.
.
.
.
.
.
.
.
.
.
........
.
.
.
...
.
.
.
.
...
.
...
+....+
.
.
..
.
.
.
...
.
.
..
.
.....
.
.
.
.
.
.
.
.
.
.
.
....
.
..+..
.
.
...
.....
.
.+..
+
+.
.
...
.
.
.+
.
+.
...
..
..
.
+
.
.
.
.
..
..+
.
.
.++.
.+
.
.
+
.
.
.
.
.
.
.
....
.
.+
.
..+..
.+
.
..
.
.
.
.
.
.+
.
.
.
.
..
+
.
.
.
.
.
+.+.
+
.
..+
...
.
+..
.
...
.
+..
.
+
.
.
.
.
+
.
.
.
.
..
+
.
+
..
+
+
.
.
.+
.
.
+
.
.+
..
+.+.
+
.
.
.
.
..+
+
.+..
..+
.
++
.+
+++
.
.+
+
.
.
.
.+
.+.
.
.
.
+
+.
.+
.
.
.
+
+..+
.
.
.
.
+.
+
+
...
.
.+.
..
+
++
.
...
+
.
+.+
.
+
.++
.
.
.
.
.
+
...+
.
.+.
+
+
.
+
.
+.+..+
..
.
.
+.
.
+
+.
.+
+
+.
+++.
+
++
.+.
.
.
...
+.
+
+
.
.
.
.
++
.
+
.
.
.+
.
+.+
.
+
.
.
+
++
.
+
+.
+.
+
.
.
.
..
+
+..
+
+
+..+..
+
.
++
+
+
+
.
.
.
.
..
.+
.
+
.
+
+
+
.
+
. .
.
.
+
+
+
.
.
.+
.
+..
.
.
.
+
.
+.
+++++
+
..
. .
.
+
+
.
+
.
.
+
.
.
.
+
+++
+.
.
.
.
+
+
.
+
+
+
.
+
.
+
.
+.
+.
+
+
.
.
.
+
..
.
.
+
.
+
+
+
.
.
.
+
.
+
.
+
.
+
+
+
..
+.
+
..
.
+
+
+
+
+
.
.
.
+
.
++
+
+
.
+
+
+.
.
.
.
+
+
.
.
.
.
.
.
+
+
..++
+
+
+
+
+
+
.
++
.
.
.
+
+
.
+
+
+
+
+
+
+
+
.
+++
+
+
+
+
++
+
++
++
.
+
+
+.+
.
+
+
++
+
+
+
-30
-20
-10
01
02
0
Pa
rty L
oss/G
ain
in
EP
ele
ctio
n
0 10 20 30 40 50
Party vote in preceding general election
+ denotes government party
Fig. 3. Party size and European Parliament election performance.
7 Nor is it the case that changes in the timing of elections within
national cycles might have been responsible for the worsening record of
governments, although in 1979 the elections did come, on average, earlier
than they did in any other year. They were 40% of the way through the
average cycle in 1979, compared with between 47% and 52% in later
elections.8 This calculation is based only on those parties contesting each pair of
elections.
9 In this estimation and subsequent analysis we have excluded parties
obtaining less than 1 per cent of the vote in a national general election
unless they are new parties.
S. Hix, M. Marsh / Electoral Studies 30 (2011) 4–15 7

Fig. 5 investigates the same patterns but only for the
parties in the original 10 countries (see Table A4 in the
Appendix for the full results of the models). Recall that
the aim, here, is to investigate whether the varying cross-
time patterns in Fig. 4 are driven by enlargement of the EU
to states where European Parliament elections work
differently from how they work in the original 10 states.
Indeed, comparing Figs. 4 and 5 suggests a generally
stronger anti-big party effect in the original 10 member
states compared to the average effect across all EUmember
states, particularly in the sixth and seventh elections, in
2004 and 2009. More specifically, enlargement of the EU to
25 and then 27member states dampened the swing against
large opposition parties. In the two most recent sets of
elections, large parties lost votes in the original EUmember
states, irrespective of whether these parties were in
Fig. 4. Party size and EP election performance across time.
S. Hix, M. Marsh / Electoral Studies 30 (2011) 4–158

government or opposition, whereas only large parties in
government in the new EU member states tended to lose
votes (cf. Koepke and Ringe, 2006; Marsh, 2009). For
example, in the 2009 European Parliament elections, large
parties (who won more than 20 per cent of the vote in
a preceding national general election) lost on average 5 per
cent of their votes if they were in government and only 1
per cent of their votes if they were in opposition. In
contrast, in the original 10 member states, in the 2009
elections large parties in government lost 9 per cent of their
votes and large parties in opposition lost 5 per cent of their
votes.
3. Party family trends and individual election swings
One possible criticism of our interpretation, thus far, of
these anti-government and anti-large party swings is that
these outcomes could be observationally equivalent with
what one would expect to happen if European Parliament
electionswere genuinely ‘European’ (Hix andMarsh, 2007).
If the elections were about European issues and the
performance of the political groups in the European
Parliament rather than about national issues and the
performance of national governments and parties, then
citizens would be likely to vote differently in European
Parliament elections than they would in a national election
held at the same time. Centrist and governing parties tend
to be more pro-European than extremist and opposition
parties (Sitter, 2001; Taggart, 1998), so if the main outcome
in a European Parliament election is a swing in votes from
large governing parties to smaller, more extremist parties,
this would fit a second-order pattern, even though it might
be driven by voters’ attitudes towards European
integration.
Fig. 5. Party Size and EP Election Performance Across Time.
S. Hix, M. Marsh / Electoral Studies 30 (2011) 4–15 9

One way of trying to identify a ‘European effect’ in
European Parliament elections distinct from second-order
effects is to look at which types of parties gained and lost
in particular elections. For example, if one particular ‘party
family’ – such as the greens, the liberals, the anti-Euro-
peans, or the socialists – did comparatively well or badly
in a particular election (controlling for the size and gov-
erning status of the member parties of the family), this
would indicate a particular type of ‘European effect’:
a pan-European swing in votes towards or away from
a particular group of parties, independently from the
governing status or size of these parties. This could
happen as a result of a particular set of European-wide
policy preferences at a particular time point – such as
a swing to neo-liberalism, or towards environmentalism –
or it could be because voters prioritised a different set of
issues because they perceived ‘Europe’ as being more
responsible for this area (e.g. Carrubba and Timpone,
2005; see more generally Hobolt and Wittrock, 2011).
This is different from the standardway of thinking about
a possible ‘European effect’ in these elections, which has
been to look at the pro-/anti-EU attitudes of voters, and
how these attitudes have affected voter turnout or party
choice in European Parliament elections (e.g. Blondel et al.,
1997; Studlar et al., 2003; Ferrara and Weishaupt, 2004;
Clark and Rohrschneider, 2009). Nevertheless, looking at
pan-European policy swings might be a more realistic way
of thinking about what a ‘European election’ might look
like at the aggregate level. If voters across Europe respond
in similar ways to common policy concerns, then this might
be the first step in the evolution of European Parliament
elections into genuine European-wide votes about the
direction of the EU policy agenda.
As a first take on this, Table 1 looks at the average
performance of each ‘party family’ in all European
Table 1
Performance of party families, 1979–2009.
Mean gain/loss from
preceding national
election
Mean residual
(after controlling
for second-order effects)
Anti-EU 6.7 2.7
Greens 2.5 0.7
Radical right 0.6 "0.7
Regionalists 0.6 "1.3
Radical left 0.5 "0.7
Christian democrats 0.4 1.6
Liberals "0.9 "0.7
Conservatives "1.1 0.3
Socialists "3.5 "0.6
Note: Unclassified parties excluded. The ‘mean residual’ is the residual
effect of each party family once governing status, party size, and national
election cycle effects are taken into account. The general second-order
model results are presented in Table A1 in the Appendix.
-20 -10 0 10 20 30
Performance
AntiEU
Right
Left
Green
Cons
Soc
CDem
Lib
2009200419991994198919841979
.2009200419991994198919841979
.2009200419991994198919841979
.2009200419991994198919841979
.2009200419991994198919841979
.2009200419991994198919841979
.2009200419991994198919841979
.2009200419991994198919841979
Fig. 6. Party families’ performance in EP elections across time, in EU states.
S. Hix, M. Marsh / Electoral Studies 30 (2011) 4–1510

Parliament elections between 1979 and 2009. In aggregate,
as the second column of the table shows, anti-European
parties and green parties have performed relatively well in
European Parliament elections, gaining on average 6.7 per
cent of the votes and 2.5 per cent of the votes, respectively,
compared to their performance in preceding national
general elections. In contrast, socialist parties seem to have
been the main losers in European Parliament elections:
losing on average 3.5 per cent of their votes compared to
national general elections.
This might be considered to mark an important qual-
ification with respect to the validity of the second-order
model. However, as the final column of the table shows –
which looks at party-family specific residuals from
applying a pooled second-order election model – the
party family effects are much smaller once the second-
order national election effects are taken into account
(from the model in Table A1 in the Appendix). Specifically,
once one controls for whether a party is in government,
the size of a party (in terms of its vote-share in the
previous national general election), and the timing of
a European Parliament election within the national elec-
tion cycle, anti-European parties have gained on average
only 2.6 per cent of the vote in European Parliament
elections. Put another way, more than half of the gains in
votes for anti-European parties in European Parliament
elections can be explained by the fact that these parties
tend to be small or new opposition parties. Similarly,
almost all the losses for socialist parties disappear once
their (general elections) size and their government status
is controlled for. In aggregate, no party family does
particularly well or badly in European Parliament elec-
tions independently of the standard second-order
national elections effects.
Nevertheless, it could still be the case that, underlying
this aggregate pattern, there are particular party family
trends across time, or swings between party families in
particular elections, as the June 2009 result suggests. To
investigate whether this was the case, Fig. 6 plots the
average performance of each party family in each election
(the party-family specific residuals), controlling for other
second-order effects, namely the size of a party and
whether it was in government or opposition (see Table A4
for the full results of the models).10
The typical patterns in the second column of Table 1 are
clearly illustrated here. Amongst the main party families,
socialists have tended to do worse than liberals, Christian
democrats and conservatives, particularly since the 1994
elections. Meanwhile, amongst the smaller party families,
greens and anti-Europeans have tended to perform better
than radical left, radical right or regionalist parties. In terms
of across-time trends, though, and this may be surprising,
anti-European parties have not gained as much in the most
recent European Parliament elections as they did in the
elections prior to 1999, once the standard second-order
effects have been controlled for.
Having said that, some pan-European swings between
party families do seem to have occurred. For example, as
Curtice (1989) identified, the 1989 election marked the
biggest aggregate gains for green parties, relative to their
previous national general election performances, even
Fig. 7. Residual Gains/Losses by socialist parties across time.
Fig. 8. Party Families’ Performance in EP elections across time, in the orig-
inal 10 states.
10 For Fig. 6 the residuals are plotted from the model in Table A3 in the
Appendix. In these box plots (Tukey 1977), the black dots in the middle of
each box are themedian effects, the right and left of the boxes are the 25th
and 75th percentiles of the distributions, respectively, the ends of the
‘whiskers’markplus/minus 1.5median (or if these are smaller, the extreme
cases) and the outliers beyond these points are indicated with dots.
S. Hix, M. Marsh / Electoral Studies 30 (2011) 4–15 11
controlling for the standard second-effects (the fact that
Green parties are usually in opposition and small, and so
do well in European Parliament elections).11 Also, the
1999 elections saw a swing against socialists, which
contributed to the emergence of the European People’s
Party on the centre-right as the largest political group in
the European Parliament for the first time since direct
elections were introduced in 1979 (Hix et al., 2003).
In fact, as Fig. 7 shows, socialist parties in government
lost more votes in the 1994, 2004 and 2009 elections
than a standard second-order model predicts. Put
another way, in these two sets of elections, socialist
parties did even worse than they should have done,
given that they were in government and were generally
large parties. In addition, socialist parties in opposition
lost more votes in the 1979, 1999 and 2009 elections
than standard second-order model predictions. In other
words, in these elections, socialist parties in opposition
should on average have lost votes because they were
large parties, yet should not have lost as many votes as
they did because they were in opposition rather than in
government.
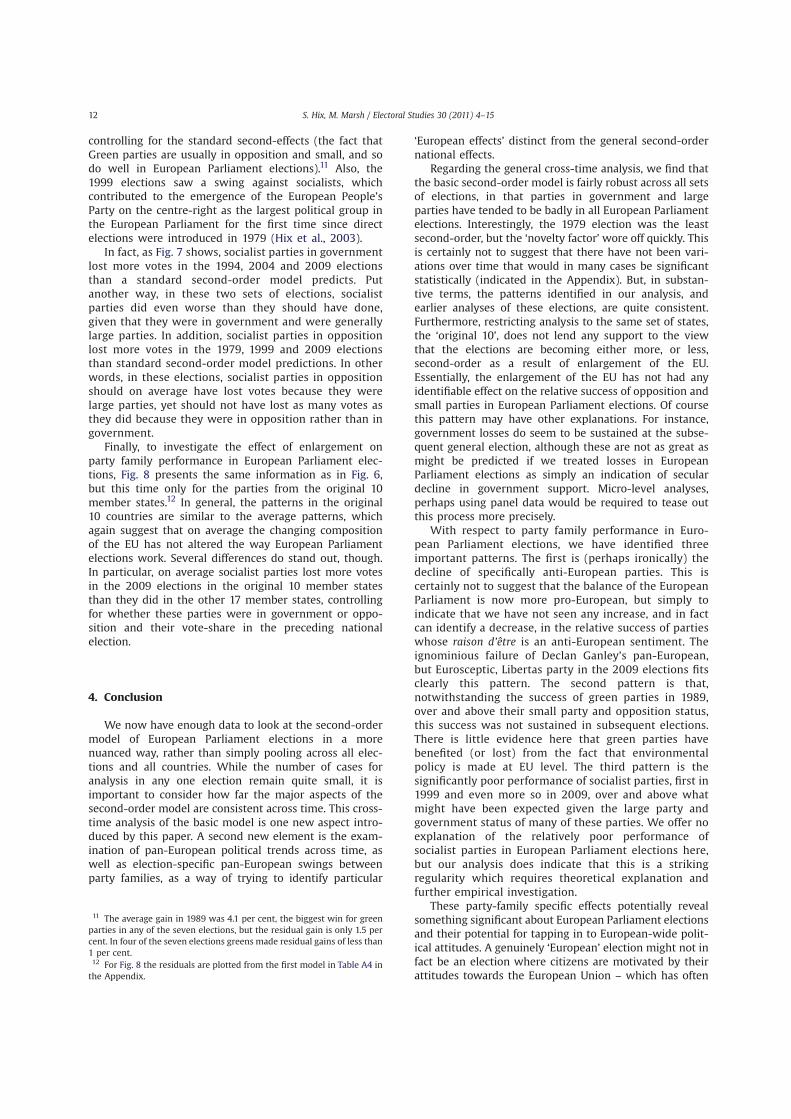
Finally, to investigate the effect of enlargement on
party family performance in European Parliament elec-
tions, Fig. 8 presents the same information as in Fig. 6,
but this time only for the parties from the original 10
member states.12 In general, the patterns in the original
10 countries are similar to the average patterns, which
again suggest that on average the changing composition
of the EU has not altered the way European Parliament
elections work. Several differences do stand out, though.
In particular, on average socialist parties lost more votes
in the 2009 elections in the original 10 member states
than they did in the other 17 member states, controlling
for whether these parties were in government or oppo-
sition and their vote-share in the preceding national
election.
4. Conclusion
We now have enough data to look at the second-order
model of European Parliament elections in a more
nuanced way, rather than simply pooling across all elec-
tions and all countries. While the number of cases for
analysis in any one election remain quite small, it is
important to consider how far the major aspects of the
second-order model are consistent across time. This cross-
time analysis of the basic model is one new aspect intro-
duced by this paper. A second new element is the exam-
ination of pan-European political trends across time, as
well as election-specific pan-European swings between
party families, as a way of trying to identify particular
‘European effects’ distinct from the general second-order
national effects.
Regarding the general cross-time analysis, we find that
the basic second-order model is fairly robust across all sets
of elections, in that parties in government and large
parties have tended to be badly in all European Parliament
elections. Interestingly, the 1979 election was the least
second-order, but the ‘novelty factor’ wore off quickly. This
is certainly not to suggest that there have not been vari-
ations over time that would in many cases be significant
statistically (indicated in the Appendix). But, in substan-
tive terms, the patterns identified in our analysis, and
earlier analyses of these elections, are quite consistent.
Furthermore, restricting analysis to the same set of states,
the ‘original 10’, does not lend any support to the view
that the elections are becoming either more, or less,
second-order as a result of enlargement of the EU.
Essentially, the enlargement of the EU has not had any
identifiable effect on the relative success of opposition and
small parties in European Parliament elections. Of course
this pattern may have other explanations. For instance,
government losses do seem to be sustained at the subse-
quent general election, although these are not as great as
might be predicted if we treated losses in European
Parliament elections as simply an indication of secular
decline in government support. Micro-level analyses,
perhaps using panel data would be required to tease out
this process more precisely.
With respect to party family performance in Euro-
pean Parliament elections, we have identified three
important patterns. The first is (perhaps ironically) the
decline of specifically anti-European parties. This is
certainly not to suggest that the balance of the European
Parliament is now more pro-European, but simply to
indicate that we have not seen any increase, and in fact
can identify a decrease, in the relative success of parties
whose raison d’être is an anti-European sentiment. The
ignominious failure of Declan Ganley’s pan-European,
but Eurosceptic, Libertas party in the 2009 elections fits
clearly this pattern. The second pattern is that,
notwithstanding the success of green parties in 1989,
over and above their small party and opposition status,
this success was not sustained in subsequent elections.
There is little evidence here that green parties have
benefited (or lost) from the fact that environmental
policy is made at EU level. The third pattern is the
significantly poor performance of socialist parties, first in
1999 and even more so in 2009, over and above what
might have been expected given the large party and
government status of many of these parties. We offer no
explanation of the relatively poor performance of
socialist parties in European Parliament elections here,
but our analysis does indicate that this is a striking
regularity which requires theoretical explanation and
further empirical investigation.
These party-family specific effects potentially reveal
something significant about European Parliament elections
and their potential for tapping in to European-wide polit-
ical attitudes. A genuinely ‘European’ election might not in
fact be an election where citizens are motivated by their
attitudes towards the European Union – which has often
11 The average gain in 1989 was 4.1 per cent, the biggest win for green
parties in any of the seven elections, but the residual gain is only 1.5 per
cent. In four of the seven elections greens made residual gains of less than
1 per cent.12 For Fig. 8 the residuals are plotted from the first model in Table A4 in
the Appendix.
S. Hix, M. Marsh / Electoral Studies 30 (2011) 4–1512

been an assumption in the literature on these elections –
but rather a contest where across Europe citizens respond
to current policy concerns in similar ways. So, rather than
supporting anti-European parties because of common
opposition to the EU, significant numbers of voters across
the member states would respond to common policy
concerns by switching to rightwing parties, or leftwing
parties, or green parties, together. However, this inference
is based on our aggregate level analysis, and would need to
be investigated using micro-level data on individual voters’
concerns andmotivations in European Parliament elections
across time.
Nevertheless, if these pan-European movements in
votes towards or away from a particular party family are
beginning to develop, then it would indicate the emergence
of one aspect of a pan-European ‘public opinion’ – perhaps
comparable to the evolution in the United States in the
1930s from independent state-level public opinions, which
moved in different directions in different periods, into
a single ‘American’ public opinion, which moved in concert
(Key, 1961). European Parliament elections are a long way
from this ideal, but the common losses for socialist parties
across Europe in 2009 might reveal a new ‘European’
element to the contests. This has implications for how we
understand European Parliament elections and whether
they could be an arena for voters to express common
preferences about salient issues on the European-level
policy agenda.
Appendix
Table A1
Basic Second-Order National Elections Model of EP Elections, 1979–2009.
Coefficient Robust standard error p-value
Size # Government "0.216 0.051 0.000
Size "0.406 0.119 0.000
Size2 0.016 0.007 0.021
Size3 "0.0002 0.0001 0.051
Early "0.439 0.393 0.267
Early # Government 2.78 1.01 0.007
Government 1.32 0.846 0.122
New party 4.08 0.929 0.000
Constant 2.615 0.377 0.000
No. of observations 796
R-squared 0.354
Root MSE 5.056
Note: The dependent variable in the model is a change in a party’s vote-
share in a European Parliament election, relative to the preceding general
election, pooled for all elections between 1979 and 2009. The model is
estimated with OLS regression and robust standard errors. The indepen-
dent variables are as follows: Size is the vote-share of a party in the
previous national general election; Government is a dummy variable,
which takes the value 1 if a party is in government at the time of the
European Parliament election, and 0 otherwise; Early is a dummy variable
which takes the value 1 if a European Parliament election was held in the
first fifth of a national election cycle (which in most cases is the first year),
and 0 otherwise; and New party is a dummy variable which takes the
value 1 if a party wins votes in a European Parliament election without
winning any votes at the preceding national election, and 0 otherwise. See
Hix and Marsh (2007) for a more detailed description of the model
specification. Table
A2
Models
ofgovern
mentperform
ance:AllEU
States.
Allelections
1979election
1984election
1989election
1994election
1999election
2004election
2009election
Tim
e"27.434(13.453)*
"34.766(25.890)
"44.420(50.863)
35.754(37.307)
"61.201(31.184)*
"31.782(34.269)
"15.268(33.364)
"6.627(27.725)
Tim
e2
18.628(12.827)
37.891(30.115)
39.07(49.938)
"26.353(30.30)
41.046(28.606)
36.804(32.375)
"9.104(32.587)
"8.156(25.743)
Constant
"0.021(3.121)
3.094(4.605)
4.942(10.899)
"16.663(9.999)
7.039(7.307)
"1.951(7.388)
"1.366(8.106)
"2.830(6.575)
Observations
104
89
910
13
24
25
AdjustedR-squared
0.06
"0.03
"0.16
"0.12
0.41
0.00
0.15
0.17
RootMSE
8.433
6.415
7.455
4.152
5.997
7.489
10.16
6.929
Note:Thedependentvariable
inthese
modelsisgovern
mentvote
changebetw
eentheprecedingnationalgeneralelectionandtheEuropeanParliamentelection,summedforallpartiesin
govern
mentin
aco
untry.
Tim
eisanorm
alisedco
ntinuousvariable,rangingfrom
0to
1,w
hichmeasu
resthetimingofaEuropeanParliamentelectionin
anationalelectioncy
cle.O
bservationswhenEuropeanParliamentelectionswere
held
atthesametimeasnationalgeneralelections(ifTim
e¼
1)were
dropped.Robust
standard
errors
inparentheses.
***p<
0.01,**p<
0.05,*p<
0.1.
S. Hix, M. Marsh / Electoral Studies 30 (2011) 4–15 13

Table
A3
Models
ofgovern
mentperform
ance:Original10States.
Allelections
1979election
1984election
1989election
1994election
1999election
2004election
2009election
Tim
e"32.739(13.823)*
"34.766(25.890)
"44.420(50.863)
43.161(44.916)
"61.364(39.365)
52.540(82.725)
"38.423(32.473)
"114.022(74.150)
Tim
e2
24.156(13.396)*
37.891(30.115)
39.070(49.938)
"34.828(37.472)
41.711(36.154)
"41.149(85.777)
25.986(41.850)
80.627(59.346)
Constant
0.963(3.217)
3.094(4.605)
4.942(10.899)
"17.846(11.782)
6.810(8.832)
"22.051(17.996)
0.525(5.915)
23.270(20.653)
Observations
58
89
78
89
9
AdjustedR-squared
0.11
"0.03
"0.16
"0.22
0.32
"0.18
0.30
0.19
RootMSE
6.759
6.415
7.455
4.827
7.050
8.281
4.427
6.242
Note:Seefootnote
toTable
A2foradescriptionofthevariables.Robust
standard
errors
inparentheses.
***p<
0.01,**p<
0.05,*p<
0.1.
Table
A4
Models
ofpartyperform
ance:AllEU
States.
1979election
1984election
1989election
1994election
1999election
2004election
Size#
Gov
0.2489(0.1207)*
"0.1148(0.0945)
"0.1066(0.1242)
"0.2457(0.1473)
"0.1612(0.1054)
"0.3439(0.1203)
Size
"0.3809(0.1173)**
"0.3598(0.1467)**
"0.9499(0.2984)**
"0.2480(0.1942)
"0.8771(0.4680)*
"0.0555(0.3216)
Size2
0.0252(0.0090)**
0.0182(0.0117)
0.0436(0.0149)**
0.0175(0.0117)
0.0456(0.0308)
"0.0035(0.0187)
Size3
"0.0005(0.0001)***
"0.0003(0.0002)
"0.0006(0.0002)***
"0.0003(0.0002)*
"0.0007(0.0005)
0.0001(0.0003)
New
Party
7.3788(5.6791)
11.7601(7.1793)
6.3307(4.1552)
6.9562(3.8528)*
2.4463(2.4976)
4.9502(1.6006)
Early
"0.3501(0.7227)
"1.0861(1.3049)
"1.5713(0.7385)*
2.0280(1.0297)*
"0.3564(0.6637)
Early#
Gov
2.4738(2.3375)
1.8815(2.0650)
6.1696(1.1167)***
"1.4412(2.8303)
14.6108(3.0605)
Govern
ment
"4.1559(2.4704)
0.4688(1.9476)
3.0428(2.4613)
"0.2604(2.3409)
1.3907(1.9397)
2.4002(2.0888)
Constant
1.4879(0.5194)**
1.6329(0.6091)**
3.6359(1.0654)***
2.2104(0.5552)***
3.5695(1.2133)**
2.1316(0.9518)
Observations
63
76
70
102
98
194
AdjustedR-squared
0.36
0.36
0.44
0.54
0.35
0.38
RootMSE
3.615
3.479
4.262
3.835
4.421
6.212
Note:Robust
standard
errors
inparentheses.
***p<
0.01,**p<
0.05,*p<
0.1.Seethenote
toTable
A1foradescriptionofthevariables.
S. Hix, M. Marsh / Electoral Studies 30 (2011) 4–1514

References
Blondel, J., Sinnott, R., Svensson, P., 1997. Representation and voterparticipation. European Journal of Political Research 32 (2), 243–272.
Blumler, J.G., Fox, A.D., 1980. The involvement of voters in the Europeanelections of 1979: its extent and consequences. European Journal ofPolitical Research 8 (4), 359–466.
Carrubba, C.J., Timpone, R.J., 2005. Explaining vote switching across firstand second order elections: evidence from Europe. ComparativePolitical Studies 38 (3), 260–281.
Clark, N., Rohrschneider, R., 2009. Second-order elections versus first-order thinking: how voters perceive the representation process ina multi-layered system of governance. Journal of European Integra-tion 31 (5), 645–664.
Curtice, J., 1989. The 1989 European election: protest or green tide?Electoral Studies 8 (3), 217–230.
de Vries Catherine, Wouter van der Brug, Marcel van Egmond, Cees vander Eijk, 2011. Individual and contextual variation in EU issue voting:The role of political information. Electoral Studies 30 (1), 16–28.
Ferrara, F.,Weishaupt, J.T., 2004. Get your act together: party performance inEuropean parliament elections. European Union Politics 5 (3), 283–306.
Franklin, M., 2001. How structural factors cause turnout variations atEuropeanparliamentelections. EuropeanUnionPolitics 2 (3), 309–328.
Hix, S., Marsh, M., 2007. Punishment or protest? understanding Europeanparliament elections. Journal of Politics 69 (2), 495–510.
Hix, S., Kreppel, A., Noury, A., 2003. The party system in the Europeanparliament: collusive or competitive? Journal of Common MarketStudies 41 (2), 309–331.
Hobolt, S., Wittrock, J., 2011. The Second order election model revisited:An experimental test of vote choices in European parliament elec-tions electoral studies. Electoral Studies 30 (1), 29–40.
Key Jr., V.O., 1961. Public Opinion and American Democracy. Knopf, NewYork, NY.
Koepke, J.R., Ringe, N., 2006. The second-order election model in anenlarged Europe. European Union Politics 7 (3), 321–346.
Lodge, J. (Ed.), 1996. The 1994 Elections to the European Parliament.Pinter, London.
Marsh, M., 1998. Testing the Second-order election model after four Euro-pean elections. British Journal of Political Science 28 (4), 591–607.
Marsh, M., 2009. Vote switching in European parliament elections:evidence from june 2004. Journal of European Integration 31 (5),p627–644.
Reif, K., 1984. National election cycles and European elections, 1979 and1984. Electoral Studies 3 (3), 244–255.
Reif, K., Schmitt, H., 1980. Nine second-order national elections:a conceptual framework for the analysis of European election results.European Journal of Political Research 8 (1), 3–45.
Schmitt, H., 2005. The European parliament elections of june 2004: stillsecond-order? West European Politics 28 (3), 650–679.
Schmitt, Hermann, 2009. Introduction. Journal of European Integration 31(5), 525–535.
Schuck, Andreas, R.T., Xezonakis, G., Elenbaas, M., Banducci, S.A.,de Vreese, C.H., 2011. Party contestation and Europe on the newsagenda: The 2009 European parliamentary election. ElectoralStudies 30 (1), 41–52.
Sitter, N., 2001. The politics of opposition and European integration inScandinavia: is Euro-scepticism a government-opposition dynamic?West European Politics 24 (4), 22–39.
Studlar, D.T., Flickinger, R.S., Bennett, S.E., 2003. Turnout in Europeanelections: towards a European-centred model. In: Rallings, C., Scul-ly, R., Tonge, J., Webb, P. (Eds.), British Elections and Parties Review,vol. 13. Frank Cass, London.
Taggart, P., 1998. A touchstone of dissent: euroscepticism in contempo-rary western European party systems. European Journal of PoliticalResearch 33 (2), 363–388.
Tukey, John W., 1977. Exploratory Data Analysis. Addison-Wesley,Reading, MA.
van der Eijk, C., Franklin, M. (Eds.), 1996. Choosing Europe? the EuropeanElectorate and National Politics in the Face of Union. University ofMichigan Press, Ann Arbor, MI.
van der Eijk, Cees, Marcel van Egmond, 2007. Political effects of lowturnout in national and European elections. Electoral Studies 26 (3),561–573.
van Egmond, Marcel, 2007. European Elections as Counterfactual NationalElections. In: van der Brug, W., van der Eijk, C. (Eds.), EuropeanElections and Domestic Politics: Lessons from the Past and Scenariosfor the Future. University of Notre Dame Press, Notre Dame, Indiana,pp. 32–50.T
able
A5
Models
ofPartygains/losses:
Original10States
Allelections
1979election
1984election
1989election
1994election
1999election
2004election
2009election
Size#
Gov
–0.1372(0.0339)***
0.2489(0.1207)*
–0.1289(0.0991)
–0.0515(0.1056)
–0.2158(0.2288)
–0.2206(0.1699)
–0.3234(0.1082)**
–0.1254(0.1047)
Size
0.5343(0.1176)***
–0.3809(0.1173)**
–0.4413(0.1431)**
–1.2941(0.3643)**
–0.3471(0.3408)
–1.3545(0.4978)**
–0.1996(0.3460)
–0.7636(0.1907)***
Size2
0.0203(0.0070)***
0.0252(0.0090)**
0.0230(0.0120)*
0.0641(0.0167)***
0.0178(0.0243)
0.0756(0.0325)*
0.0140(0.0178)
0.0223(0.0108)*
Size3
–0.0003(0.0001)***
–0.0005(0.0001)***
–0.0003(0.0002)
–0.0010(0.0002)***
–0.0003(0.0004)
–0.0011(0.0005)*
–0.0003(0.0003)
–0.0003(0.0003)
New
Party
3.9263(1.3813)***
7.3788(5.6791)
11.5473(7.2547)
8.0531(5.2506)
6.9717(4.1093)
1.8409(2.7792)
2.2993(2.1595)
–2.8009(1.2784)*
Early
–0.5345(0.4301)
–0.3501(0.7227)
–1.1044(1.3240)
–0.7640(0.9343)
2.7301(0.8256)**
–0.0368(0.7637)
Early#
Gov
3.4606(1.1599)***
2.4738(2.3375)
1.8458(2.1364)
6.8803(1.9506)***
–1.9763(1.7942)
20.4391(3.4737)***
Govern
ment
–4.1559(2.4704)
0.7675(2.0359)
1.8481(2.1690)
–0.9978(4.0414)
0.5947(2.4722)
1.1182(1.2974)
0.3287(1.7363)
Constant
2.7838(0.4615)***
1.4879(0.5194)**
1.8549(0.7128)**
4.9469(1.4632)**
2.1950(0.7453)**
5.1696(1.0660)***
2.2771(1.3806)
5.6593(1.3303)***
Observations
465
63
67
53
72
64
72
74
Adjusted
R-squared
0.85
0.36
0.35
0.40
0.50
0.48
0.65
0.55
RootMSE
4.234
3.615
3.695
4.402
3.845
4.508
3.344
4.084
Note:Robust
standard
errors
inparentheses.
***p<0.01,**p<0.05,*p<0.1.Seethenote
toTable
A1foradescriptionofthevariables.
S. Hix, M. Marsh / Electoral Studies 30 (2011) 4–15 15