SEATTLE—(BUSINESS WIRE) February - Snopes.com · AMAZON.COM ANNOUNCES FOURTH QUARTER SALES UP 22%...
16
AMAZON.COM ANNOUNCES FOURTH QUARTER SALES UP 22% TO $43.7 BILLION SEATTLE—(BUSINESS WIRE) February 2, 2017—Amazon.com, Inc. (NASDAQ: AMZN) today announced financial results for its fourth quarter ended December 31, 2016. Operating cash flow increased 38% to $16.4 billion for the trailing twelve months, compared with $11.9 billion for the trailing twelve months ended December 31, 2015. Free cash flow increased to $9.7 billion for the trailing twelve months, compared with $7.3 billion for the trailing twelve months ended December 31, 2015. Free cash flow less lease principal repayments increased to $5.7 billion for the trailing twelve months, compared with $4.7 billion for the trailing twelve months ended December 31, 2015. Free cash flow less finance lease principal repayments and assets acquired under capital leases increased to $3.9 billion for the trailing twelve months, compared with $2.5 billion for the trailing twelve months ended December 31, 2015. Common shares outstanding plus shares underlying stock-based awards totaled 497 million on December 31, 2016, compared with 490 million one year ago. Fourth Quarter 2016 Net sales increased 22% to $43.7 billion in the fourth quarter, compared with $35.7 billion in fourth quarter 2015. Excluding the $558 million unfavorable impact from year-over-year changes in foreign exchange rates throughout the quarter, net sales increased 24% compared with fourth quarter 2015. Operating income increased 13% to $1.3 billion in the fourth quarter, compared with operating income of $1.1 billion in fourth quarter 2015. Net income was $749 million in the fourth quarter, or $1.54 per diluted share, compared with net income of $482 million, or $1.00 per diluted share, in fourth quarter 2015. Full Year 2016 Net sales increased 27% to $136.0 billion, compared with $107.0 billion in 2015. Excluding the $550 million unfavorable impact from year-over-year changes in foreign exchange rates throughout the year, net sales increased 28% compared with 2015. Operating income was $4.2 billion, compared with operating income of $2.2 billion in 2015. Net income was $2.4 billion, or $4.90 per diluted share, compared with net income of $596 million, or $1.25 per diluted share, in 2015. “Our Prime team’s customer obsession kept them busy in 2016,” said Jeff Bezos, Amazon founder and CEO. “Prime members can now choose from over 50 million items with free two-day shipping — up 73% since 2015. Prime Video is now available in more than 200 countries and territories. Prime Now added 18 new cities, which means millions more members now get one and two hour delivery. New benefits were also added to the list, like Prime Reading, Audible Channels for Prime, Twitch Prime and more. And customers noticed — tens of millions of new paid members joined the program in just this past year.” Highlights • Amazon announced that it will create more than 100,000 new, full-time, full-benefit jobs in the U.S. over the next 18 months, and will include positions across the country for all types of experience, education, and skill levels.
Transcript of SEATTLE—(BUSINESS WIRE) February - Snopes.com · AMAZON.COM ANNOUNCES FOURTH QUARTER SALES UP 22%...

AMAZON.COM ANNOUNCES FOURTH QUARTER SALES UP 22% TO $43.7 BILLION
SEATTLE—(BUSINESS WIRE) February 2, 2017—Amazon.com, Inc. (NASDAQ: AMZN) today announced financial results
for its fourth quarter ended December 31, 2016.
Operating cash flow increased 38% to $16.4 billion for the trailing twelve months, compared with $11.9 billion for the trailing
twelve months ended December 31, 2015. Free cash flow increased to $9.7 billion for the trailing twelve months, compared
with $7.3 billion for the trailing twelve months ended December 31, 2015. Free cash flow less lease principal repayments
increased to $5.7 billion for the trailing twelve months, compared with $4.7 billion for the trailing twelve months ended
December 31, 2015. Free cash flow less finance lease principal repayments and assets acquired under capital leases increased
to $3.9 billion for the trailing twelve months, compared with $2.5 billion for the trailing twelve months ended December 31,
2015.
Common shares outstanding plus shares underlying stock-based awards totaled 497 million on December 31, 2016, compared
with 490 million one year ago.
Fourth Quarter 2016
Net sales increased 22% to $43.7 billion in the fourth quarter, compared with $35.7 billion in fourth quarter 2015. Excluding
the $558 million unfavorable impact from year-over-year changes in foreign exchange rates throughout the quarter, net sales
increased 24% compared with fourth quarter 2015.
Operating income increased 13% to $1.3 billion in the fourth quarter, compared with operating income of $1.1 billion in fourth
quarter 2015.
Net income was $749 million in the fourth quarter, or $1.54 per diluted share, compared with net income of $482 million, or
$1.00 per diluted share, in fourth quarter 2015.
Full Year 2016
Net sales increased 27% to $136.0 billion, compared with $107.0 billion in 2015. Excluding the $550 million unfavorable
impact from year-over-year changes in foreign exchange rates throughout the year, net sales increased 28% compared with
2015.
Operating income was $4.2 billion, compared with operating income of $2.2 billion in 2015.
Net income was $2.4 billion, or $4.90 per diluted share, compared with net income of $596 million, or $1.25 per diluted share,
in 2015.
“Our Prime team’s customer obsession kept them busy in 2016,” said Jeff Bezos, Amazon founder and CEO. “Prime members
can now choose from over 50 million items with free two-day shipping — up 73% since 2015. Prime Video is now available in
more than 200 countries and territories. Prime Now added 18 new cities, which means millions more members now get one and
two hour delivery. New benefits were also added to the list, like Prime Reading, Audible Channels for Prime, Twitch Prime and
more. And customers noticed — tens of millions of new paid members joined the program in just this past year.”
Highlights
• Amazon announced that it will create more than 100,000 new, full-time, full-benefit jobs in the U.S. over the next 18
months, and will include positions across the country for all types of experience, education, and skill levels.

• Fulfillment by Amazon (FBA) delivered more than two billion units on behalf of sellers in 2016, and the number of
active sellers using FBA grew more than 70%. Using the FBA service, Amazon sellers from more than 130 countries
fulfilled orders to customers in 185 countries.
• In 2016, there were over 100,000 sellers with sales of more than $100,000 selling on Amazon.
• In the fourth quarter, FBA units represented more than 55% of total third-party units.
• Amazon introduced Amazon Go in Seattle, a new kind of store with no checkout required. With Just Walk Out
Shopping, customers simply take the products they want, and go. Our checkout-free shopping experience is made
possible by the same types of technologies used in self-driving cars: computer vision, sensor fusion, and deep
learning.
• In 2016, the U.S. Prime program added Prime Reading, Twitch Prime, Audible Channels for Prime, and the Prime
Photo Family Vault as new Prime-exclusive digital benefits.
• Prime members engaged with the Prime digital benefits at a voracious rate, more than doubling the number of video,
music, and reading activities compared to 2015.
• Amazon introduced Prime Video to customers in more than 200 countries and territories around the globe, giving
customers access to unlimited streaming of Amazon’s popular and award-winning Original Series, including The
Grand Tour, The Man in the High Castle, and Transparent, as well as popular Hollywood movies and TV shows.
Prime Video is now automatically available at no additional cost to Amazon Prime members in Belgium, Canada,
France, India, Italy, and Spain.
• Prime Video is now available on Amazon.in, offering Prime members in India the largest selection of new release
Bollywood and regional Indian blockbusters, Hollywood movies, day-after-broadcast U.S. TV shows, kids’
programming, and award-winning Amazon Original Series. Amazon also announced the start of production of new
Indian Amazon Original Series featuring top Indian talent and filmmakers, which will be available exclusively to
Prime members in India.
• The debut episode of The Grand Tour was the biggest show premiere ever on Prime Video, with millions of Prime
members streaming the first episode in the U.S., U.K., Germany, Austria, and Japan over the opening weekend.
• Amazon Studios released Manchester by the Sea, The Salesman, Paterson, and Gimme Danger in theaters nationwide.
• Amazon Studios was nominated for seven Academy Awards, including Best Picture (Manchester by the Sea), Best
Director (Kenneth Lonergan), and Best Foreign Language Film (The Salesman).
• Amazon Studios was nominated for 11 Golden Globes and received two awards: Best Performance by an Actor in a
Motion Picture - Drama for Casey Affleck in Manchester by the Sea, and Best Performance by an Actor in a
Television Series - Drama for Billy Bob Thornton in Goliath.
• Amazon Music Unlimited expanded to Austria, Germany, and the U.K. with over 40 million songs, hand-curated
playlists, and personalized stations. Prime members in those countries can access Amazon Music Unlimited at a
breakthrough price (€7.99/£7.99 per month), while the exclusive “for Echo” subscription plan is available to all
customers for only €3.99/£3.99 per month. All customers listening to Amazon Music Unlimited on Echo, Echo Dot, or
Amazon Tap can access their favorite music with new natural language voice controls powered by Alexa.
• Alexa-enabled devices were the top-selling products across all categories on Amazon.com this holiday season.
Customers purchased and gifted a record-setting number of devices from the Amazon Echo family with sales up over
9x compared to last holiday season.
• Customers purchased millions of Fire tablets this holiday season. Additionally, Amazon brought Alexa to Fire HD 10,
Fire HD 8, and other Fire tablets via a free software update, making it easy for customers to enjoy endless
entertainment at the touch of a button.
• Amazon sold millions of Fire TV devices this holiday season. The new Fire TV Stick with Alexa Voice Remote has
received over 25,000 5-star customer reviews in just three months, and Amazon released a free, over-the-air software
update delivering a new user interface that makes finding what to watch next even easier and more enjoyable.
• Third-party developers released more than 4,000 new Alexa Skills since October, including ADT, AT&T, CBS, Pizza
Hut, and The Wall Street Journal. Tens of thousands of developers are building skills for Alexa.
• Tens of thousands of developers are using the Alexa Voice Service to integrate Alexa into their products, including
Dish DVRs, Ford and Volkswagen vehicles, GE C Lamp, Huawei Mate 9, LG Smart Instaview fridge, and Whirlpool
appliances.

• Amazon selected 12 teams to participate in the inaugural Alexa Prize, an annual university competition dedicated to
accelerating the field of conversational artificial intelligence. The teams are building socialbots on Alexa that will
converse with humans on popular topics and news events, and the winner will be announced at Amazon Web Services
(AWS) re:Invent 2017.
• Dash Button is now available in a number of countries throughout Europe and Japan. Prime members can now order
hundreds of products from dozens of popular brands with the press of a button.
• Amazon launched Prime in China, offering Prime members unlimited, free cross-border shipping on millions of
authentic international products from the Amazon Global Store and unlimited, free shipping with no minimum
purchase on more than nine million domestic items.
• Amazon Launchpad expanded to Canada, India, and Japan and has worked with over 100 leading venture capital
firms, startup accelerators, and crowd-funding platforms to help startups launch products in China, France, Germany,
the U.K., and the U.S.
• Amazon and Chase introduced the Amazon Prime Rewards Visa Signature Card offering Prime members 5% back at
Amazon.com, 2% back at restaurants, gas stations, and drugstores, and 1% back on every other purchase.
• Amazon Prime Air, the service that uses drones to safely deliver packages to customers in 30 minutes or less, made its
first delivery in December. The delivery marks the start of a limited, private trial for customers in a select area of the
U.K.
• Amazon announced six renewable energy projects during the quarter, including Amazon Wind Farm U.S. Central 2 in
Ohio and five new solar farms across the Commonwealth of Virginia, which support the development of an additional
369 megawatts of renewable energy.
• With millions of active customers, AWS continues to grow, and enterprise customers have committed to migrating tens
of thousands of applications to AWS, including: Workday selected AWS as its preferred public cloud infrastructure
provider for customer production workloads; Capital One selected AWS as its predominant cloud infrastructure
provider; shipping carrier Matson has closed all of its data centers, completing an “all-in” migration to AWS;
McDonald’s is transforming its digital-facing properties with AWS; the Financial Industry Regulatory Authority
(FINRA) is going “all-in” on AWS for their data analytics platform, which analyzes up to 75 billion market events
daily; and Enel has already moved more than 5,000 servers to AWS as it transforms its technology infrastructure on
AWS.
• AWS hosted re:Invent 2016, its fifth annual customer and partner conference, with over 30,000 attendees and over
50,000 streaming participants.
• AWS accelerated its infrastructure expansion in 2016, opening eleven Availability Zones across five geographic
regions in the U.S., Korea, India, and most recently, Canada and the U.K. AWS now operates 42 Availability Zones
across 16 infrastructure regions globally and plans to open an additional five Availability Zones in two regions (France
and a second region in China) in the coming months.
• AWS announced that customers migrated more than 18,000 databases using the AWS Database Migration Service in
2016.
• AWS continues to accelerate its pace of innovation with the release of 308 significant new services and features in the
fourth quarter, bringing the total number of launches in 2016 to 1,017.
• AWS announced three Artificial Intelligence (AI) services that make it easy for any developer to build apps that can
understand natural language, turn text into lifelike speech, have conversations using voice or text, analyze images and
recognize faces, objects, and scenes. Amazon Lex, Amazon Polly, and Amazon Rekognition are based on the same
proven, highly scalable AI technology built by the thousands of deep learning and machine learning experts across
Amazon. AWS also announced a significant investment in MXNet, an open source distributed deep learning
framework. AWS will contribute code and improve the MXNet developer experience to enable machine learning
scientists to build scalable deep learning models that can significantly reduce the training time for their applications.
• AWS announced Amazon Athena, a pay-as-you-go, interactive query service that makes it easy for customers to
analyze data directly in Amazon Simple Storage Service (Amazon S3) using standard SQL. With a few clicks in the
AWS Management Console, customers can point Amazon Athena at their data stored in Amazon S3 and begin using
standard SQL to run queries and get results in seconds. With Amazon Athena there are no clusters to manage and tune,
no infrastructure to setup or manage, and customers pay only for the queries they run.
• AWS announced AWS Greengrass and AWS Snowball Edge, hybrid services that help customers extend the power of
the AWS Cloud to connected devices and other environments that exist beyond the network edge.
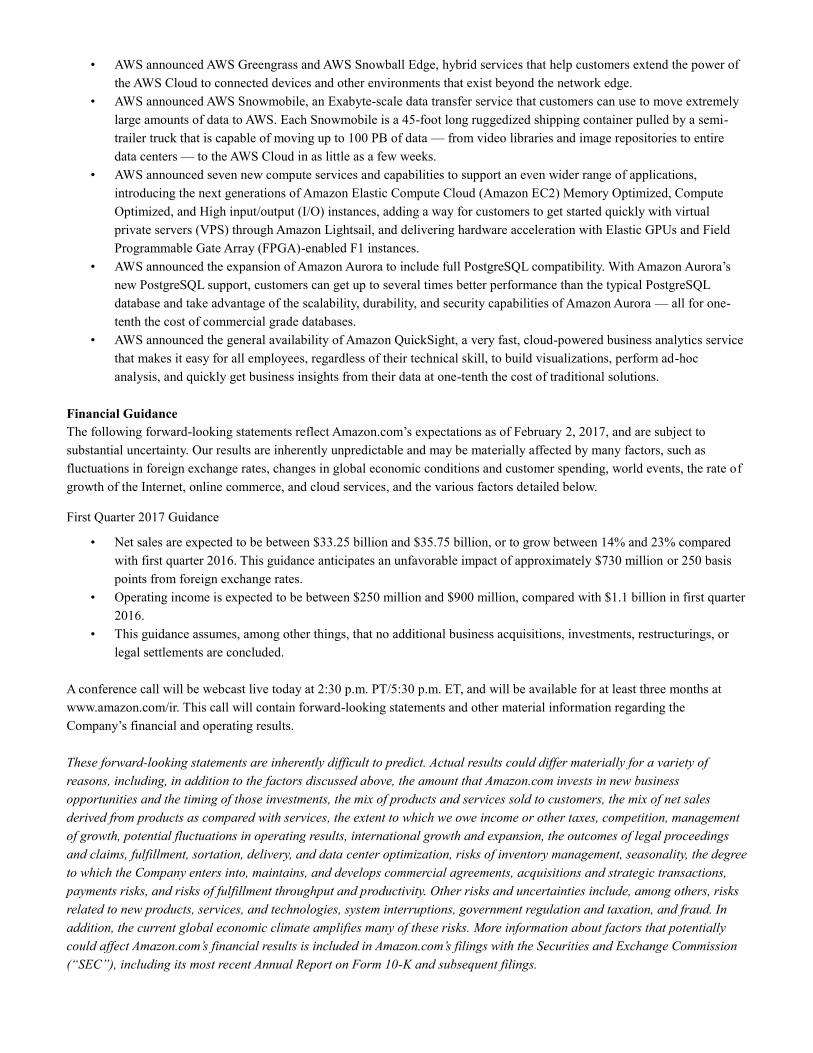
• AWS announced AWS Snowmobile, an Exabyte-scale data transfer service that customers can use to move extremely
large amounts of data to AWS. Each Snowmobile is a 45-foot long ruggedized shipping container pulled by a semi-
trailer truck that is capable of moving up to 100 PB of data — from video libraries and image repositories to entire
data centers — to the AWS Cloud in as little as a few weeks.
• AWS announced seven new compute services and capabilities to support an even wider range of applications,
introducing the next generations of Amazon Elastic Compute Cloud (Amazon EC2) Memory Optimized, Compute
Optimized, and High input/output (I/O) instances, adding a way for customers to get started quickly with virtual
private servers (VPS) through Amazon Lightsail, and delivering hardware acceleration with Elastic GPUs and Field
Programmable Gate Array (FPGA)-enabled F1 instances.
• AWS announced the expansion of Amazon Aurora to include full PostgreSQL compatibility. With Amazon Aurora’s
new PostgreSQL support, customers can get up to several times better performance than the typical PostgreSQL
database and take advantage of the scalability, durability, and security capabilities of Amazon Aurora — all for one-
tenth the cost of commercial grade databases.
• AWS announced the general availability of Amazon QuickSight, a very fast, cloud-powered business analytics service
that makes it easy for all employees, regardless of their technical skill, to build visualizations, perform ad-hoc
analysis, and quickly get business insights from their data at one-tenth the cost of traditional solutions.
Financial Guidance
The following forward-looking statements reflect Amazon.com’s expectations as of February 2, 2017, and are subject to
substantial uncertainty. Our results are inherently unpredictable and may be materially affected by many factors, such as
fluctuations in foreign exchange rates, changes in global economic conditions and customer spending, world events, the rate of
growth of the Internet, online commerce, and cloud services, and the various factors detailed below.
First Quarter 2017 Guidance
• Net sales are expected to be between $33.25 billion and $35.75 billion, or to grow between 14% and 23% compared
with first quarter 2016. This guidance anticipates an unfavorable impact of approximately $730 million or 250 basis
points from foreign exchange rates.
• Operating income is expected to be between $250 million and $900 million, compared with $1.1 billion in first quarter
2016.
• This guidance assumes, among other things, that no additional business acquisitions, investments, restructurings, or
legal settlements are concluded.
A conference call will be webcast live today at 2:30 p.m. PT/5:30 p.m. ET, and will be available for at least three months at
www.amazon.com/ir. This call will contain forward-looking statements and other material information regarding the
Company’s financial and operating results.
These forward-looking statements are inherently difficult to predict. Actual results could differ materially for a variety of
reasons, including, in addition to the factors discussed above, the amount that Amazon.com invests in new business
opportunities and the timing of those investments, the mix of products and services sold to customers, the mix of net sales
derived from products as compared with services, the extent to which we owe income or other taxes, competition, management
of growth, potential fluctuations in operating results, international growth and expansion, the outcomes of legal proceedings
and claims, fulfillment, sortation, delivery, and data center optimization, risks of inventory management, seasonality, the degree
to which the Company enters into, maintains, and develops commercial agreements, acquisitions and strategic transactions,
payments risks, and risks of fulfillment throughput and productivity. Other risks and uncertainties include, among others, risks
related to new products, services, and technologies, system interruptions, government regulation and taxation, and fraud. In
addition, the current global economic climate amplifies many of these risks. More information about factors that potentially
could affect Amazon.com’s financial results is included in Amazon.com’s filings with the Securities and Exchange Commission
(“SEC”), including its most recent Annual Report on Form 10-K and subsequent filings.

Our investor relations website is www.amazon.com/ir and we encourage investors to use it as a way of easily finding
information about us. We promptly make available on this website, free of charge, the reports that we file or furnish with the
SEC, corporate governance information (including our Code of Business Conduct and Ethics), and select press releases and
social media postings, which may contain material information about us, and you may subscribe to be notified of new
information posted to this site.
About Amazon
Amazon is guided by four principles: customer obsession rather than competitor focus, passion for invention, commitment to
operational excellence, and long-term thinking. Customer reviews, 1-Click shopping, personalized recommendations, Prime,
Fulfillment by Amazon, AWS, Kindle Direct Publishing, Kindle, Fire tablets, Fire TV, Amazon Echo, and Alexa are some of
the products and services pioneered by Amazon. For more information, visit www.amazon.com/about.

AMAZON.COM, INC.
Consolidated Statements of Cash Flows
(in millions)
Three Months Ended
December 31, Twelve Months Ended
December 31,
2015 2016 2015 2016
(unaudited) CASH AND CASH EQUIVALENTS, BEGINNING OF PERIOD $ 10,709 $ 13,656 $ 14,557 $ 15,890
OPERATING ACTIVITIES: Net income 482 749 596 2,371
Adjustments to reconcile net income to net cash from operating activities: Depreciation of property and equipment, including internal-use software
and website development, and other amortization, including capitalized content costs 1,752
2,297
6,281
8,116
Stock-based compensation 606 887 2,119 2,975
Other operating expense, net 35 31 155 160
Other expense (income), net 80 21 250 (20 )
Deferred income taxes 190 (282 ) 81 (246 )
Excess tax benefits from stock-based compensation 93 (336 ) (119 ) (829 )
Changes in operating assets and liabilities: Inventories (1,343 ) (1,043 ) (2,187 ) (1,426 )
Accounts receivable, net and other (1,178 ) (1,924 ) (1,755 ) (3,367 )
Accounts payable 6,140 7,283 4,294 5,030
Accrued expenses and other 1,836 2,254 913 1,724
Additions to unearned revenue 2,422 3,975 7,401 11,931
Amortization of previously unearned revenue (2,303 ) (3,261 ) (6,109 ) (9,976 )
Net cash provided by (used in) operating activities 8,812 10,651 11,920 16,443
INVESTING ACTIVITIES: Purchases of property and equipment, including internal-use software and
website development, net (1,309 ) (2,005 ) (4,589 ) (6,737 )
Acquisitions, net of cash acquired, and other (317 ) (3 ) (795 ) (116 )
Sales and maturities of marketable securities 1,135 1,233 3,025 4,733
Purchases of marketable securities (1,359 ) (3,399 ) (4,091 ) (7,756 )
Net cash provided by (used in) investing activities (1,850 ) (4,174 ) (6,450 ) (9,876 )
FINANCING ACTIVITIES: Excess tax benefits from stock-based compensation (93 ) 336 119 829
Proceeds from long-term debt and other 93 537 353 621
Repayments of long-term debt and other (940 ) (84 ) (1,652 ) (354 )
Principal repayments of capital lease obligations (724 ) (1,004 ) (2,462 ) (3,860 )
Principal repayments of finance lease obligations (26 ) (41 ) (121 ) (147 )
Net cash provided by (used in) financing activities (1,690 ) (256 ) (3,763 ) (2,911 )
Foreign currency effect on cash and cash equivalents (91 ) (543 ) (374 ) (212 )
Net increase (decrease) in cash and cash equivalents 5,181 5,678 1,333 3,444
CASH AND CASH EQUIVALENTS, END OF PERIOD $ 15,890 $ 19,334 $ 15,890 $ 19,334
SUPPLEMENTAL CASH FLOW INFORMATION: Cash paid for interest on long-term debt $ 148 $ 144 $ 325 $ 290
Cash paid for interest on capital and finance lease obligations 44 61 153 206
Cash paid for income taxes, net of refunds 73 95 273 412
Property and equipment acquired under capital leases 1,332 2,038 4,717 5,704
Property and equipment acquired under build-to-suit leases 163 416 544 1,209

AMAZON.COM, INC.
Consolidated Statements of Operations
(in millions, except per share data)
Three Months Ended
December 31, Twelve Months Ended
December 31,
2015 2016 2015 2016
(unaudited)
Net product sales $ 26,618 $ 30,629 $ 79,268 $ 94,665
Net service sales 9,129 13,112 27,738 41,322
Total net sales 35,747 43,741 107,006 135,987
Operating expenses:
Cost of sales 24,341 28,958 71,651 88,265
Fulfillment 4,546 5,719 13,410 17,619
Marketing 1,755 2,513 5,254 7,233
Technology and content 3,571 4,545 12,540 16,085
General and administrative 390 717 1,747 2,432
Other operating expense, net 36 34 171 167
Total operating expenses 34,639 42,486 104,773 131,801
Operating income 1,108 1,255 2,233 4,186
Interest income 13 30 50 100
Interest expense (115 ) (133 ) (459 ) (484 )
Other income (expense), net (68 ) 14 (256 ) 90
Total non-operating income (expense) (170 ) (89 ) (665 ) (294 )
Income before income taxes 938 1,166 1,568 3,892
Provision for income taxes (453 ) (414 ) (950 ) (1,425 )
Equity-method investment activity, net of tax (3 ) (3 ) (22 ) (96 )
Net income $ 482 $ 749 $ 596 $ 2,371
Basic earnings per share $ 1.03 $ 1.57 $ 1.28 $ 5.01
Diluted earnings per share $ 1.00 $ 1.54 $ 1.25 $ 4.90
Weighted-average shares used in computation of earnings per
share:
Basic 470 476 467 474
Diluted 481 486 477 484

AMAZON.COM, INC.
Consolidated Statements of Comprehensive Income (Loss)
(in millions)
Three Months Ended
December 31, Twelve Months Ended
December 31,
2015 2016 2015 2016
(unaudited)
Net income $ 482 $ 749 $ 596 $ 2,371
Other comprehensive income (loss):
Foreign currency translation adjustments, net of tax of $7,
$(68), $10, and $(49) (40 ) (412 ) (210 ) (279 )
Net change in unrealized gains (losses) on available-for-
sale securities:
Unrealized gains (losses), net of tax of $1, $22, $(5),
and $(12) (9 ) (54 ) (7 ) 9
Reclassification adjustment for losses (gains)
included in “Other income (expense), net,” net of tax
of $0, $0, $0, and $0 1
3
5
8
Net unrealized gains (losses) on available-for-
sale securities (8 ) (51 ) (2 ) 17
Total other comprehensive income (loss) (48 ) (463 ) (212 ) (262 )
Comprehensive income (loss) $ 434 $ 286 $ 384 $ 2,109

AMAZON.COM, INC.
Segment Information
(in millions)
Three Months Ended
December 31, Twelve Months Ended
December 31,
2015 2016 2015 2016
(unaudited) North America
Net sales $ 21,501 $ 26,240 $ 63,708 $ 79,785
Operating expenses 20,498 24,916 60,957 75,686
Operating income before stock-based compensation and other 1,003 1,324 2,751 4,099
Stock-based compensation and other 367 508 1,326 1,738
Operating income $ 636 $ 816 $ 1,425 $ 2,361
International
Net sales $ 11,841 $ 13,965 $ 35,418 $ 43,983
Operating expenses 11,781 14,219 35,509 44,460
Operating income (loss) before stock-based compensation and
other 60
(254 ) (91 ) (477 )
Stock-based compensation and other 168 233 608 806
Operating income (loss) $ (108 ) $ (487 ) $ (699 ) $ (1,283 )
AWS
Net sales $ 2,405 $ 3,536 $ 7,880 $ 12,219
Operating expenses 1,718 2,430 6,017 8,513
Operating income before stock-based compensation and other 687 1,106 1,863 3,706
Stock-based compensation and other 107 180 356 598
Operating income $ 580 $ 926 $ 1,507 $ 3,108
Consolidated
Net sales $ 35,747 $ 43,741 $ 107,006 $ 135,987
Operating expenses 33,997 41,565 102,483 128,659
Operating income before stock-based compensation and other 1,750 2,176 4,523 7,328
Stock-based compensation and other 642 921 2,290 3,142
Operating income 1,108 1,255 2,233 4,186
Total non-operating income (expense) (170 ) (89 ) (665 ) (294 )
Provision for income taxes (453 ) (414 ) (950 ) (1,425 )
Equity-method investment activity, net of tax (3 ) (3 ) (22 ) (96 )
Net income $ 482 $ 749 $ 596 $ 2,371
Segment Highlights:
Y/Y net sales growth:
North America 24 % 22 % 25 % 25 %
International 12 18 6 24
AWS 69 47 70 55
Consolidated 22 22 20 27
Net sales mix:
North America 60 % 60 % 60 % 59 %
International 33 32 33 32
AWS 7 8 7 9
Consolidated 100 % 100 % 100 % 100 %

AMAZON.COM, INC.
Supplemental Net Sales Information
(in millions)
Three Months Ended
December 31, Twelve Months Ended
December 31,
2015 2016 2015 2016
(unaudited) Net Sales:
North America Media $ 3,931 $ 4,208 $ 12,483 $ 13,580
Electronics and other general merchandise 17,325 21,590 50,401 64,887
Other (1) 245 442 824 1,318
Total North America $ 21,501 $ 26,240 $ 63,708 $ 79,785
International Media $ 3,292 $ 3,377 $ 10,026 $ 10,631
Electronics and other general merchandise 8,491 10,514 25,196 33,107
Other (1) 58 74 196 245
Total International $ 11,841 $ 13,965 $ 35,418 $ 43,983
Year-over-year Percentage Growth:
North America Media 11 % 7 % 8 % 9 %
Electronics and other general merchandise 28 25 31 29
Other (6 ) 81 10 60
Total North America 24 22 25 25
International Media (3 )% 3 % (8 )% 6 %
Electronics and other general merchandise 19 24 13 31
Other (3 ) 26 (3 ) 25
Total International 12 18 6 24
Year-over-year Percentage Growth, excluding the effect of foreign exchange rates:
North America Media 12 % 7 % 8 % 9 %
Electronics and other general merchandise 28 25 31 29
Other (6 ) 81 10 60
Total North America 24 22 26 25
International Media 5 % 7 % 4 % 7 %
Electronics and other general merchandise 31 28 29 33
Other 5 36 10 30
Total International 22 23 21 26
______________________________
(1) Includes sales from non-retail activities, such as certain advertising services and our co-branded credit card agreements.

AMAZON.COM, INC.
Consolidated Balance Sheets
(in millions, except per share data)
December 31, 2015 December 31, 2016
ASSETS
Current assets:
Cash and cash equivalents $ 15,890 $ 19,334
Marketable securities 3,918 6,647
Inventories 10,243 11,461
Accounts receivable, net and other 5,654 8,339
Total current assets 35,705 45,781
Property and equipment, net 21,838 29,114
Goodwill 3,759 3,784
Other assets 3,445 4,723
Total assets $ 64,747 $ 83,402
LIABILITIES AND STOCKHOLDERS’ EQUITY
Current liabilities:
Accounts payable $ 20,397 $ 25,309
Accrued expenses and other 10,372 13,739
Unearned revenue 3,118 4,768
Total current liabilities 33,887 43,816
Long-term debt 8,227 7,694
Other long-term liabilities 9,249 12,607
Commitments and contingencies
Stockholders’ equity:
Preferred stock, $0.01 par value:
Authorized shares — 500
Issued and outstanding shares — none — —
Common stock, $0.01 par value:
Authorized shares — 5,000
Issued shares — 494 and 500
Outstanding shares — 471 and 477 5 5
Treasury stock, at cost (1,837 ) (1,837 )
Additional paid-in capital 13,394 17,186
Accumulated other comprehensive loss (723 ) (985 )
Retained earnings 2,545 4,916
Total stockholders’ equity 13,384 19,285
Total liabilities and stockholders’ equity $ 64,747 $ 83,402

AMAZON.COM, INC.
Supplemental Financial Information and Business Metrics
(in millions, except per share data)
(unaudited)
Q3 2015 Q4 2015 Q1 2016 Q2 2016 Q3 2016 Q4 2016 Y/Y %
Change
Cash Flows and Shares Operating cash flow -- trailing twelve months (TTM) $ 9,823 $ 11,920 $ 11,258 $ 12,726 $ 14,603 $ 16,443 38 %
Operating cash flow -- TTM Y/Y growth 72 % 74 % 44 % 42 % 49 % 38 % N/A
Purchases of property and equipment, including internal-use software and website
development, net -- TTM $ 4,424
$ 4,589
$ 4,897
$ 5,395
$ 6,040
$ 6,737
47 %
Principal repayments of capital lease obligations -- TTM $ 2,144 $ 2,462 $ 2,761 $ 3,298 $ 3,579 $ 3,860 57 %
Principal repayments of finance lease obligations -- TTM $ 163 $ 121 $ 111 $ 108 $ 131 $ 147 21 %
Property and equipment acquired under capital leases -- TTM $ 4,599 $ 4,717 $ 4,638 $ 4,676 $ 4,998 $ 5,704 21 %
Free cash flow -- TTM (1) $ 5,399 $ 7,331 $ 6,361 $ 7,331 $ 8,563 $ 9,706 32 %
Free cash flow less lease principal repayments -- TTM (2) $ 3,092 $ 4,748 $ 3,489 $ 3,925 $ 4,853 $ 5,699 20 %
Free cash flow less finance lease principal repayments and assets acquired under
capital leases -- TTM (3) $ 637
$ 2,493
$ 1,612
$ 2,547
$ 3,434
$ 3,855
55 %
Invested capital (4) $ 28,860 $ 31,393 $ 32,824 $ 34,695 $ 36,722 $ 39,126 25 %
Common shares and stock-based awards outstanding 489 490 490 495 496 497 1 %
Common shares outstanding 469 471 472 474 475 477 1 %
Stock-based awards outstanding 20 19 18 21 21 20 4 %
Stock-based awards outstanding -- % of common shares outstanding 4.3 % 4.1 % 3.9 % 4.4 % 4.4 % 4.2 % N/A
Results of Operations Worldwide (WW) net sales $ 25,358 $ 35,747 $ 29,128 $ 30,404 $ 32,714 $ 43,741 22 %
WW net sales -- Y/Y growth, excluding F/X 30 % 26 % 29 % 30 % 29 % 24 % N/A
WW net sales -- TTM $ 100,588 $ 107,006 $ 113,418 $ 120,637 $ 127,993 $ 135,987 27 %
WW net sales -- TTM Y/Y growth, excluding F/X 24 % 26 % 28 % 29 % 28 % 28 % N/A
Operating income $ 406 $ 1,108 $ 1,071 $ 1,285 $ 575 $ 1,255 13 %
FX impact -- favorable (unfavorable) $ 25 $ 20 $ 50 $ 45 $ 8 $ 7 N/A
Operating income -- Y/Y growth, excluding F/X N/A 84 % 300 % 168 % 40 % 13 % N/A
Operating margin -- % of WW net sales 1.6 % 3.1 % 3.7 % 4.2 % 1.8 % 2.9 % N/A
Operating income -- TTM $ 1,715 $ 2,233 $ 3,049 $ 3,871 $ 4,040 $ 4,186 87 %
Operating income -- TTM Y/Y growth, excluding F/X N/A N/A 933 % 388 % 128 % 83 % N/A
Operating margin -- TTM % of WW net sales 1.7 % 2.1 % 2.7 % 3.2 % 3.2 % 3.1 % N/A
Net income $ 79 $ 482 $ 513 $ 857 $ 252 $ 749 55 %
Net income per diluted share $ 0.17 $ 1.00 $ 1.07 $ 1.78 $ 0.52 $ 1.54 54 %
Net income -- TTM $ 328 $ 596 $ 1,166 $ 1,931 $ 2,105 $ 2,371 298 %
Net income per diluted share -- TTM $ 0.69 $ 1.25 $ 2.43 $ 4.02 $ 4.38 $ 4.90 292 %
______________________________
(1) Free cash flow is cash flow from operations reduced by “Purchases of property and equipment, including internal-use software and website development, net,” which is
included in cash flow from investing activities.
(2) Free cash flow less lease principal repayments is free cash flow reduced by “Principal repayments of capital lease obligations,” and “Principal repayments of finance lease
obligations,” which are included in cash flow from financing activities.
(3) Free cash flow less finance lease principal repayments and assets acquired under capital leases is free cash flow reduced by “Principal repayments of finance lease
obligations,” which are included in cash flow from financing activities, and property and equipment acquired under capital leases. In this measure, property and equipment
acquired under capital leases is reflected as if these assets had been purchased with cash, which is not the case as these assets have been leased.
(4) Average Total Assets minus Current Liabilities (excluding current portion of Long-Term Debt and current portion of capital lease obligations and finance lease
obligations) over five quarter ends.

AMAZON.COM, INC.
Supplemental Financial Information and Business Metrics
(in millions)
(unaudited)
Q3 2015 Q4 2015 Q1 2016 Q2 2016 Q3 2016 Q4 2016 Y/Y %
Change
Segments North America Segment:
Net sales $ 15,006 $ 21,501 $ 16,996 $ 17,674 $ 18,874 $ 26,240 22 %
Net sales -- Y/Y growth, excluding F/X 29 % 24 % 27 % 28 % 26 % 22 % N/A
Net sales -- TTM $ 59,540 $ 63,708 $ 67,299 $ 71,176 $ 75,045 $ 79,785 25 %
Operating income before stock-based compensation and other: Operating income $ 528 $ 1,003 $ 924 $ 1,157 $ 694 $ 1,324 32 %
Operating income -- Y/Y growth, excluding F/X N/A 36 % 78 % 64 % 30 % 30 % N/A
Operating margin -- % of North America net sales 3.5 % 4.7 % 5.4 % 6.6 % 3.7 % 5.0 % N/A
Operating income -- TTM $ 2,480 $ 2,751 $ 3,157 $ 3,611 $ 3,778 $ 4,099 49 %
Operating margin -- TTM % of North America net sales 4.2 % 4.3 % 4.7 % 5.1 % 5.0 % 5.1 % N/A
Operating Income: Operating income $ 186 $ 636 $ 588 $ 702 $ 255 $ 816 28 %
FX impact -- favorable (unfavorable) $ 11 $ 6 $ 5 $ 5 $ 6 $ 11 N/A
Operating income -- Y/Y growth, excluding F/X 129 % 100 % 34 % 26 % N/A
Operating margin -- % of North America net sales 1.2 % 3.0 % 3.5 % 4.0 % 1.3 % 3.1 % N/A
Operating income -- TTM $ 1,425 $ 1,759 $ 2,113 $ 2,182 $ 2,361 66 %
Operating margin -- TTM % of North America net sales 2.2 % 2.6 % 3.0 % 2.9 % 3.0 % N/A
International Segment: Net sales $ 8,267 $ 11,841 $ 9,566 $ 9,844 $ 10,609 $ 13,965 18 %
Net sales -- Y/Y growth, excluding F/X 24 % 22 % 26 % 28 % 28 % 23 % N/A
Net sales -- TTM $ 34,154 $ 35,418 $ 37,239 $ 39,518 $ 41,860 $ 43,983 24 %
Operating income (loss) before stock-based compensation and other: Operating income (loss) $ (56 ) $ 60 $ 20 $ 88 $ (332 ) $ (254 ) N/A
Operating income/loss -- Y/Y growth (decline), excluding F/X N/A 65 % N/A N/A 539 % N/A N/A
Operating margin -- % of International net sales (0.7 )% 0.5 % 0.2 % 0.9 % (3.1 )% (1.8 )% N/A
Operating income (loss) -- TTM $ (86 ) $ (91 ) $ 6 $ 113 $ (163 ) $ (477 ) 426 %
Operating margin -- TTM % of International net sales (0.3 )% (0.3 )% — % 0.3 % (0.4 )% (1.1 )% N/A
Operating income (loss): Operating income (loss) $ (208 ) $ (108 ) $ (121 ) $ (135 ) $ (541 ) $ (487 ) 349 %
FX impact -- favorable (unfavorable) $ (64 ) $ (47 ) $ 21 $ 40 $ 22 $ 5 N/A
Operating income/loss -- Y/Y growth (decline), excluding F/X (27 )% (8 )% 171 % 354 % N/A
Operating margin -- % of International net sales (2.5 )% (0.9 )% (1.3 )% (1.4 )% (5.1 )% (3.5 )% N/A
Operating income (loss) -- TTM $ (699 ) $ (626 ) $ (571 ) $ (905 ) $ (1,283 ) 83 %
Operating margin -- TTM % of International net sales (2.0 )% (1.7 )% (1.4 )% (2.2 )% (2.9 )% N/A

AMAZON.COM, INC.
Supplemental Financial Information and Business Metrics
(in millions)
(unaudited)
Q3 2015 Q4 2015 Q1 2016 Q2 2016 Q3 2016 Q4 2016
Y/Y %
Change
Segments (continued) AWS Segment:
Net sales $ 2,085 $ 2,405 $ 2,566 $ 2,886 $ 3,231 $ 3,536 47 %
Net sales -- Y/Y growth, excluding F/X 78 % 69 % 64 % 58 % 55 % 47 % N/A
Net sales -- TTM $ 6,894 $ 7,880 $ 8,880 $ 9,943 $ 11,088 $ 12,219 55 %
Operating income before stock-based compensation and other: Operating income $ 521 $ 687 $ 716 $ 863 $ 1,021 $ 1,106 61 %
Operating income -- Y/Y growth (decline), excluding F/X 353 % 161 % 161 % 121 % 100 % 62 % N/A
Operating margin -- % of AWS net sales 25.0 % 28.5 % 27.9 % 29.9 % 31.6 % 31.3 % N/A
Operating income -- TTM $ 1,417 $ 1,863 $ 2,315 $ 2,787 $ 3,286 $ 3,706 99 %
Operating margin -- TTM % of AWS net sales 20.6 % 23.6 % 26.1 % 28.0 % 29.6 % 30.3 % N/A
Operating income: Operating income $ 428 $ 580 $ 604 $ 718 $ 861 $ 926 60 %
FX impact -- favorable (unfavorable) $ 78 $ 60 $ 24 $ — $ (20 ) $ (9 ) N/A
Operating income -- Y/Y growth, excluding F/X 198 % 136 % 106 % 61 % N/A
Operating margin -- % of AWS net sales 20.5 % 24.1 % 23.5 % 24.9 % 26.6 % 26.2 % N/A
Operating income -- TTM $ 1,507 $ 1,916 $ 2,329 $ 2,762 $ 3,108 106 %
Operating margin -- TTM % of AWS net sales 19.1 % 21.6 % 23.4 % 24.9 % 25.4 % N/A
Consolidated Segments Before Stock-Based Compensation and Other: Operating income $ 993 $ 1,750 $ 1,660 $ 2,108 $ 1,383 $ 2,176 24 %
Operating income -- Y/Y growth, excluding F/X N/A 67 % 128 % 92 % 38 % 23 % N/A
Operating margin -- % of Consolidated net sales 3.9 % 4.9 % 5.7 % 6.9 % 4.2 % 5.0 % N/A
Operating income -- TTM $ 3,811 $ 4,523 $ 5,478 $ 6,511 $ 6,902 $ 7,328 62 %
Operating margin -- TTM % of Consolidated net sales 3.8 % 4.2 % 4.8 % 5.4 % 5.4 % 5.4 % N/A

AMAZON.COM, INC.
Supplemental Financial Information and Business Metrics
(in millions, except employee data)
(unaudited)
Q3 2015 Q4 2015 Q1 2016 Q2 2016 Q3 2016 Q4 2016 Y/Y %
Change
Supplemental Supplemental North America Segment Net Sales:
Media $ 2,963 $ 3,931 $ 3,208 $ 2,928 $ 3,237 $ 4,208 7 %
Media -- Y/Y growth, excluding F/X 9 % 12 % 8 % 12 % 9 % 7 % N/A
Media -- TTM $ 12,096 $ 12,483 $ 12,722 $ 13,030 $ 13,304 $ 13,580 9 %
Electronics and other general merchandise $ 11,840 $ 17,325 $ 13,511 $ 14,459 $ 15,327 $ 21,590 25 %
Electronics and other general merchandise -- Y/Y growth, excluding F/X 35 % 28 % 32 % 32 % 29 % 25 % N/A
Electronics and other general merchandise -- TTM $ 46,606 $ 50,401 $ 53,663 $ 57,134 $ 60,622 $ 64,887 29 %
Electronics and other general merchandise -- TTM % of North America net sales 78 % 79 % 80 % 80 % 81 % 81 % N/A
Other $ 203 $ 245 $ 277 $ 287 $ 310 $ 442 81 %
Supplemental International Segment Net Sales: Media $ 2,320 $ 3,292 $ 2,480 $ 2,283 $ 2,491 $ 3,377 3 %
Media -- Y/Y growth, excluding F/X 6 % 5 % 9 % 7 % 7 % 7 % N/A
Media -- TTM $ 10,140 $ 10,026 $ 10,186 $ 10,375 $ 10,546 $ 10,631 6 %
Electronics and other general merchandise $ 5,901 $ 8,491 $ 7,034 $ 7,504 $ 8,056 $ 10,514 24 %
Electronics and other general merchandise -- Y/Y growth, excluding F/X 32 % 31 % 33 % 36 % 36 % 28 % N/A
Electronics and other general merchandise -- TTM $ 23,814 $ 25,196 $ 26,851 $ 28,930 $ 31,084 $ 33,107 31 %
Electronics and other general merchandise -- TTM % of International net sales 70 % 71 % 72 % 73 % 74 % 75 % N/A
Other $ 46 $ 58 $ 52 $ 57 $ 62 $ 74 26 %
Stock-based Compensation Expense Cost of sales $ 7 $ 9 N/A
Fulfillment $ 122 $ 137 $ 116 $ 186 $ 165 $ 190 38 %
Marketing $ 48 $ 57 $ 56 $ 80 $ 85 $ 102 79 %
Technology and content $ 309 $ 364 $ 317 $ 419 $ 434 $ 493 36 %
General and administrative $ 65 $ 48 $ 55 $ 83 $ 85 $ 93 94 %
Total stock-based compensation expense $ 544 $ 606 $ 544 $ 768 $ 776 $ 887 46 %
Other WW shipping revenue $ 1,494 $ 2,328 $ 1,820 $ 2,000 2,154 $ 3,003 29 %
WW shipping revenue -- Y/Y growth 43 % 37 % 40 % 43 % 44 % 29 % N/A
WW shipping costs $ 2,720 $ 4,170 $ 3,275 $ 3,362 3,897 $ 5,634 35 %
WW shipping costs -- Y/Y growth 35 % 37 % 42 % 44 % 43 % 35 % N/A
WW net shipping costs $ 1,226 $ 1,842 $ 1,455 $ 1,362 $ 1,743 $ 2,631 43 %
WW net shipping costs -- Y/Y growth 26 % 37 % 44 % 45 % 42 % 43 % N/A
WW paid units -- Y/Y growth 26 % 26 % 27 % 28 % 28 % 24 % N/A
WW seller unit mix -- % of WW paid units 46 % 47 % 48 % 49 % 50 % 49 % N/A
Employees (full-time and part-time; excludes contractors & temporary personnel) 222,400 230,800 245,200 268,900 306,800 341,400 48 %
Employees (full-time and part-time; excludes contractors & temporary personnel) -- Y/Y
growth 49 % 50 % 49 % 47 % 38 % 48 % N/A

Amazon.com, Inc.
Certain Definitions
Customer Accounts
• References to customers mean customer accounts, which are unique e-mail addresses, established either when a
customer places an order or when a customer orders from other sellers on our websites. Customer accounts exclude
certain customers, including customers associated with certain of our acquisitions, Amazon Payments customers, AWS
customers, and the customers of select companies with whom we have a technology alliance or marketing and
promotional relationship. Customers are considered active when they have placed an order during the preceding
twelve-month period.
Seller Accounts
• References to sellers means seller accounts, which are established when a seller receives an order from a customer
account. Sellers are considered active when they have received an order from a customer during the preceding twelve-
month period.
AWS Customers
• References to AWS customers mean unique AWS customer accounts, which are unique customer account IDs that are
eligible to use AWS services. This includes AWS accounts in the AWS free tier. Multiple users accessing AWS
services via one account ID are counted as a single account. Customers are considered active when they have had
AWS usage activity during the preceding one-month period.
Units
• References to units mean physical and digital units sold (net of returns and cancellations) by us and sellers at Amazon
domains worldwide — for example www.amazon.com, www.amazon.co.uk, www.amazon.de, www.amazon.co.jp,
www.amazon.fr, www.amazon.ca, www.amazon.cn, www.amazon.it, www.amazon.es, www.amazon.com.br,
www.amazon.in, www.amazon.com.mx, www.amazon.com.au, www.amazon.nl, www.diapers.com,
www.shopbop.com, and www.zappos.com — as well as Amazon-owned items sold through non-Amazon domains.
Units sold are paid units and do not include units associated with AWS, certain acquisitions, rental businesses, or
advertising businesses, or Amazon gift cards.
Contacts:
Amazon.com Investor Relations Amazon.com Public Relations
Darin Manney, [email protected] Ty Rogers, [email protected]
www.amazon.com/ir www.amazon.com/about