
Seasonal, spatial, and maternal effects on gut microbiome ... · RESEARCH Open Access Seasonal,...
14
RESEARCH Open Access Seasonal, spatial, and maternal effects on gut microbiome in wild red squirrels Tiantian Ren 1 , Stan Boutin 2 , Murray M. Humphries 3 , Ben Dantzer 4 , Jamieson C. Gorrell 5 , David W. Coltman 2 , Andrew G. McAdam 6 and Martin Wu 1* Abstract Background: Our understanding of gut microbiota has been limited primarily to findings from human and laboratory animals, but what shapes the gut microbiota in nature remains largely unknown. To fill this gap, we conducted a comprehensive study of gut microbiota of a well-studied North American red squirrel ( Tamiasciurus hudsonicus) population. Red squirrels are territorial, solitary, and live in a highly seasonal environment and therefore represent a very attractive system to study factors that drive the temporal and spatial dynamics of gut microbiota. Result: For the first time, this study revealed significant spatial patterns of gut microbiota within a host population, suggesting limited dispersal could play a role in shaping and maintaining the structure of gut microbial communities. We also found a remarkable seasonal rhythm in red squirrel’s gut microbial composition manifested by a tradeoff between relative abundance of two genera Oscillospira and Corpococcus and clearly associated with seasonal variation in diet availability. Our results show that in nature, environmental factors exert a much stronger influence on gut microbiota than host-associated factors including age and sex. Despite strong environmental effects, we found clear evidence of individuality and maternal effects, but host genetics did not seem to be a significant driver of the gut microbial communities in red squirrels. Conclusion: Taken together, the results of this study emphasize the importance of external ecological factors rather than host attributes in driving temporal and spatial patterns of gut microbiota in natural environment. Keywords: Microbial ecology, Biogeography, Dispersal Background Mammalian guts harbor trillions of microbes, which play important roles in diverse aspects of host biology, including nutrition, immune system development, and behavior. Changes in gut microbial composition have been linked to host health and disease [1–4]. Previous studies have shown that host diet, age, sex, genetics, and environmental exposure all drive normal gut microbial variation [4–12]. However, to date, most studies have been focused on human populations or laboratory ani- mals in controlled settings, and much remains to be learned about the ecological forces shaping gut microbial diversity and their relative strengths in nature. Studies of wild animal populations provide important insights into how environment, host biology, and their interactions affect gut microbiota in nature where hosts and microbes have coevolved. Diet is believed to be a key selective factor in shaping gut microbiota in wild animals. For example, large differ- ences in gut microbial communities have been found among carnivorous, herbivorous, and omnivorous mam- mals [13, 14]. Wild animals face temporal variation in food availability and often shift their diet accordingly, but little is known about how much this influences gut microbiota. It has been suggested that seasonal variation in gut microbial composition found in wild wood mice [15], ground squirrels [16], and giant pandas [17] are largely driven by the seasonal shifts in diet composition. Nonetheless, these studies either lacked detailed dietary information in the wild or were performed on animals in captivity. Further research is necessary to test if and the extent to which seasonal dietary shifts shape gut micro- biota in wild animals. In addition, no study has directly assessed the effect of diet on gut microbiota in wild * Correspondence: [email protected] 1 Department of Biology, University of Virginia, Charlottesville, VA, USA Full list of author information is available at the end of the article © The Author(s). 2017 Open Access This article is distributed under the terms of the Creative Commons Attribution 4.0 International License (http://creativecommons.org/licenses/by/4.0/), which permits unrestricted use, distribution, and reproduction in any medium, provided you give appropriate credit to the original author(s) and the source, provide a link to the Creative Commons license, and indicate if changes were made. The Creative Commons Public Domain Dedication waiver (http://creativecommons.org/publicdomain/zero/1.0/) applies to the data made available in this article, unless otherwise stated. Ren et al. Microbiome (2017) 5:163 DOI 10.1186/s40168-017-0382-3
Transcript of Seasonal, spatial, and maternal effects on gut microbiome ... · RESEARCH Open Access Seasonal,...
RESEARCH Open Access
Seasonal, spatial, and maternal effects ongut microbiome in wild red squirrelsTiantian Ren1, Stan Boutin2, Murray M. Humphries3, Ben Dantzer4, Jamieson C. Gorrell5, David W. Coltman2,Andrew G. McAdam6 and Martin Wu1*
Abstract
Background: Our understanding of gut microbiota has been limited primarily to findings from human and laboratoryanimals, but what shapes the gut microbiota in nature remains largely unknown. To fill this gap, we conducted acomprehensive study of gut microbiota of a well-studied North American red squirrel (Tamiasciurus hudsonicus)population. Red squirrels are territorial, solitary, and live in a highly seasonal environment and therefore represent avery attractive system to study factors that drive the temporal and spatial dynamics of gut microbiota.
Result: For the first time, this study revealed significant spatial patterns of gut microbiota within a host population,suggesting limited dispersal could play a role in shaping and maintaining the structure of gut microbial communities.We also found a remarkable seasonal rhythm in red squirrel’s gut microbial composition manifested by a tradeoffbetween relative abundance of two genera Oscillospira and Corpococcus and clearly associated with seasonal variationin diet availability. Our results show that in nature, environmental factors exert a much stronger influence on gutmicrobiota than host-associated factors including age and sex. Despite strong environmental effects, we found clearevidence of individuality and maternal effects, but host genetics did not seem to be a significant driver of the gutmicrobial communities in red squirrels.
Conclusion: Taken together, the results of this study emphasize the importance of external ecological factors ratherthan host attributes in driving temporal and spatial patterns of gut microbiota in natural environment.
Keywords: Microbial ecology, Biogeography, Dispersal
BackgroundMammalian guts harbor trillions of microbes, which playimportant roles in diverse aspects of host biology,including nutrition, immune system development, andbehavior. Changes in gut microbial composition havebeen linked to host health and disease [1–4]. Previousstudies have shown that host diet, age, sex, genetics, andenvironmental exposure all drive normal gut microbialvariation [4–12]. However, to date, most studies havebeen focused on human populations or laboratory ani-mals in controlled settings, and much remains to belearned about the ecological forces shaping gut microbialdiversity and their relative strengths in nature. Studies ofwild animal populations provide important insights intohow environment, host biology, and their interactions
affect gut microbiota in nature where hosts andmicrobes have coevolved.Diet is believed to be a key selective factor in shaping
gut microbiota in wild animals. For example, large differ-ences in gut microbial communities have been foundamong carnivorous, herbivorous, and omnivorous mam-mals [13, 14]. Wild animals face temporal variation infood availability and often shift their diet accordingly,but little is known about how much this influences gutmicrobiota. It has been suggested that seasonal variationin gut microbial composition found in wild wood mice[15], ground squirrels [16], and giant pandas [17] arelargely driven by the seasonal shifts in diet composition.Nonetheless, these studies either lacked detailed dietaryinformation in the wild or were performed on animals incaptivity. Further research is necessary to test if and theextent to which seasonal dietary shifts shape gut micro-biota in wild animals. In addition, no study has directlyassessed the effect of diet on gut microbiota in wild
* Correspondence: [email protected] of Biology, University of Virginia, Charlottesville, VA, USAFull list of author information is available at the end of the article
© The Author(s). 2017 Open Access This article is distributed under the terms of the Creative Commons Attribution 4.0International License (http://creativecommons.org/licenses/by/4.0/), which permits unrestricted use, distribution, andreproduction in any medium, provided you give appropriate credit to the original author(s) and the source, provide a link tothe Creative Commons license, and indicate if changes were made. The Creative Commons Public Domain Dedication waiver(http://creativecommons.org/publicdomain/zero/1.0/) applies to the data made available in this article, unless otherwise stated.
Ren et al. Microbiome (2017) 5:163 DOI 10.1186/s40168-017-0382-3

animals by experimental manipulation of food availabil-ity while controlling for the other variables.Host genetics can also play a role in controlling gut
microbial community structure. Accumulating evidencehas linked specific host genetic loci to gut microbialvariation in humans and mice [18–24]. Although earlystudies suggested otherwise [6, 25], a recent large-scalestudy comparing human monozygotic and dizygotictwins revealed significant host genetic effect on gutmicrobial diversity [9]. In contrast, little is known aboutthe relative contribution of host genetics in shaping gutmicrobiota in wild animals, as this type of study dependson knowledge of genetic relatedness among manyindividuals within a wild host population.While most studies focused on important determinis-
tic factors, little attention has been paid to the role ofstochastic processes such as dispersal on structuring gutmicrobiota. Two recent studies have shown that disper-sal limitation could play an important role in shapinggut micriobial communities [12, 26]. With limiteddispersal in a homogenous environment, we wouldpredict that nearby hosts would exhibit more similar gutmicrobe communities than those living farther apart.Variation in gut microbiota over geographical scales hasbeen observed in humans. For instance, family membershave a higher degree of gut microbiota similarity than un-related individuals [25, 27], and distinct gut microbial com-munities were found in different populations [6, 28, 29].Likewise, recent studies found biogeographic variation inwild mice populations [15, 30]. However, these patterns donot necessarily indicate dispersal limitation as the onlydriving force because they can also be attributed to geneticrelatedness [30] or shared common environment factors.Furthermore, most studies focused on comparisons betweenpopulations separated on large distance scales (average dis-tance > hundreds of kilometers), but few studies investigatedthe role of dispersal limitation within a host population,where environment is expected to be more homogeneousand less of a concern as a confounding factor.Recent studies in baboons and chimpanzees have
suggested that microbes can disperse within the hostpopulation through host social interactions [26, 31, 32].One particular important mechanism of gut microbiotadispersal is through mother-offspring transmission.Mothers can provide the initial inoculum for the gutmicrobiota in mammalian newborns. For example,mother koalas produce “fecal paps,” which contain thebacteria necessary to digest gut leaves, and feed them tothe young [33]. Accordingly, strong kinship effects werefound in several studies [34–36] where the gut micro-biota of offspring were more similar to their mother’sthan those of unrelated individuals. Using a quantitativegenetics approach, it has been shown that maternaleffects (non-genetics) can explain as much as 26% of the
variation in the gut microbial composition in laboratorymice [23]. However, it is not clear how much of thesimilarity was due to genetics and how much was due tomaternal influences beyond host genetics (i.e., non-genetic maternal effects) in wild animals. Comparativestudies in host species with female uniparental care willbe useful for separating the maternal effects from thegenetic effects.To determine the relative contribution of seasonal
dietary shift, host genetics, maternal effects, and disper-sal limitation to the diversity of gut microbiota, weperformed a large-scale study on a well-characterizedpopulation of wild North American red squir-rels (Tamiasciurus hudsonicus). As part of the KluaneRed Squirrel Project, every red squirrel in the populationhas been continuously monitored in each year since1987, and multiple environmental and host factors wererecorded, including age, sex, territory membership, diet-ary composition, and genetic relatedness [37]. Red squir-rels live in a strongly seasonal environment whererecurrent seasonal fluctuations in their diet can be care-fully tracked using behavioral observations [38]. Both fe-male and male red squirrels defend exclusive territoriesyear round and thus spend most of their time in solitude[39]. As such, red squirrels represent a unique and at-tractive system to study the effect of dispersal limitationon gut microbial diversity because unlike human andother wild animals studied so far, red squirrels generallyremain on their exclusive territory after settlement andhave very limited social interactions [40], although theydo leave their territory for mating [41] and to pilfer foodfrom neighbors [42]. In addition, females raise young inthe absence of any paternal care, making it possible todifferentiate host genetics from maternal effects on gutmicrobiota.In this study, we tested the hypothesis that red squirrel
gut microbiota are strongly influenced by seasonal dietvariation. In addition, we tested whether host genetics,maternal effects, or limited dispersal affected gut micro-bial diversity. We expected not only that genentically re-lated individuals would have more similar gut microbialstructures, but also that mothers and offspring weremore similar than equally related kin that do not havethis close physical contact early in life. Finally, we ex-pected that individuals living in close proximity wouldhave more similar gut microbial composition than thoseliving farther apart.
ResultsRed squirrel gut microbiota profileBy 16S rRNA gene sequencing, we analyzed the gutmicrobial communities of North American red squirrelsusing 905 fecal samples collected from 363 red squirrels.Of these, 622 samples were collected from 230 females
Ren et al. Microbiome (2017) 5:163 Page 2 of 14
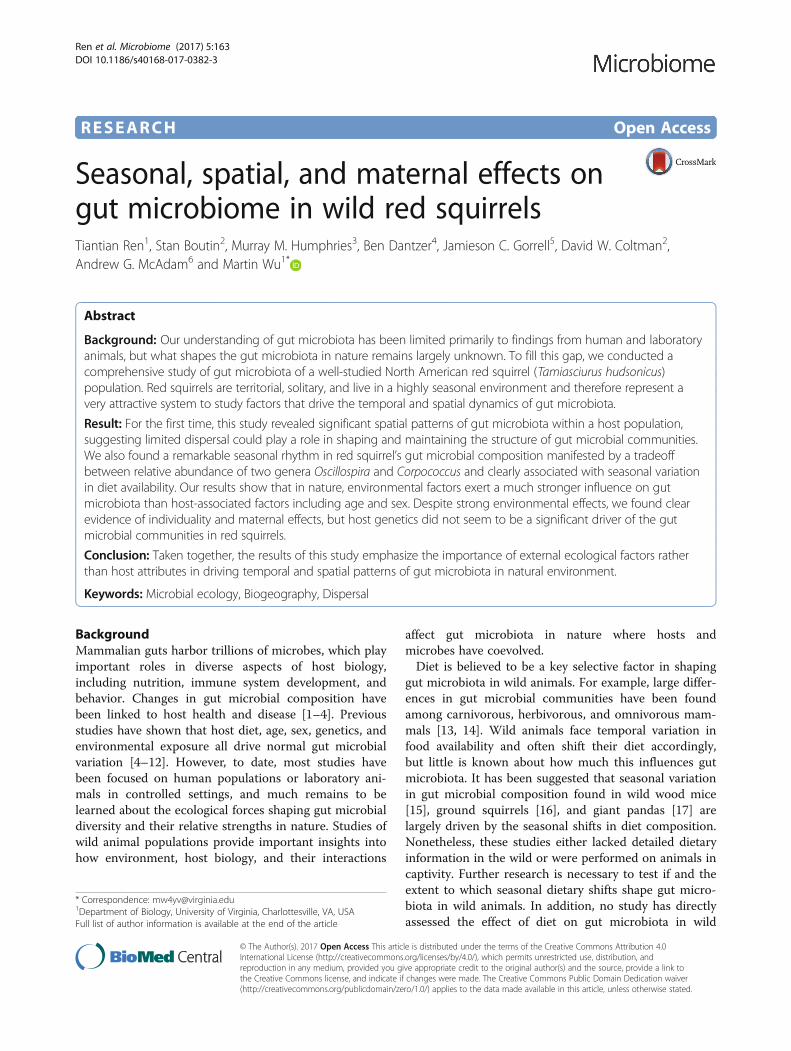
and 283 samples were collected from 133 males. Samplesvaried in both time (collected from February to Augustbetween 2008 and 2010) and space (from 6 study gridsthat were geographically separated from each other by0.2~7.3 km) and were from hosts of both sexes, differentages, and relatedness. The metadata associated with indi-viduals in the main study grid Kloo (KL, n = 549 samples)are listed in Table 1. After rarefaction to 4000 reads/sam-ple, we sorted high-quality reads into 12,833 operationaltaxonomic units (OTUs) using a sequence identity cutoffof 97%. On average, we detected 575 ± 139 OTUs persample.Taxonomic assignment revealed a fairly typical rodent
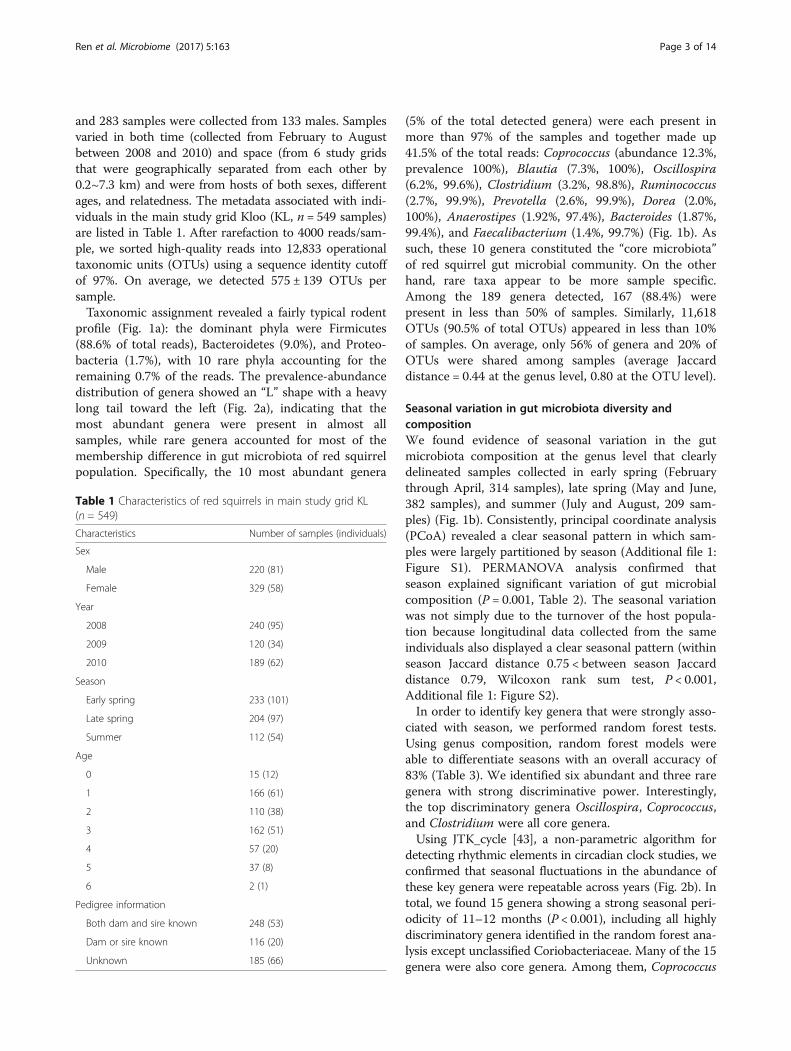
profile (Fig. 1a): the dominant phyla were Firmicutes(88.6% of total reads), Bacteroidetes (9.0%), and Proteo-bacteria (1.7%), with 10 rare phyla accounting for theremaining 0.7% of the reads. The prevalence-abundancedistribution of genera showed an “L” shape with a heavylong tail toward the left (Fig. 2a), indicating that themost abundant genera were present in almost allsamples, while rare genera accounted for most of themembership difference in gut microbiota of red squirrelpopulation. Specifically, the 10 most abundant genera
(5% of the total detected genera) were each present inmore than 97% of the samples and together made up41.5% of the total reads: Coprococcus (abundance 12.3%,prevalence 100%), Blautia (7.3%, 100%), Oscillospira(6.2%, 99.6%), Clostridium (3.2%, 98.8%), Ruminococcus(2.7%, 99.9%), Prevotella (2.6%, 99.9%), Dorea (2.0%,100%), Anaerostipes (1.92%, 97.4%), Bacteroides (1.87%,99.4%), and Faecalibacterium (1.4%, 99.7%) (Fig. 1b). Assuch, these 10 genera constituted the “core microbiota”of red squirrel gut microbial community. On the otherhand, rare taxa appear to be more sample specific.Among the 189 genera detected, 167 (88.4%) werepresent in less than 50% of samples. Similarly, 11,618OTUs (90.5% of total OTUs) appeared in less than 10%of samples. On average, only 56% of genera and 20% ofOTUs were shared among samples (average Jaccarddistance = 0.44 at the genus level, 0.80 at the OTU level).
Seasonal variation in gut microbiota diversity andcompositionWe found evidence of seasonal variation in the gutmicrobiota composition at the genus level that clearlydelineated samples collected in early spring (Februarythrough April, 314 samples), late spring (May and June,382 samples), and summer (July and August, 209 sam-ples) (Fig. 1b). Consistently, principal coordinate analysis(PCoA) revealed a clear seasonal pattern in which sam-ples were largely partitioned by season (Additional file 1:Figure S1). PERMANOVA analysis confirmed thatseason explained significant variation of gut microbialcomposition (P = 0.001, Table 2). The seasonal variationwas not simply due to the turnover of the host popula-tion because longitudinal data collected from the sameindividuals also displayed a clear seasonal pattern (withinseason Jaccard distance 0.75 < between season Jaccarddistance 0.79, Wilcoxon rank sum test, P < 0.001,Additional file 1: Figure S2).In order to identify key genera that were strongly asso-
ciated with season, we performed random forest tests.Using genus composition, random forest models wereable to differentiate seasons with an overall accuracy of83% (Table 3). We identified six abundant and three raregenera with strong discriminative power. Interestingly,the top discriminatory genera Oscillospira, Coprococcus,and Clostridium were all core genera.Using JTK_cycle [43], a non-parametric algorithm for
detecting rhythmic elements in circadian clock studies, weconfirmed that seasonal fluctuations in the abundance ofthese key genera were repeatable across years (Fig. 2b). Intotal, we found 15 genera showing a strong seasonal peri-odicity of 11–12 months (P < 0.001), including all highlydiscriminatory genera identified in the random forest ana-lysis except unclassified Coriobacteriaceae. Many of the 15genera were also core genera. Among them, Coprococcus
Table 1 Characteristics of red squirrels in main study grid KL(n = 549)
Characteristics Number of samples (individuals)
Sex
Male 220 (81)
Female 329 (58)
Year
2008 240 (95)
2009 120 (34)
2010 189 (62)
Season
Early spring 233 (101)
Late spring 204 (97)
Summer 112 (54)
Age
0 15 (12)
1 166 (61)
2 110 (38)
3 162 (51)
4 57 (20)
5 37 (8)
6 2 (1)
Pedigree information
Both dam and sire known 248 (53)
Dam or sire known 116 (20)
Unknown 185 (66)
Ren et al. Microbiome (2017) 5:163 Page 3 of 14

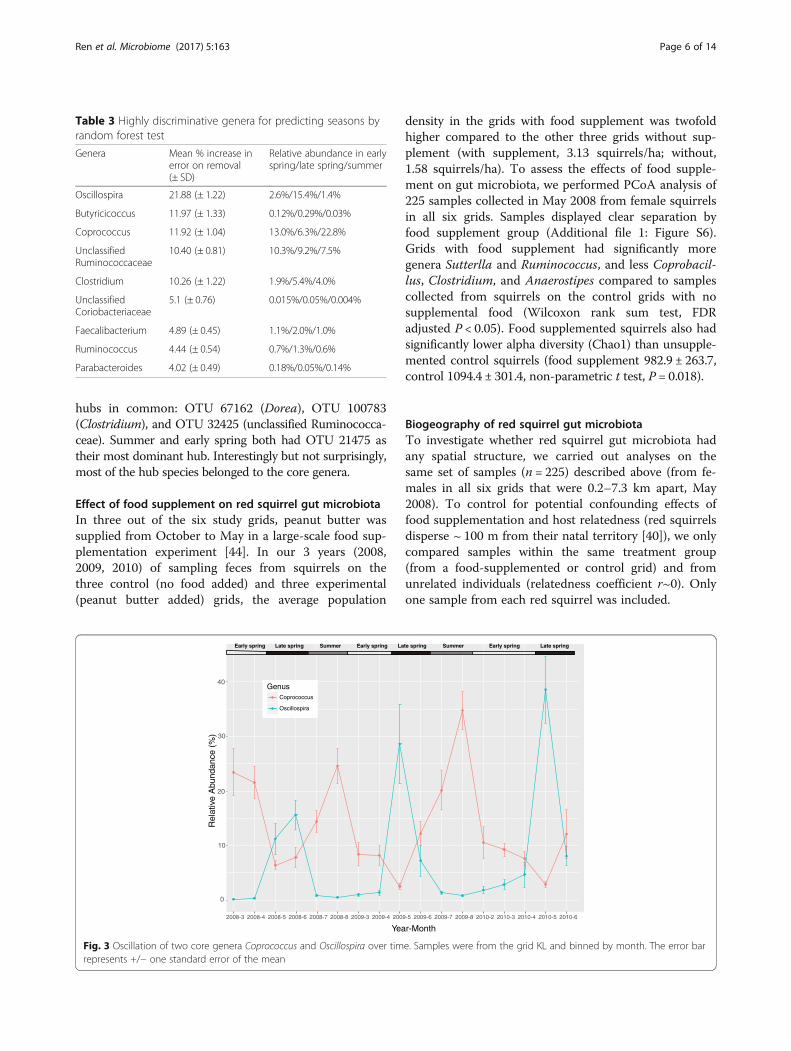
and Oscillospira exhibited the largest periodic fluctuationin relative abundance (amplitude). As shown in Fig. 3,there was a clear tradeoff of core genera Oscillospira andCoprococcus, which peaked in late spring and summer,respectively.The seasonal changes in gut microbiota occurred in
parallel with the shift in red squirrel’s dietary compositionas measured by opportunistic feeding observations of indi-vidually marked squirrels (n = 1279 observations between2008 and 2010; Additional file 1: Figure S3). We estimatedthe diet composition by aggregating all feeding eventswithin each month and then used the monthly diet com-position in the statistical analyses. In early spring, redsquirrels mainly consumed seeds from hoarded whitespruce (Picea glauca) cones and hypogeous fungi (falsetruffles). In late spring, red squirrels also consumed a sig-nificant amount of fresh white spruce buds and needles.In summer, red squirrels began to consume seeds fromnewly available spruce cones produced in the current year[38]. A Mantel test showed that diet and gut microbiotacompositions were significantly correlated (Bray-Curtis dis-tance, r = 0.44, P = 0.003). To further explore what specificcomponents of the diet correlated with the changes in gut
microbial community structure, we analyzed the associationof food items with the seasonal rhythmic genera. The ele-vated level of Oscillospira correlated with increased intakeof spruce buds in the late spring (R2 = 0.36, P = 0.007). Incontrast, the relative abundance of Coprococcus was higherat times of year when new spruce cones were con-sumed (P = 0.0002), but was negatively associated withspruce buds (P = 0.007, total R2 = 0.92). The percentageof false truffle mushroom consumption best predictedthe levels of Clostridium in red squirrel gut microbiota(R2 = 0.25, P = 0.03) where lower levels of Clostridiumwere associated with greater false truffle consumption.Alpha diversity (measured by Chao1) also displayed a
distinct cyclical pattern (JTK_cycle: adjusted P value <0.0001, period 12 months, amplitude 101.0). Within eachyear, species richness reached minima in the late springand maxima in the summer (Additional file 1: FigureS4). Interestingly, the overall microbial species richnessdecreased from 2008 to 2010, which coincided with thenatural decrease in red squirrel population density overthese years (2008: 1.46 squirrels/ha; 2009: 1.15 squirrels/ha; 2010: 0.93 squirrels/ha), resulting from several yearsof low spruce cone production [44].
100
90
80
70
60
50
40
30
20
10
0
Rel
ativ
e A
bund
ance
(%
)
2008 2009 2010
Early spring Late spring Summer
Coprococcus
UnclassifiedRuminococcaceae
Oscillospira
Blautia
Anaerostipes
Unclassified S24-7
UnclassifiedLachnospiraceae
Prevotella
Bacteroides
100
90
80
70
60
50
40
30
20
10
0
Rel
ativ
eA
bund
ance
(%)
Actinobacteria
Bacteroidetes
Firmicutes
Proteobacteria
Verrucomicrobia
A
B
Fig. 1 Bacterial composition of 549 red squirrel fecal samples from grid KL (from 2008 to 2010). Each column represents one sample. Y-axis valuesrepresent the relative abundance of each bacterial taxon. Samples are sorted by the sampling time. a Phylum level. b Genus level
Ren et al. Microbiome (2017) 5:163 Page 4 of 14
Seasonal OTU co-occurrence networkTo investigate how species interactions and the structureof red squirrel gut microbial community changed overtime, we reconstructed OTU co-occurrence network ineach season. Analyses of OTU network revealed scale-
free network structures in all three seasons (power law,R2 > 0.6). Despite the overall similarity in network struc-ture (Additional file 1: Table S1), the key hub species(species with most connections to other species) variedfrom season to season, indicating distinct species-speciesinteractions in each season (Additional file 1: Figure S5).In early spring, a Coprococcus species (OTU 21475) wasthe most dominant hub in the network. In late spring, itfaded out of the network and an Oscillospira species(OTU 54301) became the most dominant hub. Never-theless, there was still notable continuity in networkstructures. For example, early spring and late springboth had OTU 47644 (unclassified Ruminococcaceae) asa prominent hub. Late spring and summer had more
Fig. 2 a Relative abundance and prevalence of bacterial genera in red squirrel microbiota. The top ten most abundant genera are labeled withtheir genus names. b Bacterial genera showing strong seasonal rhythms. X-axis indicates the fluctuation amplitudes, and Y-axis indicates thestatistical significance of the rhythm. The size of dot represents the average relative abundance of each genus
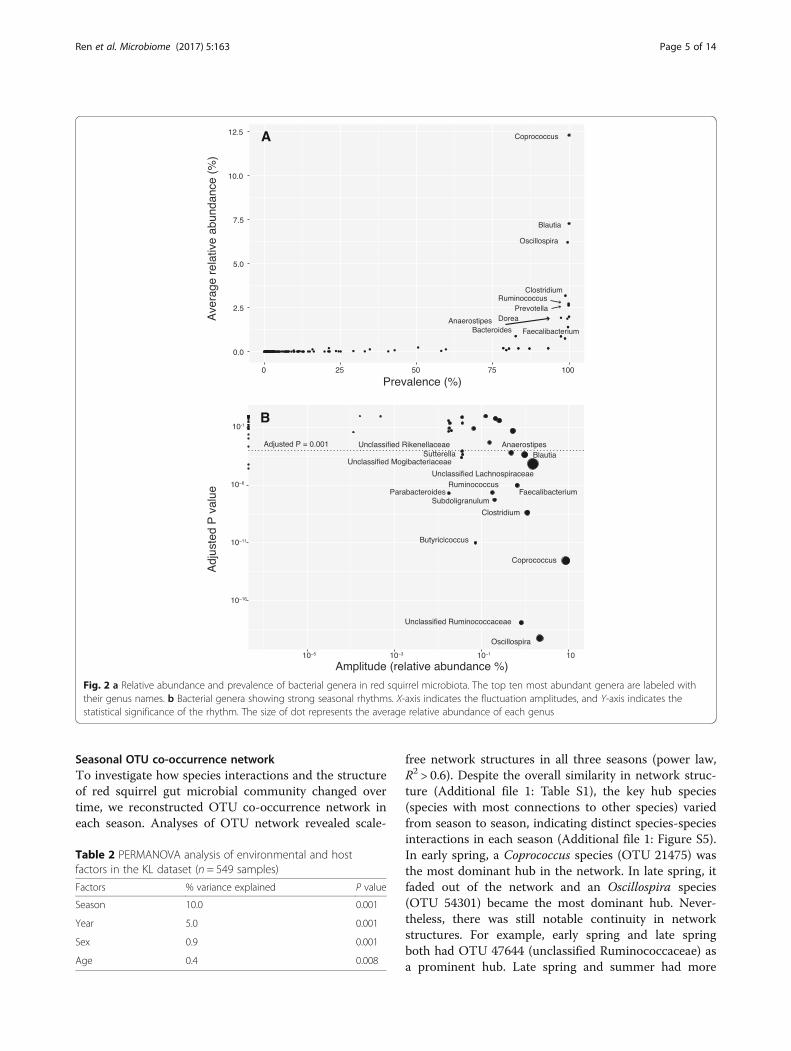
Table 2 PERMANOVA analysis of environmental and hostfactors in the KL dataset (n = 549 samples)
Factors % variance explained P value
Season 10.0 0.001
Year 5.0 0.001
Sex 0.9 0.001
Age 0.4 0.008
Ren et al. Microbiome (2017) 5:163 Page 5 of 14
hubs in common: OTU 67162 (Dorea), OTU 100783(Clostridium), and OTU 32425 (unclassified Ruminococca-ceae). Summer and early spring both had OTU 21475 astheir most dominant hub. Interestingly but not surprisingly,most of the hub species belonged to the core genera.
Effect of food supplement on red squirrel gut microbiotaIn three out of the six study grids, peanut butter wassupplied from October to May in a large-scale food sup-plementation experiment [44]. In our 3 years (2008,2009, 2010) of sampling feces from squirrels on thethree control (no food added) and three experimental(peanut butter added) grids, the average population
density in the grids with food supplement was twofoldhigher compared to the other three grids without sup-plement (with supplement, 3.13 squirrels/ha; without,1.58 squirrels/ha). To assess the effects of food supple-ment on gut microbiota, we performed PCoA analysis of225 samples collected in May 2008 from female squirrelsin all six grids. Samples displayed clear separation byfood supplement group (Additional file 1: Figure S6).Grids with food supplement had significantly moregenera Sutterlla and Ruminococcus, and less Coprobacil-lus, Clostridium, and Anaerostipes compared to samplescollected from squirrels on the control grids with nosupplemental food (Wilcoxon rank sum test, FDRadjusted P < 0.05). Food supplemented squirrels also hadsignificantly lower alpha diversity (Chao1) than unsupple-mented control squirrels (food supplement 982.9 ± 263.7,control 1094.4 ± 301.4, non-parametric t test, P = 0.018).
Biogeography of red squirrel gut microbiotaTo investigate whether red squirrel gut microbiota hadany spatial structure, we carried out analyses on thesame set of samples (n = 225) described above (from fe-males in all six grids that were 0.2–7.3 km apart, May2008). To control for potential confounding effects offood supplementation and host relatedness (red squirrelsdisperse ~ 100 m from their natal territory [40]), we onlycompared samples within the same treatment group(from a food-supplemented or control grid) and fromunrelated individuals (relatedness coefficient r~0). Onlyone sample from each red squirrel was included.
Table 3 Highly discriminative genera for predicting seasons byrandom forest test
Genera Mean % increase inerror on removal(± SD)
Relative abundance in earlyspring/late spring/summer
Oscillospira 21.88 (± 1.22) 2.6%/15.4%/1.4%
Butyricicoccus 11.97 (± 1.33) 0.12%/0.29%/0.03%
Coprococcus 11.92 (± 1.04) 13.0%/6.3%/22.8%
UnclassifiedRuminococcaceae
10.40 (± 0.81) 10.3%/9.2%/7.5%
Clostridium 10.26 (± 1.22) 1.9%/5.4%/4.0%
UnclassifiedCoriobacteriaceae
5.1 (± 0.76) 0.015%/0.05%/0.004%
Faecalibacterium 4.89 (± 0.45) 1.1%/2.0%/1.0%
Ruminococcus 4.44 (± 0.54) 0.7%/1.3%/0.6%
Parabacteroides 4.02 (± 0.49) 0.18%/0.05%/0.14%
0
10
20
30
40
2008-3 2008-4 2008-5 2008-6 2008-7 2008-8 2009-3 2009-4 2009-5 2009-6 2009-7 2009-8 2010-2 2010-3 2010-4 2010-5 2010-6
Year-Month
Rel
ativ
e A
bund
ance
(%
)
GenusCoprococcus
Oscillospira
Early spring Late spring Summer Early spring Late spring Summer Early spring Late spring
Fig. 3 Oscillation of two core genera Coprococcus and Oscillospira over time. Samples were from the grid KL and binned by month. The error barrepresents +/− one standard error of the mean
Ren et al. Microbiome (2017) 5:163 Page 6 of 14
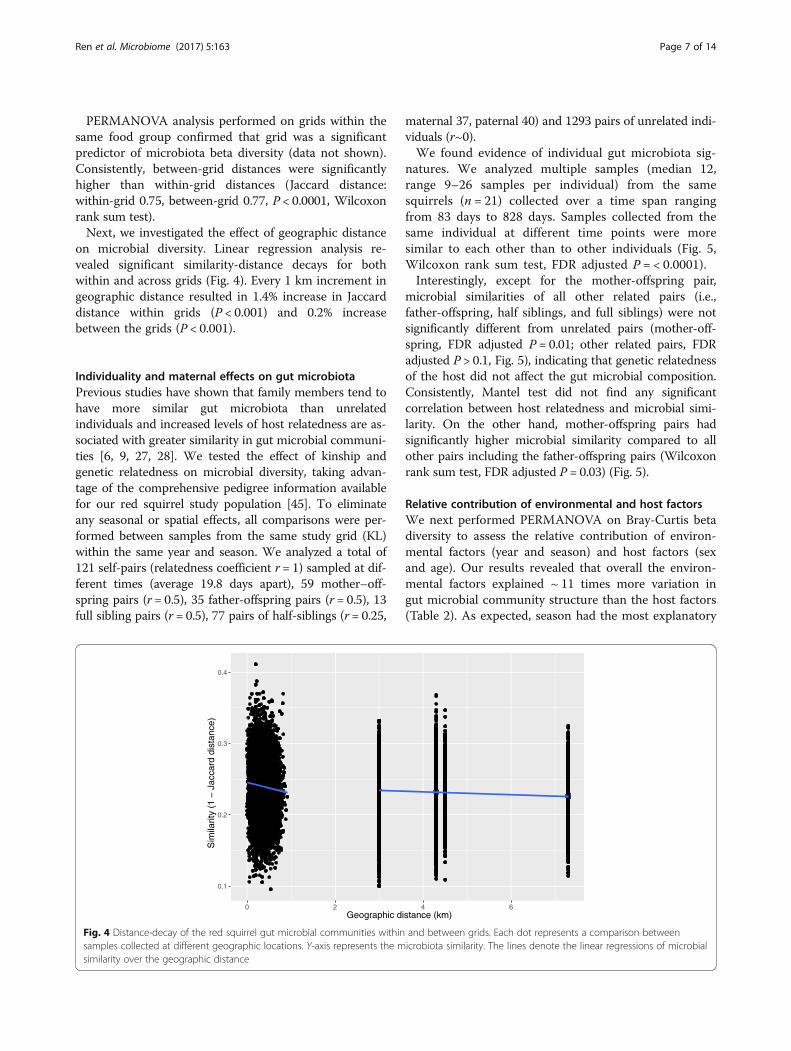
PERMANOVA analysis performed on grids within thesame food group confirmed that grid was a significantpredictor of microbiota beta diversity (data not shown).Consistently, between-grid distances were significantlyhigher than within-grid distances (Jaccard distance:within-grid 0.75, between-grid 0.77, P < 0.0001, Wilcoxonrank sum test).Next, we investigated the effect of geographic distance
on microbial diversity. Linear regression analysis re-vealed significant similarity-distance decays for bothwithin and across grids (Fig. 4). Every 1 km increment ingeographic distance resulted in 1.4% increase in Jaccarddistance within grids (P < 0.001) and 0.2% increasebetween the grids (P < 0.001).
Individuality and maternal effects on gut microbiotaPrevious studies have shown that family members tend tohave more similar gut microbiota than unrelatedindividuals and increased levels of host relatedness are as-sociated with greater similarity in gut microbial communi-ties [6, 9, 27, 28]. We tested the effect of kinship andgenetic relatedness on microbial diversity, taking advan-tage of the comprehensive pedigree information availablefor our red squirrel study population [45]. To eliminateany seasonal or spatial effects, all comparisons were per-formed between samples from the same study grid (KL)within the same year and season. We analyzed a total of121 self-pairs (relatedness coefficient r = 1) sampled at dif-ferent times (average 19.8 days apart), 59 mother–off-spring pairs (r = 0.5), 35 father-offspring pairs (r = 0.5), 13full sibling pairs (r = 0.5), 77 pairs of half-siblings (r = 0.25,
maternal 37, paternal 40) and 1293 pairs of unrelated indi-viduals (r~0).We found evidence of individual gut microbiota sig-
natures. We analyzed multiple samples (median 12,range 9–26 samples per individual) from the samesquirrels (n = 21) collected over a time span rangingfrom 83 days to 828 days. Samples collected from thesame individual at different time points were moresimilar to each other than to other individuals (Fig. 5,Wilcoxon rank sum test, FDR adjusted P = < 0.0001).Interestingly, except for the mother-offspring pair,
microbial similarities of all other related pairs (i.e.,father-offspring, half siblings, and full siblings) were notsignificantly different from unrelated pairs (mother-off-spring, FDR adjusted P = 0.01; other related pairs, FDRadjusted P > 0.1, Fig. 5), indicating that genetic relatednessof the host did not affect the gut microbial composition.Consistently, Mantel test did not find any significantcorrelation between host relatedness and microbial simi-larity. On the other hand, mother-offspring pairs hadsignificantly higher microbial similarity compared to allother pairs including the father-offspring pairs (Wilcoxonrank sum test, FDR adjusted P = 0.03) (Fig. 5).
Relative contribution of environmental and host factorsWe next performed PERMANOVA on Bray-Curtis betadiversity to assess the relative contribution of environ-mental factors (year and season) and host factors (sexand age). Our results revealed that overall the environ-mental factors explained ~ 11 times more variation ingut microbial community structure than the host factors(Table 2). As expected, season had the most explanatory
Fig. 4 Distance-decay of the red squirrel gut microbial communities within and between grids. Each dot represents a comparison betweensamples collected at different geographic locations. Y-axis represents the microbiota similarity. The lines denote the linear regressions of microbialsimilarity over the geographic distance
Ren et al. Microbiome (2017) 5:163 Page 7 of 14

power, explaining around 10.0% of the total variation. Yearwas next, accounting for 5.0% of variation. Althoughstatistically significant, contributions of host sex and agewere small, with each explaining no more than 0.9% ofvariation.
DiscussionIn this study, we focused on a well-characterized redsquirrel population to assess the contribution of envir-onmental and host factors in shaping gut microbiotastructure. At the phylum level, red squirrel gut micro-biota composition is broadly similar to those of othermammalian gut microbiota [13, 14, 46], with Firmicutes(88.6%) and Bacteroidetes (9.0%) being the two majorphyla. This result is consistent with our present under-standing that the mammalian gut harbors a highlyconstrained set of bacterial phyla adapted to the gastro-intestinal tract condition [13]. Unlike wild wood mice(Apodemus sylvaticus), which are dominated by thegenus Lactobacillus [15], red squirrels have a high levelof the genera Coprococcus (12.3%) and Oscillospira(6.2%), but very low levels of Lactobacillus (0.88%).Notably, red squirrels have remarkably low variation ingut bacterial phyla and shared a core set of genera across
time (year, season, host age), space (study grid), and hostfamily (Fig. 2a).We found a remarkable seasonal rhythm in red squir-
rel gut microbial composition, manifested by a tradeoffof the relative abundance of two core genera, Oscillos-pira and Coprococcus in late spring and summer (Fig. 3).Consistently, the network analyses revealed shifts in keyhubs in late spring from Coprococcus to Oscillospira anda swap in summer (Additional file 1: Figure S5). Theseasonal rhythm in gut microbial structure is clearlyassociated with seasonal dietary changes. The shift inmicrobiota composition coincides with emergence offresh spruce buds in late spring and fresh spruce conesin summer (Additional file 1: Figure S3). Accordingly,we found that the level of Oscillospira was positively cor-related with consumption of fresh spruce buds, whereasthe level of Coprococcus was positively correlated withconsumption of fresh spruce cones and negatively corre-lated with consumption of fresh spruce buds. Oscillos-pira are frequently found in cattle and sheep rumen andincrease significantly in relative abundance when hostsare feeding on fresh forage diet [47]. This is consistentwith our findings and strongly suggests that fluctuationof Oscillospira is driven by diet. Our result corroboratesthe findings in the wild wood mice and a human hunter-
0.6
0.7
0.8
0.9
self
mother−offspring
father−offspring
full sibling
half sibling
unrelated
relationship
Jacc
ard
dist
ance
Fig. 5 Red squirrel gut microbiota exhibit individuality and maternal effects. Box-and-whisker plots show pairwise Jaccard distances within eachrelationship groups. Significance values are from non-parametric Kruskal-Wallis tests (FDR adjusted). *P < 0.05, **P < 0.01, ***P < 0.001
Ren et al. Microbiome (2017) 5:163 Page 8 of 14

gathers population [15, 48]. Both studies observedseasonal cycling in the gut microbiota composition,which correlated with the seasonal shift in food availabil-ity and diet.The fact that Oscillospira and Coprococcus are present
in virtually all the samples we surveyed suggests thatthey were long-term gut residents and not foodborne.Supporting this, there was no evidence of Oscillospiraon fresh forage (pasture grass) fed to cattle or in soil[47]. Our result suggests that red squirrel gut microbiotaswitch between alternative states in response to recur-ring seasonal dietary changes. This may have resultedfrom continuous selective pressure on gut microbialcommunity during host-microbiota coevolution. Gutmicrobiota adapted to seasonal dietary shift can rapidlyshift their metabolic activity, provide the host dietaryflexibility, maximize energy extraction, and likelyincrease the fitness of the host-microbe ecosystem.Biogeographic patterns have been observed in human
and wild mice populations [6, 15, 29, 30]. All biogeo-graphic patterns were detected between populations. Wefound evidence for a weak but significant spatial structureat a much smaller local scale. Microbial compositionvaried across six study grids within a few kilometers.Moreover, a similarity-distance decay relationship wasfound within a population. Distance-decay patterns inmicrobial communities can be driven by environmentalfactors that vary across space, as recapitulated by thehypothesis that “everything is everywhere, but the envir-onment selects” [49]. Alternatively, the spatial patternscan be due to dispersal limitation, as it allows historical ef-fects to influence contemporary community structure. Wehave controlled for potential confounding environmentalfactors in our analysis (we only included samples from thesame year, season and sex). Thus, we think the most likelyexplanation for this biogeographic pattern is dispersallimitation of gut microbes, although we cannot rule outunmeasured spatially structured environmental factors.Red squirrels defend exclusive territories year-round andhave relatively limited physical interactions except duringmating [39, 50]. Thus, it is not surprising that red squirrelgut microbiota might be constrained by stronger dispersallimitation, which could result in spatial structures at asmall local scale.Island biogeography theory [51] can be useful for
understanding the microbial diversity if we view eachindividual gut as an island. Island theory posits that earlycolonizers could strongly influence the future commu-nity composition. Mothers can make a large contribu-tion to the species pool that first colonizes offspring. Ithas been recently proposed that maternal transmissionof gut microbiota is universal in animals [52] and theeffects of maternal transmission can be manifested overseveral generations [34]. In our study, we found that gut
microbiota of red squirrels were significantly more simi-lar to those of their mother than to those of their father(males provide no paternal care) and unrelated individ-uals. This finding indicates not only that gut microbiotain red squirrel can be maternally transmitted but alsothat the maternal effect persists until adulthood. Ourresult differs from a recent study showing no maternaleffect in a chimpanzee population [26]. This can beexplained by infrequent physical interactions betweenred squirrels compared to the highly social chimpanzees.It has been suggested that over the course of a lifetime,chimpanzees acquire most of their gut microbiomesthrough social interactions [26]. Also in contrast to find-ings in human populations [9], we found no evidenceindicating host genetics influence gut microbiota diver-sity in red squirrels. Since mother and father wereequally related to offspring, the genetic relatedness can-not explain higher microbial similarity observed inmother-offspring pairs. In addition, gut microbiota werenot significantly different between father-offspring, fullsibling, half sibling, and unrelated individual pairs.
ConclusionsIn summary, we performed a comprehensive survey of gutmicrobiota of a well-studied wild red squirrel population.Red squirrels harbor a typical rodent gut microbiota witha stable set of core genera. However, these core generaexhibited a remarkably strong seasonal rhythm in theirrelative abundance mainly associated with seasonal dietarychanges that was consistent across 3 years of study. Wealso found significant biogeographic pattern in gut micro-bial structure at a fine local scale (meters to kilometers)indicative of limited gut microbial dispersal. Despite thedominant effect of environmental factors, we found clearsignatures of individuality and maternal effects in redsquirrel gut microbial communities. However, host genet-ics does not seem to be a significant driver. Taken to-gether, the results of this study emphasize the importanceof external ecological factors rather than host attributes indriving temporal and spatial patterns of gut microbiota innatural environment.
MethodsSample collectionSubject descriptionStudy subjects were from a natural population of NorthAmerican red squirrels in the southwest Yukon (61°N,138°W) near Kluane National Park. Red squirrels in thisarea have been continuously monitored by the KluaneRed Squirrel Project since 1987 using a combination oflive-trapping and behavioral observations. All squirrelswere permanently marked with small metal ear tags andregularly monitored from March to September of eachyear. Several types of data including identity, sex, body
Ren et al. Microbiome (2017) 5:163 Page 9 of 14

mass, reproductive status, territory ownership, and diet-ary information were collected [37, 38]. In this study, wecollected 1000 fecal samples from 363 individuals thatspanned 3 years and 240 ha. Samples used in our studywere described below. A detailed description of thepopulation can be found in [37].Study grids. The study area consists of six ~ 40 ha grids
that are 0.2~7.3 km apart from each other (Additional file 1:Figure S7). Samples were collected mainly from two grids(Kloo or KL, n = 618; Agnes or AG, n = 232). Samplescollected from the other four grids were used to study thebiogeographic structure of microbiota between grids (Jo orJO, n = 25, Sulfur or SU = 25, Chitty or CH= 50, Lloyd orLL = 50). On grids AG, LL, and JO, peanut butter wasprovided as a food supplement from October to May ineach year to experimentally increase population density[44]. The three other study grids (KL, CH, SU) were notmanipulated and, therefore, represented the naturalenvironment for red squirrels. All study grids were stakedand flagged at 30 m intervals so that we could identify theexact distances among the territories of different squirrels.
Sampling years and seasonsThe seeds of white spruce cones (Picea glauca) are themajor food resource for red squirrels [38]. White spruce isa masting tree species that produces a super-abundance ofcones in some years (mast years) and few to no cones inother years [53]. Previous studies have shown tremendousyearly variation in spruce cone production that has largeecological and evolutionary impacts on red squirrel lifehistories and behavior [38, 44, 54]. Our samples span fromyear 2008 to 2010, with 2010 being a mast year whenspruce cone production was extremely high, though newcones produced in that year were largely unavailable untilmid-August. Within each year, samples were collected inthree seasons: early spring (February through April), latespring (May and June), and summer (July and August).
Diet informationThe study area is located in the Boreal forest, dominatedby white spruce and willows (Salix spp.). Red squirrelsmostly feed on the seeds of white spruce cones. Whitespruce trees produce fresh cones that are available to beconsumed by red squirrels from July to September ofeach year. These fresh spruce cones are hoarded forsubsequent consumption in a larder hoard at the centerof the squirrel’s territory (midden). Squirrels consumethese cached cones from their midden throughout thewinter and at least into the next spring. Squirrels alsofeed on mushrooms, spruce buds, false truffles, berries,and a variety of items depending on their seasonal avail-ability [38]. From March–September of each year, weopportunistically recorded what food items squirrelswere feeding upon and visually identified these items.
We classified these items of red squirrels’ diet into fivefood categories: (1) seeds of hoarded white spruce cones,(2) seeds of fresh white spruce cones, (3) hypogeousfungi (false truffles), (4) spruce buds, and (5) others(spruce needles, spruce bark, willow leaves, willow buds,aspen leaves, bearberry flowers, white spruce witchesbroom rust caused by the fungus Chrysomyxa arctosta-phyli, animal material, snow, and unidentifiable items)(Additional file 1: Figure S3). In total, we recorded 1279feeding events spanning 16 months between 2008 and2010 (average 80 events per month). Since diet compos-ition is similar among individuals, all feeding eventswere aggregated by months in our study to provide suit-able estimates of the composition of diet for eachmonth.
TerritoryBoth female and male adult red squirrels defend exclusiveterritories around a central larder hoard (midden) contain-ing cached white spruce cones for over winter survival [39].Juveniles that fail to acquire territories before their firstwinter generally do not survive [55]. On average, only 26%of offspring survive to 1 year of age [37, 56]. In May andAugust of each year, we completely enumerated all squirrelson the study grids so that we could identify territory owner-ship. The location of each animal’s midden was recordedand used to estimate the distance between individuals.
AgeThe average adult lifespan of wild red squirrels in thispopulation is 3.5 years (maximal, 9 years) [37]. Juvenilesusually leave the natal area 70 days after birth, and themean dispersal distance is 96 ± 94 m from the natal area[40]. Red squirrels reach sexual and reproductive matur-ity at ~ 1 year old. After adults acquire a territory priorto experiencing their first winter, dispersal away fromthat territory is rare [40]. In this study, we collectedsamples from individuals 0–6 years of age. The age esti-mation for most individuals was accurate to within daysbecause most individuals were first marked in their natalnest.
Sex and reproductive statusRed squirrels are sexually monomorphic in adult bodymass, and there is no sex-bias in natal dispersal [57].During the breeding season (roughly March to Maydepending upon the year), multiple males come to theterritories of females to mate with them [58]. Femalesraise young without any help from males. During eachcapture event, we recorded the reproductive status ofadult females through abdominal palpation (to assesspregnancy status as fetuses are palpable through theabdomen) and assessing nipple status. Females were cat-egorized as non-breeding, lactating, or weaning.
Ren et al. Microbiome (2017) 5:163 Page 10 of 14

PedigreeFor the fecal samples that we collected between 2008and 2010, the multigenerational pedigree [45] for the KLgrid included 124 individuals, with 78 known maternallinks and 83 known paternal links. Maternity was deter-mined by behavioral observation before the emergenceof juvenile squirrels from their natal areas. Paternity wasassigned based on 16 microsatellite loci using CERVUS3.0 with > = 95% confidence (detailed in [58]).
Fecal sample collection, DNA extraction, and 16S rRNAsequencingFecal samples collected from underneath live traps wereplaced into 1.5 mL vials individually using forceps. Fecalsamples collected in the colder months (January–April)were generally frozen upon collection. In the warmermonths (May–September), the vials were kept on iceand then transferred to a − 20 °C freezer within 5 h ofcollection [59].We extracted DNA from fecal samples in a 96-well
format using the ZR-96 Fecal DNA Kits (ZymoResearch, Orange, CA) following the manufacturer’sprotocol. The V1–V3 hypervariable regions of the 16SrRNA gene were amplified using two universal primers27F (5’-AGRGTTTGATCMTGGCTCAG-3′) and 534R(5’-TTACCGCGGCTGCTGGCAC-3′). We added aunique 8 bp barcode to each primer to tag the samplesand used a 50-uL reaction for each PCR amplification byQIAGEN Taq polymerase (Qiagen Inc., CA). PCR condi-tions consisted of 94 °C for 3 min, followed by 25 cyclesof 94 °C for 30 s, 57 °C for 30 s, and 72 °C for 60 s, witha final extension of 5 min at 72 °C. 16S rRNA ampliconsfrom different samples were pooled in equal molarratios, then gel purified and sequenced on an IlluminaMiSeq platform using the 300 bp paired-end (PE) proto-col. All liquid transfer steps were performed on aBiomek NXp liquid handling station (Beckman-CoulterInc., Fullerton, USA).
Sequence processing, quality control, and OTUclassificationWe filtered sequence reads by base quality using TRIMMO-MATIC 0.32 with settings of LEADING= 3, SLIDING-WINDOW=10:20, and MINLEN= 50 [60]. Paired-endreads passing the quality filter were merged using FLASH(-r 301 -f 447 -s 45 -x 0.05) [61]. The successfully mergedreads were assigned to samples by barcodes and processedusing the QIIME pipeline [62]. We identified chimeric se-quences using USEARCH [63] implemented in QIIME withboth de novo and reference-based detection algorithms.Only those sequences that were flagged as non-chimeraswith both detection methods were retained. We then re-moved non-16S rRNA sequences using hmmsearch [64]against a custom-made 16S rRNA gene model. The
remaining reads were clustered to OTUs by UCLUST [65]using an identity threshold of 97%. The most abundant se-quence of each OTU was selected as the representative se-quence, which was then classified using the RDP classifier[66]. OTUs belonging to mitochondrion or chloroplast wereremoved. To remove sequencing effort heterogeneity, sam-ples were rarefied to 4000 reads per sample. Of our initialset of 1000 samples, three were excluded as outliers becausethe average distance of each of these three samples fromother samples were more than 1.5 times the interquartilerange above the higher 75% percentile. During rarefaction,92 samples were removed due to insufficient number ofreads, leaving a final dataset of 905 samples.
Effect of environmental/host factors on gut microbialdiversityWe measured alpha diversity by Chao1 index. To com-pare beta diversity among samples, we first excluded anyOTUs with less than five sequence reads. We then con-structed beta diversity matrices from OTU table usingfour distance metrics: Jaccard, Bray-Curtis, unweightedUniFrac and weighted UniFrac distance [67].To test the predictors of gut microbial composition, we
first performed exploratory PCoA using all beta diversitymatrices in QIIME. To assess the relative contribution ofenvironmental and host factors to the variation of micro-bial community, we performed PERMANOVA on Bray-Curtis distance matrices of 549 samples in the KL gridusing the “adonis” function of the vegan package imple-mented in R [68]. Factors included in the PERMANOVAanalysis included season, year, host age, and sex. The per-centage of variation explained by each factor was mea-sured using R2, and the significance (P value) of eachfactor was obtained by 999 permutation tests.
Identifying bacterial taxa with seasonal rhythmsWe used supervised random forest model implementedin QIIME (supervised_learning.py) to identify signaturegenera in each of the three seasons: early spring, latespring, and summer. Random forest model classifiedeach fecal sample into one of three seasons using modelsbuilt on the relative abundance of each genus. Modelaccuracy was calculated using the 10-fold cross valid-ation error estimate, which was an approximation ofhow frequently a sample was misclassified. The discrim-inatory power of each genus was assessed by comparingthe classification accuracy with and without includingthe genus in the model. Genera that led to more loss ofclassification accuracy were considered to be morediscriminatory.To test whether bacterial genera identified above had
seasonal rhythms, we used a non-parametric testJTK_CYCLE [43]. JTK_CYCLE has been used in detect-ing rhythmic elements in circadian clock studies [69].
Ren et al. Microbiome (2017) 5:163 Page 11 of 14

We tested seasonal periodicity using a window of 11–12 months. Benjamini-Hochberg procedure was used tocontrol the false discovery rate.
Correlation between microbial composition and dietTo test possible associations between dietary items andrhythmic genera identified above, we constructedgeneral linear models on each genus. We began with thefull model including all dietary items as the explanatoryvariables and genus relative abundance as the responsevariable. Non-significant predictor variables wereexcluded stepwise from the saturated model using the‘step’ command, and the best model with the lowest AICscore was selected. We checked model assumptions byexamining the distribution of residuals and plottingfitted values against residuals. We also performedMantel tests to evaluate the correlation between thedistance matrices built based on dietary item variationand bacterial beta diversity distances. The significance ofMantel’s r was assessed with 999 permutations.
Effect of kinship on gut microbiotaTo assess the effects of genetic relatedness, we calculatedpairwise relatedness from the extensive pedigree dataavailable for red squirrels in the KL grid [45] using the Rpackage pedantics [70]. We then performed Mantel teststo evaluate the correlation between the relatedness matrixand microbial beta diversity distance matrices. To furtherassess the effect of kinship, we divided pairs into six groups:self-pairs (relatedness coefficient r = 1, n = 121), mother-offspring (r = 0.5, n = 59), father-offspring (r = 0.5, n = 35),full siblings (r = 0.5, n = 13), half siblings (r = 0.25, n = 77),and unrelated (r~0, n = 1293). Jaccard distances of eachgroup were compared with non-parametric Kruskal-Wallistests with post hoc comparisons and corrected usingBenjamini-Hochberg false discovery rate (FDR). To controlfor temporal variation, we restricted all the above analysesto only comparing samples collected within the same yearand season.
OTU co-occurrence networkMicrobial network of significant co-occurrence andco-exclusion interactions was built using the CoNet1.1.0 plugin [71] in Cytoscape [72]. Networks were builtfor each season separately, and only abundant OTUs(average relative abundance > 0.1%) were used. Theanalyses were carried out with the following parameters:1000 initial top and bottom edges, five similarity measures(Spearman, Pearson, Mutual information; Kullbackleibler,and Bray Curtis), null distribution generated by 1000permutations with renormalization, and 1000 iterationsfor bootstraps. Networks built with different similaritymeasures were merged using the Simes method [73] and aBenjamini-Hochberg false discovery rate (FDR) cutoff of
0.05. NetworkAnalyzer was used to analyze the topologicalparameters of the resulting networks [74].
Additional file
Additional file 1: Figure S1. Principal coordinate analysis (PCoA) of redsquirrel gut microbial communities in grid KL based on Bray-Curtis dis-tance. Samples are colored by sampling season. The percentage of thevariation explained by the first three coordinates is indicated on the axes.Figure S2. Time-decay of the red squirrel gut microbial communities.Each dot represents a comparison between two samples of the sameindividual collected at different time points. The colors of dots representthe combination of seasons when the two samples were collected. Y-axisrepresents the microbiota similarity. The similarity decay as a function oftime best fits a power law (blue line). The shade shows the 95%confidence bounds. Figure S3. The composition of red squirrel dietacross 3 years aggregated by month. Each color represents a differentdietary item. Figure S4. Seasonal rhythm in the alpha diversity of redsquirrel gut microbiota. Species richness is estimated by Chao1 index.Figure S5. Key hub species in OTU co-occurrence network vary byseason. The co-occurrence network is displayed using Cytoscape with thePrefuse Force Directed (edge betweenness) layout. Negative correlationsare represented by red edges and positive correlations by green. Eachnode represents an OTU with > 0.1% relative abundance and is coloredby bacterial family to which it belongs. Key hub OTUs are labeled withtheir IDs, genus names, and the numbers of positive and negative edges.Figure S6. Principal coordinate analysis (PCoA) of red squirrel gut micro-bial communities across six grids based on Jaccard distance. Samples arecolored by food supplement status. The percentage of the variation ex-plained by the first three coordinates are indicated on the axes. FigureS7. Locations of study grids along the Alaska Highway in the southwestYukon (61°N, 138°W) near Kluane National Park. (Adopted from 73) Eachgrid is labeled with the number of samples collected and the food sup-plement status. Table S1. Properties of OTU networks in three seasons.(PDF 903 kb)
AbbreviationsOTU: Operational taxonomic unit; PCR: Polymerase chain reaction
AcknowledgementsNot applicable.
FundingNot applicable.
Availability of data and materialsThe datasets supporting the conclusions of this article are available in theFigShare repository, [https://figshare.com/s/a52886d8016cdd1f0dbb]. Thedata will be made public upon the acceptance of this manuscript.
Authors’ contributionsTR conceived the study, performed laboratory assays, analyzed the data, andwrote the manuscript. SB, MMH, JCG, and DWC collected samples. BDcollected samples and edited the manuscript. AGM conceived the study,collected samples, and edited the manuscript. MW conceived the study andwrote the manuscript. All authors read and approved the final manuscript.
Ethics approval and consent to participateNot applicable.
Consent for publicationNot applicable.
Competing interestsThe authors declare that they have no competing interests.
Ren et al. Microbiome (2017) 5:163 Page 12 of 14
Publisher’s NoteSpringer Nature remains neutral with regard to jurisdictional claims inpublished maps and institutional affiliations.
Author details1Department of Biology, University of Virginia, Charlottesville, VA, USA.2Department of Biological Sciences, University of Alberta, Edmonton, Alberta,Canada. 3Department of Natural Resource Sciences, Macdonald Campus,McGill University, Ste-Anne-de-Bellevue, Québec, Canada. 4Department ofPsychology and Department of Ecology and Evolutionary Biology, Universityof Michigan, Ann Arbor, MI, USA. 5Biology Department, Vancouver IslandUniversity, Nanaimo, British Columbia, Canada. 6Department of IntegrativeBiology, University of Guelph, Guelph, Ontario, Canada.
Received: 13 July 2017 Accepted: 12 December 2017
References1. Qin J, Li Y, Cai Z, Li S, Zhu J, Zhang F, et al. A metagenome-wide association
study of gut microbiota in type 2 diabetes. Nature. 2012;490:55–60.2. Morgan XC, Tickle TL, Sokol H, Gevers D, Devaney KL, Ward DV, et al.
Dysfunction of the intestinal microbiome in inflammatory bowel diseaseand treatment. Genome Biol. 2012;13:R79.
3. Hooper LV, Littman DR, Macpherson AJ. Interactions between themicrobiota and the immune system. Science. 2012;336:1268–73.
4. Markle JGM, Frank DN, Mortin-Toth S, Robertson CE, Feazel LM, Rolle-Kampczyk U, et al. Sex differences in the gut microbiome drive hormone-dependent regulation of autoimmunity. Science. 2013;339:1084–8.
5. Ren T, Grieneisen LE, Alberts SC, Archie EA, Development WM. Diet anddynamism: longitudinal and cross-sectional predictors of gut microbialcommunities in wild baboons. Environ Microbiol. 2015;18:1312–25.
6. Yatsunenko T, Rey FE, Manary MJ, Trehan I, Dominguez-Bello MG, ContrerasM, et al. Human gut microbiome viewed across age and geography. Nature.2012;486:222–7.
7. Claesson MJ, Jeffery IB, Conde S, Power SE, O’Connor EM, Cusack S, et al.Gut microbiota composition correlates with diet and health in the elderly.Nature. 2012;488:178–84.
8. David LA, Maurice CF, Carmody RN, Gootenberg DB, Button JE, Wolfe BE, etal. Diet rapidly and reproducibly alters the human gut microbiome. Nature.2015;505:559–63.
9. Goodrich JK, Waters JL, Poole AC, Sutter JL, Koren O, Blekhman R, et al.Human genetics shape the gut microbiome. Cell. 2014;159:789–99.
10. Lee SM, Donaldson GP, Mikulski Z, Boyajian S, Ley K, Mazmanian SK.Bacterial colonization factors control specificity and stability of the gutmicrobiota. Nature. 2014;501:426–9.
11. Amato KR, Martinez-Mota R, Righini N, Raguet-Schofield M, Corcione FP,Marini E, et al. Phylogenetic and ecological factors impact the gutmicrobiota of two Neotropical primate species. Oecologia. 2016;180:717–33.
12. Martínez I, Stegen JC, Maldonado-Gómez MX, Eren AM, Siba PM, GreenhillAR, et al. The gut microbiota of rural papua new guineans: composition,diversity patterns, and ecological processes. Cell Rep. 2015;11:527–38.
13. Ley RE, Hamady M, Lozupone CA, Turnbaugh PJ, Ramey RR, Bircher JS, et al.Evolution of mammals and their gut microbes. Science. 2008;320:1647–51.
14. Delsuc F, Metcalf JL, Wegener Parfrey L, Song SJ, Gonzalez A, Knight R.Convergence of gut microbiomes in myrmecophagous mammals. Mol Ecol.2014;23:1301–17.
15. Maurice CF, Knowles SCL, Ladau J, Pollard KS, Fenton A, Pedersen AB,et al. Marked seasonal variation in the wild mouse gut microbiota. ISMEJ. 2015;9:2423–34.
16. Carey HV, Walters WA, Knight R. Seasonal restructuring of the groundsquirrel gut microbiota over the annual hibernation cycle. Am J Phys RegulIntegr Comp Phys. 2013;304:R33–42.
17. Xue Z, Zhang W, Wang L, Hou R, Zhang M, Fei L, et al. The bamboo-eatinggiant panda harbors a carnivore-like gut microbiota, with excessive seasonalvariations. MBio. 2015;6:e00022–15.
18. Khachatryan ZA, Ktsoyan ZA, Manukyan GP, Kelly D, Ghazaryan KA, AminovRI. Predominant role of host genetics in controlling the composition of gutmicrobiota. PLoS One. 2008;3:e3064.
19. Rausch P, Rehman A, Künzel S, Häsler R, Ott SJ, Schreiber S, et al.Colonic mucosa-associated microbiota is influenced by an interaction of
Crohn disease and FUT2 (secretor) genotype. Proc Natl Acad Sci U S A.2011;108:19030–5.
20. Frank DN, Robertson CE, Hamm CM, Kpadeh Z, Zhang T, Chen H, et al. Diseasephenotype and genotype are associated with shifts in intestinal-associatedmicrobiota in inflammatory bowel diseases. Inflamm Bowel Dis. 2011;17:179–84.
21. Rehman A, Sina C, Gavrilova O, Häsler R, Ott S, Baines JF, et al. Nod2 isessential for temporal development of intestinal microbial communities.Gut. 2011;60:1354–62.
22. Wacklin P, Mäkivuokko H, Alakulppi N, Nikkilä J, Tenkanen H, Räbinä J, et al.Secretor genotype (FUT2 gene) is strongly associated with the compositionof Bifidobacteria in the human intestine. PLoS One. 2011;6:e20113.
23. Benson AK, Kelly SA, Legge R, Ma F, Low SJ, Kim J, et al. Individuality in gutmicrobiota composition is a complex polygenic trait shaped by multipleenvironmental and host genetic factors. Proc Natl Acad Sci U S A 2010;107:18933–18938.
24. McKnite AM, Perez-Munoz ME, Lu L, Williams EG, Brewer S, Andreux PA, etal. Murine gut microbiota is defined by host genetics and modulatesvariation of metabolic traits. PLoS One. 2012;7:e39191.
25. Turnbaugh PJ, Hamady M, Yatsunenko T, Cantarel BL, Duncan A, Ley RE, et al.A core gut microbiome in obese and lean twins. Nature. 2009;457:480–4.
26. Moeller AH, Foerster S, Wilson ML, Pusey AE, Hahn BH, Ochman H. Socialbehavior shapes the chimpanzee pan-microbiome. Sci Adv 2016;2:e1500997–7.
27. Tims S, Derom C, Jonkers DM, Vlietinck R, Saris WH, Kleerebezem M, et al.Microbiota conservation and BMI signatures in adult monozygotic twins.ISME J. 2013;7:707–17.
28. Lee S, Sung J, Lee J, Ko G. Comparison of the gut microbiotas of healthyadult twins living in South Korea and the United States. Appl EnvironMicrobiol. 2011;77:7433–7.
29. Zhang J, Guo Z, Xue Z, Sun Z, Zhang M, Wang L, et al. A phylo-functionalcore of gut microbiota in healthy young Chinese cohorts across lifestyles,geography and ethnicities. ISME J. 2015:1–12.
30. Linnenbrink M, Wang J, Hardouin EA, Künzel S, Metzler D, Baines JF. Therole of biogeography in shaping diversity of the intestinal microbiota inhouse mice. Mol Ecol. 2013;22:1904–16.
31. Tung J, Barreiro LB, Burns MB, Grenier J-C, Lynch J, Grieneisen LE, et al.Social networks predict gut microbiome composition in wild baboons. eLifeSci. 2015;4:e1002358.
32. Moeller AH, Peeters M, Ndjango J-B, Li Y, Hahn BH, Ochman H. Sympatricchimpanzees and gorillas harbor convergent gut microbial communities.Genome Res. 2013;23:1715–20.
33. Osawa R, Blanshard WH, Ocallaghan PG. Microbiological studies of theintestinal microflora of the koala, Phascolarctos-cinereus .2. Pap, a specialmaternal feces consumed by juvenile koalas. Aus J Zool. 1993;41:611–20.
34. Ley RE, Bäckhed F, Turnbaugh P, Lozupone CA, Knight RD, Gordon JI. Obesityalters gut microbial ecology. Proc Natl Acad Sci U S A. 2005;102:11070–5.
35. Palmer C, Bik EM, DiGiulio DB, Relman DA, Brown PO. Development of thehuman infant intestinal microbiota. PLoS Biol. 2007;5:e177.
36. Perez PF, Doré J, Leclerc M, Levenez F, Benyacoub J, Serrant P, et al.Bacterial imprinting of the neonatal immune system: lessons from maternalcells? Pediatrics. 2007;119:e724–32.
37. McAdam AG, Boutin S, Sykes AK, Humphries MM. Life histories of female redsquirrels and their contributions to population growth and lifetime fitness.Écoscience. 2007;14:362–9.
38. Fletcher QE, Landry-Cuerrier M, Boutin S, McAdam AG, Speakman JR,Humphries MM. Reproductive timing and reliance on hoarded capitalresources by lactating red squirrels. Oecologia. 2013;173:1203–15.
39. Dantzer B, Boutin S, Humphries MM, AG MA. Behavioral responses ofterritorial red squirrels to natural and experimental variation in populationdensity. Behav Ecol Sociobiol. 2012;66:865–78.
40. Berteaux D, Boutin S. Breeding dispersal in female north American redsquirrels. Ecology. 2000;81:1311–26.
41. Lane JE, Boutin S, Gunn MR, Coltman DW. Sexually selected behaviour: redsquirrel males search for reproductive success. J Anim Ecol. 2009;78:296–304.
42. Donald JL, Boutin S. Intraspecific cache pilferage by larder-hoarding redsquirrels (Tamiasciurus hudsonicus). J Mammal. 2011;92:1013–20.
43. Hughes ME, Hogenesch JB, Kornacker K. JTK_CYCLE: an efficientnonparametric algorithm for detecting rhythmic components in genome-scale data sets. J Biol Rhythm. 2010;25:372–80.
44. Dantzer B, Newman AEM, Boonstra R, Palme R, Boutin S, Humphries MM, etal. Density triggers maternal hormones that increase adaptive offspringgrowth in a wild mammal. Science. 2013;340:1215–7.
Ren et al. Microbiome (2017) 5:163 Page 13 of 14

45. McFarlane SE, Gorrell JC, Coltman DW, Humphries MM, Boutin S, McAdam AG. Thenature of nurture in a wild mammal’s fitness. Proc R Soc B. 2015;282:20142422.
46. Muegge BD, Kuczynski J, Knights D, Clemente JC, Gonzalez A, Fontana L, etal. Diet drives convergence in gut microbiome functions across mammalianphylogeny and within humans. Science. 2011;332:970–4.
47. Mackie RI, Aminov RI, Hu W, Klieve AV, Ouwerkerk D, Sundset MA, et al.Ecology of uncultivated Oscillospira species in the rumen of cattle, sheep,and reindeer as assessed by microscopy and molecular approaches. ApplEnviron Microbiol. 2003;69:6808–15.
48. Smits SA, Leach J, Sonnenburg ED, Gonzalez CG, Lichtman JS, Reid G, et al.Seasonal cycling in the gut microbiome of the Hadza hunter-gatherers ofTanzania. Science. 2017;357:802–6.
49. Becking LGMB. Baas Becking’s geobiology: or introduction to environmentalscience. John Wiley & Sons, Ltd; 2016.
50. Smith CC. The adaptive nature of social organization in the genus of threesquirrels Tamiasciurus. Ecol Monogr. 1968;38:31–64.
51. MacArthur RH, Wilson EO. The theory of island biogeography. PrincetonUniversity Press; 1967.
52. Funkhouser LJ, Bordenstein SR. Mom knows best: the universality ofmaternal microbial transmission. PLoS Biol. 2013;11:e1001631–9.
53. LaMontagne JM, Boutin S. Local-scale synchrony and variability in mastseed production patterns of Picea glauca. J Ecol. 2007;95:991–1000.
54. Boutin S, Wauters LA, McAdam AG, Humphries MM, Tosi G, Dhondt AA.Anticipatory reproduction and population growth in seed predators.Science. 2006;314:1928–30.
55. Larsen KW, Boutin S. Movements, survival, and settlement of red squirrel(Tamiasciurus hudsonicus) offspring. Ecology. 1994;75:214–23.
56. McAdam AG, Boutin S. Variation in viability selection among cohorts ofjuvenile red squirrels (Tamiasciurus hudsonicus). Evolution. 2003;57:1689–97.
57. Larsen KW, Boutin S. Sex-unbiased philopatry in the North American redsquirrel, Tamiasciurus hudsonicus. In: Steele MA, Merritt JF, Zegers DA,editors. Sex-unbiased philopatry in the North American red squirrel,Tamiasciurus hudsonicus: Virginia Museum of Natural History; 1998. p. 21.
58. Lane JE, Boutin S, Gunn MR, Slate J, Coltman DW. Female multiple matingand paternity in free-ranging North American red squirrels. Anim Behav.2008;75:1927–37.
59. Dantzer B, McAdam AG, Palme R, Fletcher QE, Boutin S, Humphries MM, etal. Fecal cortisol metabolite levels in free-ranging North American redsquirrels: assay validation and the effects of reproductive condition. GenComp Endocrinol. 2010;167:279–86.
60. Bolger AM, Lohse M, Usadel B. Trimmomatic: a flexible trimmer for Illuminasequence data. Bioinformatics. 2014;30:2114–20.
61. Magoč T, Salzberg SLFLASH. Fast length adjustment of short reads toimprove genome assemblies. Bioinformatics. 2011;27:2957–63.
62. Caporaso JG, Kuczynski J, Stombaugh JI, Bittinger K, Bushman FD, CostelloEK, et al. QIIME allows analysis of high-throughput community sequencingdata. Nat Methods. 2010;7:335–6.
63. Edgar RC, Haas BJ, Clemente JC, Quince C, Knight R. UCHIME improvessensitivity and speed of chimera detection. Bioinformatics. 2011;27:2194–200.
64. Eddy SR. Profile hidden Markov models. Bioinformatics. 1998;14:755–63.65. Edgar RC. Search and clustering orders of magnitude faster than BLAST.
Bioinformatics. 2010;26:2460–1.66. Wang Q, Garrity GM, Tiedje JM, Cole JR. Naive Bayesian classifier for rapid
assignment of rRNA sequences into the new bacterial taxonomy. ApplEnviron Microbiol. 2007;73:5261–7.
67. Lozupone CA, Knight R. UniFrac: a new phylogenetic method forcomparing microbial communities. Appl Environ Microbiol. 2005;71:8228–35.
68. Oksanen J, Kindt R, Legendre P, OHara B, Simpson GL, Solymos P, et al. Thevegan package. Commun Ecol Pack. 2007;1–190.
69. Thaiss CA, Zeevi D, Levy M, Zilberman-Schapira G, Suez J, Tengeler AC, et al.Transkingdom control of microbiota diurnal oscillations promotes metabolichomeostasis. Cell. 2014;159:514–29.
70. Morrissey MB, Wilson AJ. Pedantics: an r package for pedigree-basedgenetic simulation and pedigree manipulation, characterization andviewing. Mol Ecol Resour. 2010;10:711–9.
71. Faust K, Sathirapongsasuti JF, Izard J, Segata N, Gevers D, Raes J, et al.Microbial co-occurrence relationships in the human microbiome. PLoSComput Biol. 2012;8:e1002606.
72. Smoot ME, Ono K, Ruscheinski J, Wang P, Ideker T. Cytoscape 2.8: new featuresfor data integration and network visualization. Bioinformatics. 2011;27:431–2.
73. Sarkar SK, Chang C-K. The simes method for multiple hypothesis testingwith positively dependent test statistics. J Am Stat Assoc. 2012;92:1601–8.
74. Assenov Y, Ramírez F, Schelhorn S-E, Lengauer T, Albrecht M. Computingtopological parameters of biological networks. Bioinformatics. 2008;24:282–4.
• We accept pre-submission inquiries
• Our selector tool helps you to find the most relevant journal
• We provide round the clock customer support
• Convenient online submission
• Thorough peer review
• Inclusion in PubMed and all major indexing services
• Maximum visibility for your research
Submit your manuscript atwww.biomedcentral.com/submit
Submit your next manuscript to BioMed Central and we will help you at every step:
Ren et al. Microbiome (2017) 5:163 Page 14 of 14


