Sears - Layout
23
Layout Appropriateness: A metric for evaluating user interface widget layout Andrew Sears Human-Computer Interaction Laboratory & Computer Science Department University of Maryland College Park, MD 20742 [email protected] December 8, 1992 Abstract Numerous methods to evaluate user interfaces have been investigated. These methods vary greatly in the attention paid to the users’ tasks. Some methods require detailed task descriptions while others are task-independent. Unfortunately, collecting detailed task information can be difficult. On the other hand, task-independent methods cannot evaluate a design for the tasks users actually perform. The goal of this research is to develop a metric, which incorporates simple task descriptions, that can assist designers in organizing widgets in the user interface. Simple task descriptions provide some of the benefits, without the difficulties, of performing a detailed task analysis. The metric, Layout Appropriateness (LA), requires a description of the sequences of widget-level actions users perform and how frequently each sequence is used. This task description can either be from observations of an existing system or from a simplified task analysis. The appropriateness of a given layout is computed by weighting the cost of each sequence of actions by how frequently the sequence is performed. This emphasizes frequent methods of accomplishing tasks while incorporating less frequent methods in the design. Currently costs are based on the distance users must move the mouse. Other measures such as the number of eye fixations necessary to extract the relevant information or measure like the number of changes in direction may also prove useful, but must be validated before they are made available for use. In addition to providing an comparison of a proposed or existing layouts, an LA-optimal layout is presented to the designer. The designer can compare the LA-optimal and existing layouts or start with the LA-optimal layout and modify it to take additional factors into consideration. Software engineers who occasionally face interface design problems and user interface designers can benefit from the explicit focus on the users’ tasks that LA incorporates into automated user interface evaluation. Introduction Software engineers and interface designers often face the challenge of creating or redesigning an interface. Many methods to evaluate interfaces have been developed to aid in this process. Some methods, such as GOMS, require detailed task descriptions [3, 14]. While these methods can take many aspects of the interactions into consideration, detailed task descriptions can be difficult to obtain and small changes in the tasks may require extensive reanalysis. In addition, performing detailed task analyses can require training that may be both expensive and impractical [14]. Other methods, like the work of Tullis, require no task descriptions [29]. Task-independent methods can provide useful information, but cannot evaluate the appropriateness of an interface for the tasks users actually perform. 1
-
Upload
xavierchalandon4066 -
Category
Documents
-
view
225 -
download
3
Transcript of Sears - Layout
Layout Appropriateness: A metric for evaluating user interface widget layout
Andrew SearsHuman-Computer Interaction Laboratory &
Computer Science DepartmentUniversity of Maryland
College Park, MD [email protected]
December 8, 1992
AbstractNumerous methods to evaluate user interfaces have been investigated. These methods vary greatlyin the attention paid to the users’ tasks. Some methods require detailed task descriptions whileothers are task-independent. Unfortunately, collecting detailed task information can be difficult.On the other hand, task-independent methods cannot evaluate a design for the tasks users actuallyperform. The goal of this research is to develop a metric, which incorporates simple taskdescriptions, that can assist designers in organizing widgets in the user interface. Simple taskdescriptions provide some of the benefits, without the difficulties, of performing a detailed taskanalysis. The metric, Layout Appropriateness (LA), requires a description of the sequences ofwidget-level actions users perform and how frequently each sequence is used. This taskdescription can either be from observations of an existing system or from a simplified taskanalysis. The appropriateness of a given layout is computed by weighting the cost of eachsequence of actions by how frequently the sequence is performed. This emphasizes frequentmethods of accomplishing tasks while incorporating less frequent methods in the design.Currently costs are based on the distance users must move the mouse. Other measures such as thenumber of eye fixations necessary to extract the relevant information or measure like the number ofchanges in direction may also prove useful, but must be validated before they are made availablefor use. In addition to providing an comparison of a proposed or existing layouts, an LA-optimallayout is presented to the designer. The designer can compare the LA-optimal and existing layoutsor start with the LA-optimal layout and modify it to take additional factors into consideration.Software engineers who occasionally face interface design problems and user interface designerscan benefit from the explicit focus on the users’ tasks that LA incorporates into automated userinterface evaluation.
IntroductionSoftware engineers and interface designers often face the challenge of creating or redesigning aninterface. Many methods to evaluate interfaces have been developed to aid in this process. Somemethods, such as GOMS, require detailed task descriptions [3, 14]. While these methods can takemany aspects of the interactions into consideration, detailed task descriptions can be difficult toobtain and small changes in the tasks may require extensive reanalysis. In addition, performingdetailed task analyses can require training that may be both expensive and impractical [14]. Othermethods, like the work of Tullis, require no task descriptions [29]. Task-independent methods canprovide useful information, but cannot evaluate the appropriateness of an interface for the tasksusers actually perform.
1
If methods requiring detailed task descriptions are viewed as one end of a spectrum, task-independent methods could be the other end. The difficulties created by working with informationfrom either end of this spectrum provide motivation to develop techniques that can take advantageof simple task descriptions. Simple task descriptions provide some of the benefits, without thedifficulty, of performing a detailed task analysis.
This research focuses on developing methods that take advantage of simple task descriptions whendesigning or evaluating interfaces. This paper will present one method based on a metric, LayoutAppropriateness (LA), which can be used to evaluate the layout of widgets in an interface. Theprocess of computing LA generates a layout that is optimal with respect to the method used toassign costs. This LA-optimal layout can be compared to proposed layouts or it can be used as astarting point when designing a new interface.
Of course, if detailed task descriptions are available, all the available information should be usedwhen designing or evaluating an interface. In this situation, designers can extract task frequenciesfrom the detailed task description allowing LA to be calculated. LA can then be used to supplementthe detailed task information.
Related researchUser Interface Design and EvaluationTullis investigated predicting user performance for non-interactive alphanumeric displays [29]. Heexplored the relationship between several metrics including overall density of the screen, localdensity of the screen, grouping of objects, and layout complexity and time required for users toextract information from the display. He conducted several experiments and developed equationsthat could predict search times and preference ratings. However, without any description of theusers’ tasks, Tullis’ model cannot evaluate the appropriateness of an interface for the specific tasksusers actually perform. Tullis did provide recommended values for each metric to guide designers,but did not explore the benefits of task descriptions.
Perlman developed an Axiomatic Model of Information Presentation [22]. His model allowsdesigners to specify relationships between the information to be presented and rules for how toshow these relationships. A prototype system incorporated this model and provides feedbackabout potential problems with an interface design. However, there is no mechanism to directlycompare alternative layouts. The unique contribution of this model is that it “begins with theintentions of the designer” [22]. This is an advance over Tullis’ work which did not directlyincorporate either the designer’s intent or the users’ tasks. However, it stresses the intentions ofthe designer and not the users’ tasks. Although the designer’s intent may be to generate rules andrelationships that reflect the users’ tasks, no task description is explicitly incorporated into themodel. In addition, there is no method to indicate the relative importance of the variousrelationships.
GOMS is a method that requires a detailed task analysis. A GOMS analysis results in a set ofGoals, Operators, Methods, and Selection Rules which are used to describe the knowledge a usermust have to perform a task with a given system [3]. Performing the analysis in a reliable way andconstructing the necessary production rule models can make GOMS difficult to use [14]. Thehierarchical structure of a GOMS analysis provides a good framework for performing a taskanalysis. This hierarchical structure often limits the amount of reanalysis that is necessary whensmall changes are made to the task description. However, using GOMS effectively often requirestraining that can be both expensive and impractical. Much of the current GOMS research focuseson overcoming this limitation [14]. The difficulties with this, and the two previous methods,provide motivation to develop methods that can take advantage of simple task descriptions.
2
Lohse developed a model to predict the amount of time necessary to extract information from agraph [17]. This work focused on where users must look and the cognitive tasks required at eachstep. This model emphasizes the tasks users are performing, but there are major differencesbetween Lohse’s work and the current research. First, Lohse’s model deals with low levelcognitive tasks and the current research focuses on widget level tasks. Second, Lohse’s modelsimply predicts the amount of time necessary to answer a question. The current researchemphasizes determining an optimal layout and evaluating existing layouts, allowing designers togenerate improved interfaces.
Cognitive Walkthroughs are a relatively new technique in which the designer (or design team)specifies the tasks to be performed, the sequences of actions necessary to complete the tasks. Oncethese steps are completed they evaluate the ease of learning for the proposed interface [16].Initially, cognitive walkthroughs were developed for evaluating Walk-Up-and-Use systems andseveral applications of this technique have been reported with varying success [10, 16 and 31].The results indicate that cognitive walkthroughs have potential for evaluating user interfaces, butseveral important issues must be addressed before they will be practical. First, cognitivewalkthroughs appear to place too much of a demand on developers who must focus on manyaspects of design including usability. Second, this technique currently requires more time thanmanagement may be willing to allocate to usability test. Although problems exist, cognitivewalkthroughs appear promising as a technique for evaluating many aspects of the usability of anew or proposed interface.
Automatic Layout GenerationNumerous research systems have been developed to automatically or semi-automatically lay outuser interfaces [5, 15, 19, 28 and 32]. These systems have varied in many ways. Some systemsare based on the underlying structure of the information to be presented and others are based onsets of guidelines. Most of these systems allow designers to modify the automatically generatedlayouts. While these systems are useful, and often generate interfaces that appear well balanced,follow general guidelines, and group related information, they do not directly include informationconcerning the users’ tasks in the design process.
Casner and Larkin developed a system, which uses task descriptions to generate graphical displaysfor information extraction tasks [4]. This system automatically substitutes visual operators forlogical operators in an attempt to reduce the cognitive demands placed on users. This results innumerous displays being generated for each set of user tasks. Unfortunately, no analysis of thesedisplays is provided to the designer, leaving the designer many alternative displays and littleinformation about which displays may result in better performance.
Other DisciplinesFor over 20 years human factors specialists have used link analysis for redesigning displays,equipment, and rooms [13]. Link analysis depends on a description of the location of the objectsand the value of the links between objects. Link values may be the relative frequency of movingfrom one object to another, importance, or any other value of interest. The goal is to minimize thesum of the link values multiplied by the link lengths. This is similar to the current problem exceptthat formal methods for using link analysis have not been developed. Figures 1 and 2 present anexample of an office reorganized to shorten the distance traveled. Link labels indicate howfrequently workers must move from one location to another. Note, not all links are of minimallength, but the links with the highest frequencies were dramatically shortened.
3
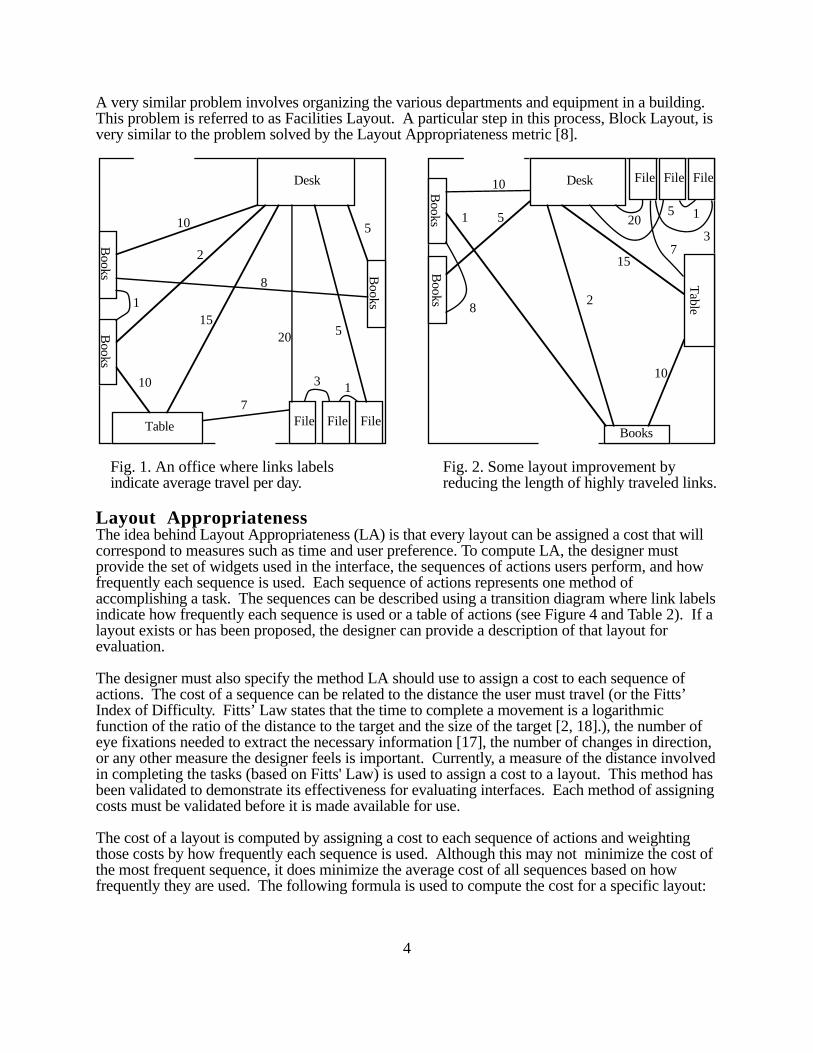
A very similar problem involves organizing the various departments and equipment in a building.This problem is referred to as Facilities Layout. A particular step in this process, Block Layout, isvery similar to the problem solved by the Layout Appropriateness metric [8].
Desk
Books
File File File
Books
Books
Table
510
2
115
10
8
20
3 1
5
7
Desk
Books
File File File
Books
Books
Table
10
5
2
15
5201
8
10
7
1
3
Fig. 1. An office where links labels Fig. 2. Some layout improvement by indicate average travel per day. reducing the length of highly traveled links.
Layout AppropriatenessThe idea behind Layout Appropriateness (LA) is that every layout can be assigned a cost that willcorrespond to measures such as time and user preference. To compute LA, the designer mustprovide the set of widgets used in the interface, the sequences of actions users perform, and howfrequently each sequence is used. Each sequence of actions represents one method ofaccomplishing a task. The sequences can be described using a transition diagram where link labelsindicate how frequently each sequence is used or a table of actions (see Figure 4 and Table 2). If alayout exists or has been proposed, the designer can provide a description of that layout forevaluation.
The designer must also specify the method LA should use to assign a cost to each sequence ofactions. The cost of a sequence can be related to the distance the user must travel (or the Fitts’Index of Difficulty. Fitts’ Law states that the time to complete a movement is a logarithmicfunction of the ratio of the distance to the target and the size of the target [2, 18].), the number ofeye fixations needed to extract the necessary information [17], the number of changes in direction,or any other measure the designer feels is important. Currently, a measure of the distance involvedin completing the tasks (based on Fitts' Law) is used to assign a cost to a layout. This method hasbeen validated to demonstrate its effectiveness for evaluating interfaces. Each method of assigningcosts must be validated before it is made available for use.
The cost of a layout is computed by assigning a cost to each sequence of actions and weightingthose costs by how frequently each sequence is used. Although this may not minimize the cost ofthe most frequent sequence, it does minimize the average cost of all sequences based on howfrequently they are used. The following formula is used to compute the cost for a specific layout:
4
cost =∑ [Frequency of the Transition * Cost of the Transition]
all transitions
The first step in computing LA is to find a layout that is optimal for the tasks users perform withrespect to the method used to assigning costs. The algorithm used to search for the LA-optimalsolution is presented later in this section. Next, the cost of a proposed layout is computed, and LAis used to compare the proposed and LA-optimal layouts. The following formula is used tocompute LA:
cost of the LA-optimal layoutLA = 100 * −
cost of the proposed layout
This formula results in LA = 100 for an LA-optimal layout, and as LA decreases the proposedlayout is less appropriate. This formula also results in LA being most sensitive to changes in thecost of “good” layouts.
Computing LA is most useful in two situations. First, if a layout does not already exist, LA cangenerate an initial layout that the designer can modify if necessary. Second, if several alternativelayouts have been created, the designer can use LA to compare them. The LA-optimal layout canalso be compared to a single designer generated layout. The most promising use of LA would bein conjunction with automatic layout programs that take other factors, such as, style guidelines andcommon conventions into account. LA could be used when generating the initial design. As thedesigner alters the layout, LA and other metrics could provide feedback concerning the expectedeffects on user performance. Since minimal semantic information is used when computing LA,designers must be allowed to make the final decision concerning which improvements to make.
Generating Task DescriptionsThe designer must generate task descriptions indicating the sequences of actions users perform andhow frequently each sequence is used. The task descriptions can be represented as transitiondiagrams that indicate how frequently users move between various widgets or by an equivalenttable of actions. The transition diagram reduces the task description to transitions betweenwidgets, while a table clearly indicates the sequences used to complete each task. The tabularrepresentation is easier to interpret and is more useful when analyzing the sensitivity of LA tochanges in the task description. Formal methods for describing the tasks may prove useful forverifying the accuracy and completeness of the task descriptions [27]. Reisner proposed a formalgrammar to describe the actions users perform [25]. Payne and Green expanded on this work byaddressing multiple levels of consistency and the completeness of the language [21]. A morerecently developed task description language, the User Action Notation (UAN), may also proveuseful for describing the users’ tasks [9]. Using the task descriptions, LA appropriatelyemphasizes each sequence of actions when computing the cost of a layout.
There are two methods for generating task descriptions. If an interface already exists, designerscan generate task descriptions by observing users working with the system. This can be doneeither by using software to automatically collect data, or manually by observing usersaccomplishing their tasks. Of course, if data is collected for an existing system, it can be biased bythe system being observed. For instance, if certain features are more difficult to access thanothers, users may not take advantage of these features. However, identifying biases created by thesystem can also be useful to the designer when redesigning the interface. Exploring the sensitivity
5
of LA to changes in the task description may help designers identify biases created by the currentdesign (see the section on the Sensitivity of LA to changes in the task description).
The second method is useful when an interface is being developed for the first time. When aninterface does not already exist, designers must identify all sequences of actions used toaccomplish the tasks. Once this is done, the designer assigns frequencies to each method based oneither expected or desired usage patterns. If a certain method is intended to be the primary methodfor accomplishing a task, the designer assigns it a high frequency. This will result in LAoptimizing the layout based on that method being used more frequently than others.
Designers should use a structured, systematic approach to specify the tasks. First, the designermust identify each task that is performed. Second, each method used to accomplish each task mustbe identified. Once the methods have been identified frequencies must be assigned. This can bedone in the same way that the tasks and methods were identified. First, how frequently is eachtask performed (what percentage of the time). Second, how frequently is each specific methodused. This is a general outline of the procedure used for the examples presented in this paper. Theinformation was gathered either by observing users, analyzing the tasks, interviews, or acombination of these approaches. The examples presented in this paper required 0.5-3 hours togather the necessary information. Like many other critical applications, the tasks were wellunderstood for the NASA example. As a result, approximately 30 minutes was required to gatherthe necessary information. Understanding how sensitive the LA metric is to changes in the taskdescription can help determine how accurate a task analysis must be. These times comparefavorably with other, more comprehensive, methods such as heuristic evaluations, cognitivewalkthroughs, and usability testing [10].
The level of detail required for a GOMS analysis may introduce difficulties, but the structuredhierarchical approach to a task analysis is a valuable tool [14]. A GOMS analysis involvesspecifying four types of information. First, the users Goals must be identified. This step is alsonecessary for an LA task analysis. Second, the Operators or actions that the user executes must beidentified. For GOMS this is typically a recursive process with the end result being a set ofexternal and mental operators. External operators are observable actions while mental operators arenon-observed hypothetical operators which are inferred by the analyst. LA, as described in thispaper, only requires external operators which correspond to selecting or using individual widgets.Third, the Methods which are used to accomplish each goal are identified. This involvesspecifying a sequence of operators that are executed. Since we only define a subset of the externaloperators, these are the only steps that must be specified. Finally, the Selection rules for decidingwhen each method used must be specified. This corresponds to specifying how frequently eachmethod is used. As you can see, a GOMS analysis and the analysis necessary for LA can followthe same basic procedure. One of the primary difficulties with performing a GOMS analysis isknowing when and how to use mental operators. Mental operators are non-observable,hypothetical, inferred actions. Removing mental operators and simplifying the external operatorsto the selection of widgets should make performing the task analysis more practical.
Fath and Bias also discuss a structured approach for performing a task analysis which is guided bya workbook [7]. Providing a written document for designers to follow may make the task analysiseasier to understand and perform. Understanding how sensitive LA is to changes in the taskdescription will provide a better understanding of how accurate the task description must be.Current investigations indicate that misallocating 5 - 10% of the tasks does not result in largechanges in LA. This issue is discussed in more detail in the section on the Sensitivity of LA tochanges in the task description.
6
It is critical that some form of task description be available when interfaces are being designed andevaluated. Although many methods for performing task analyses exist, additional research isnecessary to make these methods easier to use. These methods are not discussed here, but forfurther references see: [1, 6, 7, 11, 12, 14, 20 and 23].
Computing the LA-optimal LayoutThe method used to search for an LA-optimal solution requires unit sized objects be placed in arectangular grid. Larger objects are created using constraints as discussed in the section describingthe implementation of LA. When searching for an LA-optimal layout for an interface where thereare N possible locations and K widgets to place, the number of possible layouts is equal to thenumber of ways to choose K locations multiplied by the number of ways to organize the widgets inthose locations. Therefore, the following formula is used to compute the number of possiblelayouts:
N Number of possible layouts = ∗ Κ!
K
N Ν!where = −−−−−−−−−
K Κ! ∗ (Ν−Κ)!
As the formula indicates, the number of layouts increases rapidly as the number of locationsincreases. Evaluating all possible solutions quickly becomes impractical. Therefore, a branch andbound algorithm with several enhancements is used to find the LA-optimal solution.Enhancements were made as follows:
• under-estimates of the remaining cost reduced the number of nodes not on thesolution path that were expanded.
• the order to place widgets in the layout is computed. The order is determined in amanner similar to that used by Protsko et al. to arrange data flow diagrams [24]. Theobject with the highest link value connecting it to the start node is placed first. Thenthe object with the highest link value connecting it to a previously placed object or thestart node is placed. This continues until all widgets are placed. This results ingetting the actual cost for the most expensive parts of the layout first, allowing badlayouts to be identified faster. Constraining a widget to be in a fixed location forcesthat widget to be placed first. If two widgets are constrained to be next to each other,then as soon as one of them is placed, the second is placed.
• a ‘good’ layout is found using a heuristic. The cost of this layout is used as athreshold allowing any partial-solution with an estimated cost higher than thethreshold to be pruned. This heuristic places the widgets in the order determined bythe second enhancement. The widgets are placed as close to the starting point aspossible while maintaining any constraints which have been specified.
7
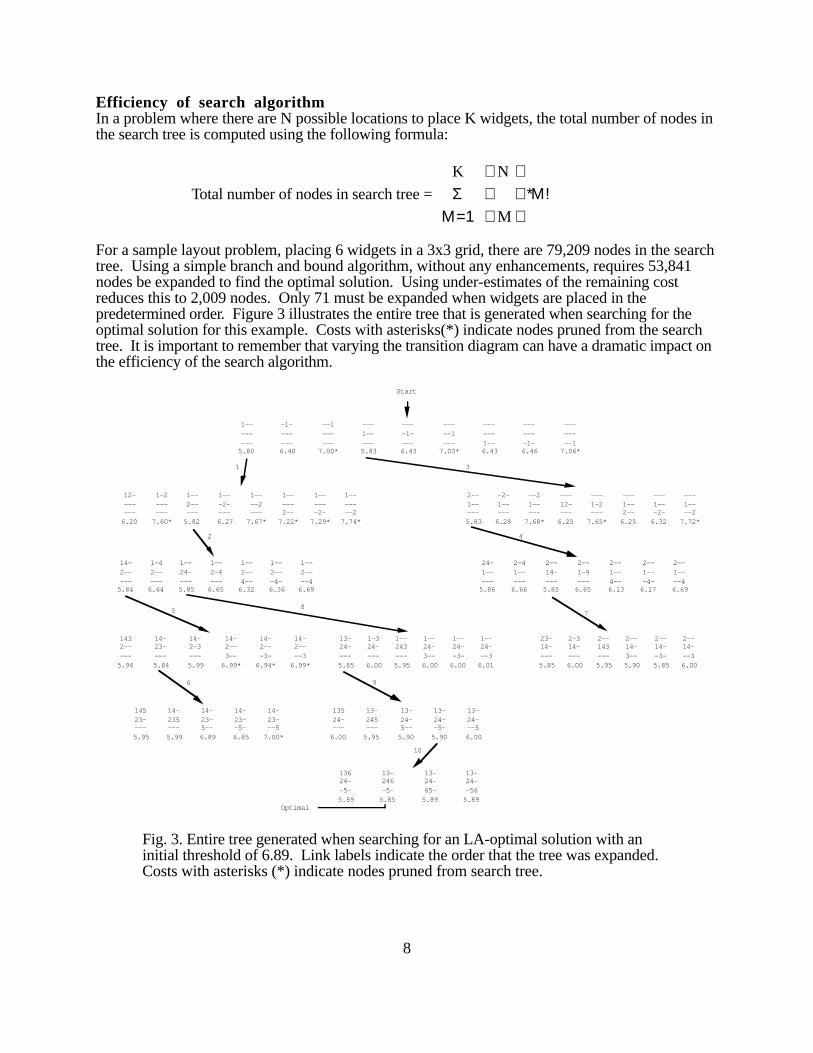
Efficiency of search algorithmIn a problem where there are N possible locations to place K widgets, the total number of nodes inthe search tree is computed using the following formula:
K N Total number of nodes in search tree = Σ ∗ Μ!
Μ=1 M
For a sample layout problem, placing 6 widgets in a 3x3 grid, there are 79,209 nodes in the searchtree. Using a simple branch and bound algorithm, without any enhancements, requires 53,841nodes be expanded to find the optimal solution. Using under-estimates of the remaining costreduces this to 2,009 nodes. Only 71 must be expanded when widgets are placed in thepredetermined order. Figure 3 illustrates the entire tree that is generated when searching for theoptimal solution for this example. Costs with asterisks(*) indicate nodes pruned from the searchtree. It is important to remember that varying the transition diagram can have a dramatic impact onthe efficiency of the search algorithm.
Start
------1--6.43
1--------5.80
-1-------6.40
--1------7.00*
---1-----5.83
----1----6.43
-----1---7.03*
-------1-6.46
--------17.06*
12-------6.20
1-2------7.60*
1--2-----5.82
1---2----6.27
1----2---7.67*
1-----2--7.22*
1------2-7.29*
1-------27.74*
14-2-----5.84
1-42-----6.64
1--24----5.85
1--2-4---6.65
1--2--4--6.32
1--2---4-6.36
1--2----46.69
2--1-----5.83
-2-1-----6.28
--21-----7.68*
---12----6.25
---1-2---7.65*
---1--2--6.25
---1---2-6.32
---1----27.72*
2-41-----6.66
2--14----5.85
2--1-4---6.65
2--1--4--6.13
2--1---4-6.17
2--1----46.69
24-1-----5.86
1432-----5.94
14-23----5.84
14-2-3---5.99
14-2--3--6.99*
14-2---3-6.94*
14-2----36.99*
14523----5.95
14-235---5.99
14-23-5--6.89
14-23--5-6.85
14-23---57.00*
23-14----5.85
2-314----6.00
2--143---5.95
2--14-3--5.90
2--14--3-5.85
2--14---36.00
13-24----5.85
1-324----6.00
1--243---5.95
1--24-3--6.00
1--24--3-6.00
1--24---36.01
13524----6.00
13-245---5.95
13-24-5--5.90
13-24--5-5.90
13-24---56.00
13624--5-5.89
13-246-5-5.85
13-24-65-5.89
13-24--565.89
1
2
3
4
5
6
78
9
10
Optimal
Fig. 3. Entire tree generated when searching for an LA-optimal solution with aninitial threshold of 6.89. Link labels indicate the order that the tree was expanded.Costs with asterisks (*) indicate nodes pruned from search tree.
8
Widgets Constraints Grid # Layouts # Possible Nodes # Expanded CPU (sec)3 0 3x3 5.0x10² 5.9x10² 24 < .05
6 0 4x4 5.8x10⁶ 6.3x10⁶ 526 .10
7 0 4x4 5.8x10⁶ 6.3x10⁶ 989 .20
8 0 4x4 5.2x10⁸ 5.8x10⁸ 916 .30
10 0 5x5 1.2x10¹³ 1.3x10¹³ 2377 1.00
17 13 7x5 1.6x1024 1.7x1024 14734 3.30
19 15 7x6 5.4x1028 5.7x1028 8443 1.40
20 16 7x5 7.9x1027 8.4x1027 24155 5.90
*28 23 7x6 1.6x1040 1.7x1040 33053 4.60
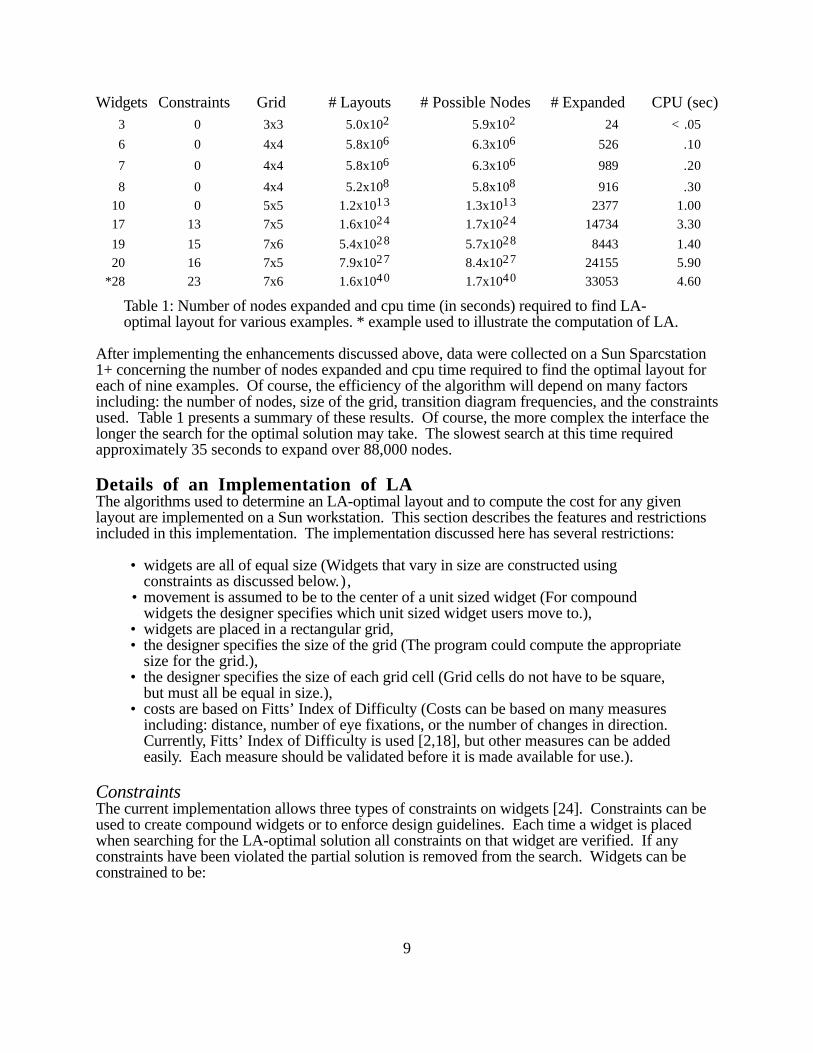
Table 1: Number of nodes expanded and cpu time (in seconds) required to find LA-optimal layout for various examples. * example used to illustrate the computation of LA.
After implementing the enhancements discussed above, data were collected on a Sun Sparcstation1+ concerning the number of nodes expanded and cpu time required to find the optimal layout foreach of nine examples. Of course, the efficiency of the algorithm will depend on many factorsincluding: the number of nodes, size of the grid, transition diagram frequencies, and the constraintsused. Table 1 presents a summary of these results. Of course, the more complex the interface thelonger the search for the optimal solution may take. The slowest search at this time requiredapproximately 35 seconds to expand over 88,000 nodes.
Details of an Implementation of LAThe algorithms used to determine an LA-optimal layout and to compute the cost for any givenlayout are implemented on a Sun workstation. This section describes the features and restrictionsincluded in this implementation. The implementation discussed here has several restrictions:
• widgets are all of equal size (Widgets that vary in size are constructed usingconstraints as discussed below.),
• movement is assumed to be to the center of a unit sized widget (For compoundwidgets the designer specifies which unit sized widget users move to.),
• widgets are placed in a rectangular grid,• the designer specifies the size of the grid (The program could compute the appropriate
size for the grid.),• the designer specifies the size of each grid cell (Grid cells do not have to be square,
but must all be equal in size.),• costs are based on Fitts’ Index of Difficulty (Costs can be based on many measures
including: distance, number of eye fixations, or the number of changes in direction.Currently, Fitts’ Index of Difficulty is used [2,18], but other measures can be addedeasily. Each measure should be validated before it is made available for use.).
ConstraintsThe current implementation allows three types of constraints on widgets [24]. Constraints can beused to create compound widgets or to enforce design guidelines. Each time a widget is placedwhen searching for the LA-optimal solution all constraints on that widget are verified. If anyconstraints have been violated the partial solution is removed from the search. Widgets can beconstrained to be:
9
• in a fixed location (The designer can force the Cancel button to be in the lower leftcorner of the screen.),
• directly to the right of another object (The designer can create larger compoundwidgets by combining unit sized widgets. The designer can force two widgets, suchas the Drive and Eject buttons, to be next to each other.),
• directly below another object (These constraints are used in the same was as thesecond type of constraint.).
An ExampleThe following example is based on the dialog box used to open a file in the text editor Writerunning under Microsoft Windows. This example illustrates how LA is computed and how thedesigner can use the LA-optimal layout either as an initial layout when organizing a new interface,or to evaluate an existing layout. To compute LA, the designer must provide the sequences ofactions users perform and a description of how frequently each sequence is used. For this examplethe following assumptions are made:
• users start with the mouse at the upper left corner of the dialog box (This dialog boxis called up by selecting an item from a pull-down menu. The start locationcorresponds to where the cursor was prior to the dialog box being called up.),
• grid cells are two units high and three units wide (width = 1.5*height),• the cost of a transition is proportional to Fitts’ Index of Difficulty,• the size of a target the user moves the mouse to is assumed to be the size of a single
grid square.
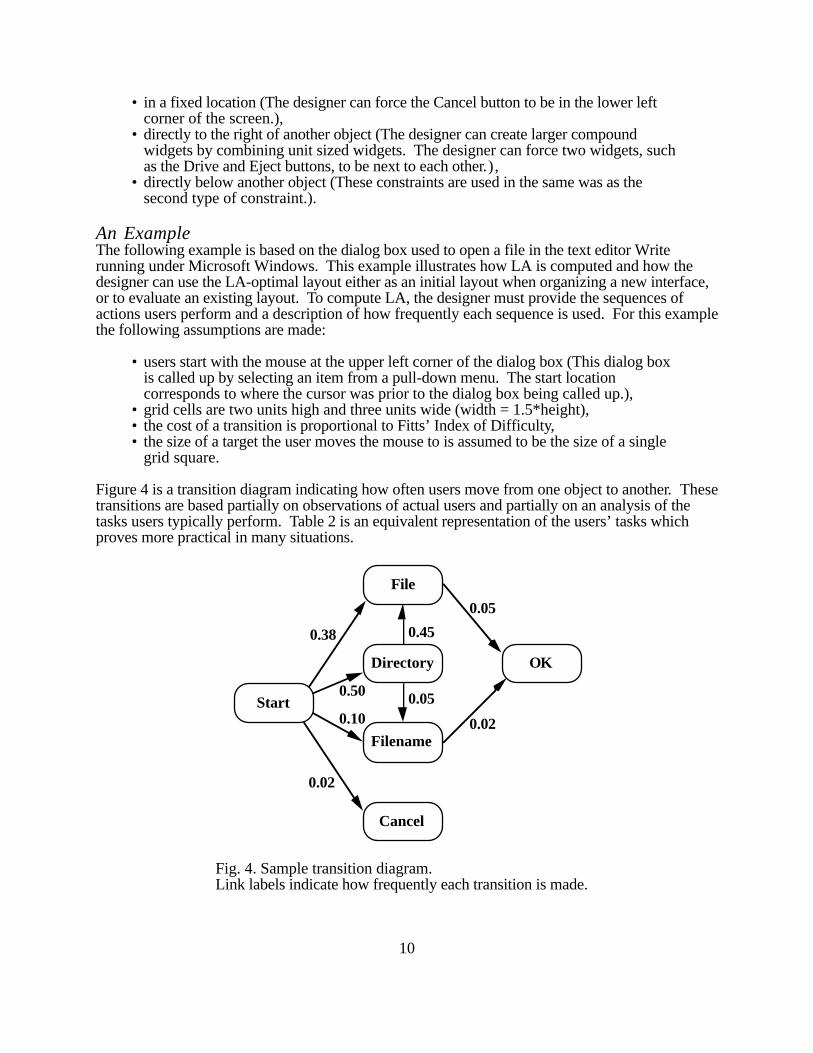
Figure 4 is a transition diagram indicating how often users move from one object to another. Thesetransitions are based partially on observations of actual users and partially on an analysis of thetasks users typically perform. Table 2 is an equivalent representation of the users’ tasks whichproves more practical in many situations.
Start
OK
File
Filename
Cancel
Directory
0.50
0.02
0.10
0.38 0.45
0.05
0.02
0.05
Fig. 4. Sample transition diagram. Link labels indicate how frequently each transition is made.
10
Task Frequency Objects used1 5 Directory Filename2 33 File3 2 Cancel4 2 Filename Ok5 8 Filename6 5 File Ok7 45 Directory File
Table 2. An equivalent tabular representation of the sequences ofactions and how frequently each sequence is performed.
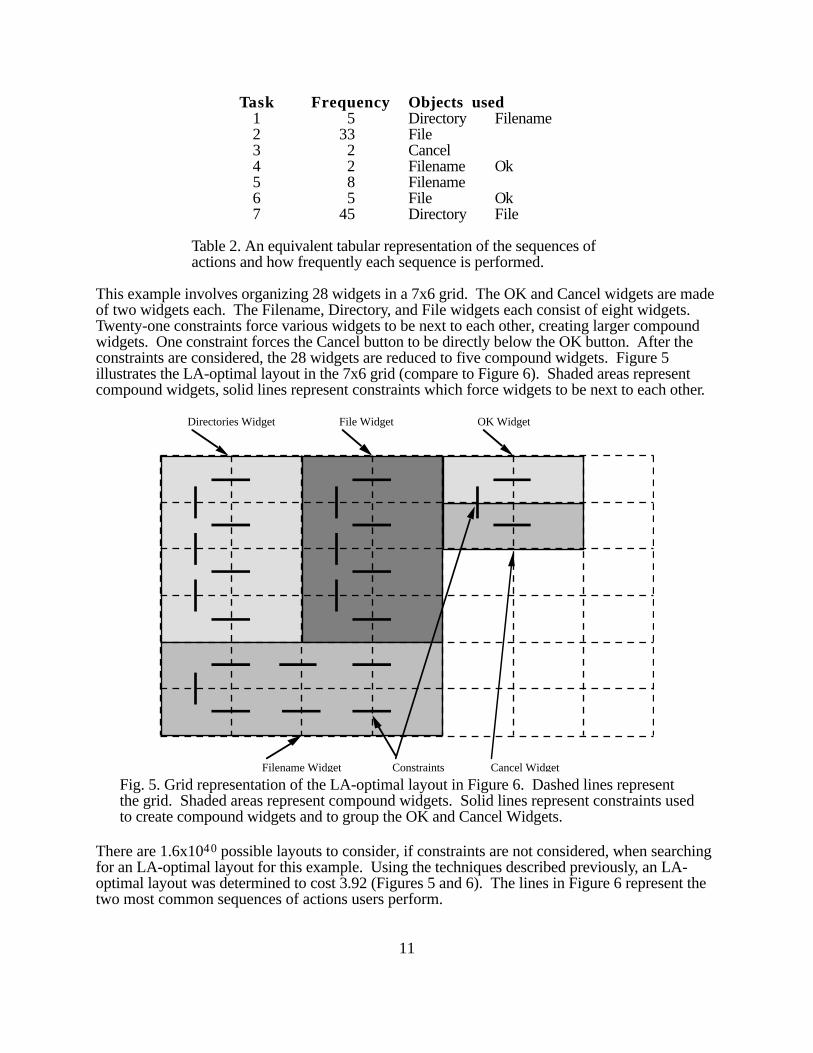
This example involves organizing 28 widgets in a 7x6 grid. The OK and Cancel widgets are madeof two widgets each. The Filename, Directory, and File widgets each consist of eight widgets.Twenty-one constraints force various widgets to be next to each other, creating larger compoundwidgets. One constraint forces the Cancel button to be directly below the OK button. After theconstraints are considered, the 28 widgets are reduced to five compound widgets. Figure 5illustrates the LA-optimal layout in the 7x6 grid (compare to Figure 6). Shaded areas representcompound widgets, solid lines represent constraints which force widgets to be next to each other.
Filename Widget
Directories Widget File Widget OK Widget
Cancel WidgetConstraints
Fig. 5. Grid representation of the LA-optimal layout in Figure 6. Dashed lines representthe grid. Shaded areas represent compound widgets. Solid lines represent constraints usedto create compound widgets and to group the OK and Cancel Widgets.
There are 1.6x1040 possible layouts to consider, if constraints are not considered, when searchingfor an LA-optimal layout for this example. Using the techniques described previously, an LA-optimal layout was determined to cost 3.92 (Figures 5 and 6). The lines in Figure 6 represent thetwo most common sequences of actions users perform.
11
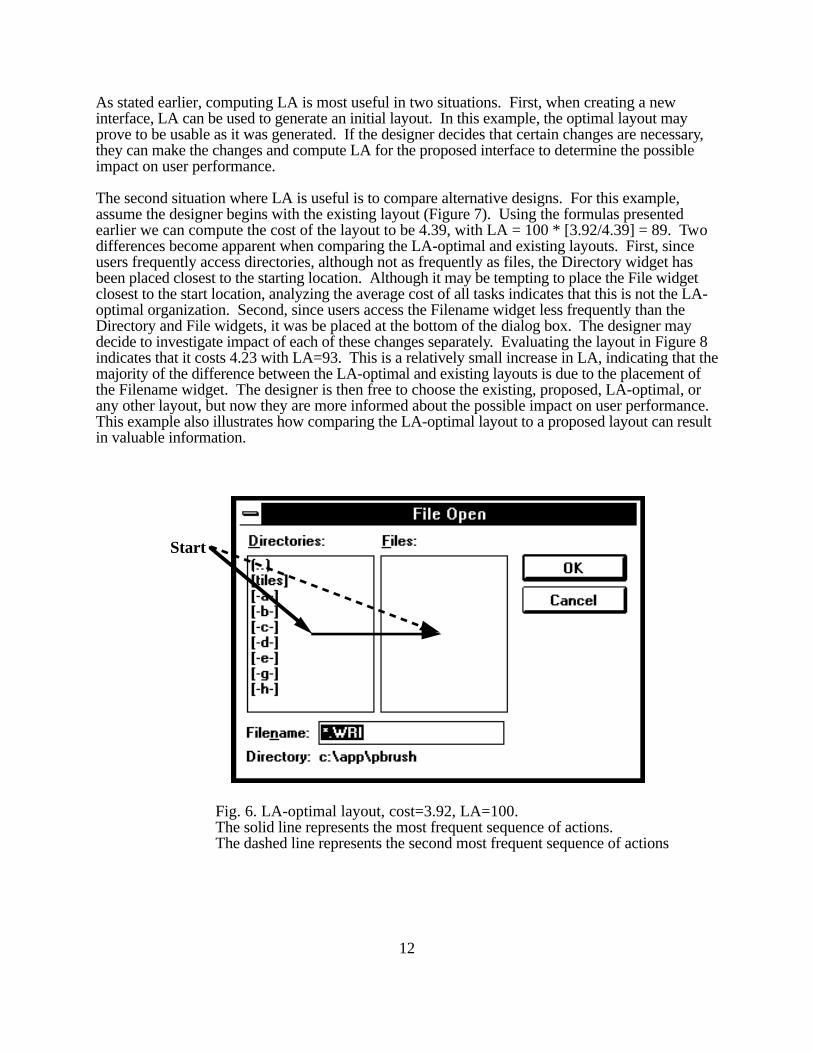
As stated earlier, computing LA is most useful in two situations. First, when creating a newinterface, LA can be used to generate an initial layout. In this example, the optimal layout mayprove to be usable as it was generated. If the designer decides that certain changes are necessary,they can make the changes and compute LA for the proposed interface to determine the possibleimpact on user performance.
The second situation where LA is useful is to compare alternative designs. For this example,assume the designer begins with the existing layout (Figure 7). Using the formulas presentedearlier we can compute the cost of the layout to be 4.39, with LA = 100 * [3.92/4.39] = 89. Twodifferences become apparent when comparing the LA-optimal and existing layouts. First, sinceusers frequently access directories, although not as frequently as files, the Directory widget hasbeen placed closest to the starting location. Although it may be tempting to place the File widgetclosest to the start location, analyzing the average cost of all tasks indicates that this is not the LA-optimal organization. Second, since users access the Filename widget less frequently than theDirectory and File widgets, it was be placed at the bottom of the dialog box. The designer maydecide to investigate impact of each of these changes separately. Evaluating the layout in Figure 8indicates that it costs 4.23 with LA=93. This is a relatively small increase in LA, indicating that themajority of the difference between the LA-optimal and existing layouts is due to the placement ofthe Filename widget. The designer is then free to choose the existing, proposed, LA-optimal, orany other layout, but now they are more informed about the possible impact on user performance.This example also illustrates how comparing the LA-optimal layout to a proposed layout can resultin valuable information.
Start
Fig. 6. LA-optimal layout, cost=3.92, LA=100. The solid line represents the most frequent sequence of actions.The dashed line represents the second most frequent sequence of actions
12
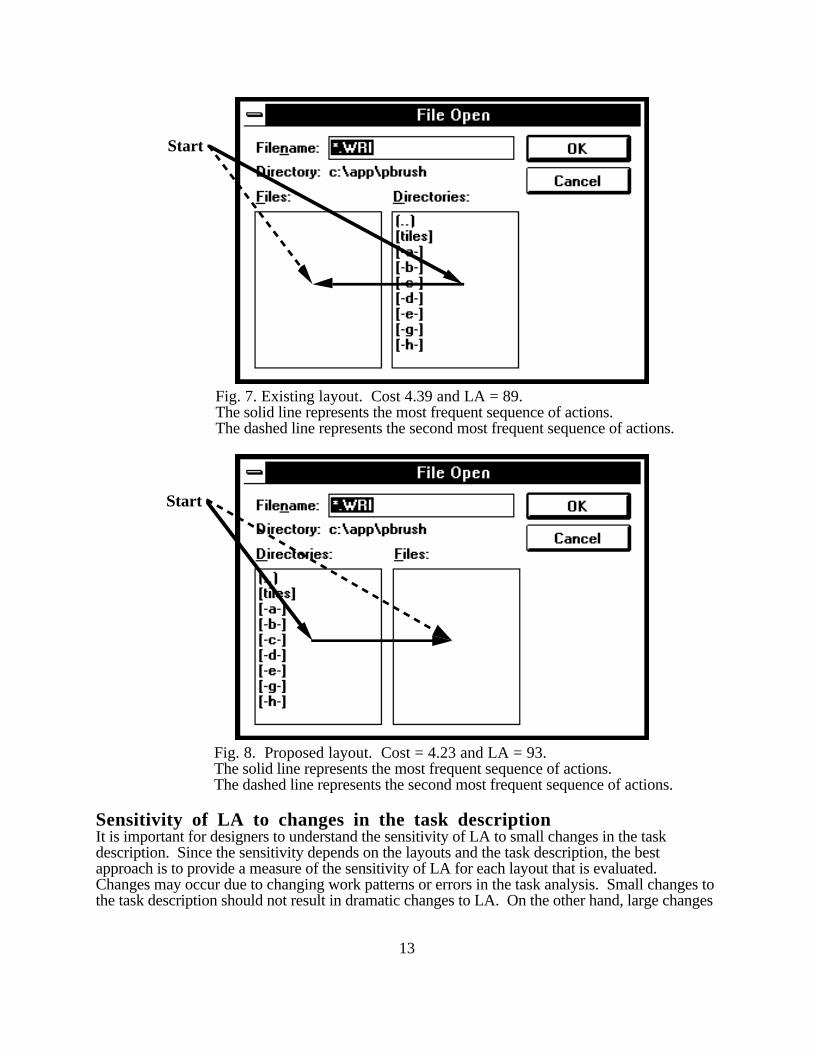
Start
Fig. 7. Existing layout. Cost 4.39 and LA = 89.The solid line represents the most frequent sequence of actions.The dashed line represents the second most frequent sequence of actions.
Start
Fig. 8. Proposed layout. Cost = 4.23 and LA = 93.The solid line represents the most frequent sequence of actions.The dashed line represents the second most frequent sequence of actions.
Sensitivity of LA to changes in the task descriptionIt is important for designers to understand the sensitivity of LA to small changes in the taskdescription. Since the sensitivity depends on the layouts and the task description, the bestapproach is to provide a measure of the sensitivity of LA for each layout that is evaluated.Changes may occur due to changing work patterns or errors in the task analysis. Small changes tothe task description should not result in dramatic changes to LA. On the other hand, large changes
13
in the task description may result in larger changes in LA (although not necessarily). Altering thetask description changes the cost of the proposed and original LA-optimal layouts. In addition, theLA-optimal layout may change.
The cost of a layout changes in a regular and predictable way. As less expensive tasks becomemore frequent the overall cost of a layout decreases. How fast the cost decreases depends on thedifference in cost between the task being discontinued and the task being started. Since changes inthe cost of a layout will be smooth and continuous, changes in LA for a layout will also be smoothand continuous. For a given set of layouts the sensitivity of LA to changes in the task descriptioncan be explored. What cannot be determined without recomputing the optimal layout is when adifferent layout, which has not been explored, will become optimal. My investigations exploredthe effects of doubling the number of occurrences of a particular task or eliminating a task entirely.These changes resulted in a new layout becoming optimal approximately 10% of the time. When anew layout did become optimal, the original optimal layout had an average LA of 97 indicating thatchanges in the LA value of other layouts should also be relatively small.
Assuming the original LA-optimal layout will remain optimal allows more detailed exploration intothe effects of changing the task description. Restricting changes in the task description todecreasing the frequency of one task and increasing the frequency of another task allows precisecalculations of how LA will change.
Given: • CL,1 is the cost of completing task 1 on interface L,• CL is the cost of completing all tasks weighted appropriately using interface L,• ∆ CLayout = CL2 - CL1.
We can derive the following formula which approximates ∆ LA with a known error for each pair oftasks:
∆ LA = 100*[COpt/CProp]*[(C Opt2/COpt - CProp2/CProp) - (COpt1/COpt - CProp1/CProp)]
Percent error = {1 - [CProp/(CProp+ CProp2- CProp1)]}
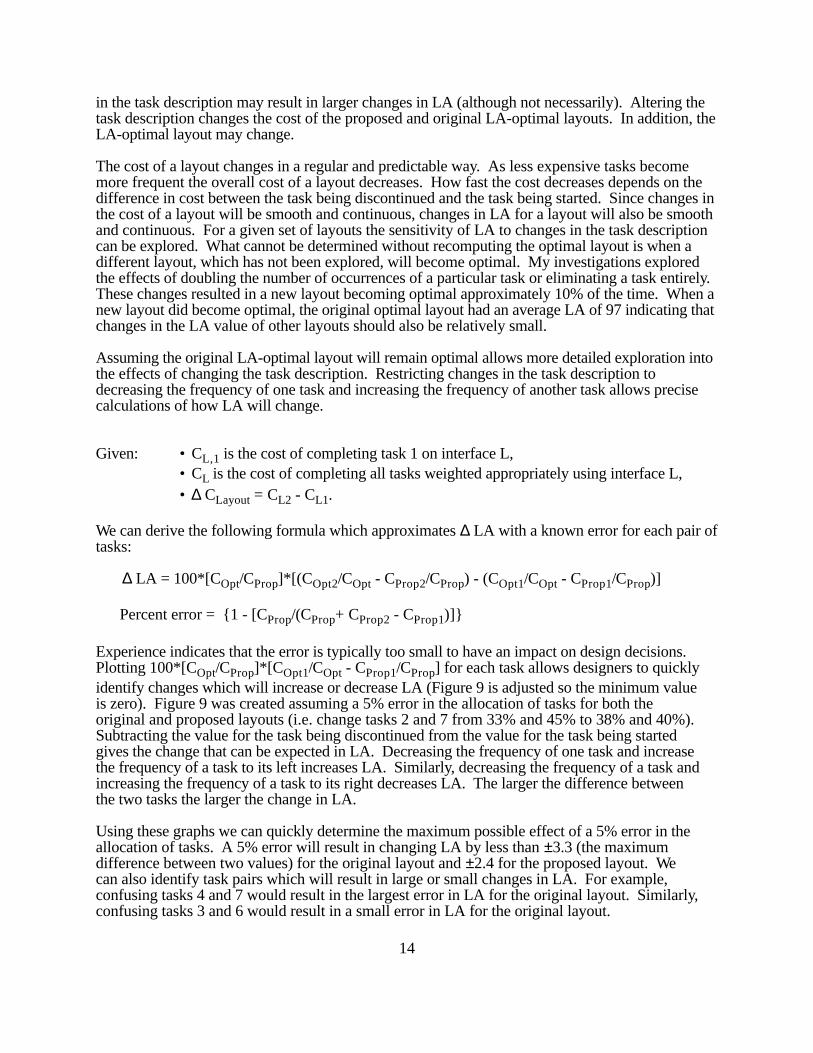
Experience indicates that the error is typically too small to have an impact on design decisions.Plotting 100*[COpt/CProp]*[C Opt1/COpt - CProp1/CProp] for each task allows designers to quicklyidentify changes which will increase or decrease LA (Figure 9 is adjusted so the minimum valueis zero). Figure 9 was created assuming a 5% error in the allocation of tasks for both theoriginal and proposed layouts (i.e. change tasks 2 and 7 from 33% and 45% to 38% and 40%).Subtracting the value for the task being discontinued from the value for the task being startedgives the change that can be expected in LA. Decreasing the frequency of one task and increasethe frequency of a task to its left increases LA. Similarly, decreasing the frequency of a task andincreasing the frequency of a task to its right decreases LA. The larger the difference betweenthe two tasks the larger the change in LA.
Using these graphs we can quickly determine the maximum possible effect of a 5% error in theallocation of tasks. A 5% error will result in changing LA by less than ±3.3 (the maximumdifference between two values) for the original layout and ±2.4 for the proposed layout. Wecan also identify task pairs which will result in large or small changes in LA. For example,confusing tasks 4 and 7 would result in the largest error in LA for the original layout. Similarly,confusing tasks 3 and 6 would result in a small error in LA for the original layout.
14
Task Number(Task Frequency)
∆LA
0.0
0.5
1.0
1.5
2.0
2.5
3.0
3.5
4 2 5 3 6 1 7
Increase LA Decrease LA
Task Number(Task Frequency)
∆LA
0.0
0.5
1.0
1.5
2.0
2.5
3.0
3.5
4 5 1 3 2 6 7
Increase LA Decrease LA
(5)(5) (33)(33) (2)(2) (2)(2) (8) (8) (5) (5)(45) (45)
Original Layout Proposed Layout
Fig. 9. Sensitivity graph for the original and proposed layouts for the Write dialog box.
The designer can also investigate the effect of errors they feel are likely in the task description.For instance, what if the designer were unsure of the frequencies for tasks 2 and 5 (selecting thefile vs. typing a filename)? For the original layout changing between tasks 2 and 5 would haveno change on LA. For the proposed interface, increasing the frequency of task 5 wouldincrease LA, while increasing the frequency of task 2 would decrease LA.Designers may also be able to identify user biases using the sensitivity graph. If two methodsexist for accomplishing a task we would expect users to choose the easier method morefrequently (the method which would increase LA for the interface). Comparing how frequentlyvarious methods are used and the relative position of the two methods in the sensitivity graphscan aid the designer in identifying methods which appear more difficult to users. Improving thelayout for methods that are used frequently, but have small values in the sensitivity graph, willoften result in an overall increase in LA.
Validating LA using distanceAn experiment was conducted to evaluated the effectiveness of using LA to evaluate interfaces[26]. The cost of an interface was based on distance as described above. Subjects used threealternative layouts for two interfaces to simulate actual tasks. Task completion times and userpreferences were measured.
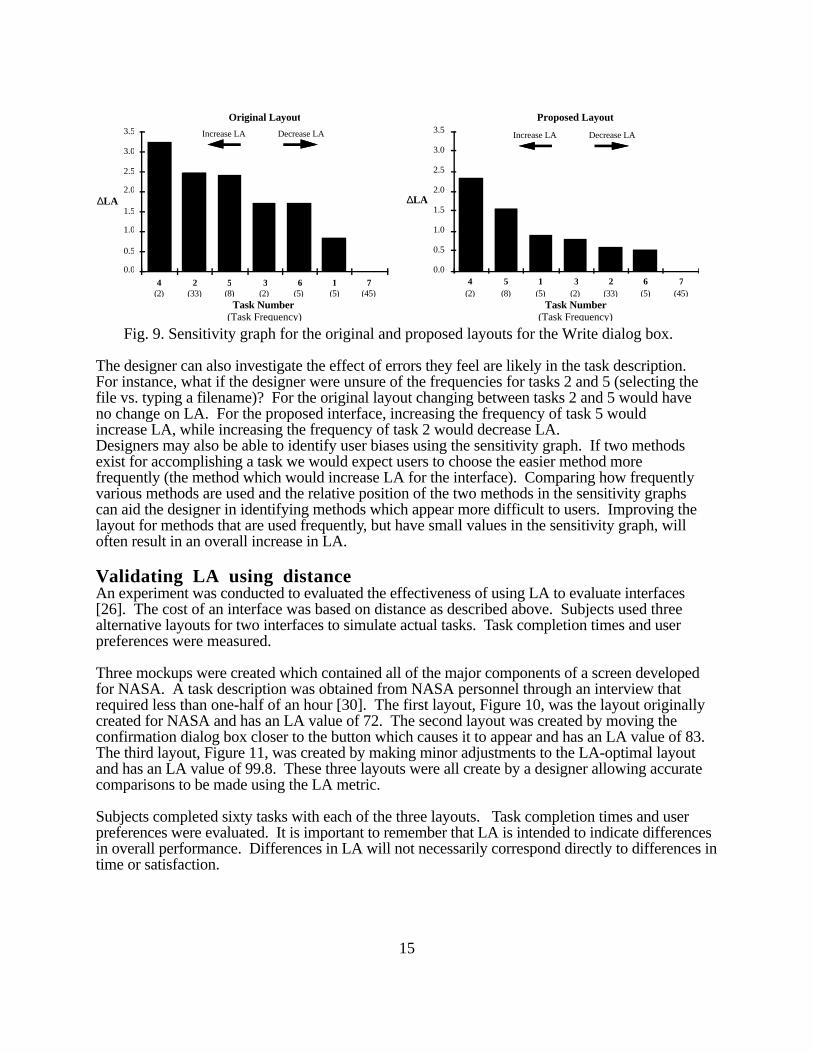
Three mockups were created which contained all of the major components of a screen developedfor NASA. A task description was obtained from NASA personnel through an interview thatrequired less than one-half of an hour [30]. The first layout, Figure 10, was the layout originallycreated for NASA and has an LA value of 72. The second layout was created by moving theconfirmation dialog box closer to the button which causes it to appear and has an LA value of 83.The third layout, Figure 11, was created by making minor adjustments to the LA-optimal layoutand has an LA value of 99.8. These three layouts were all create by a designer allowing accuratecomparisons to be made using the LA metric.
Subjects completed sixty tasks with each of the three layouts. Task completion times and userpreferences were evaluated. It is important to remember that LA is intended to indicate differencesin overall performance. Differences in LA will not necessarily correspond directly to differences intime or satisfaction.
15
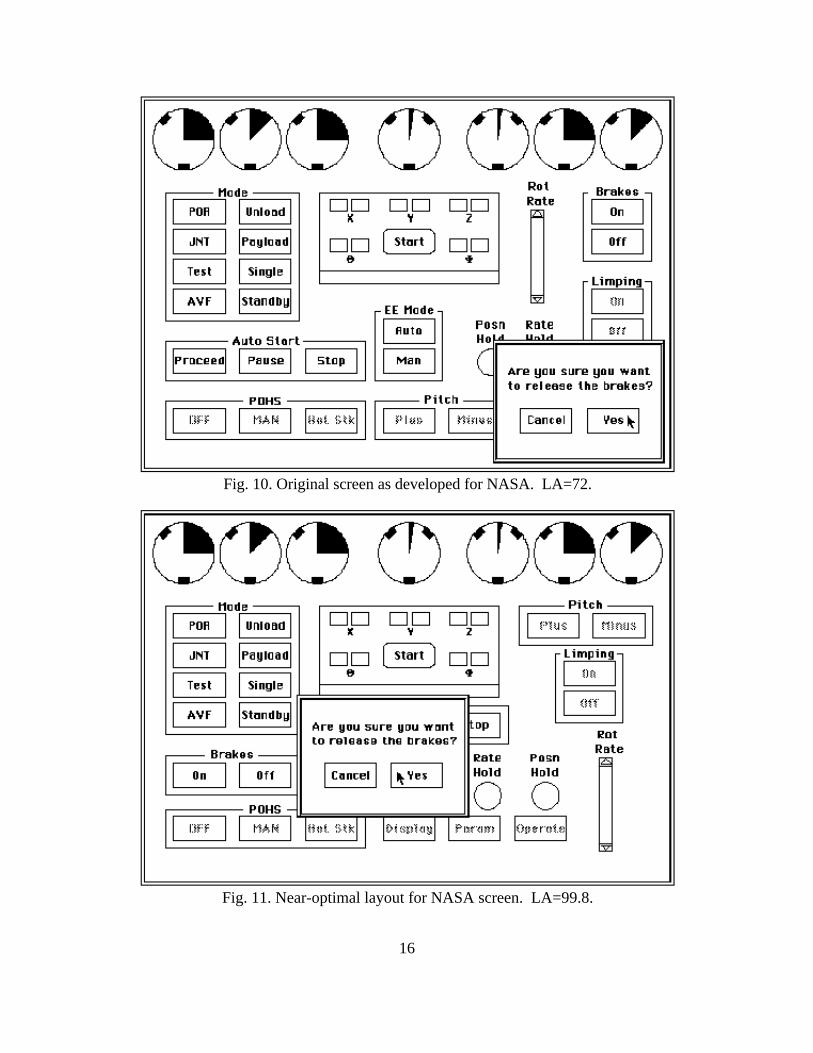
Fig. 10. Original screen as developed for NASA. LA=72.
Fig. 11. Near-optimal layout for NASA screen. LA=99.8.
16
3
2
1Orig N-optProp
1 = Best3 = Worst
Time(Sec)
1.75
2.00
N-optPropOrig
2.25
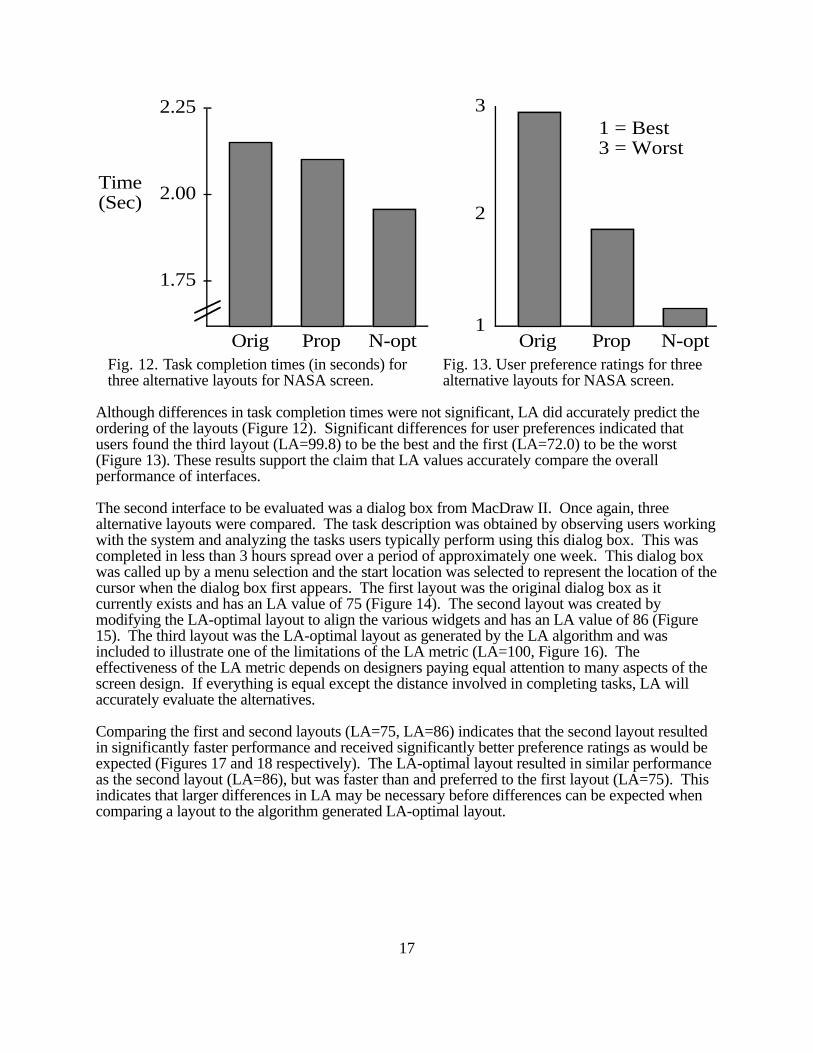
Fig. 12. Task completion times (in seconds) for Fig. 13. User preference ratings for threethree alternative layouts for NASA screen. alternative layouts for NASA screen.
Although differences in task completion times were not significant, LA did accurately predict theordering of the layouts (Figure 12). Significant differences for user preferences indicated thatusers found the third layout (LA=99.8) to be the best and the first (LA=72.0) to be the worst(Figure 13). These results support the claim that LA values accurately compare the overallperformance of interfaces.
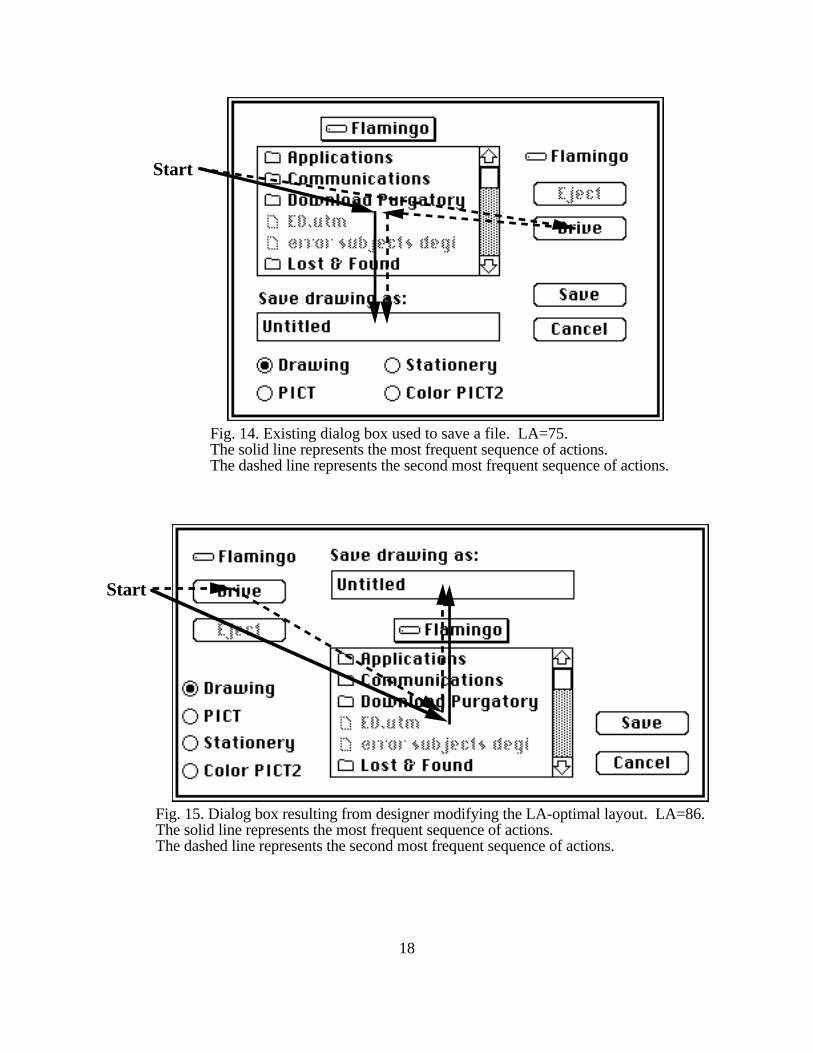
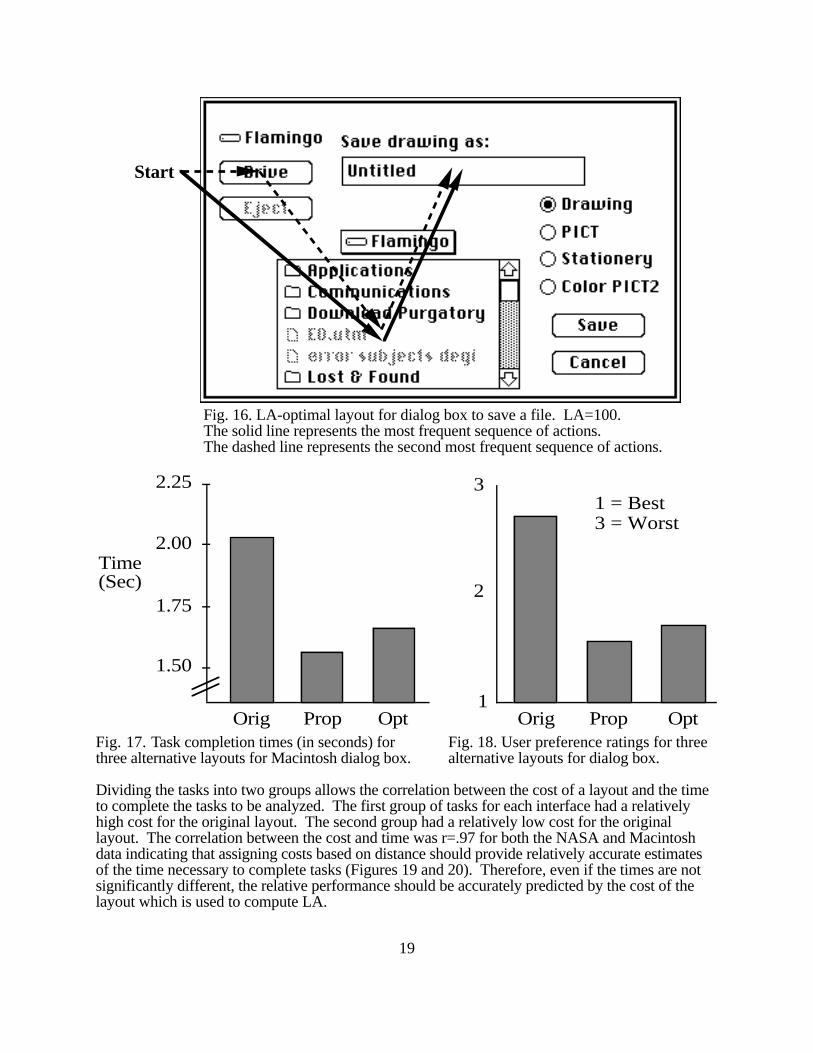
The second interface to be evaluated was a dialog box from MacDraw II. Once again, threealternative layouts were compared. The task description was obtained by observing users workingwith the system and analyzing the tasks users typically perform using this dialog box. This wascompleted in less than 3 hours spread over a period of approximately one week. This dialog boxwas called up by a menu selection and the start location was selected to represent the location of thecursor when the dialog box first appears. The first layout was the original dialog box as itcurrently exists and has an LA value of 75 (Figure 14). The second layout was created bymodifying the LA-optimal layout to align the various widgets and has an LA value of 86 (Figure15). The third layout was the LA-optimal layout as generated by the LA algorithm and wasincluded to illustrate one of the limitations of the LA metric (LA=100, Figure 16). Theeffectiveness of the LA metric depends on designers paying equal attention to many aspects of thescreen design. If everything is equal except the distance involved in completing tasks, LA willaccurately evaluate the alternatives.
Comparing the first and second layouts (LA=75, LA=86) indicates that the second layout resultedin significantly faster performance and received significantly better preference ratings as would beexpected (Figures 17 and 18 respectively). The LA-optimal layout resulted in similar performanceas the second layout (LA=86), but was faster than and preferred to the first layout (LA=75). Thisindicates that larger differences in LA may be necessary before differences can be expected whencomparing a layout to the algorithm generated LA-optimal layout.
17
Start
Fig. 14. Existing dialog box used to save a file. LA=75.The solid line represents the most frequent sequence of actions.The dashed line represents the second most frequent sequence of actions.
Start
Fig. 15. Dialog box resulting from designer modifying the LA-optimal layout. LA=86.The solid line represents the most frequent sequence of actions.The dashed line represents the second most frequent sequence of actions.
18
Start
Fig. 16. LA-optimal layout for dialog box to save a file. LA=100.The solid line represents the most frequent sequence of actions.The dashed line represents the second most frequent sequence of actions.
OptPropOrig1
3
2
1 = Best3 = Worst
OptProp
Time(Sec)
1.50
1.75
2.00
2.25
OrigFig. 17. Task completion times (in seconds) for Fig. 18. User preference ratings for threethree alternative layouts for Macintosh dialog box. alternative layouts for dialog box.
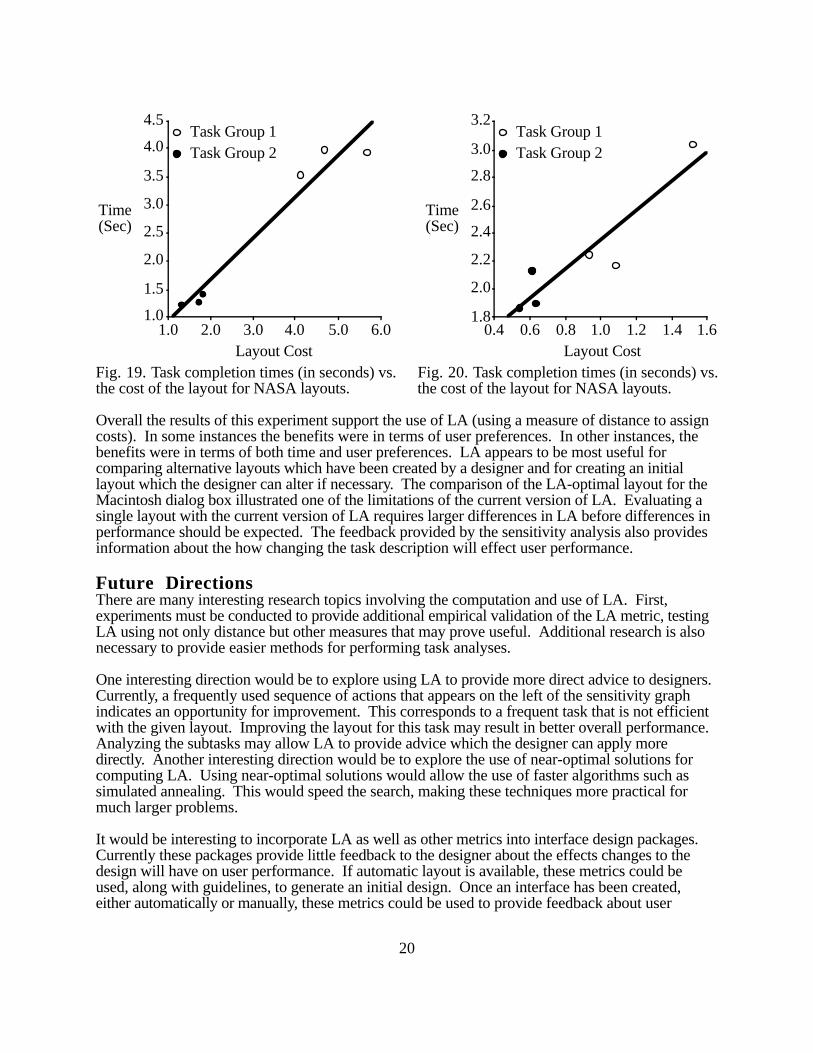
Dividing the tasks into two groups allows the correlation between the cost of a layout and the timeto complete the tasks to be analyzed. The first group of tasks for each interface had a relativelyhigh cost for the original layout. The second group had a relatively low cost for the originallayout. The correlation between the cost and time was r=.97 for both the NASA and Macintoshdata indicating that assigning costs based on distance should provide relatively accurate estimatesof the time necessary to complete tasks (Figures 19 and 20). Therefore, even if the times are notsignificantly different, the relative performance should be accurately predicted by the cost of thelayout which is used to compute LA.
19
Layout Cost
1.8
2.0
2.2
2.4
2.6
2.8
3.0
3.2
0.4 0.6 0.8 1.0 1.2 1.4 1.6
Time(Sec)
Task Group 1Task Group 2
Layout Cost
1.0
1.5
2.0
2.5
3.0
3.5
4.0
4.5
1.0 2.0 3.0 4.0 5.0 6.0
Time(Sec)
Task Group 1Task Group 2
Fig. 19. Task completion times (in seconds) vs.Fig. 20. Task completion times (in seconds) vs.the cost of the layout for NASA layouts. the cost of the layout for NASA layouts.
Overall the results of this experiment support the use of LA (using a measure of distance to assigncosts). In some instances the benefits were in terms of user preferences. In other instances, thebenefits were in terms of both time and user preferences. LA appears to be most useful forcomparing alternative layouts which have been created by a designer and for creating an initiallayout which the designer can alter if necessary. The comparison of the LA-optimal layout for theMacintosh dialog box illustrated one of the limitations of the current version of LA. Evaluating asingle layout with the current version of LA requires larger differences in LA before differences inperformance should be expected. The feedback provided by the sensitivity analysis also providesinformation about the how changing the task description will effect user performance.
Future DirectionsThere are many interesting research topics involving the computation and use of LA. First,experiments must be conducted to provide additional empirical validation of the LA metric, testingLA using not only distance but other measures that may prove useful. Additional research is alsonecessary to provide easier methods for performing task analyses.
One interesting direction would be to explore using LA to provide more direct advice to designers.Currently, a frequently used sequence of actions that appears on the left of the sensitivity graphindicates an opportunity for improvement. This corresponds to a frequent task that is not efficientwith the given layout. Improving the layout for this task may result in better overall performance.Analyzing the subtasks may allow LA to provide advice which the designer can apply moredirectly. Another interesting direction would be to explore the use of near-optimal solutions forcomputing LA. Using near-optimal solutions would allow the use of faster algorithms such assimulated annealing. This would speed the search, making these techniques more practical formuch larger problems.
It would be interesting to incorporate LA as well as other metrics into interface design packages.Currently these packages provide little feedback to the designer about the effects changes to thedesign will have on user performance. If automatic layout is available, these metrics could beused, along with guidelines, to generate an initial design. Once an interface has been created,either automatically or manually, these metrics could be used to provide feedback about user
20
performance. It would also be interesting to explore the use of LA in other disciplines, such as,Facilities Layout [8] and applications which currently use Link Analysis [13].
ConclusionsInterface designers monitor many aspects of an interface design as it is being created. LA canautomatically monitor various measures, such as distance, reducing the demands on designers,allowing them to concentrate on other aspects of the design. The computation of LA takesadvantage of simple task frequency descriptions to determine an LA-optimal layout. Ideally, adetailed task analysis would be available and all the available information, including LA, would beconsidered when evaluating or designing an interface. However, performing a detailed taskanalysis may be difficult or expensive. In these cases, designers can perform a simplified versionof the task analysis to collect the action sequences and frequency information necessary to computeLA. If an interface already exists, designers can collect data for actual usage. Given a simple taskdescription and the set of widgets to organize, an LA-optimal layout can be computed. Byweighting each method of accomplishing a task (sequence of actions) by how frequently it is used,LA emphasizes frequent methods while incorporating less frequent methods into the layout.Designers can compare existing or proposed layouts both visually and using the LA metric todetermine if any changes should be made. Since all important criteria cannot be included ininterface generation algorithms, designers mustbe given the freedom to make the final decisionsconcerning interface layout and design.
Computing LA is most useful in two situations. First, if a new interface is being designed, LA cangenerate an initial layout that the designer can modify if necessary. Second, if several alternativelayouts exist, the designer can use LA to compare them. The LA-optimal layout can also becompared to a single designer generated layout.
The most exciting possibility for LA would be to use it in conjunction with an automated layoutprogram that incorporates additional details about information content and style guidelines. LAcould be used when generating the initial layout. Subsequently, as the designer makes changes,LA and other metrics could provide feedback concerning the possible effects of the changes onuser performance. LA is intended to supplement other metrics, not to stand alone. Ideally,additional metrics will be developed and used in conjunction with LA to provide feedback todesigners concerning the possible effects of changes in the user interface on user performance.Providing additional feedback will be beneficial to both software engineers who occasionally facethe challenge of designing an interface and experienced designers who frequently design interfaces.
AcknowledgementsI would like to thank Ben Shneiderman for his guidance and support for this research project. Iwould also like to thank the reviewers and fellow researchers for their many thoughtful commentswhich have improved this paper, and NASA for providing funding for this research through grant#NGT-50762.
References[1] R. I. Anderson, “Task Analysis: The Oft Missing Step in the Development of Computer-Human Interfaces; Its Desirable Nature, Value, and Role,” Proceedings of INTERACT ‘90,August 1990, pp. 1051-1054.
[2] S. Card, W. English, and B. Burr, “Evaluation of Mouse, Rate-Controlled IsometricJoystick, Step Keys and Text Keys for Text Selection on a CRT,” Ergonomics, Vol. 21, No. 8, pp.601-613, 1978.
21
[3] S. Card, T. Moran, & A. Newell, The Psychology of Human-Computer Interaction,Hillsdale, NJ: Erlbaum, 1983.
[4] S. Casner and J. H. Larkin, “Cognitive Efficiency Considerations for Good GraphicDesign,” Cognitive Science Society Proceedings, August 1989.
[5] D. de Baar, J. Foley, and K. Mullet, “Coupling Application Design and User InterfaceDesign,” CHI ‘92 Proceedings, May 1992, pp. 259-266.
[6] C. G. Drury, B. Paramore, H. P. Van Cott, S. M. Grey, and E. N. Corlett, “Task Analysis,”In G. Salvendy (Ed.), Handbook of Human Factors (pp. 370-401), New York: John Wiley &Sons, 1987.
[7] J. Fath and R. Bias, “Taking the ‘Task’ out of task analysis,” Proceedings of the 36thAnnual Meeting of the Human Factors Society, pp. 379-383, 1992.
[8] R. Gupta and J. Sharit, “Human-Computer Interaction in Facilities Layout,” In M Helander(Ed.), Handbook of Human-Computer Interaction (pp. 729-736). Amsterdam: Elsevier SciencePublishers, 1988.
[9] H. R. Hartson, A. Siochi and D. Hix, “The UAN: User-oriented representation for directmanipulation interface designs,” ACM Transactions on Information Systems , vol. 8, no. 3, pp.269-288.
[10] R. Jeffries, J. Miller, C. Wharton and K. Uyeda, “User interface evaluation in the realworld: A comparison of four techniques,” CHI ‘91 Proceedings, April 1991, pp. 119-124.
[11] H. Johnson and P. Johnson, “Designers-identified requirements for tools to support taskanalyses,” INTERACT ‘90 Proceedings, August 1990, pp. 259-264.
[12] P. Johnson and E. Nicolosi, “Task-based user interface development tools,” INTERACT‘90 Proceedings, August 1990, pp. 383-387.
[13] B. Kantowitz and R. Sorkin, Human Factors: Understanding poeple-system relationships.New York: John Wiley & Sons, 1983, pp. 226-227.
[14] D. Kieras, “Towards a Practical GOMS Model Methodology for User Interface Design,” InM Helander (Ed.), Handbook of Human-Computer Interaction (pp. 135-157). Amsterdam:Elsevier Science Publishers, 1988.
[15] W. Kim and J. Foley, “DON: User Interface Presentation Design Assistant,”UIST ‘90Proceedings, October 1990, pp. 10-20.
[16] C. Lewis, P. Polson, C. Wharton and J. Rieman, “Testing a walkthrough methodology fortheory-based design of Walk-Up-and-Use interfaces,” CHI ‘90 Proceedings, April 1990, pp. 235-242.
[17] J. Lohse, “A Cognitive Model for the Perception and Understanding of Graphics,” CHI‘91 Proceedings, April 1991, pp. 137-144.
22
[18] I. S. MacKenzie and W. Buxton, “Extending Fitts’ Law to Two-Dimensional Tasks,” CHI‘92 Proceedings, May 1992, pp. 219-226.
[19] J. Mackinlay, “Applying a Theory of Graphical Presentation to the Graphic Design of UserInterfaces,” UIST ‘88 Proceedings, October 1988, pp. 179-189.
[20] R. B. Miller, “Task Description and Analysis,” In R. M. Gagne (Ed.), Psychologicalprinciples in system development, New York: Holt, Rinehart and Winston, 1963.
[21] S. Payne and T. Green, “Task-Action Grammars: A model of the mental representation oftask languages,” Human-Computer Interaction, vol. 2, no. 2, pp. 93-133.
[22] G. Perlman, “An Axiomatic Model of Information Presentation,” Proceedings of the 31stAnnual Meeting of the Human Factors Society, pp. 1129-1233, 1987.
[23] M. D. Phillips, H. S. Bashinski, H. L. Ammerman, and C. M. Fligg Jr., “A Task AnalyticApproach to Dialogue Design,” In M Helander (Ed.), Handbook of Human-Computer Interaction(pp. 835-857). Amsterdam: Elsevier Science Publishers, 1988.
[24] L. B. Protsko, P. G. Sorenson, J. P. Tremblay, and D. A. Schafer, “Towards the AutomaticGeneration of Software Diagrams,” IEEE Transactions on Software Engineering, vol. 17, no. 1,pp. 10-21, 1991.
[25] P. Reisner, “Formal grammar and human factors design of an interactive graphics system,”IEEE Transactions on Software Engineering, vol. SE-7, no. 2, pp. 229-240.
[26] A. Sears, “Layout Appropriateness: Guiding interface design and evaluation with simple taskdescriptions”, PhD Dissertation, Computer Science Department, University of Maryland, CollegePark, MD.
[27] B. Shneiderman, Designing the User Interface (2nd Edition), Reading, MA: Addison-Wesley, 1992, pp. 55-60.
[28] P. Szekely, “Template-Based Mapping of Application Data to Interactive Displays,” UIST‘90 Proceedings, October 1990, pp. 1-9.
[29] T. Tullis, “A system for evaluating screen formats: Research and application,” In: R. Hartson& D. Hix (Eds.), Advances in Human-Computer Interaction,vol. 2, pp. 214-286, 1988.
[30] L. Veach, Personal Communication, NASA, Houston, TX, December 3, 1991.
[31] C. Wharton, J. Bradford, R. Jeffries and M. Franzke, “Applying cognitive walkthroughs tomore complex user interfaces: Experiences, issues, and recommendations,”CHI ‘92 Proceedings,May 1992, pp. 381-388.
[32] B. V. Zanden and B. A. Myers, “Automatic, Look-and-Feel Independent Dialog Creation forGraphical User Interface,” CHI ‘90 Proceedings, April 1990, pp. 27-34.
23