SEACOR Holdings Inc. -...
32
UNITED STATES SECURITIES AND EXCHANGE COMMISSION WASHINGTON, D.C. 20549 FORM 8-K CURRENT REPORT Pursuant to Section 13 or 15(d) of the Securities Exchange Act of 1934 Date of Report (Date of Earliest Event Reported): February 14, 2017 SEACOR Holdings Inc. __________________________________________ (Exact name of registrant as specified in its charter) Delaware 1-12289 13-3542736 (State or other jurisdiction of incorporation) (Commission File Number) (I.R.S. Employer Identification No.) 2200 Eller Drive, Fort Lauderdale, Florida 33316 (Address of principal executive offices) (Zip Code) Registrant’s telephone number, including area code: (954) 523-2200 Not Applicable __________________________________________ Former name or former address, if changed since last report Check the appropriate box below if the Form 8-K filing is intended to simultaneously satisfy the filing obligation of the registrant under any of the following provisions: [ ] Written communications pursuant to Rule 425 under the Securities Act (17 CFR 230.425) [ ] Soliciting material pursuant to Rule 14a-12 under the Exchange Act (17 CFR 240.14a-12) [ ] Pre-commencement communications pursuant to Rule 14d-2(b) under the Exchange Act (17 CFR 240.14d-2(b)) [ ] Pre-commencement communications pursuant to Rule 13e-4(c) under the Exchange Act (17 CFR 24
Transcript of SEACOR Holdings Inc. -...
UNITED STATES
SECURITIES AND EXCHANGE COMMISSION
WASHINGTON, D.C. 20549
FORM 8-K
CURRENT REPORT
Pursuant to Section 13 or 15(d) of the Securities Exchange Act of 1934
Date of Report (Date of Earliest Event Reported): February 14, 2017
SEACOR Holdings Inc.__________________________________________
(Exact name of registrant as specified in its charter)
Delaware 1-12289 13-3542736
(State or other jurisdiction of incorporation) (Commission File Number) (I.R.S. Employer Identification No.)
2200 Eller Drive, Fort Lauderdale, Florida 33316
(Address of principal executive offices) (Zip Code)
Registrant’s telephone number, including area code: (954) 523-2200
Not Applicable
__________________________________________
Former name or former address, if changed since last report
Check the appropriate box below if the Form 8-K filing is intended to simultaneously satisfy the filing obligation of the registrant underany of the following provisions:
[ ] Written communications pursuant to Rule 425 under the Securities Act (17 CFR 230.425)
[ ] Soliciting material pursuant to Rule 14a-12 under the Exchange Act (17 CFR 240.14a-12)
[ ] Pre-commencement communications pursuant to Rule 14d-2(b) under the Exchange Act (17 CFR 240.14d-2(b))
[ ] Pre-commencement communications pursuant to Rule 13e-4(c) under the Exchange Act (17 CFR 24
Item 7.01 Regulation FD Disclosure.
The information in this Current Report shall not be deemed "filed" for purposes of Section 18 of the SecuritiesExchange Act of 1934, as amended (the "Exchange Act") or otherwise subject to the liabilities of that Section. Theinformation in this Current Report shall not be incorporated by reference in any filing under the Securities Act of 1933,as amended, or the Exchange Act, except as shall be expressly set forth by specific reference in such a filing.
On February 14, 2017, Charles Fabrikant, Executive Chairman and Chief Executive Officer of SEACORHoldings Inc., will be making a presentation at the Stifel 2017 Transportation & Logistics Conference in Miami,Florida (the "Conference"). Attached hereto as Exhibit 99.1 are the slides that will be presented at the Conference.
Item 9.01 Financial Statements and Exhibits
(d) Exhibits
Exhibit No. Description99.1 Stifel 2017 Transportation & Logistics Conference presentation, February 14, 2017

SIGNATURES
Pursuant to the requirements of the Securities Exchange Act of 1934, the registrant has duly caused this report to be signed on itsbehalf by the undersigned hereunto duly authorized.
SEACOR Holdings Inc. February 14, 2017 By: /s/ William C. Long Name: William C. Long
Title: Executive Vice President and Chief Legal Officer

Exhibit Index
Exhibit No. Description 99.1 Stifel 2017 Transportation & Logistics Conference presentation, February 14, 2017
STIFEL TRANSPORTATION & LOGISTICS CONFERENCE February 14, 2017
Forward-Looking Statement This presentation includes “forward-looking statements” within the meaning of the Private Securities Litigation Reform Act of 1995. Certain statements discussed in this presentation as well as in other reports, materials and oral statements that SEACOR Holdings Inc. (“Company”) releases from time to time constitute “forward- looking statements” within the meaning of the Private Securities Litigation Reform Act of 1995. Generally, words such as “anticipate,” “estimate,” “expect,” “project,” “intend,” “believe,” “plan,” “target,” “forecast” and similar expressions are intended to identify forward-looking statements. Such forward-looking statements concern management's expectations, strategic objectives, business prospects, anticipated economic performance and financial condition and other similar matters. These statements are not guarantees of future performance and actual events or results may differ significantly from these statements. Actual events or results are subject to significant known and unknown risks, uncertainties and other important factors, including: decreased demand and loss of revenues as a result of a decline in the price of oil and an oversupply of newly built offshore support vessels; additional safety and certification requirements for drilling activities in the U.S. Gulf of Mexico and delayed approval of applications for such activities; the possibility of U.S. government implemented moratoriums directing operators to cease certain drilling activities in the U.S. Gulf of Mexico and any extension of such moratoriums; weakening demand for the Company’s services as a result of unplanned
customer suspensions, cancellations, rate reductions or non-renewals of vessel charters or failures to finalize commitments to charter vessels in response to a decline in the price of oil; an oversupply of newly built offshore support vessels; increased government legislation and regulation of the Company’s businesses which could increase the cost of operations; increased competition if the Jones Act is repealed; the liability, legal fees and costs in connection with the provision of emergency response services, including the Company’s involvement in response to the oil spill as a result of the sinking of the Deepwater Horizon in April 2010; decreased demand for the Company’s services as a result of declines in the global economy; declines in valuations in the global financial markets and a lack of liquidity in the credit sectors, including, interest rate fluctuations, availability of credit, inflation rates, change in laws, trade barriers, commodity prices and currency exchange fluctuations; the cyclical nature of the oil and gas industry, activity in foreign countries and changes in foreign political, military and economic conditions; changes in foreign and domestic oil and gas exploration and production activity; safety record requirements related to Offshore Marine Services and Shipping Services; decreased demand for Shipping Services due to construction of additional refined petroleum product, natural gas or crude oil pipelines or due to decreased demand for refined petroleum products, crude oil or chemical products or a change in existing methods of delivery; compliance with U.S. and foreign government laws and regulations, including
environmental laws and regulations and economic sanctions; the dependence of Offshore Marine Services, Inland River Services, Shipping Services and Illinois Corn Processing on several customers; consolidation of the Company's customer base; the ongoing need to replace aging vessels; industry fleet capacity; restrictions imposed by the Shipping Acts on the amount of foreign ownership of the Company's Common Stock; operational risks of Offshore Marine Services, Inland River Services and Shipping Services; effects of adverse weather conditions and seasonality; the level of grain export volume; the effect of fuel prices on barge towing costs; variability in freight rates for inland river barges; the effect of international economic and political factors on Inland River Services' operations; the effect of the spread between the input costs of corn and natural gas compared with the price of alcohol and distillers grains on Illinois Corn Processing's operations; adequacy of insurance coverage; the potential for a material weakness in the Company's internal controls over financial reporting and the Company's ability to remediate such potential material weakness; the attraction and retention of qualified personnel by the Company; and various other matters and factors, many of which are beyond the Company's control as well as those discussed in Item 1A (Risk Factors) of the Company's Annual report on Form 10-K. In addition, these statements constitute the Company's cautionary statements under the Private Securities Litigation Reform Act of 1995. It should be understood that it is not possible to predict or identify all such factors. Consequently, the preceding
should not be considered to be a complete discussion of all potential risks or uncertainties. Forward-looking statements speak only as of the date of the document in which they are made. The Company disclaims any obligation or undertaking to provide any updates or revisions to any forward-looking statement to reflect any change in the Company's expectations or any change in events, conditions or circumstances on which the forward-looking statement is based, except as required by law. The forward-looking statements in this presentation should be evaluated together with the many uncertainties that affect the Company’s businesses, particularly those mentioned under “Forward-Looking Statements” in Item 7 on the Company’s Form 10-K and SEACOR’s periodic reporting on Form 8-K (if any), which are incorporated by reference. 2
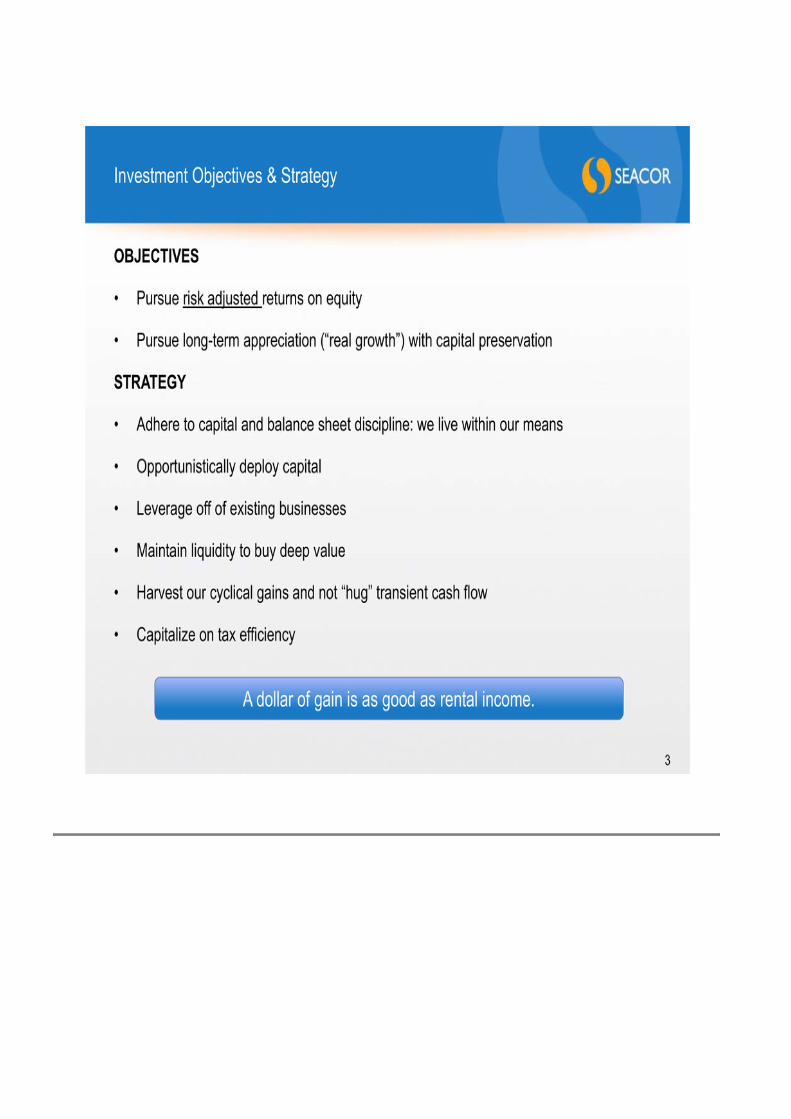
Investment Objectives & Strategy 3 OBJECTIVES • Pursue risk adjusted returns on equity • Pursue long-term appreciation (“real growth”) with capital preservation STRATEGY • Adhere to capital and balance sheet discipline: we live within our means • Opportunistically deploy capital • Leverage off of existing businesses • Maintain liquidity to buy deep value • Harvest our cyclical gains and not “hug” transient cash flow • Capitalize on tax efficiency A dollar of gain is as good as rental income.

Understanding SEACOR 4 PORTFOLIO OF NICHE BUSINESSES • Inland River Services and Illinois Corn Processing • Shipping Services • Offshore Marine Services • Other We are unique in the U.S. maritime industry.

SEACOR’s Asset Base 5 Asset Mix Offshore Marine Services Anchor handling towing supply vessels Fast support vessels Platform supply vessels Standby safety vessels Liftboats Wind farm utility vessels Inland River Services Dry-cargo barges Towboats Terminal operations & grain elevators Fleeting operations Intermodal terminals Shipyard services Shipping Services Petroleum & chemical tank vessels Harbor and offshore tugs Bunker barges Short-sea RoRos & LoLo Landing Craft Other General Aviation Services Witt O’Brien’s (Emergency & Crisis Services) Other activities Energy Service Offshore Marine 37% Inland River 13% ICP 2% Shipping 26% Other & Corp. 5% Cash 17% Pro Forma Total Assets as of Sep. 30, 2016 $2,954 million Diversification and liquidity: We are prepared for opportunity. 1 If the spin-off of SEACOR Marine Holdings Inc. (“SMH”), the offshore marine business unit, were to have occurred on Sep. 30, 2016, total cash and near cash assets of $218.4 million related to the business would have transferred to the entity. 2 Cash includes cash and cash equivalents, marketable securities, including Dorian LPG Ltd. (NYSE: LPG), and construction reserve funds for all business units except for the offshore marine division. 1 2 ICP Illinois Corn Processing Plant
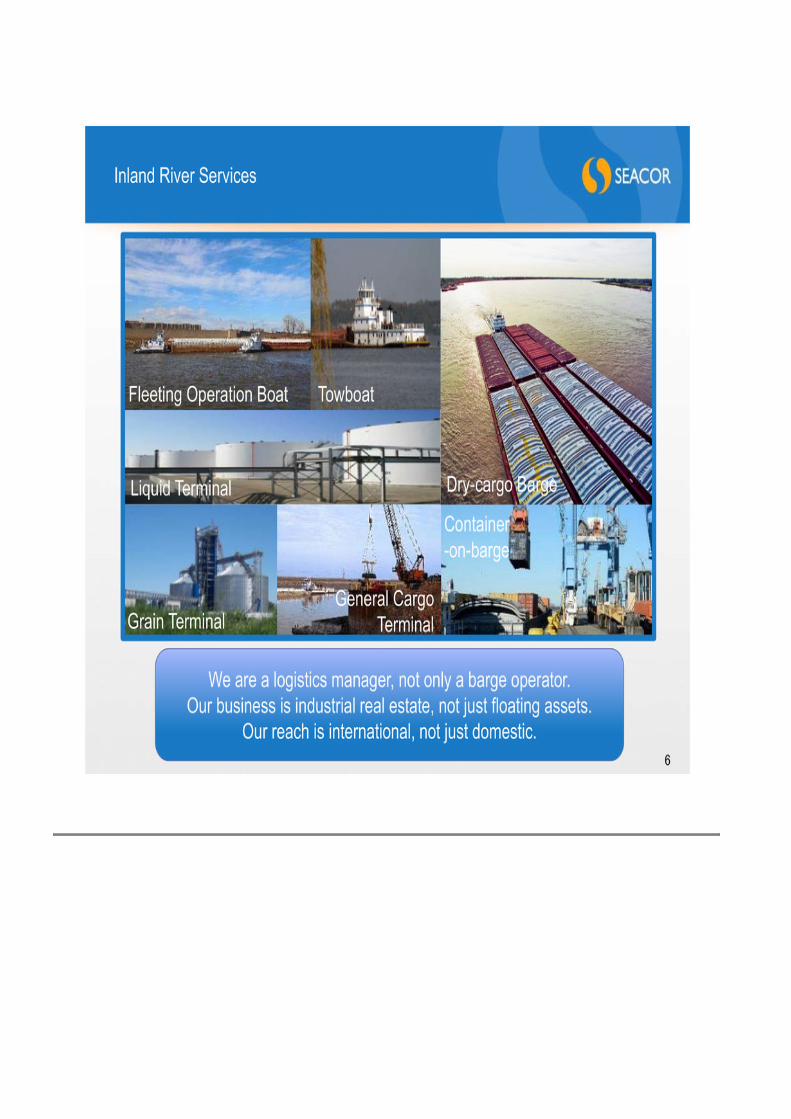
Inland River Services 6 We are a logistics manager, not only a barge operator. Our business is industrial real estate, not just floating assets. Our reach is international, not just domestic. Dry-cargo Barge Grain Terminal Liquid Terminal General Cargo Terminal Container -on-barge Fleeting Operation Boat Towboat
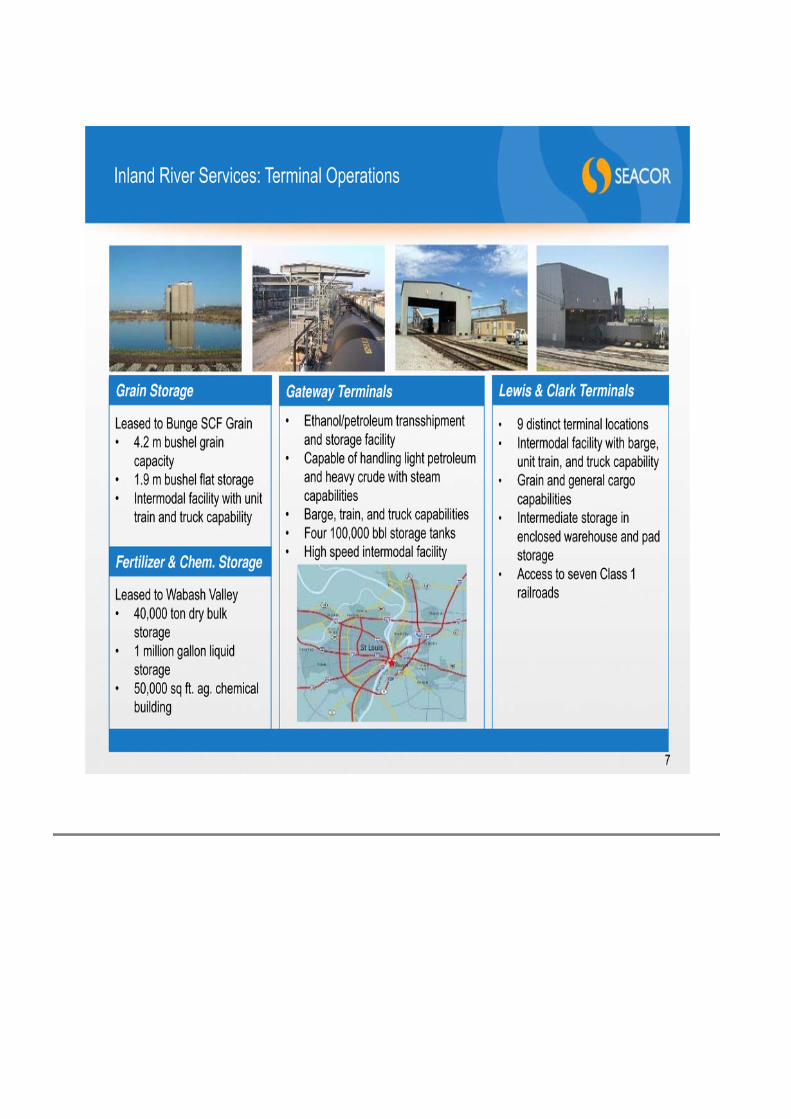
Inland River Services: Terminal Operations • Ethanol/petroleum transshipment and storage facility • Capable of handling light petroleum and heavy crude with steam capabilities • Barge, train, and truck capabilities • Four 100,000 bbl storage tanks • High speed intermodal facility Leased to Bunge SCF Grain • 4.2 m bushel grain capacity • 1.9 m bushel flat storage • Intermodal facility with unit train and truck capability Leased to Wabash Valley • 40,000 ton dry bulk storage • 1 million gallon liquid storage • 50,000 sq ft. ag. chemical building Grain Storage Fertilizer & Chem. Storage Gateway Terminals • 9 distinct terminal locations • Intermodal facility with barge, unit train, and truck capability • Grain and general cargo capabilities • Intermediate storage in enclosed warehouse and pad storage • Access to seven Class 1 railroads Lewis & Clark Terminals 7

Inland River Services: Fleeting Operations 8 • Serves as a strategic operating platform • Handles fleeting (parking) and switching (positioning) of dry-cargo and tank barges • Cleans and repairs dry-cargo barges SCF Fleeting Locations • St. Louis, MO – 305 barges • Granite City, IL – 58 barges • Hartford, IL – 249 barges • Festus, MO – 90 barges • Herculaneum, MO – 45 barges • Total – 747 barges Competitors • CGB/Osage – 760 barges • ARTCO – 300 barges • Ingram – 290 barges St. Louis Harbor Fleeting Spaces We own fleeting assets in 11 locations.

Illinois Corn Processing 9 • Product output: food, beverage, and industrial grade alcohol, agricultural feed (Dried Distillers Grains with Solubles, “DDGS”, used for animal feed), non-food grade Corn Oil used for feedstock in biodiesel production, CO2, and fuel grade ethanol • Production capacity: Estimated Production Capacity: 84 million gallons per year +/-30- 35% High Quality (HQ-"beverage grade”), +/-30-35% Industrial-chemical (export grade), +/-30-40% Fuel Grade (available to blend)
Inland River Services: What’s New 10 • Exited liquid unit tow operations (2Q16): – 28 30,000 barrel inland river liquid tank barges (including 8 leased-in) – 14 inland river towboats • Expanded fleeting operations (4Q16): – Acquired Central Contracting & Marine Inc. (“CCM”) of Festus, MO – Fleeting operation boats, barges, equipment, and terminal assets at fleeting sites • Ordered new generation equipment – Three 6,600 horsepower towboats on order with deliveries in 2017 – The largest towboats with Z drive propulsion in the United States • Capitalized on shipyard availability and pricing – Took delivery of 46 dry-cargo covered barges (3Q16-4Q16) • Took delivery of 1 towboat (2Q16) and expected to ship two liquid tank barges to Colombia by the end of February 2017. We are the only operator with barge equipment along the U.S. Inland Waterways and the Parana/Paraguay and Magdalena Waterways in South America.

Name # of Barges # of Towboats (≥ 6,000 hp) ACL & AEP 3,266 50 Ingram Barge Company 2,554 54 American River Transportation 1,772 18 Cargo Carriers 1,332 1 SCF Marine 1,097 6 Marquette Transportation - 42 All Other1 1,958 50 Total 11,979 221 Top Five Largest Jumbo Covered Hopper Barge Operators Inland River Services: U.S. Dry-Cargo Barge Competitive Landscape 11 • The inland barge industry has experienced significant consolidation since 1980; will there be another deal? • The top 5 operators control over 80% of the U.S. jumbo covered hopper barge fleet and about 60% of the towboat fleet ≥ 6,000 hp: SCF is the 5th largest and enjoys a strategic relationship with Bunge North America • Scale provides a competitive edge due to vertical integration Sources: Informa Economics, Inc. (March 2016) and Inland River Record As of Sep. 30, 2016, we operated 990 dry-cargo covered barges (513 owned / 477 pooled or managed). 1 All other includes 21 barge operators and 17 towboat operators.

Inland River Services: Market Drivers and Opportunities 12 • Market Drivers: – Dry-cargo barge operations: agricultural exports (U.S. and South America), and fertilizer and industrial commodity imports – Terminal operations: demand for storage, rail moves, and redistribution of bulk commodities (steel, fertilizer, agricultural products, and ethanol) • Primary Revenue Source: – Contract of Affreightment (COA) for barge operations – Terminal throughput volume and related services (priced per ton) – Fleeting (barge shifting, fleeting, cleaning, and repair) – Dry-cargo towing services – Shipyard and related services • Opportunities: – Consolidate fragmented fleets and river assets in the United States and/or South America – Acquire equipment & facilities at favorable prices – Capitalize on new technology: pursue innovation in boat design – Develop container-on-barge service
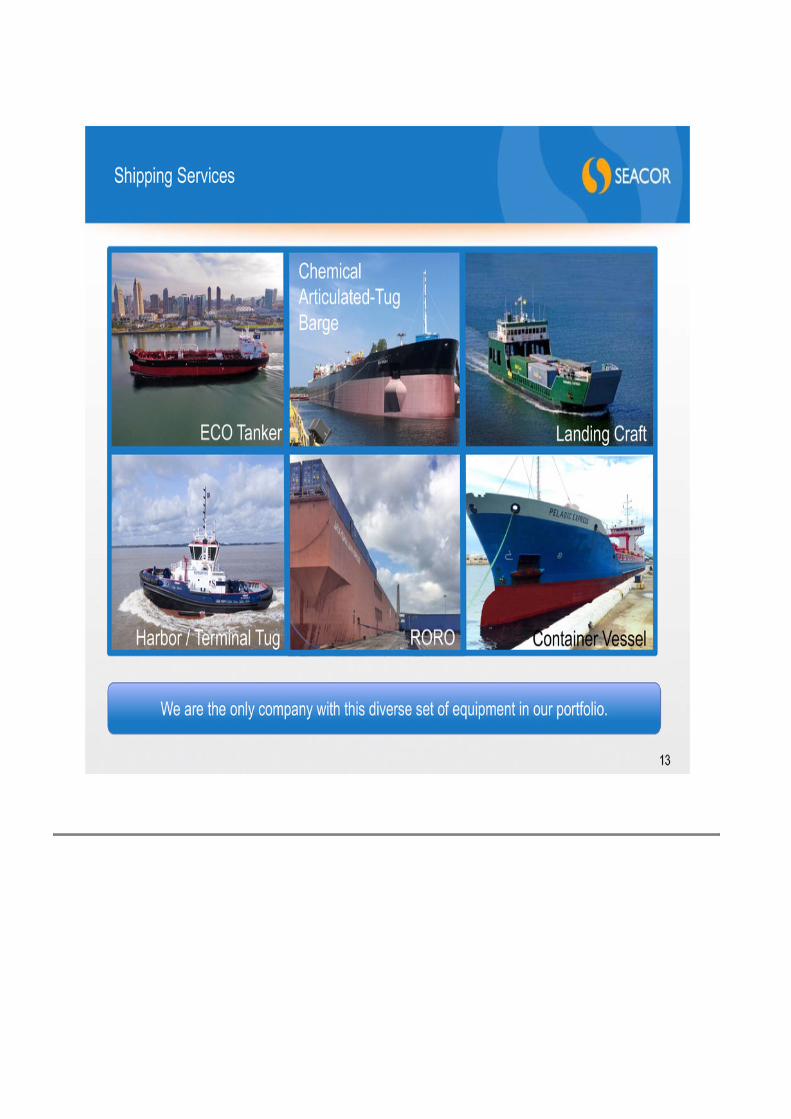
Shipping Services 13 Container Vessel Landing craft here Landing Craft ROROHarbor / Terminal Tug ECO Tanker Chemical Articulated-Tug Barge We are the only company with this diverse set of equipment in our portfolio.
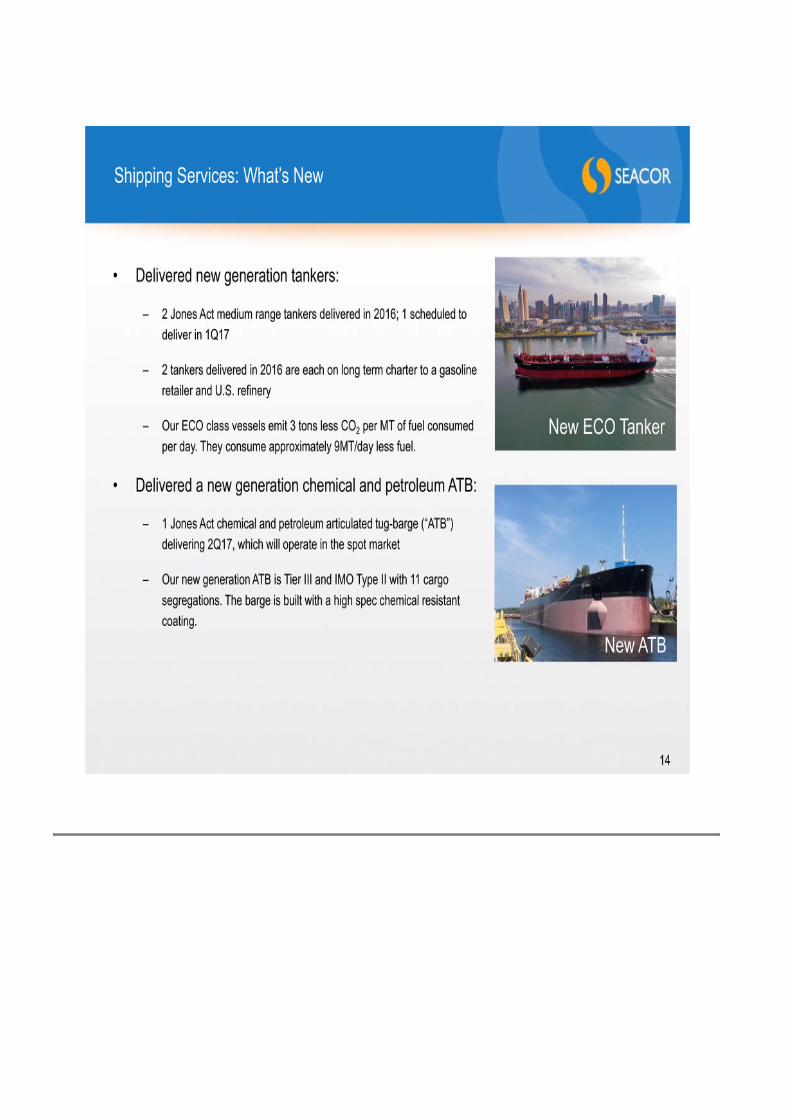
Shipping Services: What’s New 14 • Delivered new generation tankers: – 2 Jones Act medium range tankers delivered in 2016; 1 scheduled to deliver in 1Q17 – 2 tankers delivered in 2016 are each on long term charter to a gasoline retailer and U.S. refinery – Our ECO class vessels emit 3 tons less CO2 per MT of fuel consumed per day. They consume approximately 9MT/day less fuel. • Delivered a new generation chemical and petroleum ATB: – 1 Jones Act chemical and petroleum articulated tug-barge (“ATB”) delivering 2Q17, which will operate in the spot market – Our new generation ATB is Tier III and IMO Type II with 11 cargo segregations. The barge is built with a high spec chemical resistant coating. New ECO Tanker New ATB

Shipping Services: Jones Act Tank Vessel Market 15 JONES ACT VARIABLES + Older equipment: 11 vessels are 25+ years old + Fleet status: 19 special surveys due 2017-2019 + Increased U.S. petroleum output + Very high barriers to entry (limited yard capacity, high costs and long lead times) + Potential consolidation Approximately 62 vessels in the Jones Act coastwise tank vessel fleet 200k or greater bbl capacity (> 25,000 dwt) are controlled by 10 operators. 0 5 10 15 20 25 25+ Yrs. 21-25 Yrs. 16-20 Yrs. 6-15 Yrs. 1-5 Yrs. Delivery 2017 N u m b e r o f V e s s e l s Age (in Years) U.S.-Flag Tank Vessel Fleet Age Profile ≥ 200,000 BBL As of February 2017 No Specials Due 2017-2019 Special Surveys Due 2017-2019

Shipping Services: What’s New 16 • Delivered the first Rotortug in the United States: – 1 azimuth drive Rotortug delivered (1Q17); 2 scheduled to deliver in 2Q17-4Q17 – Will operate in Port Everglades, FL, Port Arthur, TX, and Mobile, AL
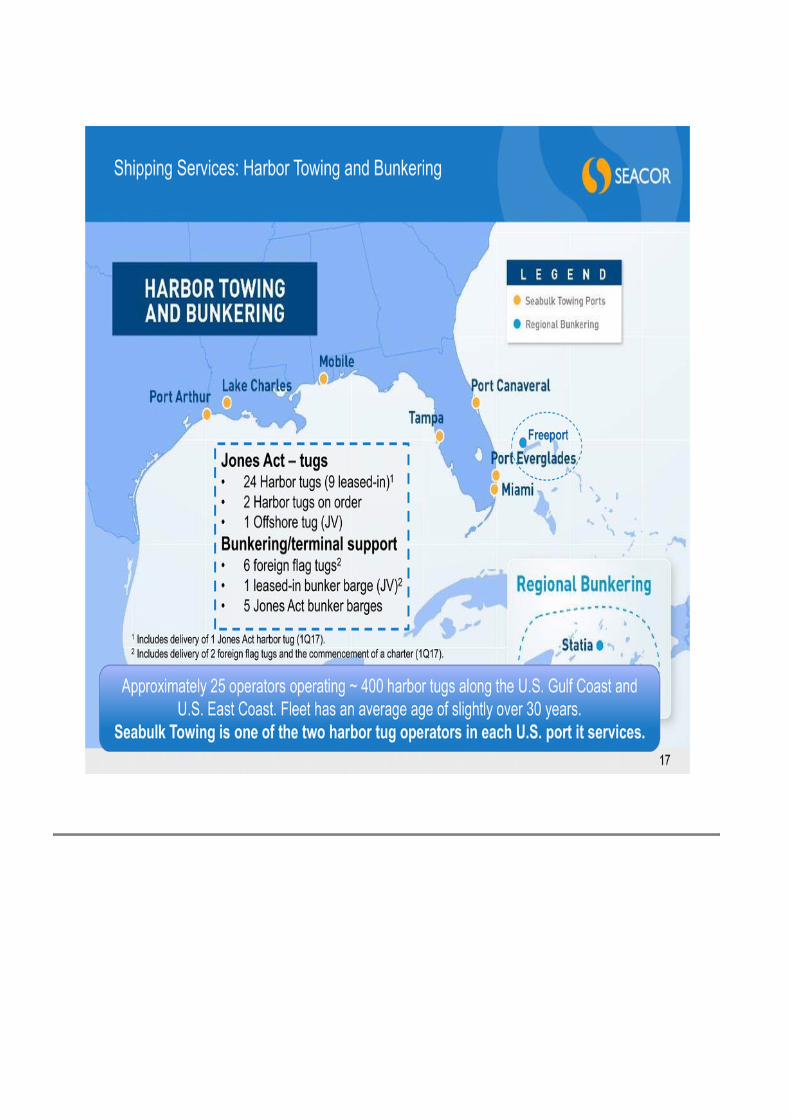
17 Shipping Services: Harbor Towing and Bunkering Approximately 25 operators operating ~ 400 harbor tugs along the U.S. Gulf Coast and U.S. East Coast. Fleet has an average age of slightly over 30 years. Seabulk Towing is one of the two harbor tug operators in each U.S. port it services. Jones Act – tugs • 24 Harbor tugs (9 leased-in)1 • 2 Harbor tugs on order • 1 Offshore tug (JV) Bunkering/terminal support • 6 foreign flag tugs2 • 1 leased-in bunker barge (JV)2 • 5 Jones Act bunker barges Freeport 1 Includes delivery of 1 Jones Act harbor tug (1Q17). 2 Includes delivery of 2 foreign flag tugs and the commencement of a charter (1Q17).

18 Shipping Services: Liner / Short Sea Shipping . There are 9 operators (7 are U.S.-based) servicing the Bahamas with 19 vessels There are 4 operators servicing Puerto Rico from the U.S. with 16 vessels. SEACOR Island Lines • 6 landing craft / 1 containership Option on Cuba Trailer Bridge (JV) • 7 RORO/deck barges
Shipping Services: Market Drivers and Opportunities 19 • Liquid Bulk Shipping: – Market Drivers: refined products (i.e. jet fuel, gasoline, diesel), chemical products (e.g. caustic soda), and crude oil demand and distribution – Primary Revenue Sources: time charter contracts, COA contracts, spot market, occasional bareboat – Opportunity: consolidation, third party ship management, government services, and international dry bulk • Harbor Towing: – Market Drivers: • vessel port calls (e.g. economic expansion) • petroleum and chemical facilities and distribution, global trade, and U.S. imports – Primary Revenue Source: term contracts for ship docking assistance – Opportunity: • expansion to additional ports in the U.S. and overseas • pursue long-term contracts at terminal facilities • Liner Shipping: – Market drivers: GDP growth, construction and infrastructure projects in the Bahamas and Caribbean – Primary Revenue Source: freight consolidation and freight forwarding, “on sea trucking” – Opportunity: expand service area: north coast of South America, Cuba, develop other U.S. short-sea routes Tanker contract backlog as of Sep. 30, 2016: $442.8 million
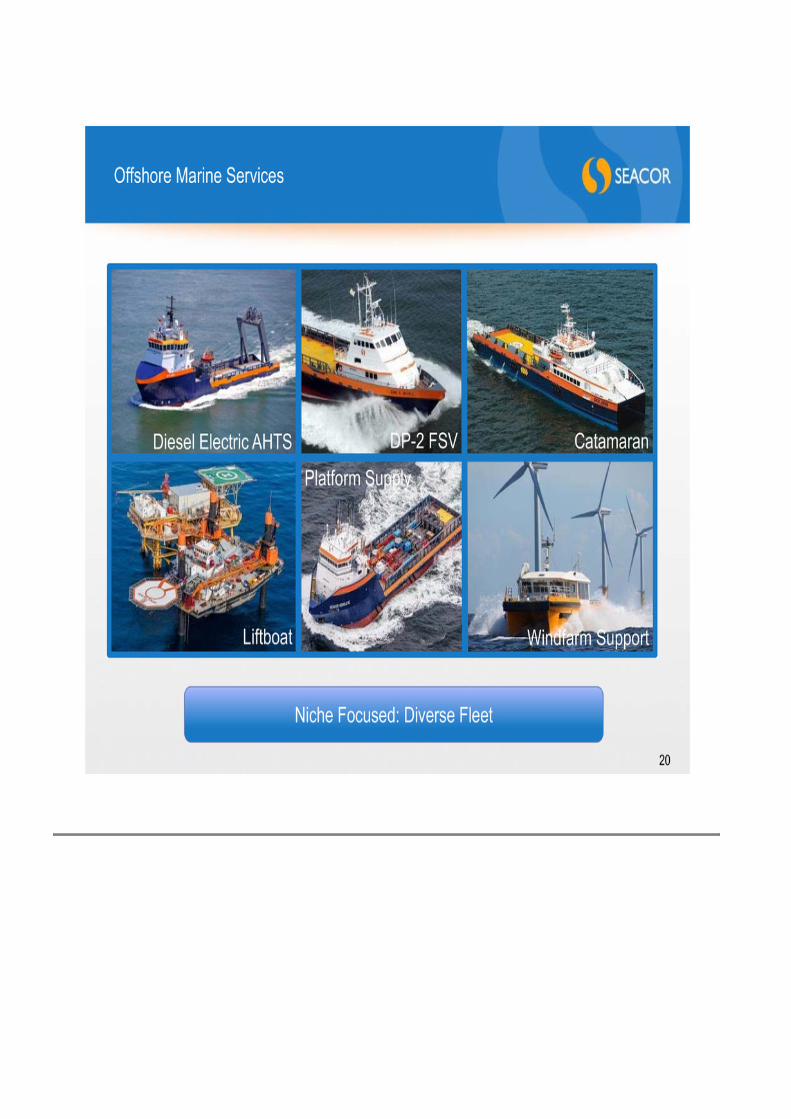
Offshore Marine Services 20 DP-2 FSVDiesel Electric AHTS Windfarm Support Platform Supply Liftboat Catamaran Niche Focused: Diverse Fleet
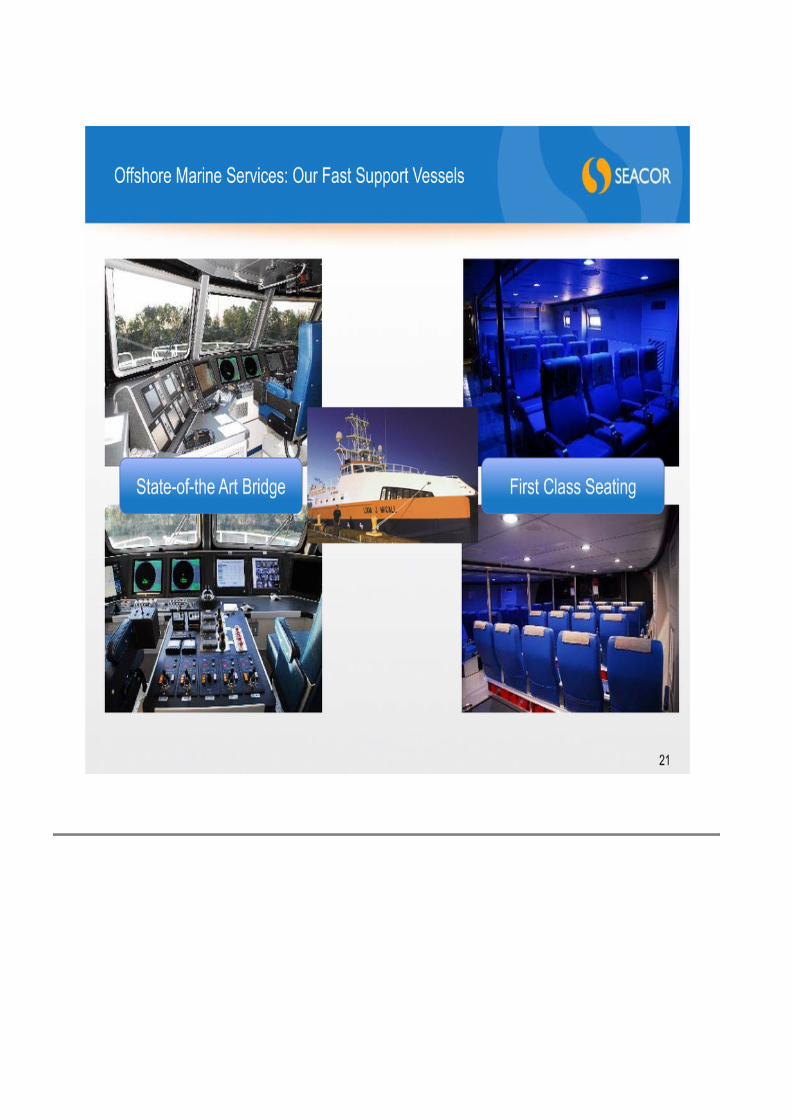
Offshore Marine Services: Our Fast Support Vessels 21 First Class SeatingState-of-the Art Bridge
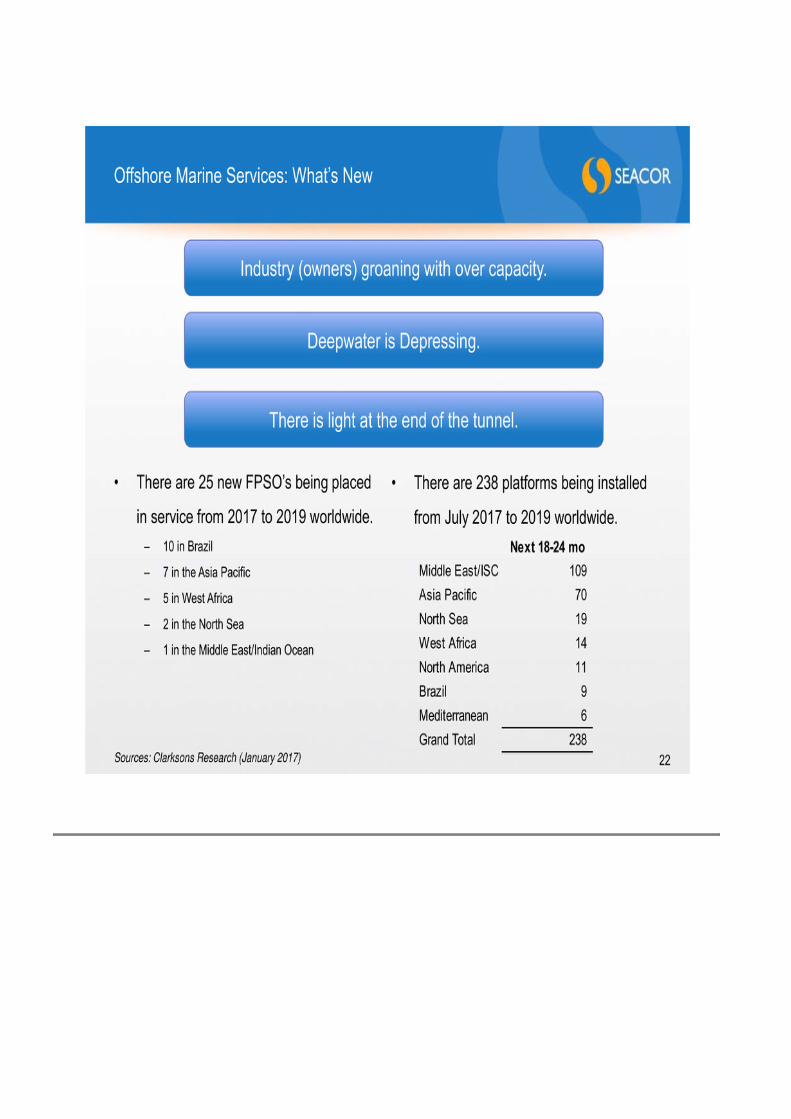
Offshore Marine Services: What’s New 22 Industry (owners) groaning with over capacity. Deepwater is Depressing. • There are 25 new FPSO’s being placed in service from 2017 to 2019 worldwide. – 10 in Brazil – 7 in the Asia Pacific – 5 in West Africa – 2 in the North Sea – 1 in the Middle East/Indian Ocean There is light at the end of the tunnel. • There are 238 platforms being installed from July 2017 to 2019 worldwide. Sources: Clarksons Research (January 2017) Next 18-24 mo Middle East/ISC 109 Asia Pacific 70 North Sea 19 West Africa 14 North America 11 Brazil 9 Mediterranean 6 Grand Total 238

• Market drivers: – Production support – Platform and pipeline maintenance – Ocean mapping – Cable laying Offshore Marine Services: Market Drivers and Opportunities 23 • Mission specific drivers: – Drilling – Construction – Decommissioning – Alternative energy • Primary Revenue Source: term charters • Opportunity: – Consolidate niches and regions – Acquire cheap assets – Leverage bank relationships: manage third party assets: income plus carried interest Capitalizing on downturn; a marathon, not a sprint. Business depressed: dawn of recovery. • Market drivers: – Personnel transport – Plug & abandonment work

Other Activities 24 • Industrial/General Aviation Services – Product mix: fixed wing and helicopter MROs (maintenance, repair & overhaul) and/or FBOs (fixed based operations) in Singapore, Shanghai, Manila, KL and throughout Australia; military contracts in Australia and New Zealand; aircraft distribution (mainland China, South East Asia, the UAE), aircraft brokerage, research and consulting • Emergency and Crisis Management – Preparedness: planning (crisis, emergency, business continuity, compliance), training and exercises – Response: on-call emergency responders, supported by 24/7 command center – Recovery: management of post-disaster recovery efforts • Alternative Energy – Energy merchant platform that invests in businesses and equipment to foster the migration to smarter, cleaner, and cost effective fuels.
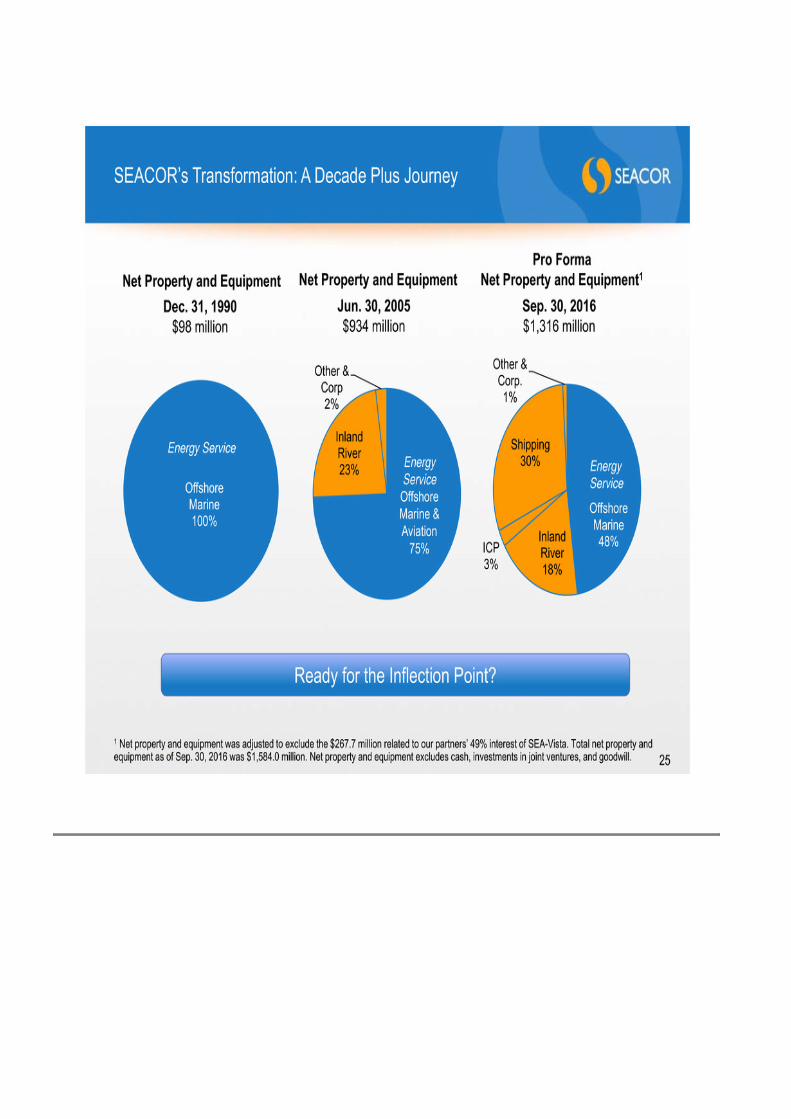
Inland River 23% Other & Corp 2% Offshore Marine 100% SEACOR’s Transformation: A Decade Plus Journey 25 Offshore Marine 48%Inland River 18% ICP 3% Shipping 30% Other & Corp. 1% Sep. 30, 2016 $1,316 million 1 Net property and equipment was adjusted to exclude the $267.7 million related to our partners’ 49% interest of SEA-Vista. Total net property and equipment as of Sep. 30, 2016 was $1,584.0 million. Net property and equipment excludes cash, investments in joint ventures, and goodwill. Jun. 30, 2005 $934 million Dec. 31, 1990 $98 million Energy Service Energy Service Net Property and Equipment Pro Forma Net Property and Equipment1 Net Property and Equipment Energy Service Offshore Marine & Aviation 75% Ready for the Inflection Point?

SEACOR Basics: Balance Sheet Highlights – Liquidity, Liquidity, Liquidity 26 1 SEACOR Marine Holdings Inc. ("SMH") is the offshore marine division. 2 Net property and equipment includes $267.7 million related to our partners’ portion (49% interest) of SEA-Vista. 3 Total debt includes $135.2 million related to our partner’s portion (49% interest) of SEA-Vista and $175 million of Senior Notes funded by the Carlyle Group for the offshore marine division. (in $mm's) Sep. 30, 2016 SMH1 Cash and marketable securities 553.3$ 156.5$ Construction reserve funds 161.9 61.9 Total Cash: 715.1 218.4 Net Property and Equipment2 1,584.0 628.7 Investments, at Equity, and Advances to 50% or Less Owned Companies 331.1 133.0 Goodwill & Intangible Assets, Net 75.9 - Total Debt3 1,041.9 230.1 Deferred Income Taxes 307.4 131.2 SEACOR Holdings Inc. Stockholders' Equity 1,149.3 606.5
Summary: SEACOR’s Value Proposition 27 We are a specialized manager investing capital; we don’t just buy equipment. • 25+ year track record of investing in, owning, and operating assets, businesses, and securities in cyclical industries throughout market cycles • In-house operating platform facilitates more nuanced diligence, not all assets (even if classified the same) are equal • Legacy operator…we are a strategic counterparty, and not only perceived as a capital provider • Management has diversified experience across multiple market segments and geographies…we have expanded far relative to our size • A dollar of gain is as good as rental income In-house capability to underwrite investments across a company or businesses’ capital structure and/or in individual assets.