SEA noise measurement report 4 - Airport Projects
52
Prepared for Port of Seattle: Sea-Tac Airport October 2010 Part 150 Noise Measurement Report DRAFT
Transcript of SEA noise measurement report 4 - Airport Projects

Prepared for Port of Seattle: Sea-Tac Airport
October 2010
Part 150 Noise Measurement Report DRAFT

Part 150 Noise Measurement Report
2 Port of Seattle: Sea-Tac Airport
Table of Contents
Introduction 3 Noise Measurement Methodology 4 Noise Measurement Site Maps 6 Air Traffic Maps 22
Noise Measurement Results
Ambient Noise Levels 33 Single Event Maximum Noise Levels, Lmax 37 Cumulative Noise Levels, DNL 43
Appendix – Measured Aircraft Noise Events 45

Part 150 Noise Measurement Report
3 Port of Seattle: Sea-Tac Airport
Introduction As part of the aircraft noise analysis conducted for the Sea-Tac Airport Part 150 Study Update, temporary noise measurements were performed at 13 sites near the Airport. Noise meters were located at different residences and churches to capture noise from aircraft operations. Measurement staff coordinated with property owners and caretakers to gain access to the backyards and roofs of the selected sites. Each site was selected relative to flight patterns, proximity to existing permanent airport noise monitors, and in response to community suggestions on places to measure aircraft noise. The report is presented as follows:
• Noise Measurement Methodology: Provides the make, model, specifications and capabilities of the equipment used during the measurement period, describes the various locations and time periods when measurements were conducted, and describes how noise events were matched to specific aircraft operations.
• Noise Measurement Site Map: Map of the location of the temporary noise
measurement sites and the existing permanent airport noise monitors. • Air Traffic Maps: Maps of air traffic flight tracks that flew over each site
during the measurement periods.
• Noise Measurement Results: Describes the ambient noise environment, community (non-aircraft), and aircraft noise levels at each site.
Part 150 Noise Measurement Report
4 Port of Seattle: Sea-Tac Airport
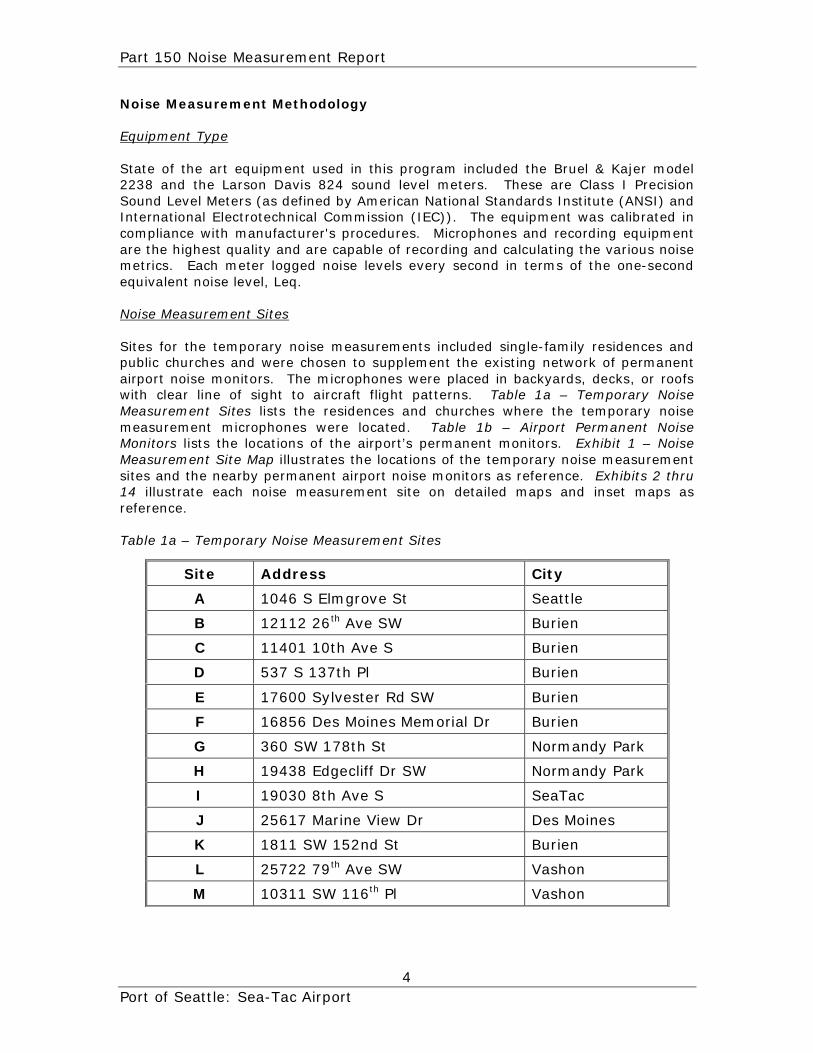
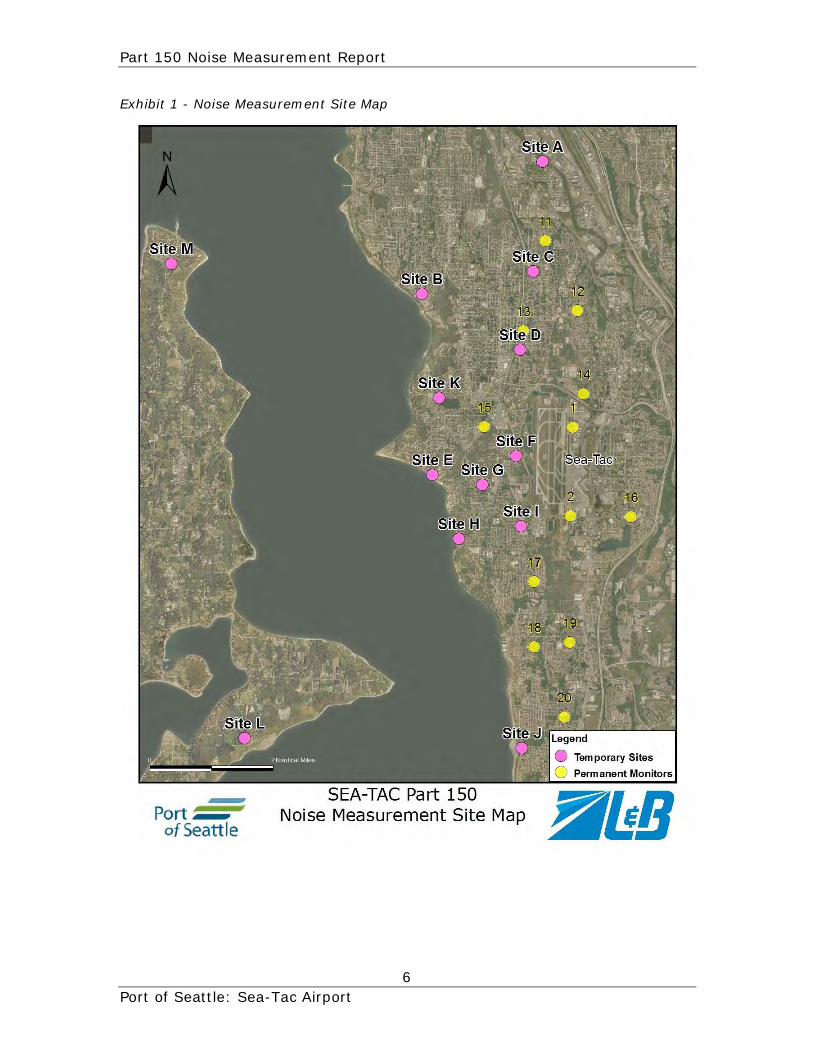
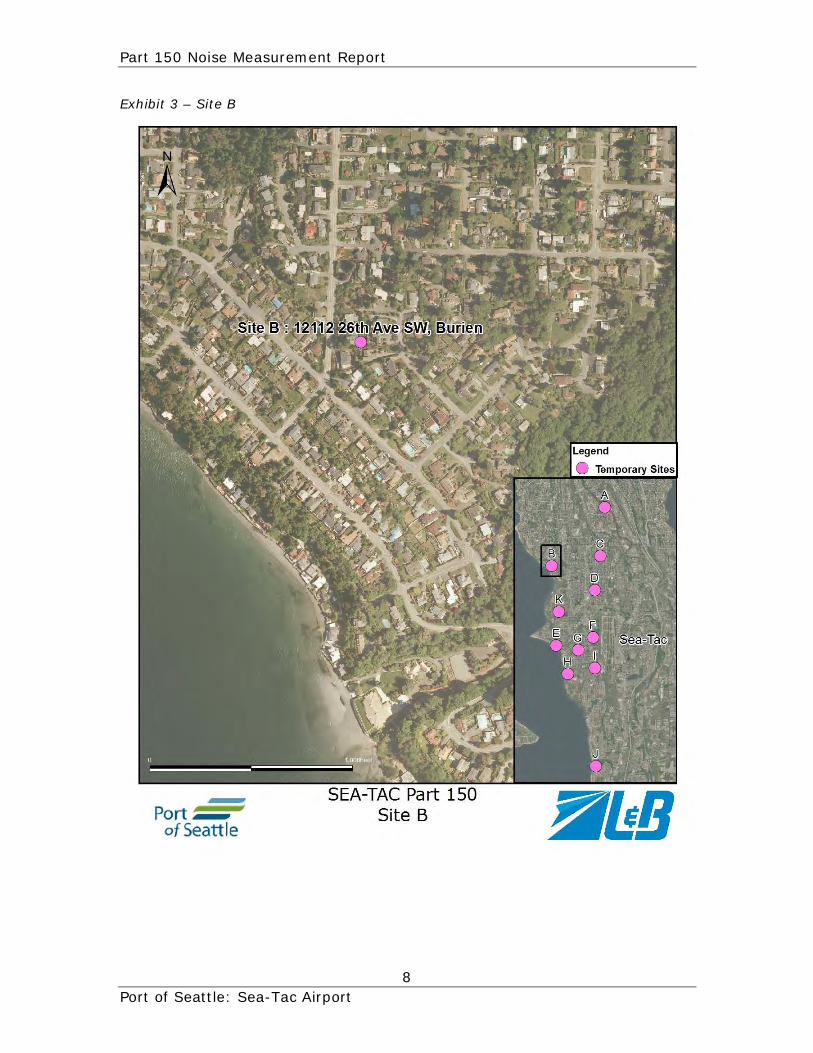
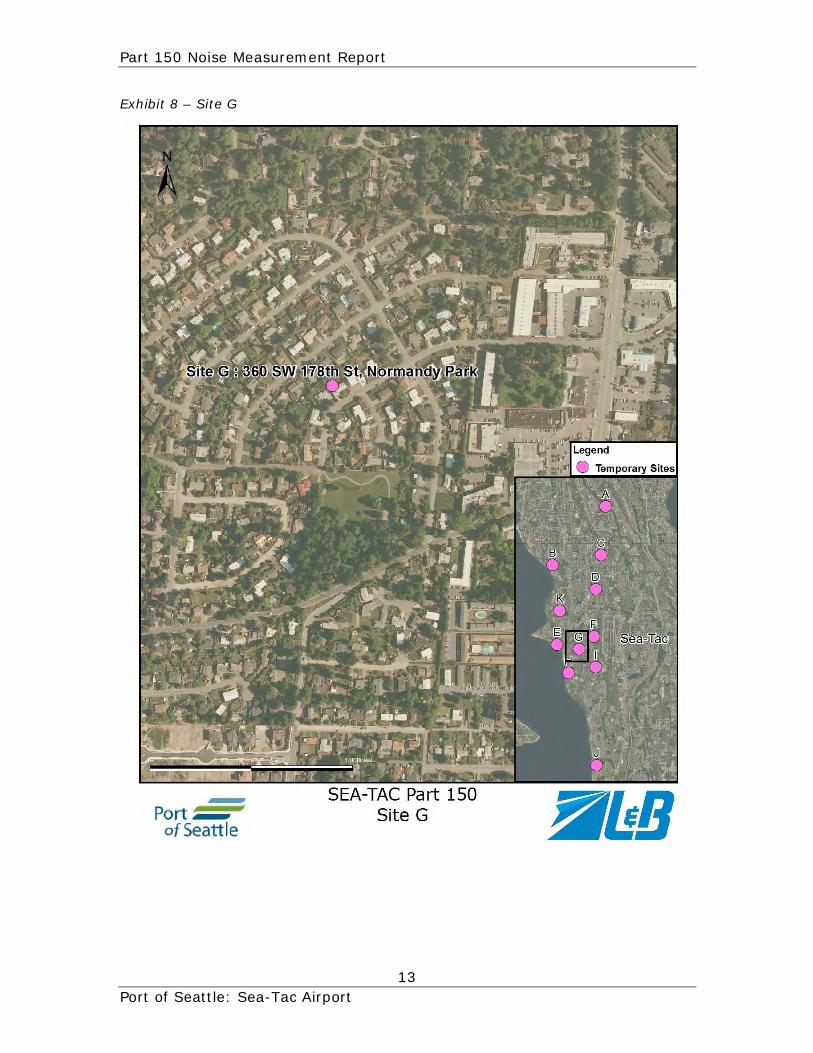
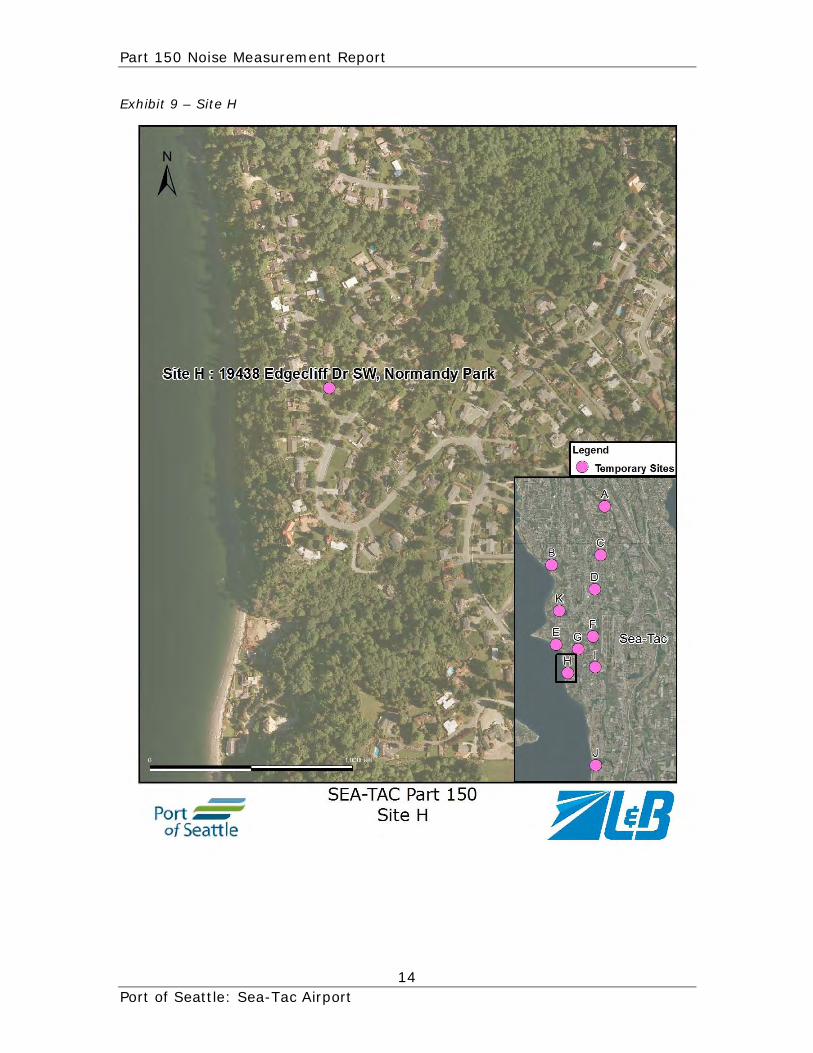
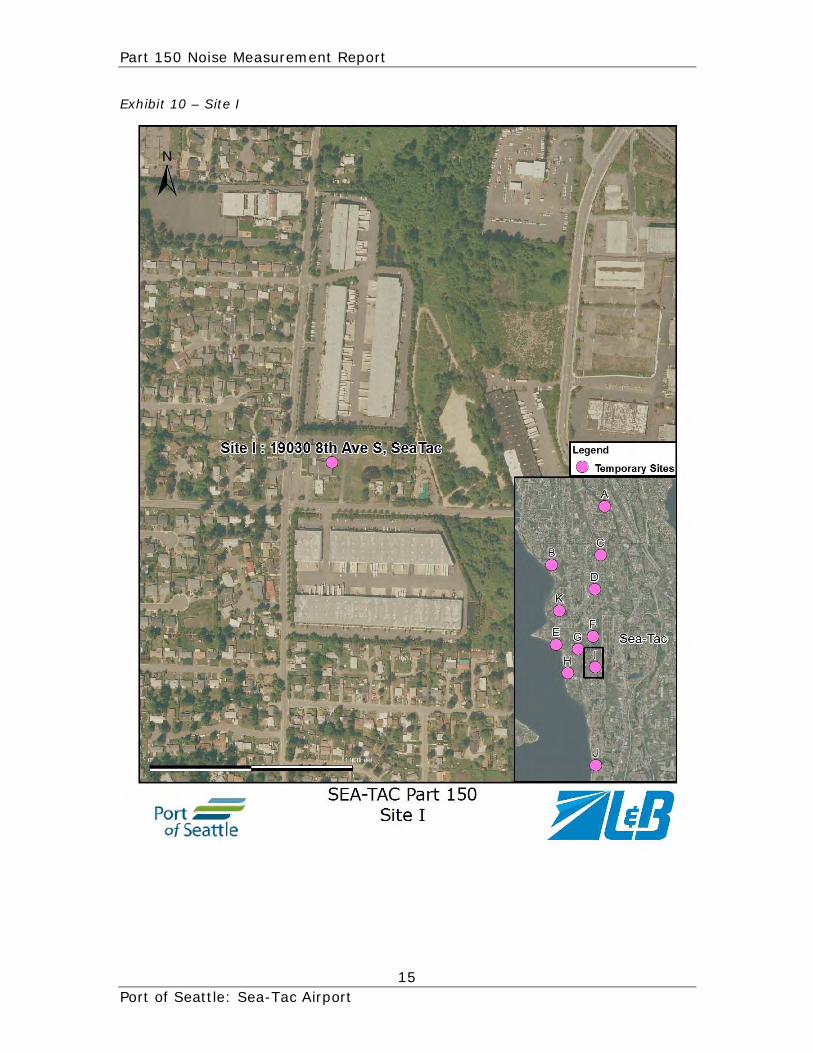
Noise Measurement Methodology Equipment Type State of the art equipment used in this program included the Bruel & Kajer model 2238 and the Larson Davis 824 sound level meters. These are Class I Precision Sound Level Meters (as defined by American National Standards Institute (ANSI) and International Electrotechnical Commission (IEC)). The equipment was calibrated in compliance with manufacturer's procedures. Microphones and recording equipment are the highest quality and are capable of recording and calculating the various noise metrics. Each meter logged noise levels every second in terms of the one-second equivalent noise level, Leq. Noise Measurement Sites Sites for the temporary noise measurements included single-family residences and public churches and were chosen to supplement the existing network of permanent airport noise monitors. The microphones were placed in backyards, decks, or roofs with clear line of sight to aircraft flight patterns. Table 1a – Temporary Noise Measurement Sites lists the residences and churches where the temporary noise measurement microphones were located. Table 1b – Airport Permanent Noise Monitors lists the locations of the airport’s permanent monitors. Exhibit 1 – Noise Measurement Site Map illustrates the locations of the temporary noise measurement sites and the nearby permanent airport noise monitors as reference. Exhibits 2 thru 14 illustrate each noise measurement site on detailed maps and inset maps as reference. Table 1a – Temporary Noise Measurement Sites
Site Address City
A 1046 S Elmgrove St Seattle
B 12112 26th Ave SW Burien
C 11401 10th Ave S Burien
D 537 S 137th Pl Burien
E 17600 Sylvester Rd SW Burien
F 16856 Des Moines Memorial Dr Burien
G 360 SW 178th St Normandy Park
H 19438 Edgecliff Dr SW Normandy Park
I 19030 8th Ave S SeaTac
J 25617 Marine View Dr Des Moines
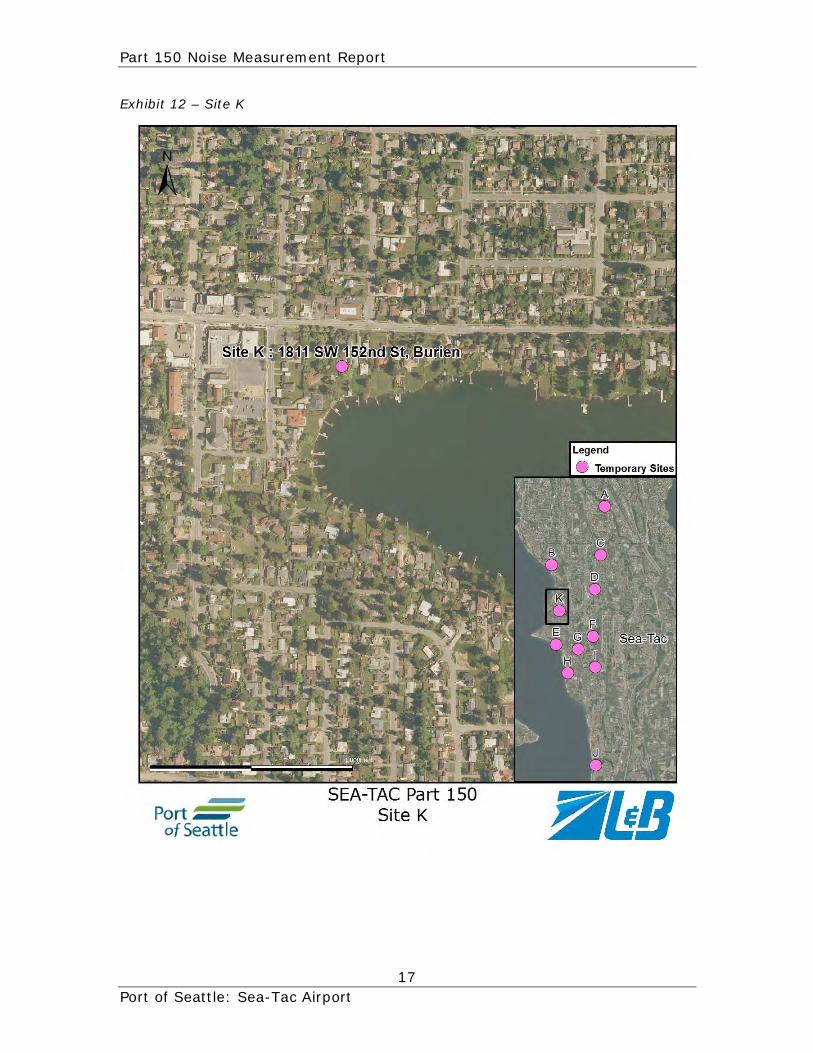
K 1811 SW 152nd St Burien
L 25722 79th Ave SW Vashon
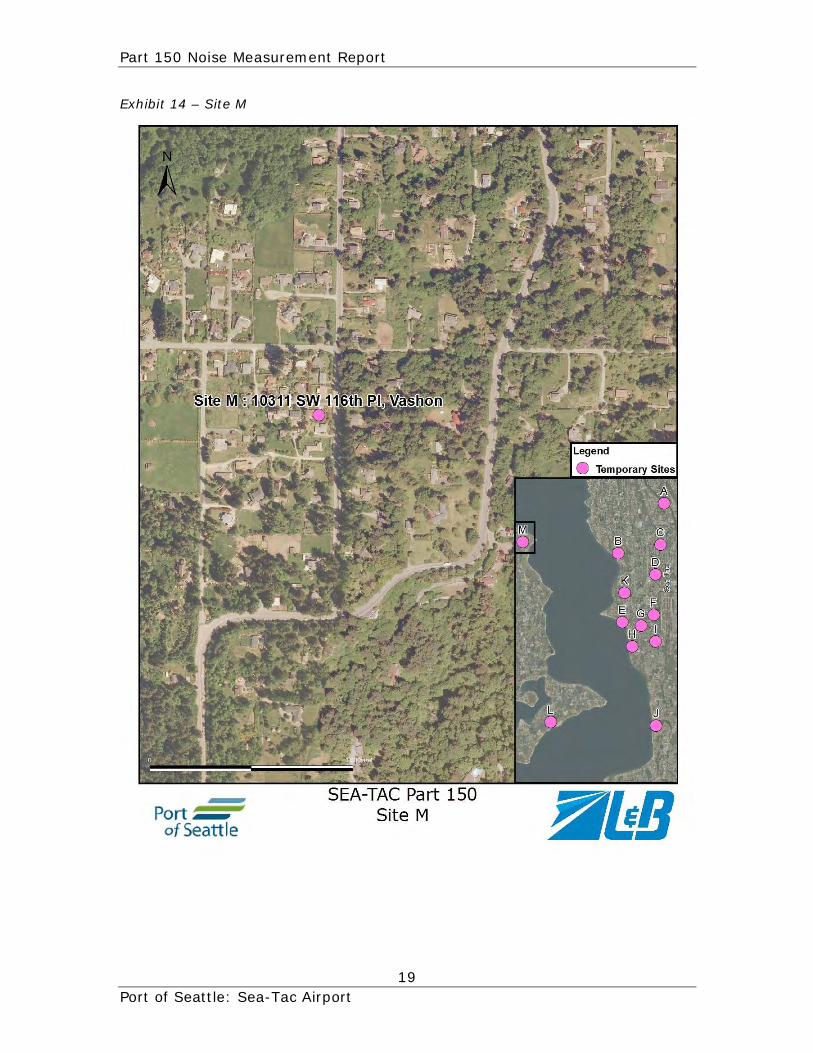
M 10311 SW 116th Pl Vashon
Part 150 Noise Measurement Report
5 Port of Seattle: Sea-Tac Airport
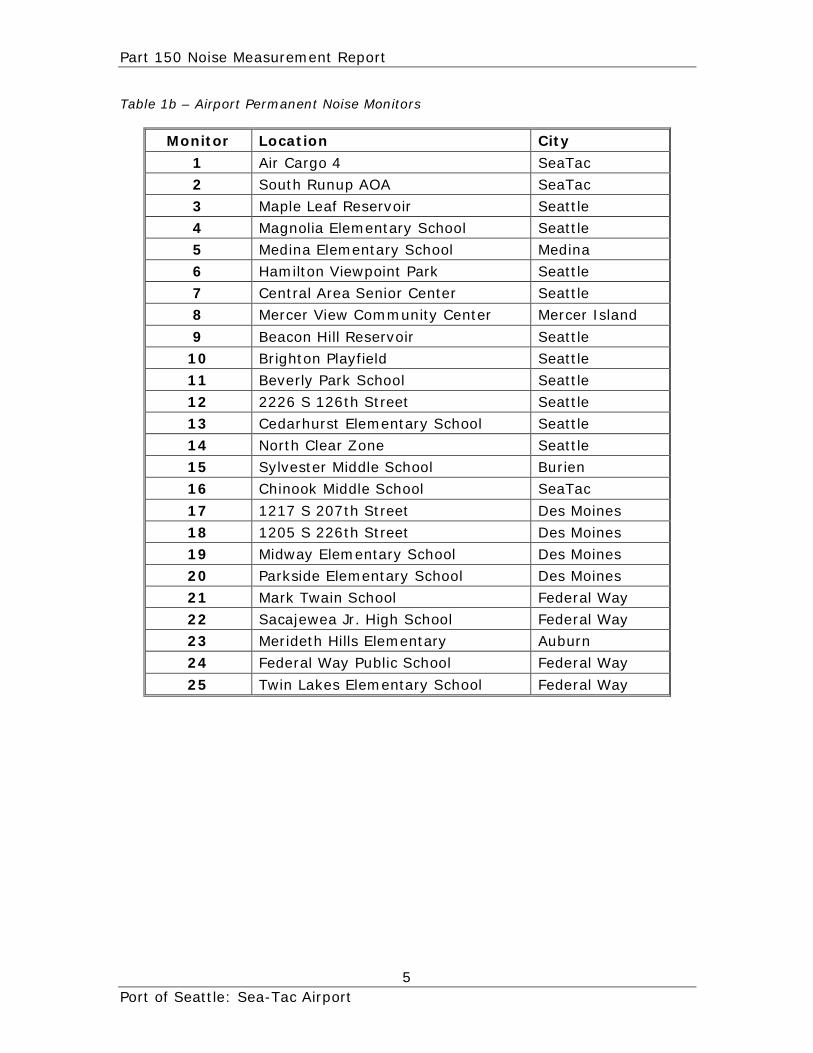
Table 1b – Airport Permanent Noise Monitors
Monitor Location City
1 Air Cargo 4 SeaTac
2 South Runup AOA SeaTac
3 Maple Leaf Reservoir Seattle
4 Magnolia Elementary School Seattle
5 Medina Elementary School Medina
6 Hamilton Viewpoint Park Seattle
7 Central Area Senior Center Seattle
8 Mercer View Community Center Mercer Island
9 Beacon Hill Reservoir Seattle
10 Brighton Playfield Seattle
11 Beverly Park School Seattle
12 2226 S 126th Street Seattle
13 Cedarhurst Elementary School Seattle
14 North Clear Zone Seattle
15 Sylvester Middle School Burien
16 Chinook Middle School SeaTac
17 1217 S 207th Street Des Moines
18 1205 S 226th Street Des Moines
19 Midway Elementary School Des Moines
20 Parkside Elementary School Des Moines
21 Mark Twain School Federal Way
22 Sacajewea Jr. High School Federal Way
23 Merideth Hills Elementary Auburn
24 Federal Way Public School Federal Way
25 Twin Lakes Elementary School Federal Way
Part 150 Noise Measurement Report
6 Port of Seattle: Sea-Tac Airport
Exhibit 1 - Noise Measurement Site Map

Part 150 Noise Measurement Report
7 Port of Seattle: Sea-Tac Airport
Exhibit 2 – Site A
Part 150 Noise Measurement Report
8 Port of Seattle: Sea-Tac Airport
Exhibit 3 – Site B

Part 150 Noise Measurement Report
9 Port of Seattle: Sea-Tac Airport
Exhibit 4 – Site C

Part 150 Noise Measurement Report
10 Port of Seattle: Sea-Tac Airport
Exhibit 5 – Site D

Part 150 Noise Measurement Report
11 Port of Seattle: Sea-Tac Airport
Exhibit 6 – Site E

Part 150 Noise Measurement Report
12 Port of Seattle: Sea-Tac Airport
Exhibit 7 – Site F
Part 150 Noise Measurement Report
13 Port of Seattle: Sea-Tac Airport
Exhibit 8 – Site G
Part 150 Noise Measurement Report
14 Port of Seattle: Sea-Tac Airport
Exhibit 9 – Site H
Part 150 Noise Measurement Report
15 Port of Seattle: Sea-Tac Airport
Exhibit 10 – Site I

Part 150 Noise Measurement Report
16 Port of Seattle: Sea-Tac Airport
Exhibit 11 – Site J
Part 150 Noise Measurement Report
17 Port of Seattle: Sea-Tac Airport
Exhibit 12 – Site K

Part 150 Noise Measurement Report
18 Port of Seattle: Sea-Tac Airport
Exhibit 13 – Site L
Part 150 Noise Measurement Report
19 Port of Seattle: Sea-Tac Airport
Exhibit 14 – Site M
Part 150 Noise Measurement Report
20 Port of Seattle: Sea-Tac Airport
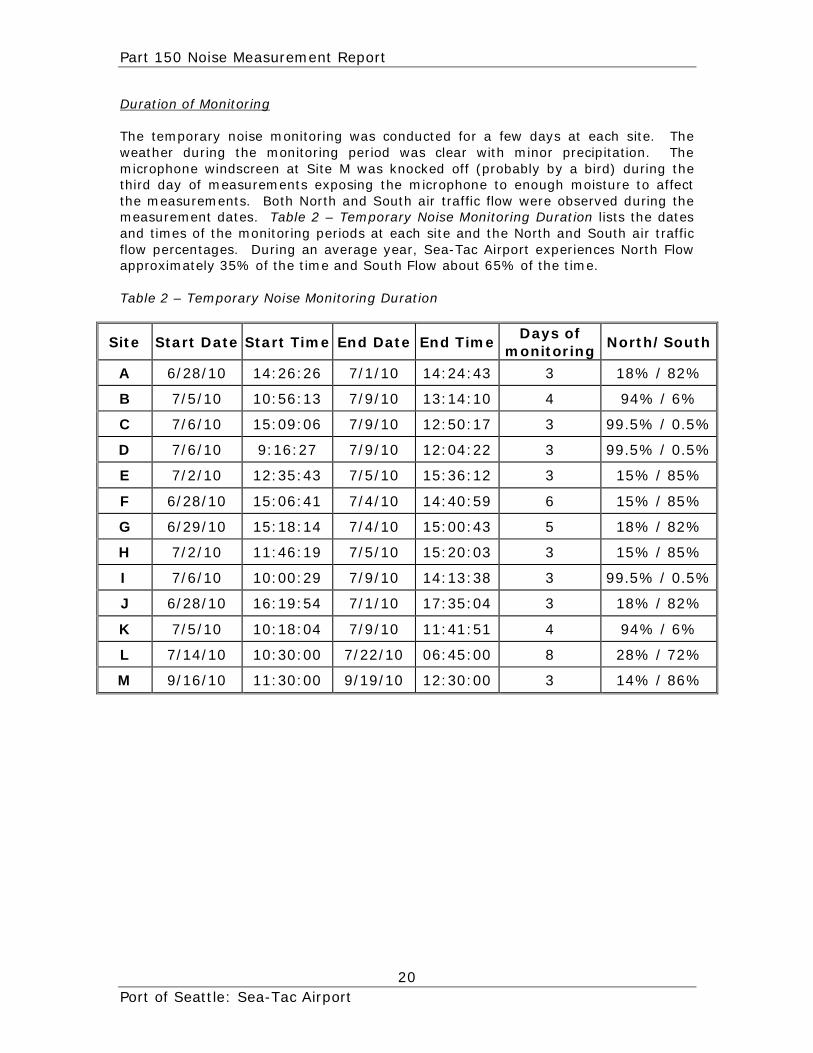
Duration of Monitoring The temporary noise monitoring was conducted for a few days at each site. The weather during the monitoring period was clear with minor precipitation. The microphone windscreen at Site M was knocked off (probably by a bird) during the third day of measurements exposing the microphone to enough moisture to affect the measurements. Both North and South air traffic flow were observed during the measurement dates. Table 2 – Temporary Noise Monitoring Duration lists the dates and times of the monitoring periods at each site and the North and South air traffic flow percentages. During an average year, Sea-Tac Airport experiences North Flow approximately 35% of the time and South Flow about 65% of the time. Table 2 – Temporary Noise Monitoring Duration
Site Start Date Start Time End Date End Time Days of
monitoring North/South
A 6/28/10 14:26:26 7/1/10 14:24:43 3 18% / 82%
B 7/5/10 10:56:13 7/9/10 13:14:10 4 94% / 6%
C 7/6/10 15:09:06 7/9/10 12:50:17 3 99.5% / 0.5%
D 7/6/10 9:16:27 7/9/10 12:04:22 3 99.5% / 0.5%
E 7/2/10 12:35:43 7/5/10 15:36:12 3 15% / 85%
F 6/28/10 15:06:41 7/4/10 14:40:59 6 15% / 85%
G 6/29/10 15:18:14 7/4/10 15:00:43 5 18% / 82%
H 7/2/10 11:46:19 7/5/10 15:20:03 3 15% / 85%
I 7/6/10 10:00:29 7/9/10 14:13:38 3 99.5% / 0.5%
J 6/28/10 16:19:54 7/1/10 17:35:04 3 18% / 82%
K 7/5/10 10:18:04 7/9/10 11:41:51 4 94% / 6%
L 7/14/10 10:30:00 7/22/10 06:45:00 8 28% / 72%
M 9/16/10 11:30:00 9/19/10 12:30:00 3 14% / 86%
Part 150 Noise Measurement Report
21 Port of Seattle: Sea-Tac Airport
Methods for Noise Event Correlation Measured noise events were matched with specific aircraft operations using the following two-step method: 1) Once data was downloaded, noise levels greater than 60 dB for duration longer that 3 seconds were identified as individual noise events. 2) Using the flight data from the airport noise and operations monitoring system, noise events that occurred while aircraft flew within 1.9 nm (4 nm at Site I) from the measurement site were correlated and classified as aircraft noise events. The airport’s permanent monitors use a similar correlation distance setting. Although this method provided positive identification of aircraft operations and highly accurate correlation with measured noise events, some community noise (e.g. cars, lawnmowers, animals) and aircraft noise occurred simultaneously and correlated as aircraft noise events. Unfortunately, there is currently no technology to separate aircraft noise levels from simultaneous non-aircraft noise levels.

Part 150 Noise Measurement Report
22 Port of Seattle: Sea-Tac Airport
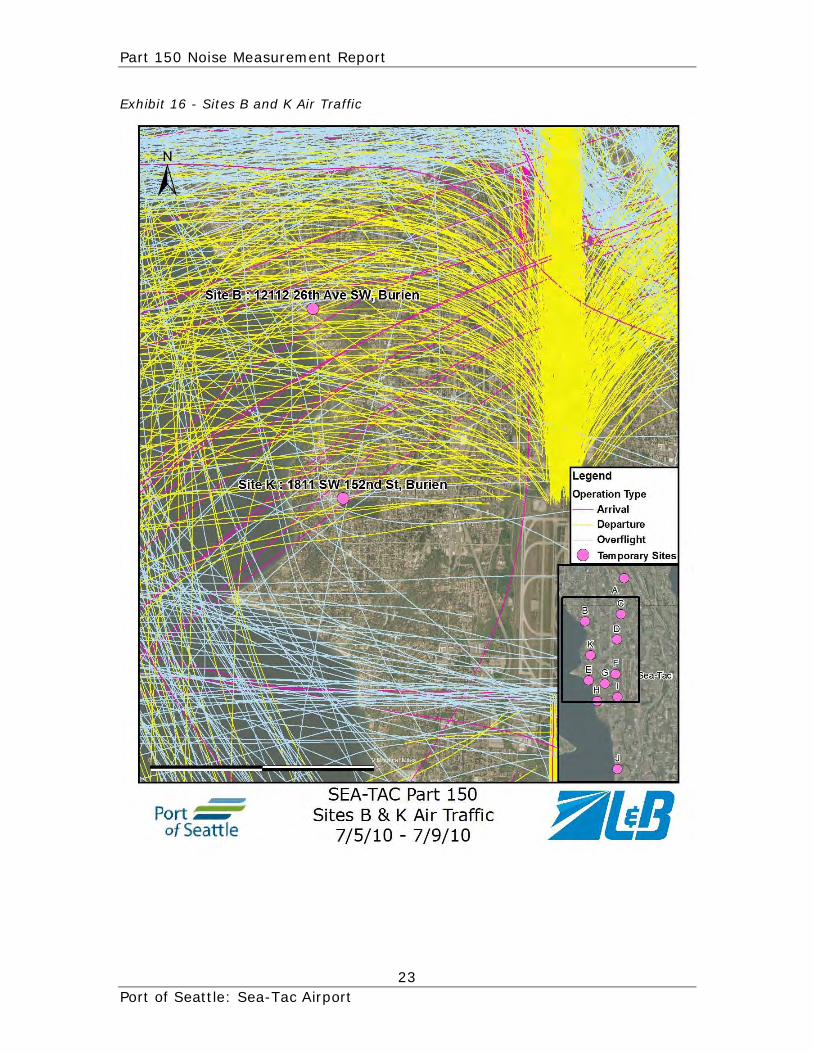
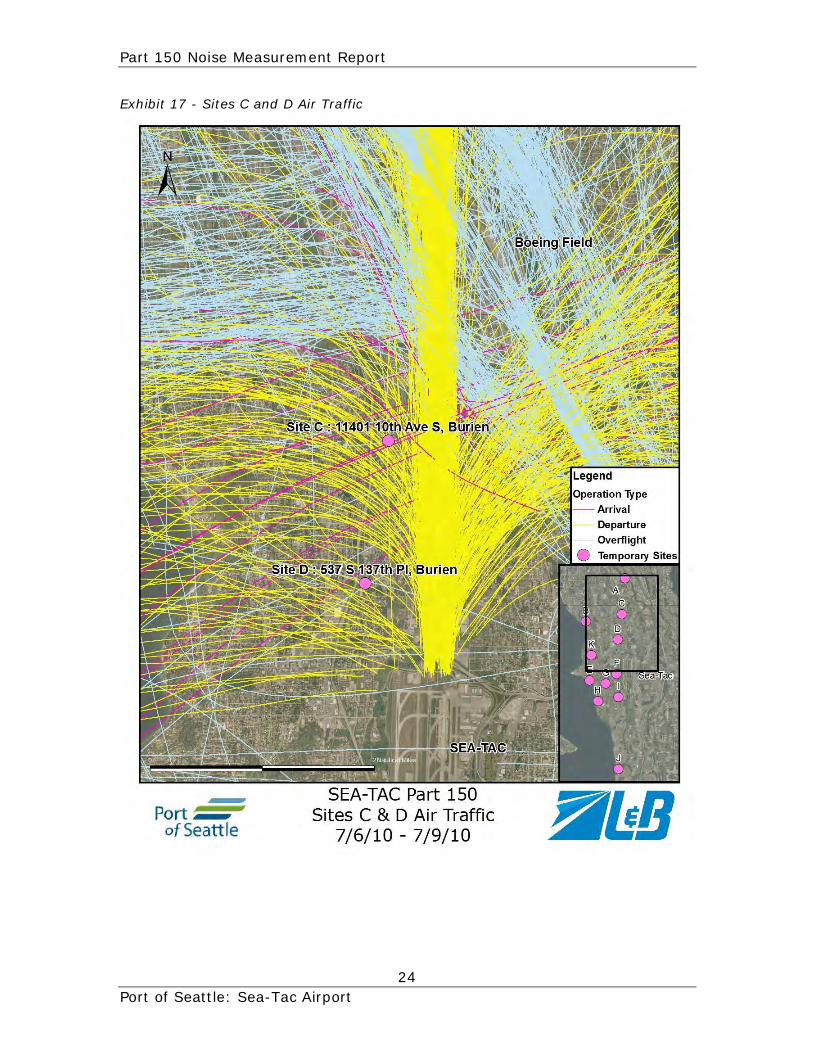
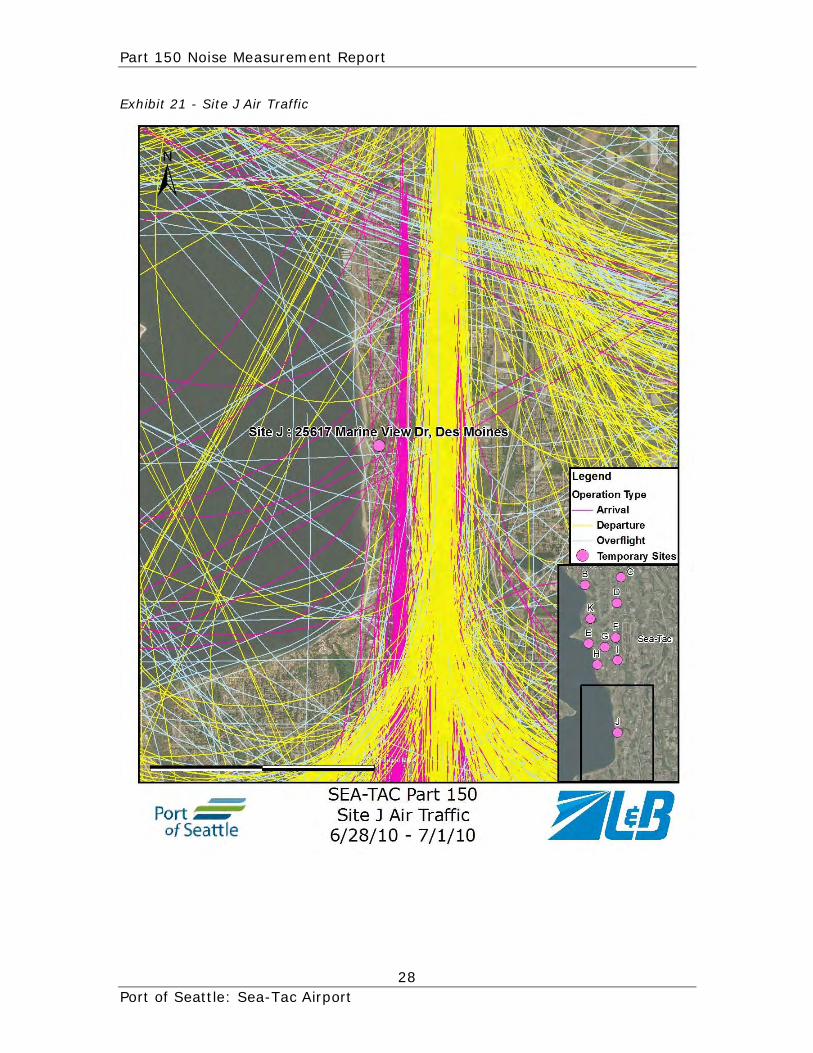
Air Traffic Maps The following Exhibits 15 thru 25 illustrate the paths and flight patterns used by aircraft near each site during the respective measurement period and inset maps as reference. Each map shows flight tracks for multiple days. The radar flight track data was supplied by the airport noise monitoring system. The flight track colors represent different aircraft operation types shown on the map legends. Exhibit 15 - Site A Air Traffic
Part 150 Noise Measurement Report
23 Port of Seattle: Sea-Tac Airport
Exhibit 16 - Sites B and K Air Traffic
Part 150 Noise Measurement Report
24 Port of Seattle: Sea-Tac Airport
Exhibit 17 - Sites C and D Air Traffic

Part 150 Noise Measurement Report
25 Port of Seattle: Sea-Tac Airport
Exhibit 18 - Sites E and H Air Traffic

Part 150 Noise Measurement Report
26 Port of Seattle: Sea-Tac Airport
Exhibit 19 - Sites F and G Air Traffic

Part 150 Noise Measurement Report
27 Port of Seattle: Sea-Tac Airport
Exhibit 20 - Site I Air Traffic
Part 150 Noise Measurement Report
28 Port of Seattle: Sea-Tac Airport
Exhibit 21 - Site J Air Traffic

Part 150 Noise Measurement Report
29 Port of Seattle: Sea-Tac Airport
Exhibit 22 - Site L Air Traffic (7/14/10 - 7/16/10)

Part 150 Noise Measurement Report
30 Port of Seattle: Sea-Tac Airport
Exhibit 23 - Site L Air Traffic (7/17/10 - 7/19/10)

Part 150 Noise Measurement Report
31 Port of Seattle: Sea-Tac Airport
Exhibit 24 - Site L Air Traffic (7/20/10 - 7/22/10)

Part 150 Noise Measurement Report
32 Port of Seattle: Sea-Tac Airport
Exhibit 25 - Site M Air Traffic

Part 150 Noise Measurement Report
33 Port of Seattle: Sea-Tac Airport
Noise Measurement Results Noise level readings were used to characterize the noise environment at each location and to distinguish the various noise levels associated with individual aircraft operations. Ambient Noise Levels The data collected during the measurements can be summarized as a noise environment in terms of the noise level exceeded 10%, 50%, and 90% of the time and designated as L10, L50, L90, respectively. The L10 is the noise level exceeded 10% of the time and represents the typical peak noise level. The L50 is the median noise level. L90 is the noise level exceeded 90% of the time. The L90 is a good approximation of the background noise level, i.e., the noise level that would occur in the absence of identifiable noise events. Table 3 – Ambient Noise Levels by Temporary Site lists the L10, L50, and L90 levels at each measurement site. Table 3 – Ambient Noise Levels by Temporary Site
Site L10 (dB) L50 (dB) L90 (dB)
A 63.4 53.6 49.6
B 53.6 42.9 30.9
C 63.0 54.9 48.6
D 60.6 54.3 47.2
E 48.8 40.9 33.3
F 55.3 50.4 42.2
G 45.1 38.0 29.7
H 51.7 42.6 29.9
I 64.1 55.9 50.6
J 60.7 47.4 32.6
K 49.7 43.4 36.5
L * * *
M 62.9 54.9 35.3
* Site L measurements had computer problems that prevented the storage of noise levels not part of a distinct noise event and therefore background noise levels were not recorded.
Part 150 Noise Measurement Report
34 Port of Seattle: Sea-Tac Airport
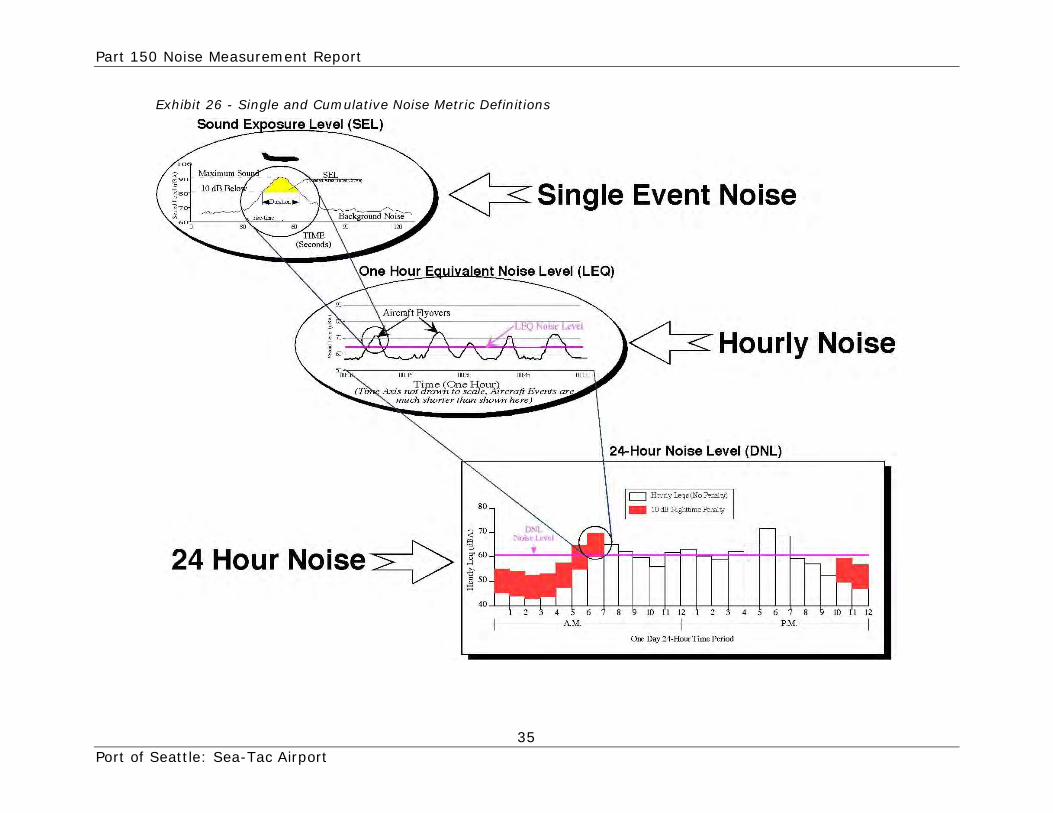
Aircraft Noise The noise measurement process was designed to capture the noise levels of a representative mix of aircraft operations near the measurement sites that includes various general aviation, commuter, and air carrier operations from Sea-Tac, Boeing Field, and transient aircraft operations from other airports. Non Sea-Tac aircraft were included in this study to capture the noise impact from all aircraft operations at each measurement site. At each site, the majority of aircraft noise events were Sea-Tac operations. Sound Rating Scales The description, analysis, and reporting of community sound levels is made difficult by the complexity of human response to sound and the myriad of sound-rating scales and metrics that have been developed for describing acoustic effects. Various rating scales have been devised to approximate the human subjective assessment of "loudness" or "noisiness" of a sound. Noise metrics can be categorized as single event metrics and cumulative metrics. Single event metrics describe the noise from individual events, such as an aircraft flyover. Cumulative metrics describe the noise in terms of the total noise exposure throughout the day, year or other time period. The noise metrics used in this study are summarized below: Single Event Metrics
• Maximum Noise Level. The highest noise level reached during a noise event is called the "Highest Noise Level," or Lmax. For example, as an aircraft approaches, the sound of the aircraft begins to rise above ambient noise levels. The closer the aircraft gets, the louder it is until the aircraft is at its closest point. As the aircraft passes, the noise level decreases until the sound level settles to ambient levels. This is plotted at the top of Exhibit 26 - Single and Cumulative Noise Metric Definitions. It is the Lmax metric to which people generally respond when an aircraft flyover occurs.
• Sound Exposure Level (SEL). The SEL is a common metric reported for
aircraft flyovers. It is computed from dBA sound levels during the noise event (referring to the shaded area at the top of Exhibit 26). This metric takes into account the maximum noise level of the event and the duration of the event. The SEL value is the sum of all the acoustic energy over the duration of noise event. For example, an aircraft flyover with a duration of 12 seconds within 10 dBA of the Lmax and an Lmax of 75 dBA would typically have an SEL of 85 dBA. The SEL value for a typical aircraft flyover is about 10 dBA higher than the maximum noise level (Lmax). Speech interference is often reported in terms of Lmax and sleep interference research is generally assessed relative to SEL data. Single event metrics are a convenient method for describing noise from individual aircraft events. This metric is useful in that airport noise models contain aircraft noise data based upon the SEL metric. In addition, cumulative noise metrics such as Leq and DNL are computed from SEL.
Part 150 Noise Measurement Report
35 Port of Seattle: Sea-Tac Airport
Exhibit 26 - Single and Cumulative Noise Metric Definitions

Part 150 Noise Measurement Report
36 Port of Seattle: Sea-Tac Airport
Cumulative Metrics Cumulative noise metrics have been developed to assess community response to noise. They are useful because these scales attempt to include the loudness and duration of the noise, the total number of noise events and the time of day these events occur into one single number rating scale. They are designed to account for the known health effects of noise on people.
• Equivalent Noise Level (Leq). Leq is the sound level corresponding to a steady-state A-weighted sound level containing the same total energy as a time-varying signal over a given sample period. Leq is the "energy" average taken from the sum of all the sound that occurs during a certain time period; however, it is based on the observation that the potential for a noise to impact people is dependent upon the total acoustical energy content. This is graphically illustrated in the middle graph of Exhibit 26. Leq can be measured for any time period, but is typically measured for 15 minutes, 1 hour or 24-hours. Leq levels for 24 continuous one-hour periods are used to develop the Day Night Noise Level (DNL) values for aircraft operations.
• Day Night Noise Level (DNL). The DNL index is a measure of the overall
noise experienced during an entire (24-hour) day; which includes time-weighted energy average noise level based on the A-weighted decibel. Time-weighted refers to the fact that noise that occurs during certain sensitive time periods and is penalized for occurring at these times. In the DNL scale, noise occurring between the hours of 10 p.m. to 7 a.m. is penalized by 10 dB. This penalty was selected to account for the higher sensitivity to noise in the nighttime hours and the expected further decrease in background noise levels that typically occur at night. DNL is specified by the Federal Aviation Administration (FAA) for community and airport noise assessment as well as the Environmental Protection Agency (EPA). The FAA requires that the DNL metric be used to measure noise exposure in FAR Part 150 Studies. DNL is graphically illustrated in the bottom of Exhibit 26.

Part 150 Noise Measurement Report
37 Port of Seattle: Sea-Tac Airport
Aircraft Single Event Maximum Noise Level Results Individual aircraft noise events were measured using the Maximum Noise Level (Lmax). Charts 1 thru 11 Site Measured Maximum Noise Level graphically represent the highest or maximum Lmax and the average Lmax recorded for each type of aircraft operation at measurement sites that had 3 or more noise events per aircraft type recorded. Sites E and G captured less than 3 aircraft noise measurements per aircraft type. Some of the Highest Lmax Noise Levels are much higher than the Average Lmax due to community (non-aircraft) noise that occurred during the aircraft flyover. Appendix 1 - Measured Aircraft Noise Events provides these data in tabular form showing the number (count) of noise events and the energy average Sound Exposure Level (SEL) for each aircraft type. Unknown Aircraft type was give to aircraft types that were not identified by the airport noise system. Unknown Aircraft operations are usually made by General Aviation propeller aircraft. Chart 1
Site A : 1046 S Elmgrove St, Seattle

Part 150 Noise Measurement Report
38 Port of Seattle: Sea-Tac Airport
Chart 2
Site B : 12112 26th Ave SW, Burien
Chart 3
Site C : 11401 10th Ave S, Burien

Part 150 Noise Measurement Report
39 Port of Seattle: Sea-Tac Airport
Chart 4
Site D : 537 S 137th Pl, Burien
Chart 5
Site F : 16856 Des Moines Memorial Dr, Burien

Part 150 Noise Measurement Report
40 Port of Seattle: Sea-Tac Airport
Chart 6
Site H : 19438 Edgecliff Dr SW, Normandy Park
Chart 7
Site I : 19030 8th Ave S, SeaTac

Part 150 Noise Measurement Report
41 Port of Seattle: Sea-Tac Airport
Chart 8
Site J : 25617 Marine View Dr, Des Moines
Chart 9
Site K : 1811 SW 152nd St, Burien

Part 150 Noise Measurement Report
42 Port of Seattle: Sea-Tac Airport
Chart 10
Site L : 25722 79th Ave SW, Vashon
Chart 11
Site M: 10311 SW 116th PL, Vashon
Part 150 Noise Measurement Report
43 Port of Seattle: Sea-Tac Airport
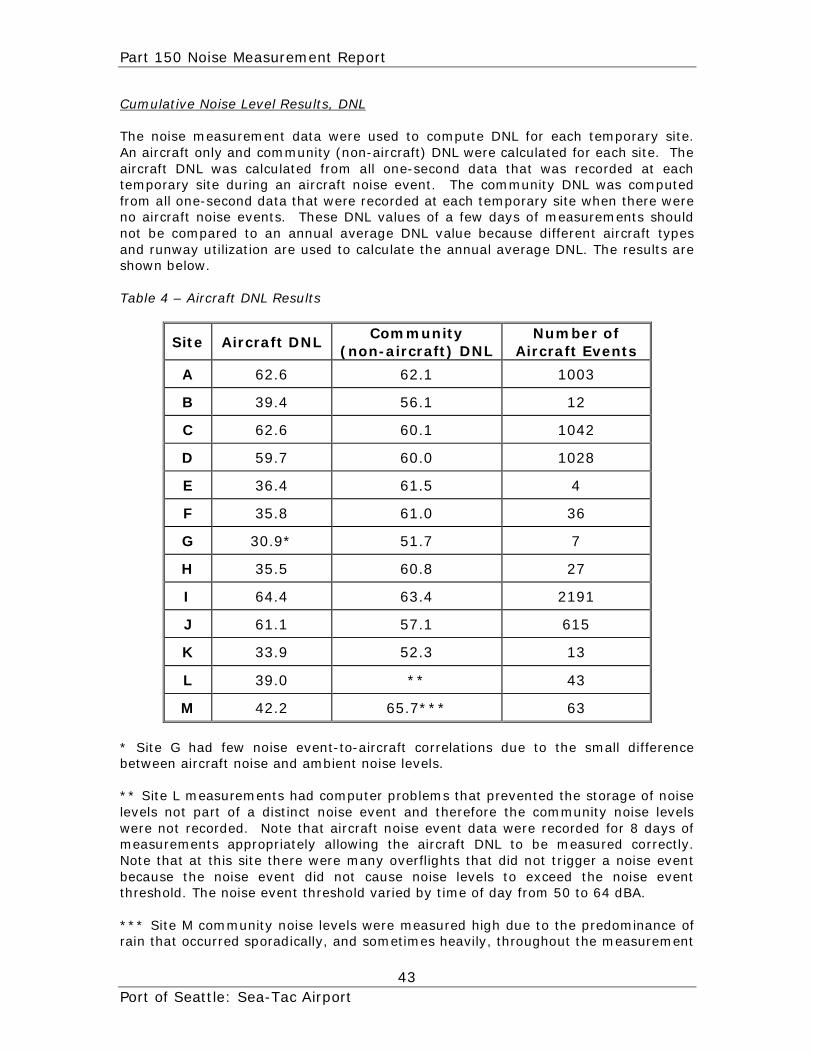
Cumulative Noise Level Results, DNL The noise measurement data were used to compute DNL for each temporary site. An aircraft only and community (non-aircraft) DNL were calculated for each site. The aircraft DNL was calculated from all one-second data that was recorded at each temporary site during an aircraft noise event. The community DNL was computed from all one-second data that were recorded at each temporary site when there were no aircraft noise events. These DNL values of a few days of measurements should not be compared to an annual average DNL value because different aircraft types and runway utilization are used to calculate the annual average DNL. The results are shown below.
Table 4 – Aircraft DNL Results
Site Aircraft DNL Community
(non-aircraft) DNL Number of
Aircraft Events
A 62.6 62.1 1003
B 39.4 56.1 12
C 62.6 60.1 1042
D 59.7 60.0 1028
E 36.4 61.5 4
F 35.8 61.0 36
G 30.9* 51.7 7
H 35.5 60.8 27
I 64.4 63.4 2191
J 61.1 57.1 615
K 33.9 52.3 13
L 39.0 ** 43
M 42.2 65.7*** 63
* Site G had few noise event-to-aircraft correlations due to the small difference between aircraft noise and ambient noise levels. ** Site L measurements had computer problems that prevented the storage of noise levels not part of a distinct noise event and therefore the community noise levels were not recorded. Note that aircraft noise event data were recorded for 8 days of measurements appropriately allowing the aircraft DNL to be measured correctly. Note that at this site there were many overflights that did not trigger a noise event because the noise event did not cause noise levels to exceed the noise event threshold. The noise event threshold varied by time of day from 50 to 64 dBA. *** Site M community noise levels were measured high due to the predominance of rain that occurred sporadically, and sometimes heavily, throughout the measurement

Part 150 Noise Measurement Report
44 Port of Seattle: Sea-Tac Airport
period. Raindrops impacting the home roof and spa cover, and road traffic on wet pavement caused background noise levels to be higher than the ambient would have been had it not been raining. During dry periods, ambient levels as low as 30 dBA were recorded. However, the sound level meter had a lower measurement limit of 30 dBA. So during some periods, the measurement site was quieter than 30 dBA, a very low noise level. Note that at this site there were many overflights that did not trigger a noise event because the noise event did not cause noise levels to exceed the noise event threshold, which was set at 60 dBA.
Part 150 Noise Measurement Report
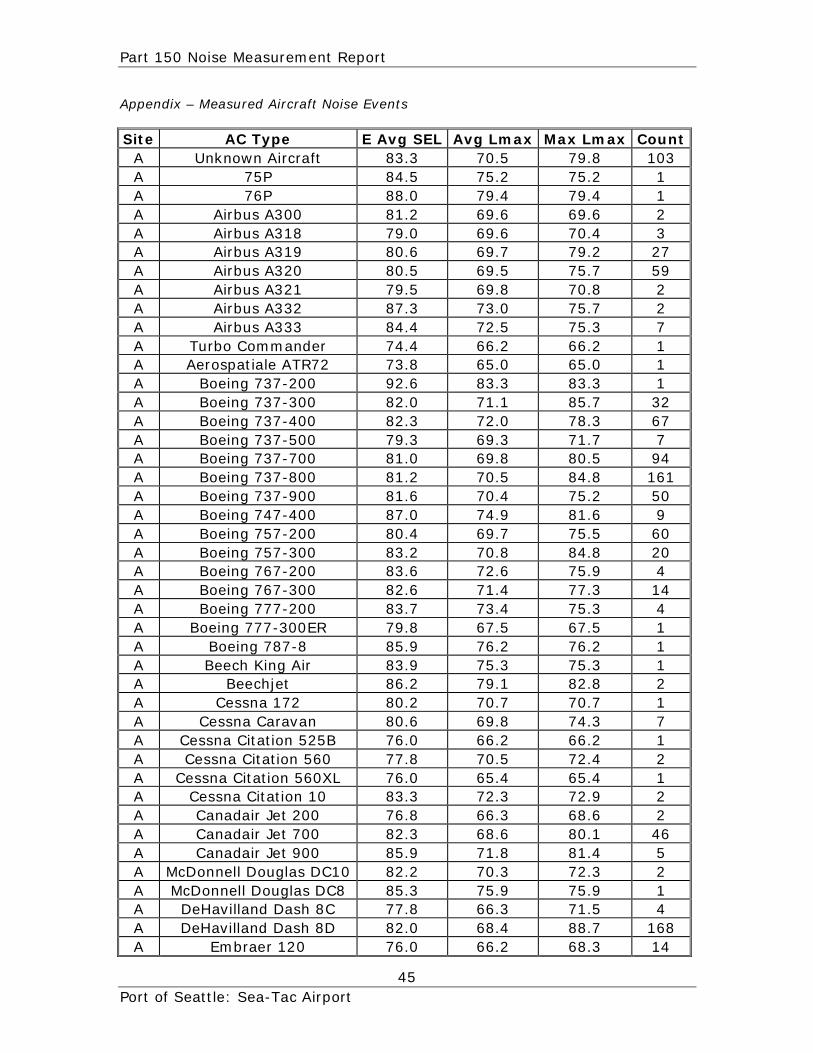
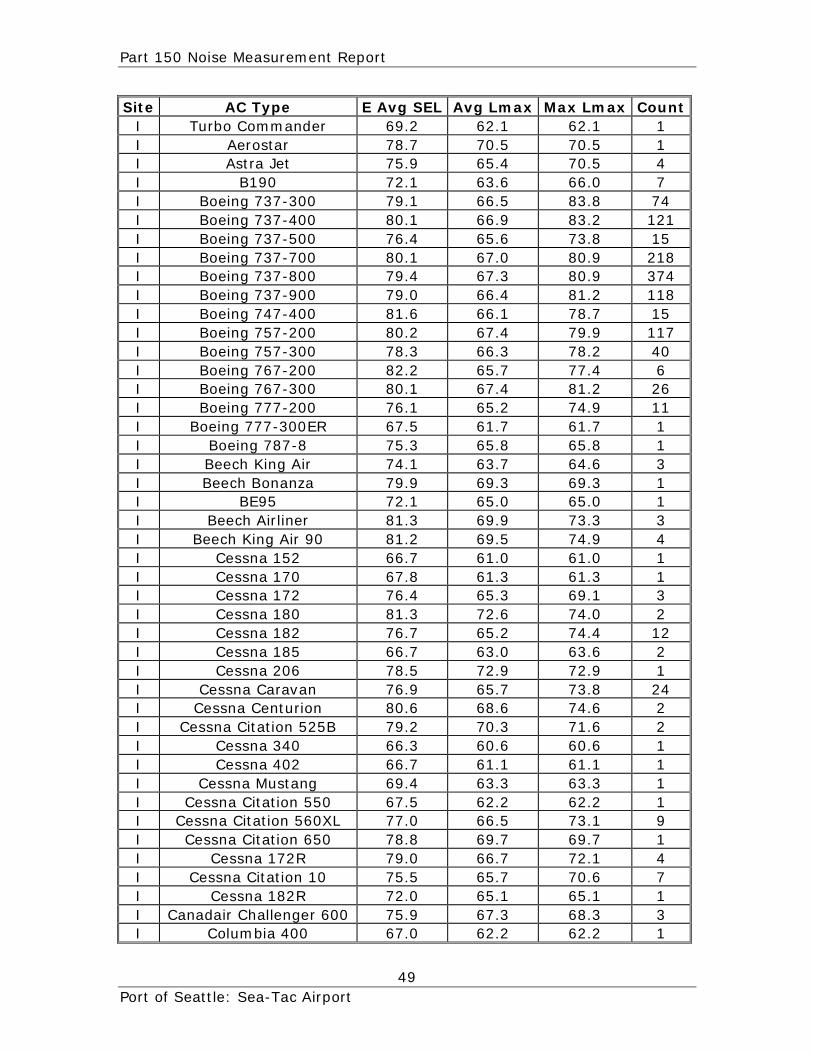
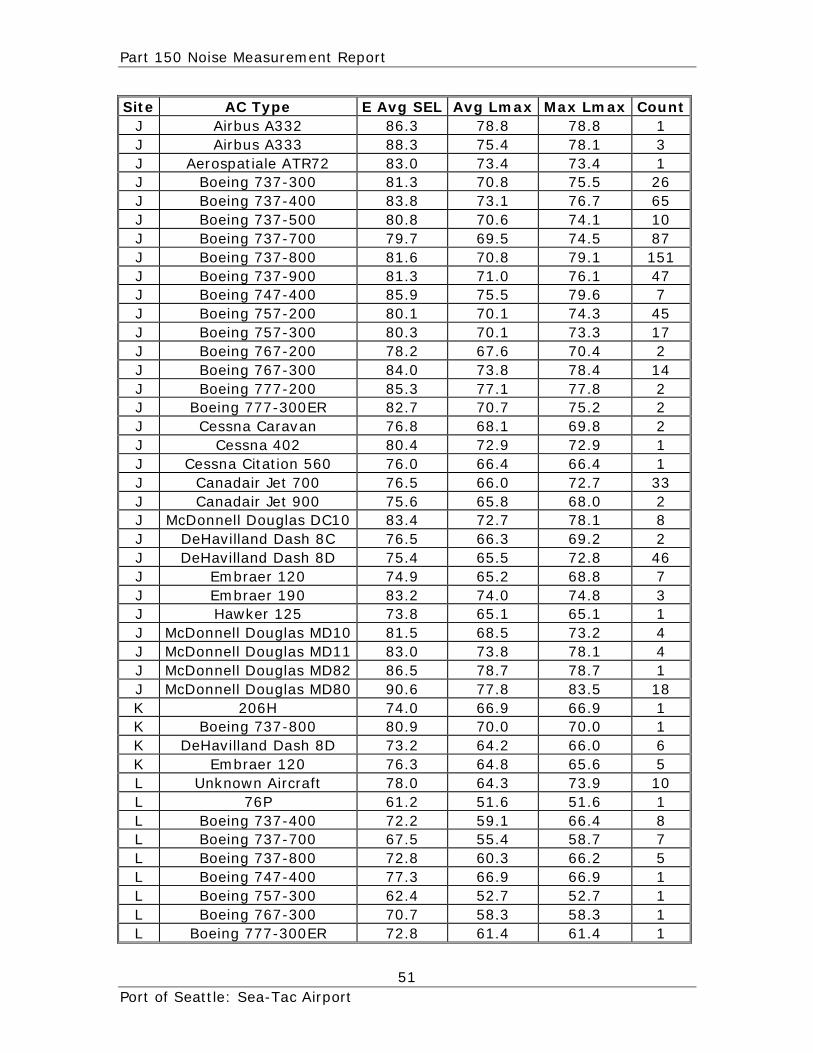
45 Port of Seattle: Sea-Tac Airport
Appendix – Measured Aircraft Noise Events Site AC Type E Avg SEL Avg Lmax Max Lmax Count
A Unknown Aircraft 83.3 70.5 79.8 103 A 75P 84.5 75.2 75.2 1 A 76P 88.0 79.4 79.4 1 A Airbus A300 81.2 69.6 69.6 2 A Airbus A318 79.0 69.6 70.4 3 A Airbus A319 80.6 69.7 79.2 27 A Airbus A320 80.5 69.5 75.7 59 A Airbus A321 79.5 69.8 70.8 2 A Airbus A332 87.3 73.0 75.7 2 A Airbus A333 84.4 72.5 75.3 7 A Turbo Commander 74.4 66.2 66.2 1 A Aerospatiale ATR72 73.8 65.0 65.0 1 A Boeing 737-200 92.6 83.3 83.3 1 A Boeing 737-300 82.0 71.1 85.7 32 A Boeing 737-400 82.3 72.0 78.3 67 A Boeing 737-500 79.3 69.3 71.7 7 A Boeing 737-700 81.0 69.8 80.5 94 A Boeing 737-800 81.2 70.5 84.8 161 A Boeing 737-900 81.6 70.4 75.2 50 A Boeing 747-400 87.0 74.9 81.6 9 A Boeing 757-200 80.4 69.7 75.5 60 A Boeing 757-300 83.2 70.8 84.8 20 A Boeing 767-200 83.6 72.6 75.9 4 A Boeing 767-300 82.6 71.4 77.3 14 A Boeing 777-200 83.7 73.4 75.3 4 A Boeing 777-300ER 79.8 67.5 67.5 1 A Boeing 787-8 85.9 76.2 76.2 1 A Beech King Air 83.9 75.3 75.3 1 A Beechjet 86.2 79.1 82.8 2 A Cessna 172 80.2 70.7 70.7 1 A Cessna Caravan 80.6 69.8 74.3 7 A Cessna Citation 525B 76.0 66.2 66.2 1 A Cessna Citation 560 77.8 70.5 72.4 2 A Cessna Citation 560XL 76.0 65.4 65.4 1 A Cessna Citation 10 83.3 72.3 72.9 2 A Canadair Jet 200 76.8 66.3 68.6 2 A Canadair Jet 700 82.3 68.6 80.1 46 A Canadair Jet 900 85.9 71.8 81.4 5 A McDonnell Douglas DC10 82.2 70.3 72.3 2 A McDonnell Douglas DC8 85.3 75.9 75.9 1 A DeHavilland Dash 8C 77.8 66.3 71.5 4 A DeHavilland Dash 8D 82.0 68.4 88.7 168 A Embraer 120 76.0 66.2 68.3 14

Part 150 Noise Measurement Report
46 Port of Seattle: Sea-Tac Airport
Site AC Type E Avg SEL Avg Lmax Max Lmax Count A Embraer 190 75.9 66.4 68.1 5 A Dassault Falcon 900 79.7 71.2 71.2 1 A Gulfstream 3 70.0 63.1 63.1 1 A Gulfstream 5 84.5 75.1 75.1 1 A Hawker 125 76.1 66.9 66.9 1 A Lear Jet 35 78.3 66.8 66.8 1 A McDonnell Douglas MD10 84.2 72.9 74.8 2 A McDonnell Douglas MD11 86.3 75.4 77.7 3 A McDonnell Douglas MD80 84.3 71.1 80.8 19 A Air Beetle 76.8 65.7 65.7 1 A Westwind 1124 83.1 72.1 72.1 1 B Unknown Aircraft 91.0 73.8 77.4 4 B DeHavilland Dash 8D 74.8 65.6 73.5 9 B Embraer 120 99.3 72.5 81.3 2 C Unknown Aircraft 81.9 70.8 75.8 24 C Airbus A300 84.6 74.6 76.6 3 C Airbus A318 80.0 68.9 70.8 3 C Airbus A319 80.4 69.1 72.4 31 C Airbus A320 80.9 70.2 74.5 89 C Airbus A321 82.5 72.4 72.4 2 C Airbus A332 84.0 73.9 74.7 2 C Airbus A333 84.6 73.0 75.3 6 C Airbus A343 89.4 78.5 78.5 1 C Astra Jet 80.8 70.2 70.2 1 C Aerospatiale ATR72 73.0 64.7 64.7 1 C Boeing 737-300 82.6 73.0 76.4 37 C Boeing 737-400 83.7 74.0 78.4 75 C Boeing 737-500 82.9 73.3 75.6 11 C Boeing 737-700 81.8 71.2 76.9 140 C Boeing 737-800 81.9 71.4 78.1 238 C Boeing 737-900 82.6 72.3 77.9 69 C Boeing 747-400 89.1 78.2 82.2 11 C Boeing 757-200 80.9 70.2 76.5 73 C Boeing 757-300 80.5 70.1 72.9 26 C Boeing 767-300 85.7 76.0 80.1 19 C Boeing 777-200 84.5 73.5 75.3 7 C Boeing 777-300ER 84.8 75.5 75.5 1 C Cessna Caravan 73.3 63.3 63.8 2 C Cessna Citation 560 86.4 74.3 74.3 1 C Cessna Citation 560XL 69.3 63.1 63.1 1 C Cessna Citation 10 74.3 66.8 66.8 1 C Canadair Jet 100 73.1 63.9 66.6 4 C Canadair Jet 700 76.2 65.4 69.0 53 C Canadair Jet 900 76.9 67.0 68.7 7

Part 150 Noise Measurement Report
47 Port of Seattle: Sea-Tac Airport
Site AC Type E Avg SEL Avg Lmax Max Lmax Count C McDonnell Douglas DC10 85.3 74.4 78.6 8 C DeHavilland Dash 8C 67.7 61.0 61.0 1 C DeHavilland Dash 8D 83.1 63.9 75.5 51 C Embraer 120 67.3 61.4 61.8 2 C Embraer 190 82.8 72.8 75.8 9 C Dassault Falcon 50 85.9 71.9 71.9 1 C McDonnell Douglas MD10 86.6 74.7 76.8 2 C McDonnell Douglas MD11 84.5 74.8 77.3 4 C McDonnell Douglas MD80 89.1 78.9 86.7 29 D Unknown Aircraft 77.2 67.5 72.2 11 D Airbus A300 84.3 73.6 75.1 3 D Airbus A318 77.6 68.1 69.0 3 D Airbus A319 78.0 67.8 71.6 32 D Airbus A320 78.5 68.7 75.1 85 D Airbus A321 84.1 74.1 75.9 3 D Airbus A332 84.3 75.5 76.6 3 D Airbus A333 84.7 75.6 77.4 9 D Astra Jet 78.3 67.8 67.8 1 D Boeing 737-300 79.7 70.3 75.3 40 D Boeing 737-400 81.4 72.2 79.9 83 D Boeing 737-500 80.8 71.4 74.1 11 D Boeing 737-700 79.6 69.6 75.0 150 D Boeing 737-800 79.5 69.8 78.9 256 D Boeing 737-900 79.7 70.1 76.3 78 D Boeing 747-400 84.7 75.2 80.5 10 D Boeing 757-200 78.5 68.7 72.6 79 D Boeing 757-300 78.1 68.2 73.9 26 D Boeing 767-300 83.2 74.0 77.8 22 D Boeing 777-200 84.0 74.3 76.9 8 D Boeing 777-300ER 80.5 71.7 71.7 1 D Cessna 182 79.3 71.2 71.2 1 D Cessna Caravan 78.7 66.8 66.8 1 D Cessna Citation 560 88.7 78.2 78.2 1 D Canadair Jet 100 70.7 63.4 63.4 1 D Canadair Jet 700 74.4 65.5 73.0 34 D Canadair Jet 900 71.8 64.7 65.9 4 D McDonnell Douglas DC10 83.9 73.8 77.2 8 D DeHavilland Dash 8C 71.5 63.4 64.7 2 D DeHavilland Dash 8D 73.9 64.3 75.3 53 D Embraer 120 73.6 65.0 70.2 20 D Embraer 190 78.6 68.5 71.8 8 D Dassault Falcon 50 76.7 67.9 67.9 1 D McDonnell Douglas MD10 83.5 71.7 74.7 2 D McDonnell Douglas MD11 82.9 72.8 73.7 4

Part 150 Noise Measurement Report
48 Port of Seattle: Sea-Tac Airport
Site AC Type E Avg SEL Avg Lmax Max Lmax Count D McDonnell Douglas MD82 84.5 76.3 76.3 1 D McDonnell Douglas MD80 84.6 75.4 83.5 33 E Unknown Aircraft 82.3 71.7 71.7 1 E Boeing 737-800 76.4 70.6 70.6 1 E Boeing 747-400 77.3 66.0 66.0 1 E Cessna 172 76.8 70.0 70.0 1 E DeHavilland Dash 8D 80.9 72.9 72.9 1 F Unknown Aircraft 74.1 65.9 66.7 2 F Airbus A319 77.4 70.2 70.2 1 F Airbus A321 66.4 60.5 60.5 1 F Boeing 737-300 75.5 66.8 69.9 3 F Boeing 737-400 80.4 68.6 75.0 3 F Boeing 737-700 78.3 67.8 69.9 2 F Boeing 737-800 74.9 66.1 73.7 4 F Boeing 737-900 75.9 67.5 67.5 1 F Boeing 757-200 73.5 64.8 67.7 2 F DeHavilland Dash 8D 73.5 65.1 69.9 6 F Embraer 120 76.4 64.6 66.4 2 F McDonnell Douglas MD80 73.2 64.9 66.9 8 F Cirrus SR22 74.1 66.2 66.2 1 G Unknown Aircraft 78.9 68.4 71.1 2 G Boeing 737-400 67.1 61.8 61.8 1 G Cessna Caravan 75.7 68.2 68.2 1 G DeHavilland Dash 8D 74.6 64.1 65.9 2 G Piper Cherokee 69.4 62.6 62.6 1 H Airbus A332 87.8 76.9 76.9 1 H Boeing 737-800 69.7 67.0 67.0 1 H Boeing 737-900 77.3 66.2 69.8 4 H Cessna Caravan 75.8 68.0 68.0 1 H Canadair Jet 700 78.1 73.3 73.3 1 H DeHavilland Dash 8C 72.1 63.9 67.2 4 H DeHavilland Dash 8D 75.2 65.6 70.1 19 I Unknown Aircraft 76.8 65.5 76.9 90 I 206H 72.5 63.0 64.8 2 I 75P 71.3 65.0 66.1 3 I 76P 77.5 67.6 72.0 3 I Airbus A300 72.7 66.9 68.4 2 I Airbus A318 71.7 63.9 68.6 7 I Airbus A319 79.0 67.4 75.6 35 I Airbus A320 80.0 67.1 81.9 134 I Airbus A321 80.2 69.6 74.8 6 I Airbus A332 74.2 64.7 67.5 3 I Airbus A333 77.6 66.9 72.9 6 I Airbus A343 78.6 66.0 70.2 2
Part 150 Noise Measurement Report
49 Port of Seattle: Sea-Tac Airport
Site AC Type E Avg SEL Avg Lmax Max Lmax Count I Turbo Commander 69.2 62.1 62.1 1 I Aerostar 78.7 70.5 70.5 1 I Astra Jet 75.9 65.4 70.5 4 I B190 72.1 63.6 66.0 7 I Boeing 737-300 79.1 66.5 83.8 74 I Boeing 737-400 80.1 66.9 83.2 121 I Boeing 737-500 76.4 65.6 73.8 15 I Boeing 737-700 80.1 67.0 80.9 218 I Boeing 737-800 79.4 67.3 80.9 374 I Boeing 737-900 79.0 66.4 81.2 118 I Boeing 747-400 81.6 66.1 78.7 15 I Boeing 757-200 80.2 67.4 79.9 117 I Boeing 757-300 78.3 66.3 78.2 40 I Boeing 767-200 82.2 65.7 77.4 6 I Boeing 767-300 80.1 67.4 81.2 26 I Boeing 777-200 76.1 65.2 74.9 11 I Boeing 777-300ER 67.5 61.7 61.7 1 I Boeing 787-8 75.3 65.8 65.8 1 I Beech King Air 74.1 63.7 64.6 3 I Beech Bonanza 79.9 69.3 69.3 1 I BE95 72.1 65.0 65.0 1 I Beech Airliner 81.3 69.9 73.3 3 I Beech King Air 90 81.2 69.5 74.9 4 I Cessna 152 66.7 61.0 61.0 1 I Cessna 170 67.8 61.3 61.3 1 I Cessna 172 76.4 65.3 69.1 3 I Cessna 180 81.3 72.6 74.0 2 I Cessna 182 76.7 65.2 74.4 12 I Cessna 185 66.7 63.0 63.6 2 I Cessna 206 78.5 72.9 72.9 1 I Cessna Caravan 76.9 65.7 73.8 24 I Cessna Centurion 80.6 68.6 74.6 2 I Cessna Citation 525B 79.2 70.3 71.6 2 I Cessna 340 66.3 60.6 60.6 1 I Cessna 402 66.7 61.1 61.1 1 I Cessna Mustang 69.4 63.3 63.3 1 I Cessna Citation 550 67.5 62.2 62.2 1 I Cessna Citation 560XL 77.0 66.5 73.1 9 I Cessna Citation 650 78.8 69.7 69.7 1 I Cessna 172R 79.0 66.7 72.1 4 I Cessna Citation 10 75.5 65.7 70.6 7 I Cessna 182R 72.0 65.1 65.1 1 I Canadair Challenger 600 75.9 67.3 68.3 3 I Columbia 400 67.0 62.2 62.2 1

Part 150 Noise Measurement Report
50 Port of Seattle: Sea-Tac Airport
Site AC Type E Avg SEL Avg Lmax Max Lmax Count I Canadair Jet 100 76.5 65.9 73.0 9 I Canadair Jet 200 71.2 63.5 65.0 2 I Canadair Jet 700 78.4 66.3 78.6 86 I Canadair Jet 900 81.5 67.0 75.9 8 I Diamond 40 78.6 68.9 69.6 2 I McDonnell Douglas DC10 81.8 67.3 79.4 14 I McDonnell Douglas DC8 76.3 66.7 66.7 1 I DeHavilland Dash 8C 77.6 66.8 74.9 29 I DeHavilland Dash 8D 78.7 66.6 83.2 404 I Embraer 120 78.1 66.1 75.0 51 I Embraer 190 77.2 67.2 71.3 12 I Dassault Falcon 2000 84.1 73.4 73.4 1 I Dassault Falcon 50 74.8 67.0 67.0 1 I Dassault Falcon 7X 69.6 63.9 65.3 5 I Gulfstream 4 78.4 69.1 71.8 4 I Gulfstream 5 70.8 63.7 63.7 1 I Hawker 125 82.2 67.8 71.6 2 I Dornier 328 74.1 66.0 69.7 2 I Lear Jet 35 74.6 65.6 69.7 6 I Lear Jet 45 82.3 69.3 73.5 2 I Lear Jet 55 82.8 72.9 72.9 1 I McDonnell Douglas MD10 71.6 63.8 66.1 4 I McDonnell Douglas MD11 83.5 66.8 79.3 11 I McDonnell Douglas MD82 71.1 66.3 66.3 1 I McDonnell Douglas MD80 85.1 69.4 84.2 49 I MO20 73.3 63.7 63.7 1 I Piper Cherokee 74.3 65.0 66.6 2 I Piper Arrow 75.2 69.1 69.1 1 I Piper Aztec 73.7 62.8 64.4 2 I PA28 72.9 66.1 69.5 2 I Piper Navajo 72.1 68.2 69.1 2 I Piper Seneca 80.1 69.4 76.1 6 I Piper Cheyenne 71.5 63.4 67.3 3 I Pilatus PC12 77.4 66.0 74.6 12 I Cirrus SR22 77.1 66.9 71.8 5 I Fairchild Metroliner 73.0 64.1 64.1 1 I Beech Mentor 66.4 62.6 62.6 1 J Unknown Aircraft 83.3 70.9 78.3 60 J Airbus A300 70.5 61.8 61.8 1 J Airbus A306 80.9 74.3 76.1 2 J Airbus A318 81.0 72.4 74.7 3 J Airbus A319 80.2 70.1 73.5 20 J Airbus A320 81.3 70.8 80.7 51 J Airbus A321 82.6 74.0 75.1 2
Part 150 Noise Measurement Report
51 Port of Seattle: Sea-Tac Airport
Site AC Type E Avg SEL Avg Lmax Max Lmax Count J Airbus A332 86.3 78.8 78.8 1 J Airbus A333 88.3 75.4 78.1 3 J Aerospatiale ATR72 83.0 73.4 73.4 1 J Boeing 737-300 81.3 70.8 75.5 26 J Boeing 737-400 83.8 73.1 76.7 65 J Boeing 737-500 80.8 70.6 74.1 10 J Boeing 737-700 79.7 69.5 74.5 87 J Boeing 737-800 81.6 70.8 79.1 151 J Boeing 737-900 81.3 71.0 76.1 47 J Boeing 747-400 85.9 75.5 79.6 7 J Boeing 757-200 80.1 70.1 74.3 45 J Boeing 757-300 80.3 70.1 73.3 17 J Boeing 767-200 78.2 67.6 70.4 2 J Boeing 767-300 84.0 73.8 78.4 14 J Boeing 777-200 85.3 77.1 77.8 2 J Boeing 777-300ER 82.7 70.7 75.2 2 J Cessna Caravan 76.8 68.1 69.8 2 J Cessna 402 80.4 72.9 72.9 1 J Cessna Citation 560 76.0 66.4 66.4 1 J Canadair Jet 700 76.5 66.0 72.7 33 J Canadair Jet 900 75.6 65.8 68.0 2 J McDonnell Douglas DC10 83.4 72.7 78.1 8 J DeHavilland Dash 8C 76.5 66.3 69.2 2 J DeHavilland Dash 8D 75.4 65.5 72.8 46 J Embraer 120 74.9 65.2 68.8 7 J Embraer 190 83.2 74.0 74.8 3 J Hawker 125 73.8 65.1 65.1 1 J McDonnell Douglas MD10 81.5 68.5 73.2 4 J McDonnell Douglas MD11 83.0 73.8 78.1 4 J McDonnell Douglas MD82 86.5 78.7 78.7 1 J McDonnell Douglas MD80 90.6 77.8 83.5 18 K 206H 74.0 66.9 66.9 1 K Boeing 737-800 80.9 70.0 70.0 1 K DeHavilland Dash 8D 73.2 64.2 66.0 6 K Embraer 120 76.3 64.8 65.6 5 L Unknown Aircraft 78.0 64.3 73.9 10 L 76P 61.2 51.6 51.6 1 L Boeing 737-400 72.2 59.1 66.4 8 L Boeing 737-700 67.5 55.4 58.7 7 L Boeing 737-800 72.8 60.3 66.2 5 L Boeing 747-400 77.3 66.9 66.9 1 L Boeing 757-300 62.4 52.7 52.7 1 L Boeing 767-300 70.7 58.3 58.3 1 L Boeing 777-300ER 72.8 61.4 61.4 1
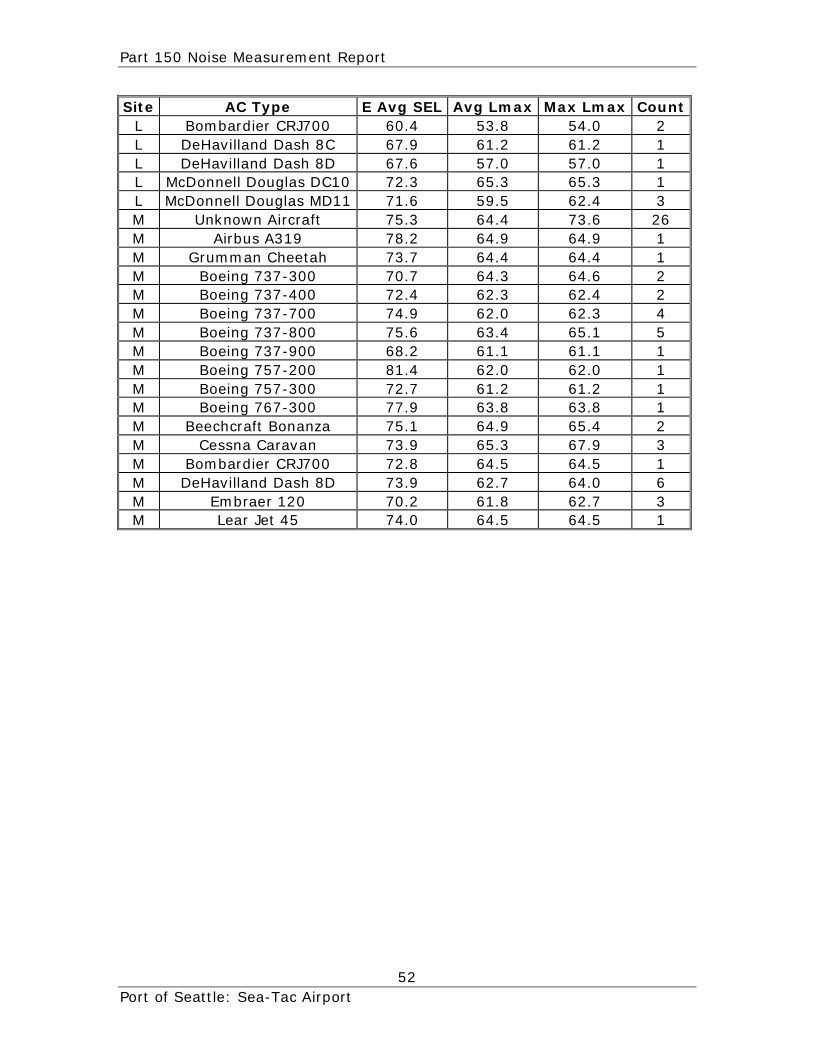
Part 150 Noise Measurement Report
52 Port of Seattle: Sea-Tac Airport
Site AC Type E Avg SEL Avg Lmax Max Lmax Count L Bombardier CRJ700 60.4 53.8 54.0 2 L DeHavilland Dash 8C 67.9 61.2 61.2 1 L DeHavilland Dash 8D 67.6 57.0 57.0 1 L McDonnell Douglas DC10 72.3 65.3 65.3 1 L McDonnell Douglas MD11 71.6 59.5 62.4 3 M Unknown Aircraft 75.3 64.4 73.6 26 M Airbus A319 78.2 64.9 64.9 1 M Grumman Cheetah 73.7 64.4 64.4 1 M Boeing 737-300 70.7 64.3 64.6 2 M Boeing 737-400 72.4 62.3 62.4 2 M Boeing 737-700 74.9 62.0 62.3 4 M Boeing 737-800 75.6 63.4 65.1 5 M Boeing 737-900 68.2 61.1 61.1 1 M Boeing 757-200 81.4 62.0 62.0 1 M Boeing 757-300 72.7 61.2 61.2 1 M Boeing 767-300 77.9 63.8 63.8 1 M Beechcraft Bonanza 75.1 64.9 65.4 2 M Cessna Caravan 73.9 65.3 67.9 3 M Bombardier CRJ700 72.8 64.5 64.5 1 M DeHavilland Dash 8D 73.9 62.7 64.0 6 M Embraer 120 70.2 61.8 62.7 3 M Lear Jet 45 74.0 64.5 64.5 1