Sea Level Rise & Climate Change
61
Final White Paper – December 2018 Sea Level Rise & Climate Change
Transcript of Sea Level Rise & Climate Change
Final White Paper – December 2018
Sea Level Rise & Climate Change
WHITE PAPER REPORT: CLIMATE CHANGE & SEA LEVEL RISE
PRIMARY URBAN CENTER DEVELOPMENT PLAN UPDATE | 1
Content and Structure This white paper prepared by the University of Hawai‘i Sea Grant College Program provides an overview of current conditions and issues related to climate change and sea level rise and their impact on land use in the Primary Urban Center (PUC) area within the City and County of Honolulu. These findings and conclusions will inform the Primary Urban Center Development Plan (PUC DP) update, currently underway. This document is one of a series of topic-specific white papers developed in preparation for the PUC DP update. The primary authors of the document are Katy Hintzen and Dr. Brad Romine.
Executive Summary The intent of this white paper is to provide a summary of key trends, hazards, and vulnerabilities, and planning considerations related to sea level rise and climate change in Oahu’s Primary Urban Center (PUC). The paper opens with an overview of State and City climate change adaptation and mitigation initiatives relevant to the PUC. This is followed by a discussion of natural hazards, climate change trends, and projections of potential impacts for the area with a particular focus on hazards and vulnerabilities related to sea level rise. The paper concludes by exploring strategies and policy options for building resilience, adapting to climate change and sea level rise, and reducing greenhouse gas emissions through the development and implementation of an updated Primary Urban Center Development Plan (PUC DP)1.
Key Takeaways: Climate Science • Hawai‘i, including O‘ahu’s PUC, is vulnerable to impacts associated with climate change
and sea level rise due to our coastal-focused society and economy, concentrated shoreline development, and remote location in the central Pacific.
• As described in the Climate Change and Sea Level Rise Outlook section of this paper, it is increasingly likely that we will see 3 feet or more of sea level rise by the end of this century. Six feet or more of sea level rise by 2100 is plausible under some scenarios. High tide flooding will affect low-lying coastal areas decades before global mean sea level reaches these benchmarks.
• Using data from the Hawai‘i Sea Level Rise Vulnerability and Adaptation Report, we find that 3.2 feet of sea level rise would cause the following impacts in the PUC (assuming no adaptation measures are employed): chronic flooding in 1,727 acres of land potentially impacting 1,627 buildings, displacing 4,325 residents, and flooding 24 miles of road.
• The economic impacts of 3.2 feet of sea level rise will be disproportionately high in the PUC due to dense development on low-lying coastal lands, potentially threatening $7.3 billion in buildings and property. The monetary impacts to roads, utilities, and other critical infrastructure is unknown but may be an order of magnitude greater than potential loss of structures and property.
1 See full document for references related to science and data included in the Executive Summary.
WHITE PAPER REPORT: CLIMATE CHANGE & SEA LEVEL RISE
PRIMARY URBAN CENTER DEVELOPMENT PLAN UPDATE | 2
• Portions of Transit Oriented Development plan areas around the new rail line will likely experience chronic sea level rise flooding within this century and high tide flooding decades sooner if no adaptation measures are implemented.
• Global mean air temperatures have increased by 1.8° F in this century. Honolulu is already experiencing a significant increase in the number of days with temperatures above 90° F. Temperatures in Hawai‘i are expected to increase between 2° F and 5° F by 2100 depending on future greenhouse gas emission trends.
• Public health risks associated with rising temperatures and extreme heat events include increased respiratory illnesses, heatstroke, and cardiovascular and kidney disease.
• Hawai‘i has experience a statewide decline in average annual rainfall in recent decades. Precipitation extremes are also becoming more common with both more frequent heavy rainfall events and more periods of sustained drought.
• Projections for future climate change impacts on local precipitation patterns remain uncertain. However, rising sea levels and groundwater inundation will reduce drainage capacity during heavy rainfall events and contribute to the risk of environmental impacts from contaminated groundwater and compromised wastewater systems.
• O‘ahu depends heavily on groundwater and the combined impacts of decreased rainfall, higher temperatures, and population growth will place added stress on O‘ahu’s freshwater.
• Models of future climate conditions indicate that Hawai‘i will be impacted by tropical cyclones more frequently as storm tracks shift northward. Because a significant portion of Hawaii’s population, economic assets, and critical infrastructure are concentrated within the PUC, a tropical cyclone hitting the area would have major statewide impacts.
Key Takeaways: Policy and Planning Considerations • Climate change adaptation and mitigation strategies should be integrated into all
aspects of the PUC DP, as O‘ahu must prepare for coming impacts while also addressing and minimizing the greenhouse gas emissions driving climate change.
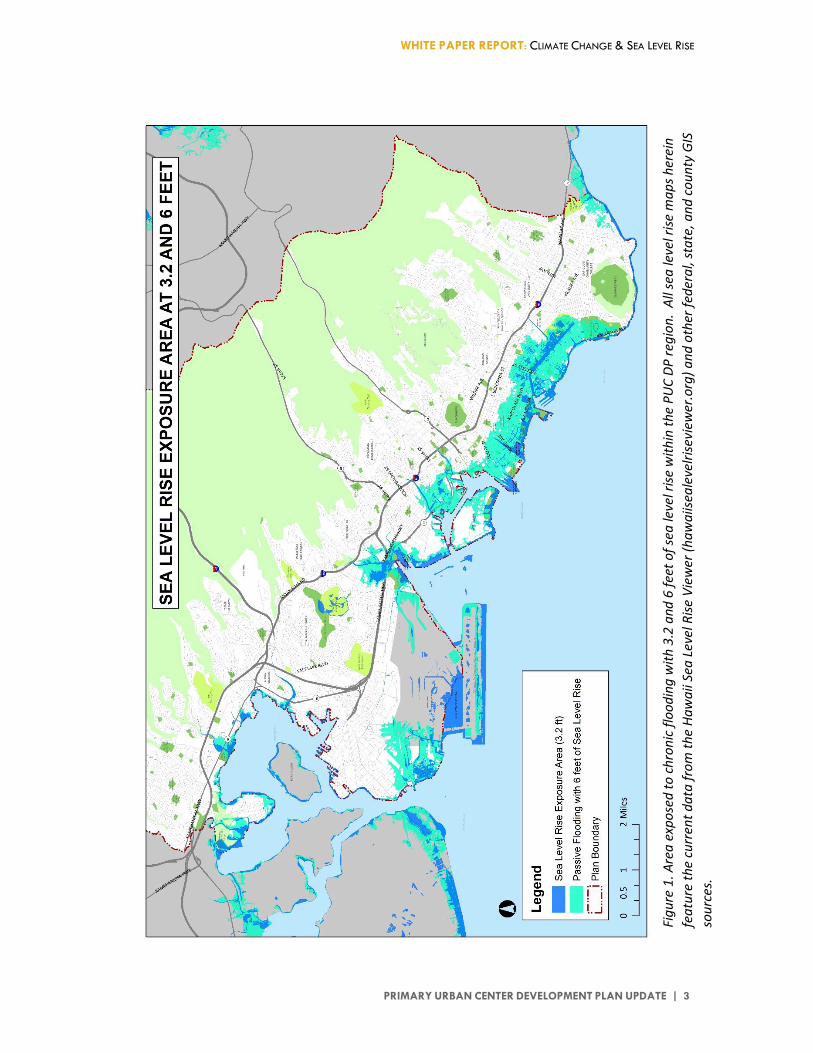
• Using the 3.2 ft Sea Level Rise Exposure Area as a hazard overlay is a critical first step in preparing for and adapting to sea level rise impacts. For planning decisions related to critical infrastructure with long expected lifespans or low risk tolerance, 6 feet of sea level rise should be considered as a planning benchmark (Figure 1). This aligns with Mayoral Directive No. 18-2 (Appendix B) which requires city departments and agencies to use the Hawaiʻi Sea Level Rise Vulnerability and Adaptation Report and the City and County of Honolulu Climate Change Commission Sea Level Rise Guidance in planning, programing, and capital improvement decisions (Appendix C).
• The PUC DP should prioritize resilience actions that provide multiple benefits and strategically incorporate adaptation measures into ongoing projects and planning efforts.
• The PUC DP presents an opportunity to support and build on State and City efforts to reduce transportation-related greenhouse gas emissions (including a zero carbon fleet goal) and increase carbon sequestration (primarily through greater urban tree canopy).
WHITE PAPER REPORT: CLIMATE CHANGE & SEA LEVEL RISE
PRIMARY URBAN CENTER DEVELOPMENT PLAN UPDATE | 3
Figu
re 1
. Are
a ex
pose
d to
chro
nic
flood
ing
with
3.2
and
6 fe
et o
f sea
leve
l rise
with
in th
e PU
C DP
regi
on.
All s
ea le
vel r
ise m
aps h
erei
n fe
atur
e th
e cu
rren
t dat
a fr
om th
e Ha
wai
i Sea
Lev
el R
ise V
iew
er (h
awai
iseal
evel
risev
iew
er.o
rg) a
nd o
ther
fede
ral,
stat
e, a
nd c
ount
y GI
S so
urce
s.
WHITE PAPER REPORT: CLIMATE CHANGE & SEA LEVEL RISE
PRIMARY URBAN CENTER DEVELOPMENT PLAN UPDATE | 4
White Paper Approach This white paper addresses a range of climate change impacts and vulnerabilities relevant to the Honolulu Primary Urban Center (PUC). However, the principal focus of the data and recommendations included here is on sea level rise. This focus on sea level vulnerability and adaptation is consistent with recent priorities adopted by the State of Hawai‘i and the City and County of Honolulu (City).
The State of Hawai‘i emphasized the importance of addressing sea level rise in Act 83 (Hawai‘i Climate Change Adaptation Initiative) which was further expanded by Act 32 (Hawai‘i Climate Change Mitigation and Adaptation Initiative). In December 2017, the Hawai‘i Climate Change Mitigation and Adaptation Commission (State Climate Change Commission) voted to approve the Hawai‘i Sea Level Rise Vulnerability and Adaptation Report (State Sea Level Rise Report), providing the first statewide assessment of Hawaii’s vulnerability to sea level rise and recommending adaptation strategies. Integrating data from this report into community planning is a key recommendation in the State Sea Level Rise Report and an important next step for building resilience. Recognizing and addressing the impacts of sea level rise in the Primary Urban Center Development Plan (PUC DP) update is particularly critical because so much of the State’s infrastructure, economic activities, and population is concentrated within the PUC boundaries.
The City and County of Honolulu Climate Change Commission (Honolulu Climate Change Commission) has also emphasized sea level rise adaptation as a critical need and adopted Sea Level Rise Guidance that supports and expands upon the recommendations of the State Sea Level Rise Report (Appendix C). In June 2018, Mayor Kirk Caldwell issued Mayoral Directive No. 18-2 (hereafter “directive 18-2”) which emphasizes the projected impacts of sea level rise on O‘ahu (Appendix B). This directive further instructs all executive branch departments and agencies to, “consider the need for both climate change mitigation and adaptation as pressing and urgent matters, to take a proactive approach in both reducing greenhouse gas emissions and adapting to impacts caused by sea level rise, and to align programs wherever possible to help protect and prepare the infrastructure, assets, and citizens of the City for the physical and economic impacts of climate change.”
Relevant State and County Initiatives Responding to climate change requires not only preparing for and adapting to the impacts and hazards associated with a changing climate but also addressing the greenhouse gas emissions driving climate change. In many ways, decision makers in Hawai‘i are leading the nation in climate change mitigation and adaptation policies. However, much work remains to be done.
WHITE PAPER REPORT: CLIMATE CHANGE & SEA LEVEL RISE
PRIMARY URBAN CENTER DEVELOPMENT PLAN UPDATE | 5
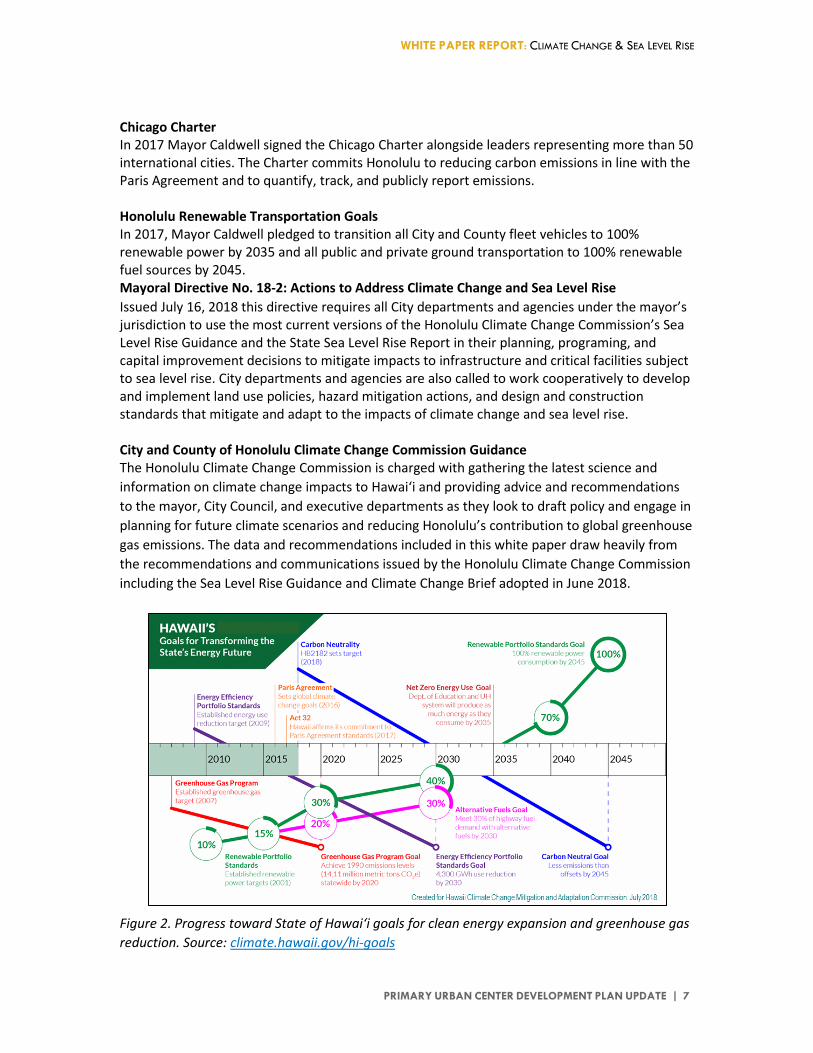
State of Hawai‘i Hazard Mitigation Plan The 2018 update of the State Hazard Mitigation Plan includes an expanded risk assessment incorporating the latest science and projections on climate change and sea level rise from the State Sea Level Rise Report and elsewhere. Hawai‘i Coastal Zone Management Act The Hawai‘i Coastal Zone Management Act (Chapter 205A of the Hawaii Revised Statutes) outlines policies related to recreational resources, historic resources, scenic and open space resources, coastal ecosystems, economic uses, coastal hazards, managing development, public participation, beach protection, and marine resources. State and county agencies adopt and enforce rules that comply with the Hawai‘i Coastal Zone Management Act. Counties have the authority to establish Special Management Area boundaries and setback lines and to manage permits and variances within those boundaries. Greenhouse Gas Emission Reductions (State Act 234) In 2007, Hawai‘i became one of the first states in the nation to pass major climate change mitigation legislation. Act 234 requires statewide greenhouse gas emission reductions to levels at or below 1990 levels by the year 2020. To comply with this standard the State Department of Health, Clean Air Branch established Green House Gas Rules requiring a 16% reduction in greenhouse gas emissions from large, stationary (non-transportation) sources by the year 2020 (Figure 2). Hawai‘i Clean Energy Initiative In 2008, the State of Hawai‘i established the Hawai‘i Clean Energy Initiative in partnership with the U.S. Department of Energy to reduce the state’s dependence on imported fossil fuels. Hawai‘i State Planning Act (as amended by State Act 286, 2012) In 2012, the Hawai‘i State Planning Act was amended to include priority guidelines to address the impacts of climate change. Aloha+ Challenge In 2014, the Hawai‘i State Legislature endorsed the Aloha+ Challenge. The Aloha+ Challenge established sustainability as a State priority and committed to achieving six sustainability goals by 2030 including 70% clean energy through advancing energy efficiency and renewable power sources. The Aloha+ Challenge Dashboard serves as an online platform to track statewide progress towards these sustainability goals.
A TWO-PRONGED APPROACH TO ADRESSING CLIMATE CHANGE
Adaptation: Actions that reduce the vulnerability of society to climate change impacts. This includes attempts to reduce harm or take advantage of new opportunities resulting from climate change.
Mitigation: Efforts to reduce future climate changes. This includes reducing greenhouse gas emissions and increasing the uptake of carbon dioxide through land-use change and forestry.
Adapted from the 2014 National Climate Assessment
WHITE PAPER REPORT: CLIMATE CHANGE & SEA LEVEL RISE
PRIMARY URBAN CENTER DEVELOPMENT PLAN UPDATE | 6
100% Renewable Portfolio Standard by 2045 In 2015 Hawai‘i became the first state in the national to commit to 100% renewable energy by 2045 (Act 97). Hawai‘i Climate Change Mitigation & Adaptation Initiative (State Act 83, 2014 and replaced by Act 32, 2017) Hawai‘i was the first state to pass legislation implementing parts of the Paris Climate Agreement. Act 32 renamed the Interagency Climate Adaptation Committee the Hawai‘i Climate Change Mitigation and Adaptation Commission (State Climate Change Commission). The State Climate Change Commission provides direction, facilitation, coordination, and planning among state and county agencies, federal agencies, and other partners on climate change. Hawai‘i Sea Level Rise Vulnerability and Adaptation Report As directed by State Act 83 (2014) and Act 32 (2017), the Hawaiʻi Sea Level Rise Vulnerability and Adaptation Report, completed and adopted by the State Climate Change Commission in December 2017, provides a statewide assessment of Hawaii’s vulnerability to sea level rise and recommendations to improve resilience and begin to adapt to related impacts. The data and recommendations included in this white paper draw heavily from the State Sea Level Rise Report. Honolulu Multi-Hazard Pre-Disaster Mitigation Plan The multi-hazard mitigation plan provides a strategy for the City and County of Honolulu to reduce loss of life and property due to hazard events. The plan must be updated every five years. Primary Urban Center Watershed Management Plan The Honolulu Board of Water Supply is in the process of developing the Primary Urban Center Watershed Management Plan, which will be part of the City Water Use and Development Plan under the State of Hawai‘i Water Code and City and County of Honolulu ordinance. This plan will outline existing water demand and supply, project future water demands, and identify supply options to meet those demands. Additionally, the plan will identify critical watersheds and develop watershed protection strategies to maintain the water quality and quantity. This management plan includes modeling and mapping of projected groundwater inundation with sea level rise (Figure 12). Honolulu Resilience Strategy The City and County of Honolulu's Office of Climate Change, Sustainability, and Resiliency (CCSR) was established by City Charter in 2016. The CCSR is mandated to seek information on the potential impacts of climate change on city facilities and coordinate across city departments in developing actions and policies to address climate change. The Executive Director of the CCSR also serves as the Chief Resilience Officer leading development and implementation of a Resilience Plan as part of Honolulu’s membership in the 100 Resilient Cities network. The 100 Resilient Cities initiative is dedicated to supporting cities around the world in becoming more resilience to physical, social, and economic challenges.
WHITE PAPER REPORT: CLIMATE CHANGE & SEA LEVEL RISE
PRIMARY URBAN CENTER DEVELOPMENT PLAN UPDATE | 7
Chicago Charter In 2017 Mayor Caldwell signed the Chicago Charter alongside leaders representing more than 50 international cities. The Charter commits Honolulu to reducing carbon emissions in line with the Paris Agreement and to quantify, track, and publicly report emissions. Honolulu Renewable Transportation Goals In 2017, Mayor Caldwell pledged to transition all City and County fleet vehicles to 100% renewable power by 2035 and all public and private ground transportation to 100% renewable fuel sources by 2045. Mayoral Directive No. 18-2: Actions to Address Climate Change and Sea Level Rise Issued July 16, 2018 this directive requires all City departments and agencies under the mayor’s jurisdiction to use the most current versions of the Honolulu Climate Change Commission’s Sea Level Rise Guidance and the State Sea Level Rise Report in their planning, programing, and capital improvement decisions to mitigate impacts to infrastructure and critical facilities subject to sea level rise. City departments and agencies are also called to work cooperatively to develop and implement land use policies, hazard mitigation actions, and design and construction standards that mitigate and adapt to the impacts of climate change and sea level rise. City and County of Honolulu Climate Change Commission Guidance The Honolulu Climate Change Commission is charged with gathering the latest science and information on climate change impacts to Hawai‘i and providing advice and recommendations to the mayor, City Council, and executive departments as they look to draft policy and engage in planning for future climate scenarios and reducing Honolulu’s contribution to global greenhouse gas emissions. The data and recommendations included in this white paper draw heavily from the recommendations and communications issued by the Honolulu Climate Change Commission including the Sea Level Rise Guidance and Climate Change Brief adopted in June 2018.
Figure 2. Progress toward State of Hawaiʻi goals for clean energy expansion and greenhouse gas reduction. Source: climate.hawaii.gov/hi-goals
WHITE PAPER REPORT: CLIMATE CHANGE & SEA LEVEL RISE
PRIMARY URBAN CENTER DEVELOPMENT PLAN UPDATE | 8
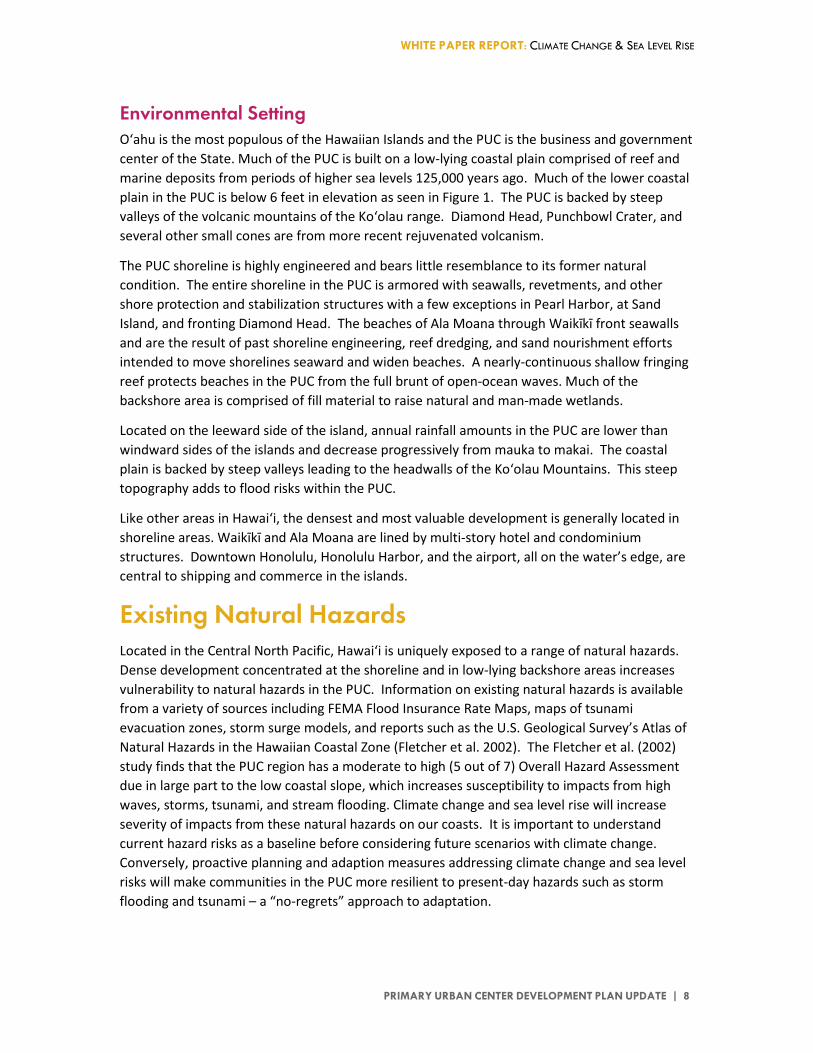
Environmental Setting O‘ahu is the most populous of the Hawaiian Islands and the PUC is the business and government center of the State. Much of the PUC is built on a low-lying coastal plain comprised of reef and marine deposits from periods of higher sea levels 125,000 years ago. Much of the lower coastal plain in the PUC is below 6 feet in elevation as seen in Figure 1. The PUC is backed by steep valleys of the volcanic mountains of the Ko‘olau range. Diamond Head, Punchbowl Crater, and several other small cones are from more recent rejuvenated volcanism.
The PUC shoreline is highly engineered and bears little resemblance to its former natural condition. The entire shoreline in the PUC is armored with seawalls, revetments, and other shore protection and stabilization structures with a few exceptions in Pearl Harbor, at Sand Island, and fronting Diamond Head. The beaches of Ala Moana through Waikīkī front seawalls and are the result of past shoreline engineering, reef dredging, and sand nourishment efforts intended to move shorelines seaward and widen beaches. A nearly-continuous shallow fringing reef protects beaches in the PUC from the full brunt of open-ocean waves. Much of the backshore area is comprised of fill material to raise natural and man-made wetlands.
Located on the leeward side of the island, annual rainfall amounts in the PUC are lower than windward sides of the islands and decrease progressively from mauka to makai. The coastal plain is backed by steep valleys leading to the headwalls of the Ko‘olau Mountains. This steep topography adds to flood risks within the PUC.
Like other areas in Hawai‘i, the densest and most valuable development is generally located in shoreline areas. Waikīkī and Ala Moana are lined by multi-story hotel and condominium structures. Downtown Honolulu, Honolulu Harbor, and the airport, all on the water’s edge, are central to shipping and commerce in the islands.
Existing Natural Hazards Located in the Central North Pacific, Hawai‘i is uniquely exposed to a range of natural hazards. Dense development concentrated at the shoreline and in low-lying backshore areas increases vulnerability to natural hazards in the PUC. Information on existing natural hazards is available from a variety of sources including FEMA Flood Insurance Rate Maps, maps of tsunami evacuation zones, storm surge models, and reports such as the U.S. Geological Survey’s Atlas of Natural Hazards in the Hawaiian Coastal Zone (Fletcher et al. 2002). The Fletcher et al. (2002) study finds that the PUC region has a moderate to high (5 out of 7) Overall Hazard Assessment due in large part to the low coastal slope, which increases susceptibility to impacts from high waves, storms, tsunami, and stream flooding. Climate change and sea level rise will increase severity of impacts from these natural hazards on our coasts. It is important to understand current hazard risks as a baseline before considering future scenarios with climate change. Conversely, proactive planning and adaption measures addressing climate change and sea level risks will make communities in the PUC more resilient to present-day hazards such as storm flooding and tsunami – a “no-regrets” approach to adaptation.
WHITE PAPER REPORT: CLIMATE CHANGE & SEA LEVEL RISE
PRIMARY URBAN CENTER DEVELOPMENT PLAN UPDATE | 9
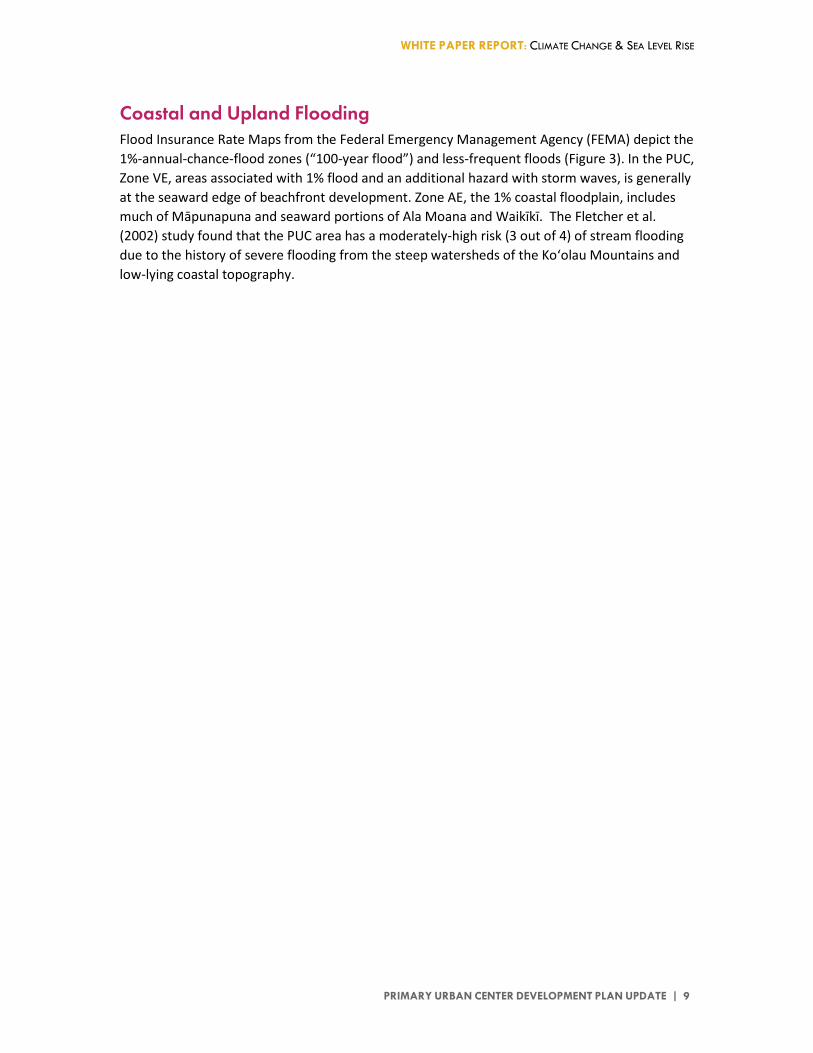
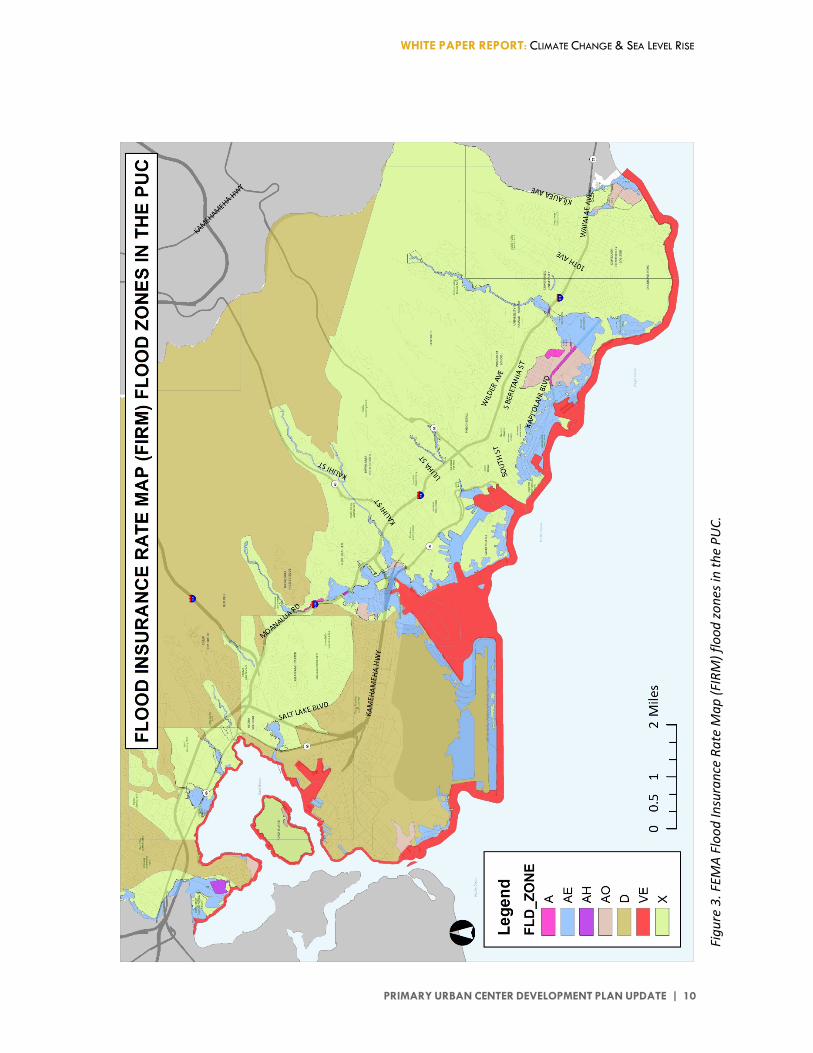
Coastal and Upland Flooding Flood Insurance Rate Maps from the Federal Emergency Management Agency (FEMA) depict the 1%-annual-chance-flood zones (“100-year flood”) and less-frequent floods (Figure 3). In the PUC, Zone VE, areas associated with 1% flood and an additional hazard with storm waves, is generally at the seaward edge of beachfront development. Zone AE, the 1% coastal floodplain, includes much of Māpunapuna and seaward portions of Ala Moana and Waikīkī. The Fletcher et al. (2002) study found that the PUC area has a moderately-high risk (3 out of 4) of stream flooding due to the history of severe flooding from the steep watersheds of the Ko‘olau Mountains and low-lying coastal topography.
WHITE PAPER REPORT: CLIMATE CHANGE & SEA LEVEL RISE
PRIMARY URBAN CENTER DEVELOPMENT PLAN UPDATE | 10
Figu
re 3
. FEM
A Fl
ood
Insu
ranc
e Ra
te M
ap (F
IRM
) flo
od zo
nes i
n th
e PU
C.

WHITE PAPER REPORT: CLIMATE CHANGE & SEA LEVEL RISE
PRIMARY URBAN CENTER DEVELOPMENT PLAN UPDATE | 11
Tsunami Tsunami are waves generated by distant or localized geologic events, most often by large earthquakes that cause rapid movement of the seafloor. Hawai‘i is encircled by the “ring of fire,” a band of major subduction fault and volcano zones surrounding the Pacific Ocean. According to Fletcher et al. (2002), the PUC area was affected by nine damaging tsunami since 1837 and has an overall high hazard rating for tsunami due to the low-lying coastal topography. The highest tsunami runup recorded was 13 feet in the vicinity of Honolulu Harbor from the 1960 Chile earthquake and tsunami. The 2011 Japan tsunami caused no severe damage on land in the PUC but did cause some damage in marinas around Honolulu Harbor. In general, runups with major tsunami have been less in the vicinity of the PUC than in other areas on O‘ahu such as Ka‘ena Point, Hale‘iwa, and Kahuku; however, that should not be reason for complacency. In March 2017, the City and County of Honolulu released maps of Extreme Tsunami Evacuation Zones (XTEZ) based on “a newly recognized risk of tsunami from a very large Aleutian [Alaska, Magnitude 9+] event” (City and County of Honolulu, 2017). The new XTEZ zones extend up to and beyond the H1 freeway in some areas. Tsunami Evacuation Zone Maps may be downloaded at http://www.honolulu.gov/ demhazards/tsunamimaps.html.
Coastal Erosion and Beach Loss Seasonal and chronic beach erosion is a problem throughout Hawai‘i, and beaches within the PUC are no exception. The University of Hawai‘i Coastal Geology Group used aerial photographs and survey charts going back as far as 1911 to map and quantify historical changes in shoreline location on Kaua‘i, O‘ahu, and Maui (Fletcher et al 2012; maps available at http://www.soest.hawaii.edu/coasts/erosion/). The PUC shoreline is a highly engineered urban shoreline bearing little resemblance to its natural condition. Long-term trends of historical shoreline changes in the PUC are closely related to past efforts to engineer the shoreline with seawalls, groins, breakwalls and other structures, as well as sand nourishment projects, which have localized effects on sediment transport. Beach erosion hotspots in the PUC include the west end of Sand Island State Recreation Area, both ends and a central section of Ala Moana Beach Park, either end of Ft DeRussy Beach, Waikīkī (Royal Hawaiian) Beach, Queen’s Beach, and portions of the Gold Coast – Diamond Head shoreline.
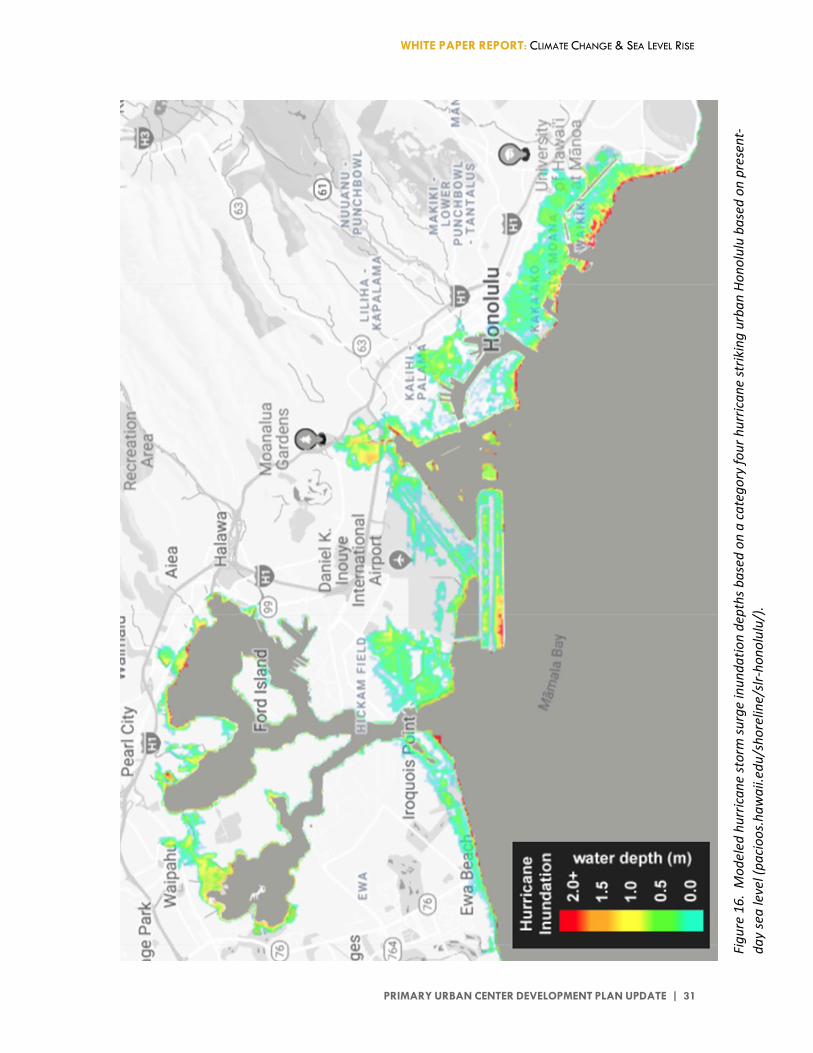
Hurricane and Storm Risk Hurricane strikes in the Hawaiian Islands are infrequent compared to many other tropical locations of the U.S. However, a direct strike from a hurricane or tropical storm in the PUC is certainly possible and perhaps inevitable depending on timeframe considered. Figure 16 depicts storm surge inundation, color-coded to show flooding depth in meters, from a direct strike of a Category 4 hurricane to the PUC. The scenario is based on a storm similar to Hurricane Iniki, which struck Kaua‘i in September 1992, and does not include additional flooding from rainfall. A storm of this magnitude would cause severe storm surge flooding from the airport, through Māpunapuna, downtown, and well into Ala Moana and Waikīkī. Less severe tropical storms and southerly “Kona” frontal storms can also have a damaging impact on the PUC contributing to wave runup and erosion on the shoreline as well as upland flooding from heavy rain.
WHITE PAPER REPORT: CLIMATE CHANGE & SEA LEVEL RISE
PRIMARY URBAN CENTER DEVELOPMENT PLAN UPDATE | 12
Climate Change & Sea Level Rise Outlook Key Take Aways
• Atmospheric concentration of carbon dioxide, a key greenhouse gas, has increased by about 45% since the industrial revolution. Current concentrations are the highest in millions of years based on measurements taken from bubbles trapped in cores taken from polar ice sheets.
• Global-average atmospheric temperature has increased by about 1.8°F over the past century, closely following increases in carbon dioxide and other greenhouse gases.
• Global mean sea level is rising at an accelerating rate due to thermal expansion of warming waters and melting of land-based glaciers and ice sheets.
• The most current scientific literature points to 3 feet of sea level rise as an intermediate scenario and 8 feet or more of sea level rise as a worst-case scenario by the end of this century.
We are experiencing the effects of climate change in Hawai‘i today in the form of increasing air and sea surface temperatures, rising sea level, overall decline in rainfall, and decrease in stream base flow (Keener et al, 2013; Hawai‘i Sea Grant, 2014). Hawai‘i, including the PUC, is uniquely vulnerable to impacts associated with climate change and sea level rise due to our coastal-focused society and economy and our remote location in the Central Pacific. Hazards and vulnerabilities related to climate change and sea level rise are increasing as the global atmosphere and oceans warm.
According to the Intergovernmental Panel on Climate Change Fifth Assessment Report, "Warming of the climate system is unequivocal, and since the 1950s, many of the observed changes are unprecedented over decades to millennia. The atmosphere and ocean have warmed, the amounts of snow and ice have diminished, sea level has risen, and the concentrations of greenhouse gases have increased."
Measurements from Mauna Loa Observatory and gases trapped in ice cores extracted from Greenland and Antarctica show that atmospheric concentrations of carbon dioxide, a key greenhouse gas, have increased about 45% since the industrial revolution and are now the highest in at least 800,000 years and probably as long as 3 million years (Tripati et al., 2009). Atmospheric concentrations of other important greenhouse gases including methane, nitrous oxide, and chlorofluorocarbons have also increased over the past century.
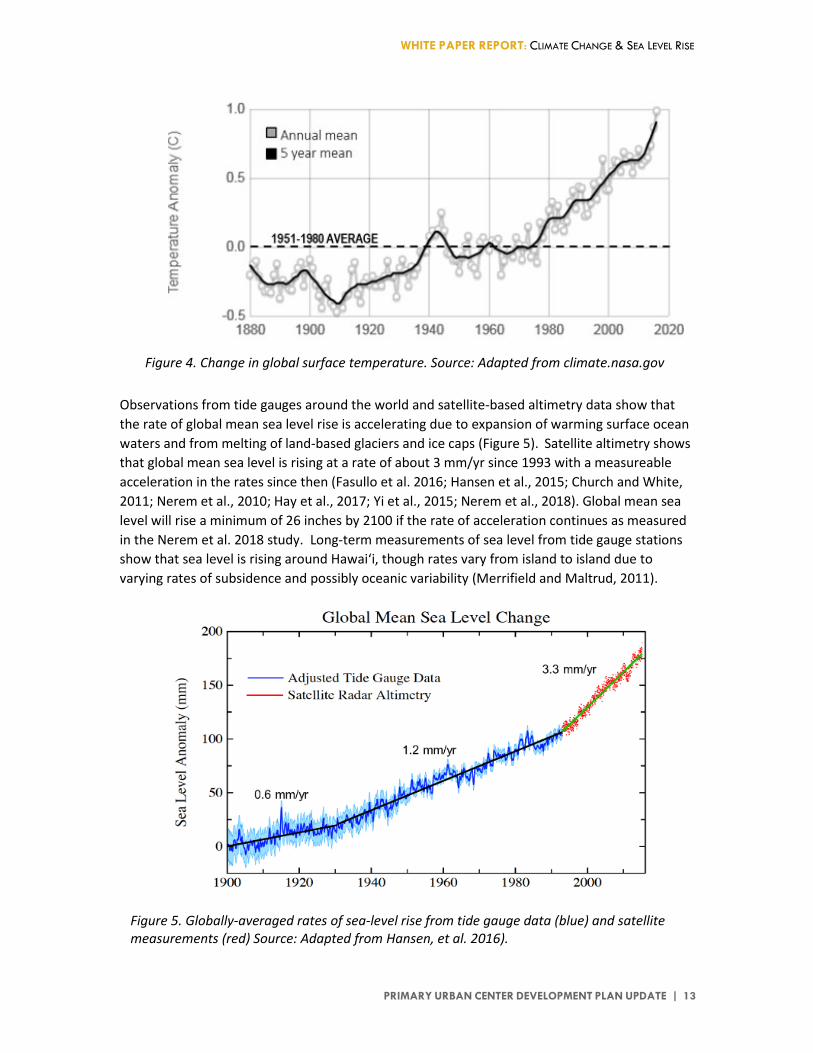
Increasing global average temperature has tracked closely with increasing carbon dioxide with a net increase of about 1.8° F since 1880 and a distinct increase in warming since the 1950s (Figure 4). Seventeen of the eighteen warmest years in the 137-year global temperature record have occurred since 2001 with 1998 as the only exception due to exceptionally strong El Niño conditions in the Pacific that year. 2016 was the first time the hottest year on record occurred three years in a row and 2017 was either the second or third warmest year on record (according to NASA and NOAA, respectively).
WHITE PAPER REPORT: CLIMATE CHANGE & SEA LEVEL RISE
PRIMARY URBAN CENTER DEVELOPMENT PLAN UPDATE | 13
Observations from tide gauges around the world and satellite-based altimetry data show that the rate of global mean sea level rise is accelerating due to expansion of warming surface ocean waters and from melting of land-based glaciers and ice caps (Figure 5). Satellite altimetry shows that global mean sea level is rising at a rate of about 3 mm/yr since 1993 with a measureable acceleration in the rates since then (Fasullo et al. 2016; Hansen et al., 2015; Church and White, 2011; Nerem et al., 2010; Hay et al., 2017; Yi et al., 2015; Nerem et al., 2018). Global mean sea level will rise a minimum of 26 inches by 2100 if the rate of acceleration continues as measured in the Nerem et al. 2018 study. Long-term measurements of sea level from tide gauge stations show that sea level is rising around Hawai‘i, though rates vary from island to island due to varying rates of subsidence and possibly oceanic variability (Merrifield and Maltrud, 2011).
Figure 5. Globally-averaged rates of sea-level rise from tide gauge data (blue) and satellite measurements (red) Source: Adapted from Hansen, et al. 2016).
Figure 4. Change in global surface temperature. Source: Adapted from climate.nasa.gov
WHITE PAPER REPORT: CLIMATE CHANGE & SEA LEVEL RISE
PRIMARY URBAN CENTER DEVELOPMENT PLAN UPDATE | 14
A range of projections for future sea level rise may be found in scientific literature and government reports. The variations in predictions result from a range of potential greenhouse emissions pathways and resulting warming and from improving understanding of polar ice sheet response to atmosphere and ocean warming. In modeling sea level rise impacts in the State Sea Level Rise Report, The State Climate Commission utilized upper-end sea level rise projections from the Intergovernmental Panel on Climate Change 5th Assessment Report (IPCC, 2014), corresponding to 1 foot of sea level rise by 2050 and 3.2 feet of sea level rise by 2100.
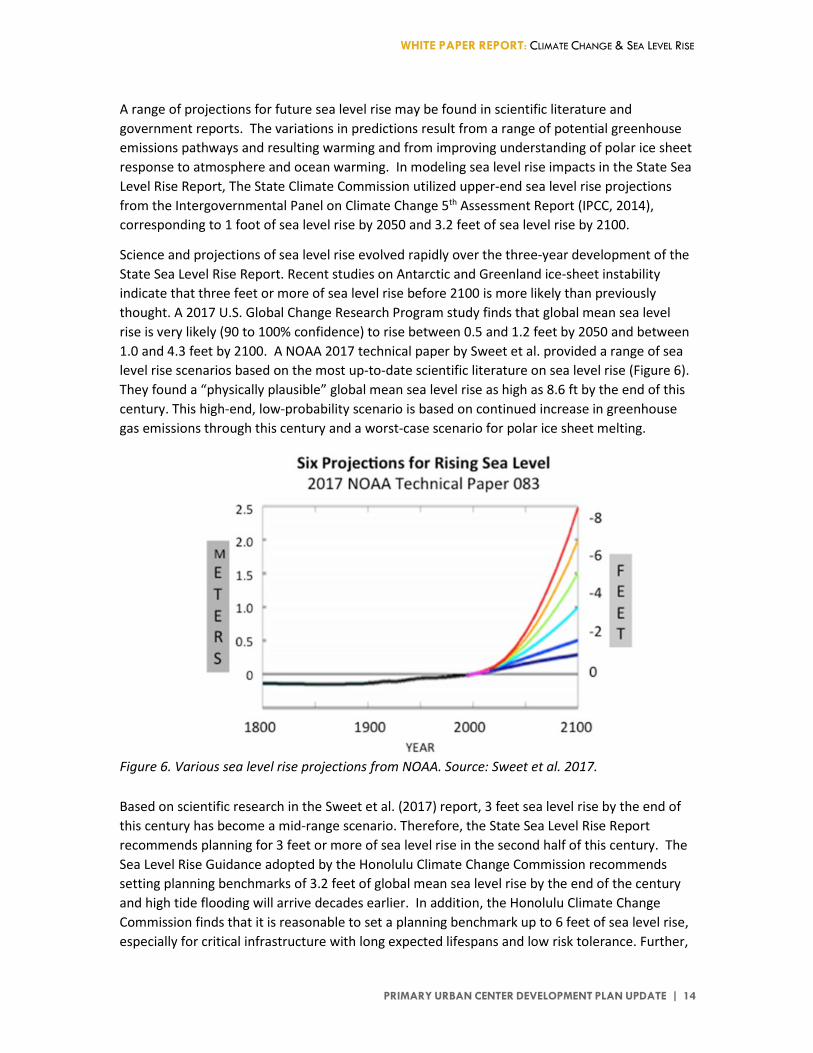
Science and projections of sea level rise evolved rapidly over the three-year development of the State Sea Level Rise Report. Recent studies on Antarctic and Greenland ice-sheet instability indicate that three feet or more of sea level rise before 2100 is more likely than previously thought. A 2017 U.S. Global Change Research Program study finds that global mean sea level rise is very likely (90 to 100% confidence) to rise between 0.5 and 1.2 feet by 2050 and between 1.0 and 4.3 feet by 2100. A NOAA 2017 technical paper by Sweet et al. provided a range of sea level rise scenarios based on the most up-to-date scientific literature on sea level rise (Figure 6). They found a “physically plausible” global mean sea level rise as high as 8.6 ft by the end of this century. This high-end, low-probability scenario is based on continued increase in greenhouse gas emissions through this century and a worst-case scenario for polar ice sheet melting.
Based on scientific research in the Sweet et al. (2017) report, 3 feet sea level rise by the end of this century has become a mid-range scenario. Therefore, the State Sea Level Rise Report recommends planning for 3 feet or more of sea level rise in the second half of this century. The Sea Level Rise Guidance adopted by the Honolulu Climate Change Commission recommends setting planning benchmarks of 3.2 feet of global mean sea level rise by the end of the century and high tide flooding will arrive decades earlier. In addition, the Honolulu Climate Change Commission finds that it is reasonable to set a planning benchmark up to 6 feet of sea level rise, especially for critical infrastructure with long expected lifespans and low risk tolerance. Further,
Figure 6. Various sea level rise projections from NOAA. Source: Sweet et al. 2017.
WHITE PAPER REPORT: CLIMATE CHANGE & SEA LEVEL RISE
PRIMARY URBAN CENTER DEVELOPMENT PLAN UPDATE | 15
the NOAA Sweet et al. (2017) report finds that sea level rise will be greater in low-latitude tropical regions. In Hawai‘i local sea level is projected to be 20%-30% higher than the global mean (Marra and Kruk, 2017). While reports and discussion of sea level rise typically provide projections for this century, sea level rise will continue into the next century and beyond.
Sea Level Rise Hazards & Vulnerabilities Key Take Aways
• It appears increasingly likely that we will see 3 feet or more of sea level rise this century, within the expected lifespans of most existing and new development in the PUC.
• Using the Sea Level Rise Exposure Area (SLR-XA) and other geospatial data from the State Sea Level Rise Report and City GIS program we find that 3.2 feet of sea level rise would cause chronic flooding on 1,727 acres of land, potentially impacting 1,627 buildings, displacing 4,325 residents, and flooding 24 miles of road within the PUC, assuming no adaption measures are employed.
• Economic impacts of sea level rise will be disproportionately high in the PUC due to dense development on low-lying coastal lands, potentially threatening $7.3 billion in structures and land with 3.2 feet of sea level rise.
• The monetary impacts to roads, utilities, and other critical infrastructure is unknown but may be an order of magnitude greater than loss of structures and land.
• Portions of Transit Oriented Development (TOD) areas around the new rail line including Pearlridge, Lagoon Drive, Middle Street, Kapālama, Iwilei, Civic Center, Kaka‘ako and Ala Moana will face chronic flooding impacts with 3.2 feet of sea level rise if no adaptation measures are implemented.
• Widespread chronic flooding will also occur around Waikīkī, the Ala Wai Canal, and lower McCully-Moʻiliʻili with 3.2 feet of sea level rise.
• A University of Hawai‘i model that includes groundwater elevations finds widespread chronic flooding, impaired drainage, and impacts to underground utilities will be more severe with sea level rise than shown in the SLR-XA from the State Sea Level Rise Report. This model also shows a tipping point where flooded area in the PUC increase dramatically between 2 and 3 feet of sea level rise.
• Chronic marine and groundwater flooding with sea level rise will also worsen rainfall flooding as storm water drains back up and groundwater tables rise in low-lying coastal areas.
This section provides an assessment of hazard exposure and vulnerabilities to sea level rise within the PUC. The assessment uses publicly available map data from the State Sea Level Rise Report, companion Hawai‘i Sea Level Rise Viewer, State and City geographic information system (GIS) programs, and recent scientific research from the University of Hawai‘i. This assessment is intended to be consistent with directive No. 18-2, which calls for planning, land-use, and capital improvement decisions to utilize the Sea Level Rise Report and accompanying Viewer. A series
WHITE PAPER REPORT: CLIMATE CHANGE & SEA LEVEL RISE
PRIMARY URBAN CENTER DEVELOPMENT PLAN UPDATE | 16
of overview maps are provided below. Please see the Hawai‘i Sea Level Rise Viewer to explore the results in higher resolution.
The State Sea Level Rise Report used cutting-edge modeling by the University of Hawai‘i Coastal Geology Group at the School of Ocean and Earth Sciences and Technology (Coastal Geology Group) to map areas exposed to three types of chronic sea level rise hazards:
1. Passive (“bathtub” or still-water) flooding; 2. Annual high wave flooding; and 3. Shoreline erosion.
The Sea Level Rise Exposure Area with 3.2 feet of sea level rise (3.2 SLR-XA) represents the combined passive flooding, wave flooding, and coastal erosion hazard areas. The 3.2 SLR-XA shows projected area exposed to chronic flooding with sea level rise. Some areas within the SLR-XA may be affected by one, two, or all three of the modeled hazard types. It is generally assumed in the State Sea Level Rise Report that areas within the 3.2 SLR-XA would become uninhabitable due to chronic flooding with sea level rise if adaptation measures are not implemented or if flooding and land loss becomes too severe to adapt in place.
A brief description of the modeling methods employed in the State Sea Level Rise Report is available in Appendix A. Please see the State Sea Level Rise Report, Anderson et al. (2018), and other references herein for more detail on these methods.
As with all models, it is important to recognize the assumptions and limitations of the models used in the State Sea Level Rise Report and herein. The 3.2 SLR-XA depicts areas exposed to chronic flooding with sea level rise, that is, areas that would be flooded at least once per year with the annual high wave model, and as often as daily with the passive flooding and erosion models. Frequency and severity (e.g., depth and velocity) of chronic flooding in the 3.2 SLR-XA would increase with time. The 3.2 SLR-XA does not account for less frequent floods such as the 1%-annual-chance coastal flood zones depicted in FEMA Flood Insurance Rate Maps, which would also increase in frequency and severity with sea level rise.
Potential economic loss provided here and in the State Sea Level Rise Report are based on present value of land and structures from county tax parcel data and does not account for any future (unknown) adaptation measures or changes in land use and does not include other economic losses such as potential losses of future business income. Economic (monetary) losses from infrastructure (e.g., roads, airports, harbors, utilities) are also not included. However, length of road that would be impacted by sea level rise is calculated. More detailed analysis of exposure and vulnerability is needed to assess potential impacts to utilities and critical infrastructure specific to particular sectors (such as the research and planning around climate change and sea level rise included in the development of the Primary Urban Center District Watershed Management Plan), and will need to include citywide coordination efforts.
For this paper, map data from the State Sea Level Rise Report and State and City GIS program was collected and clipped to the PUC region to assess exposure and vulnerability to sea level rise. Following the recommendations of the City Climate Change Commission and the State Sea Level Rise Report, the 3.2 SLR-XA is considered here as the planning benchmark for new and existing development with expected lifespans into the latter half of this century. As described in

WHITE PAPER REPORT: CLIMATE CHANGE & SEA LEVEL RISE
PRIMARY URBAN CENTER DEVELOPMENT PLAN UPDATE | 17
the Climate Change & Sea Level Rise Outlook, global mean sea level rise of 3.2 feet appears likely by the end of the century and possibly sooner. Areas within the SLR-XA will experience high-tide flooding decades before 3.2 feet of global mean sea level rise is reached. Also following the recommendations of the City Climate Change Commission, we consider 6 feet of sea level rise as a planning benchmark for critical infrastructure with long expected lifespans and low risk tolerance.
The PUC area represents only 18% of O‘ahu’s total land area. However, potential sea level rise impacts within the PUC area are disproportionately higher than elsewhere in the State due to the density of high-value development on low-lying coastal topography. Much of Waikīkī and Ala Moana were developed on filled wetland areas. With 3.2 feet of sea level it is expected that:
• 1,7272 acres of land is exposed to chronic flooding within the PUC;
• 1,627 buildings will be potentially impacted, which is 42% of the buildings on O‘ahu potentially impacted by 3.2 feet of sea level rise;
• 4,325 residents could be displaced, which is about 33% of the total number of people potentially displaced by 3.2 feet of sea level rise on O‘ahu;
• Twenty-four miles of road within the PUC will be chronically flooded with 3.2 feet of sea level rise;
• Public utilities at or below ground level along these roads will also be impacted;
• Flooding is particularly pronounced at the mauka end of Pearl Harbor, Hickam Airforce Base and the reef runway, the industrial area of Māpunapuna, Ala Moana, Waikīkī, and makai portions of McCully-Mō‘ili‘ili.
Again, these results are based on present development and population within the SLR-XA and do not account for future adaptation, densification, changes in demographics, or land use changes.
2 This area was calculated using the SLR-XA clipped with a shoreline boundary from the Hawai‘i State GIS Program to omit areas in the SLR-XA that are already submerged (e.g., the airport reef runway lagoon and Kewalo Basin). The SLR-XA map layers on the Hawai‘i Sea Level Rise Viewer were clipped using the seaward boundary of the coastal Special Management Area (SMA). The maps herein depict the SLR-XA as found on the Hawai‘i Sea Level Rise Viewer (i.e., clipped to the SMA) for visual consistency with the Viewer.
WHITE PAPER REPORT: CLIMATE CHANGE & SEA LEVEL RISE
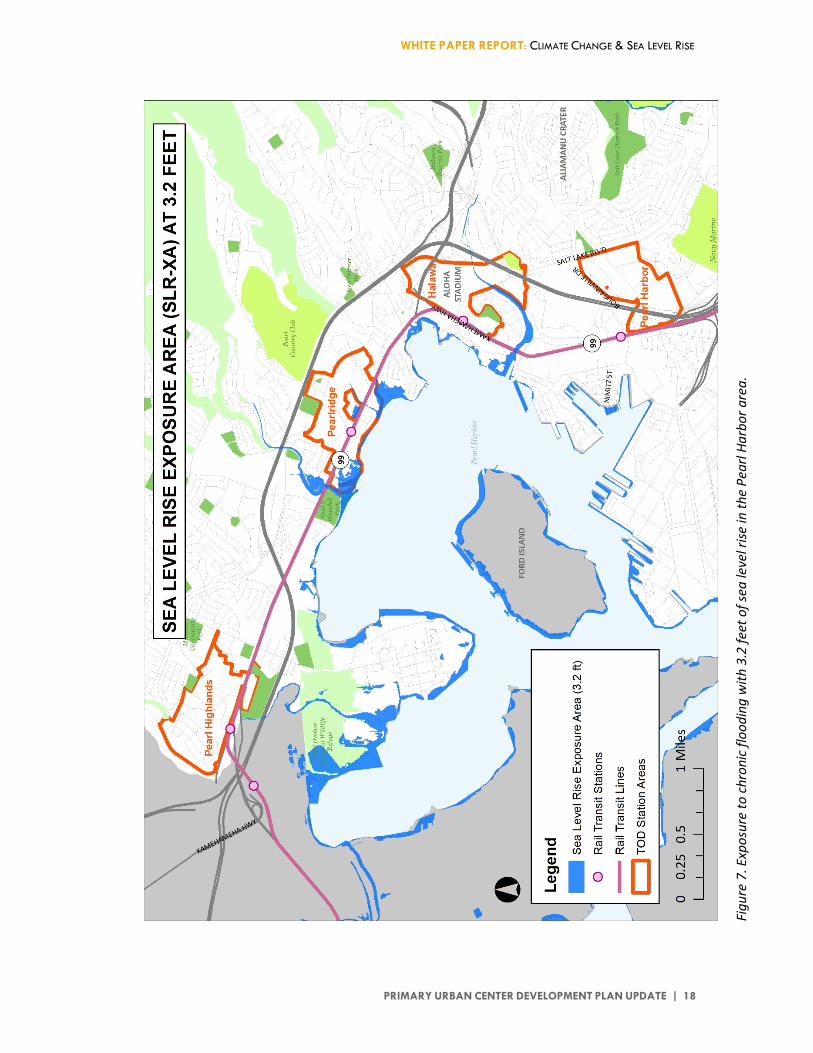
PRIMARY URBAN CENTER DEVELOPMENT PLAN UPDATE | 18
Figu
re 7
. Exp
osur
e to
chr
onic
floo
ding
with
3.2
feet
of s
ea le
vel r
ise in
the
Pear
l Har
bor a
rea.
WHITE PAPER REPORT: CLIMATE CHANGE & SEA LEVEL RISE
PRIMARY URBAN CENTER DEVELOPMENT PLAN UPDATE | 19
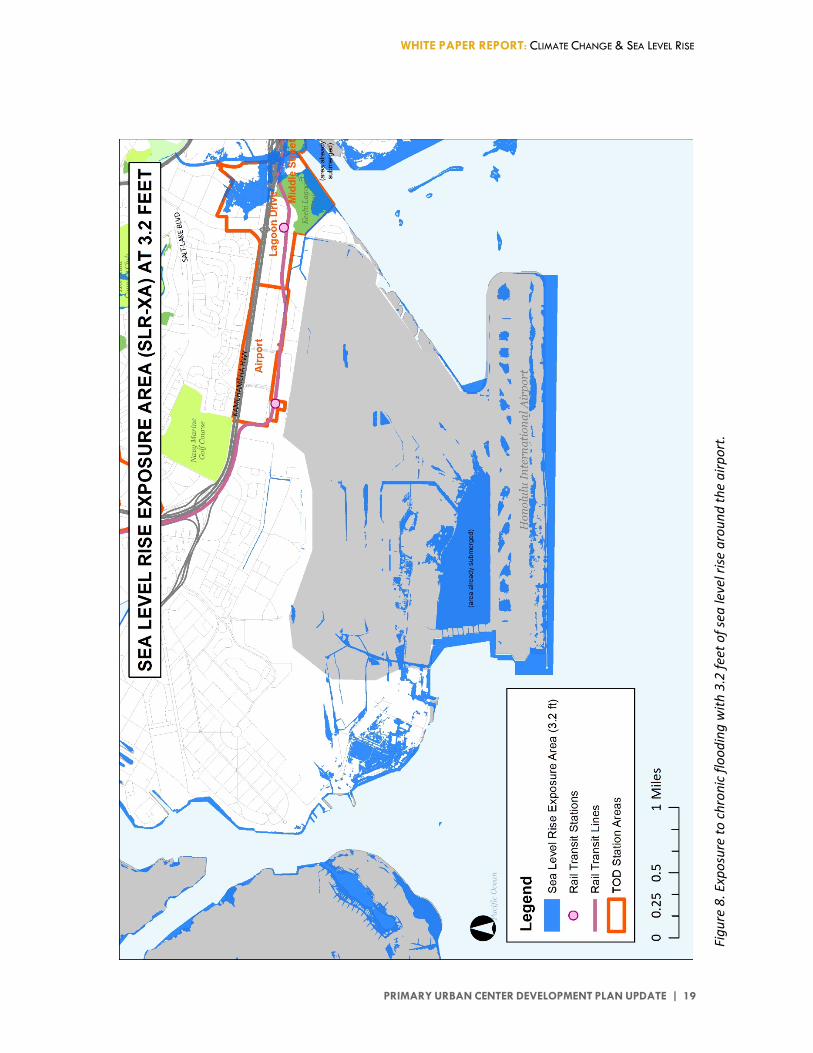
Figu
re 8
. Exp
osur
e to
chr
onic
floo
ding
with
3.2
feet
of s
ea le
vel r
ise a
roun
d th
e ai
rpor
t.
WHITE PAPER REPORT: CLIMATE CHANGE & SEA LEVEL RISE
PRIMARY URBAN CENTER DEVELOPMENT PLAN UPDATE | 20
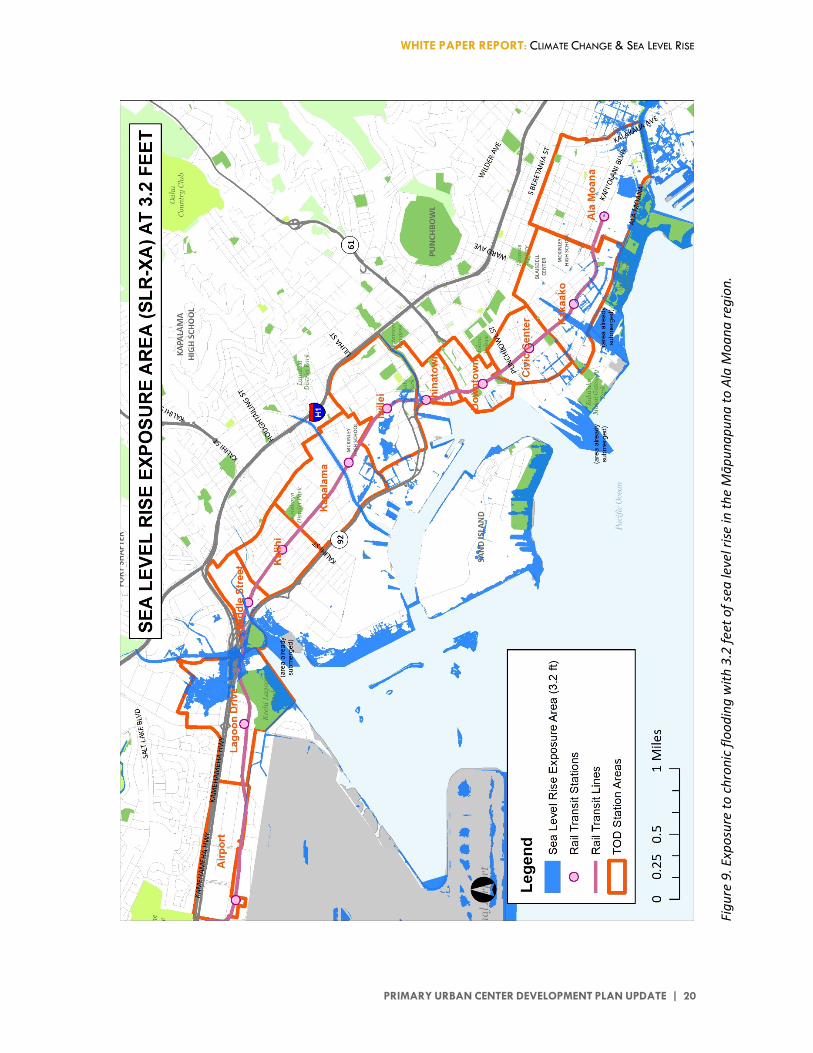
Figu
re 9
. Exp
osur
e to
chr
onic
floo
ding
with
3.2
feet
of s
ea le
vel r
ise in
the
Māp
unap
una
to A
la M
oana
regi
on.

WHITE PAPER REPORT: CLIMATE CHANGE & SEA LEVEL RISE
PRIMARY URBAN CENTER DEVELOPMENT PLAN UPDATE | 21
Figu
re 1
0. E
xpos
ure
to c
hron
ic fl
oodi
ng w
ith 3
.2 fe
et o
f sea
leve
l rise
in th
e Ka
kaʻa
ko to
Kāh
ala
regi
on.
WHITE PAPER REPORT: CLIMATE CHANGE & SEA LEVEL RISE
PRIMARY URBAN CENTER DEVELOPMENT PLAN UPDATE | 22
Sea level rise will lead to impacts to Honolulu’s transportation network including existing roads and proposed development around the rail line. Portions of the Pearlridge, Lagoon Drive, Middle Street, Kapālama, Iwilei, Civic Center, Kaka‘ako, and Ala Moana TOD planning areas are exposed to chronic flooding with 3.2 feet of sea level rise. The rail line, itself, passes through the SLR-XA in several areas including in the Lagoon Drive, Middle Street, Iwilei, and Kaka‘ako TOD areas. Though the rail line is elevated, infrastructure at ground level may still be prone to damage by chronic flooding and/or saltwater intrusion with sea level rise. Elevating roads and utilities passing under the rail line in response to flooding may present a challenge if a minimum overpass height must be maintained below the rail line. More detailed surveying and modeling will be needed at the property-level scale to assess sea level rise flooding risks and assess adaptation options for the rail line, stations, and TOD plan areas.
Based on an overlay of the SLR-XA on present-day tax parcel data (Figure 11):
• $7.3 billion in structures and land could be lost due to chronic flooding with 3.2 feet of sea level rise, assuming no adaptation measures are implemented.
• The economic loss in the PUC is a disproportionately high as a result of high-value development and low-lying topography. Economic loss from 3.2 feet of sea level rise in the PUC accounts for 57% of O‘ahu’s total potential loss and 38% of Hawaii’s total potential loss.
• Areas with the highest economic impacts include the industrial area of Māpunapuna, downtown Honolulu and Honolulu Harbor, Kaka‘ako Makai and particularly Ala Moana and Waikīkī with their dense hotel, residential, and business/retail development.
The monetary impacts to roads, utilities, and other critical infrastructure is unknown and needs more study. However, it may be an order of magnitude greater than potential loss of structures and land. As stated previously, the economic loss calculations do not include other impacts such as losses of future business income.

WHITE PAPER REPORT: CLIMATE CHANGE & SEA LEVEL RISE
PRIMARY URBAN CENTER DEVELOPMENT PLAN UPDATE | 23
Figu
re 1
1. P
oten
tial e
cono
mic
loss
(bui
ldin
gs a
nd la
nd, o
nly)
with
3.2
feet
of s
ea le
vel r
ise in
the
PUC
area
.
WHITE PAPER REPORT: CLIMATE CHANGE & SEA LEVEL RISE
PRIMARY URBAN CENTER DEVELOPMENT PLAN UPDATE | 24
Sea level rise will not stop at 3.2 feet or at 2100. Improving measurement and projections of global and atmospheric temperature increase (e.g. Raftery et al. 2017) and studies of ice sheet dynamics indicate that sea level rise greater than 3.2 feet is more likely in this century than previous thought (Sweet et al. 2017). The Honolulu Climate Change Commission’s Sea Level Rise Guidance recommends considering 6 feet of sea level rise as a planning benchmark for critical infrastructure projects and for projects with long lifespans and low tolerance to potential sea level rise impacts.
Figure 1 depicts the SLR-XA at 3.2 feet of sea level rise along with passive flooding modeled at 6 feet of sea level rise in the PUC from the NOAA Sea Level Rise Viewer. With 6 feet of sea level rise it is expected that:
• 4,689 acres of land would be chronically flooded, which is nearly three times the area (an increase of 171%) exposed to chronic flooding in the SLR-XA at 3.2 feet.
• Much of Pearl City and ‘Aiea makai, the reef runway and much of the airport, Downtown Honolulu, and nearly all of Kaka‘ako, Ala Moana, and Waikīkī seaward of Kapiʻolani Boulevard would be chronically flooded.
This 6-foot sea level rise model does not include impacts from wave overwash and coastal erosion, which would increase the hazard area substantially along wave-exposed shorelines.
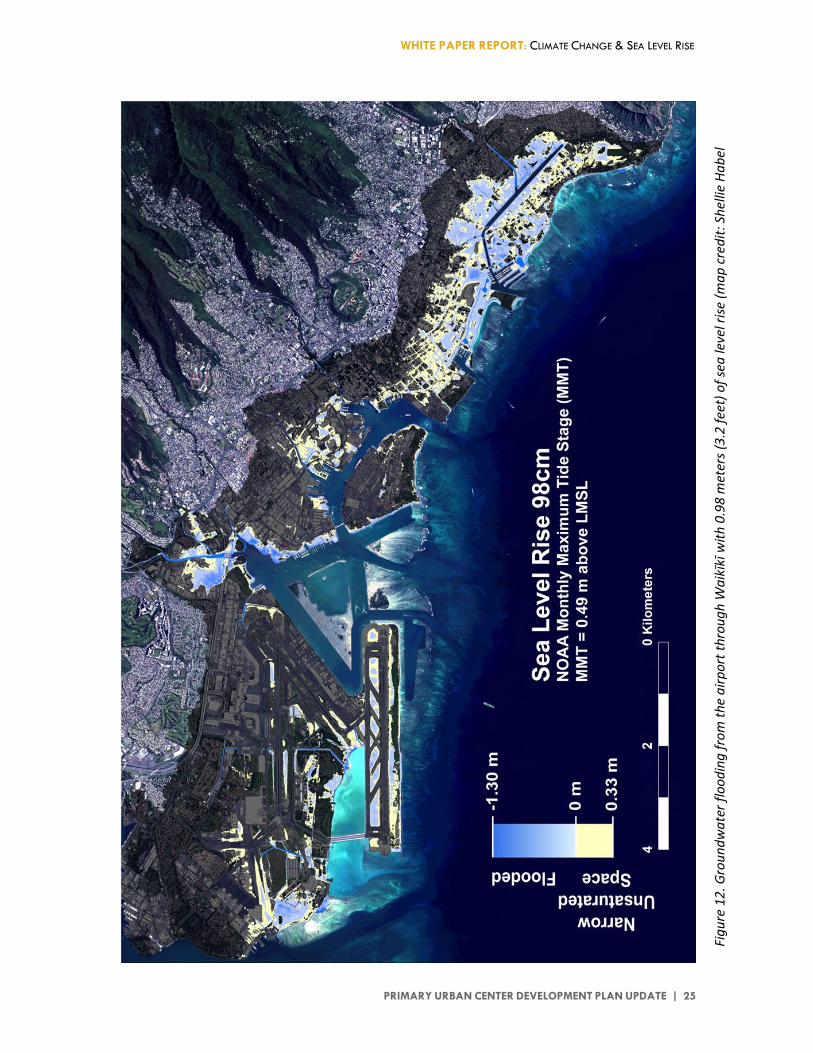
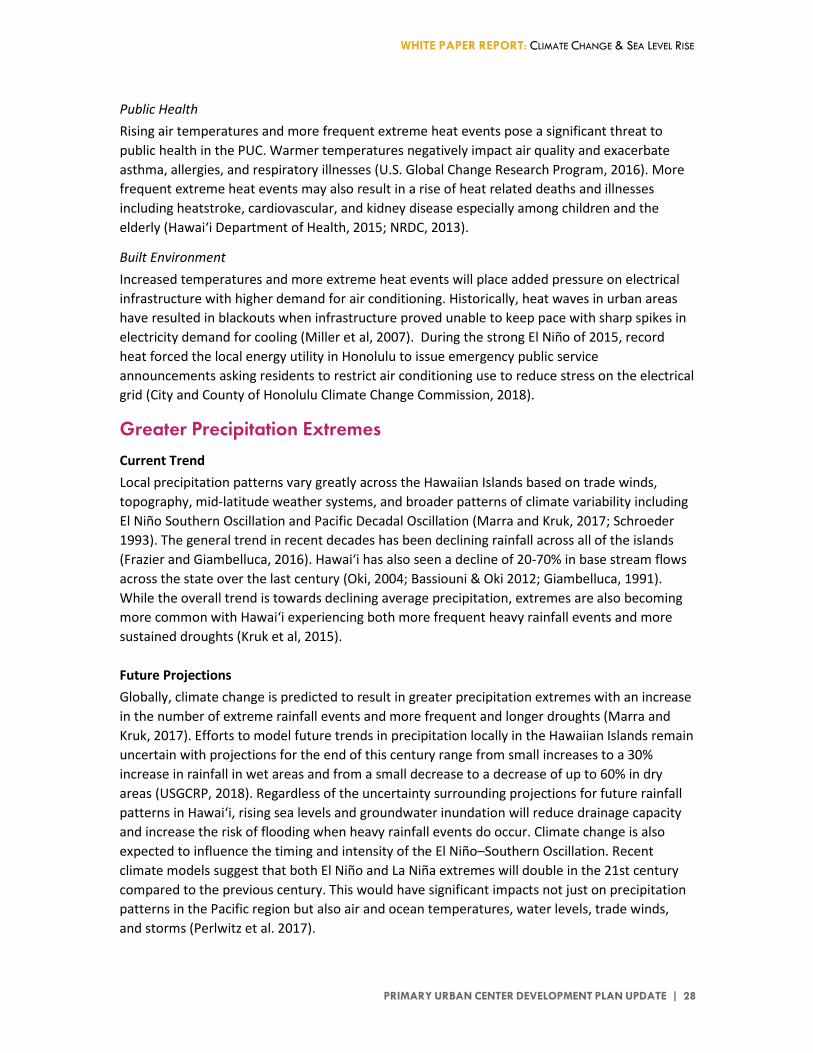
Coastal groundwater levels are typically higher than mean sea level within the PUC and around the low-lying coastal plains of O‘ahu. Groundwater levels in the coastal plain oscillate with the tides. Therefore, as the sea level rises so does the groundwater table. Habel et al. (2017) in their modeling work for the Honolulu Board of Water Supply show that flooding in the PUC will be widespread with 3.2 feet of sea level rise when water table elevations are included in the analysis (Figure 12). Their model depicts areas in blue where groundwater will rise above the surface and in yellow where unsaturated space between the water table and ground surface will be less than 1 foot based on an average monthly highest tide 3.2 feet of sea level rise. One foot was chosen as the threshold for critically narrow unsaturated space because their observations showed that groundwater levels typically rose by about a foot during heavy rains. Their modeling considers sea level rise on top of the mean monthly maximum tide, so these areas would be flooded at least monthly with 3.2 feet of sea level rise.
The groundwater model shows that chronic flooding, impaired drainage, and impacts to underground utilities around the airport and in Māpunapuna, Ala Moana, and Waikīkī will be more severe in backshore areas with sea level rise than is shown in the SLR-XA from the State Sea Level Rise Report. They also find a dramatic shift in flooded area from 2 to 3 feet of sea level rise. One serious impact of rising groundwater will be flooding of onsite sewage disposal systems (e.g. septic systems and cesspools). This will render many of these systems inoperable and have serious negative consequences for groundwater and marine water pollution if sewage infrastructure is not updated and adapted.
WHITE PAPER REPORT: CLIMATE CHANGE & SEA LEVEL RISE
PRIMARY URBAN CENTER DEVELOPMENT PLAN UPDATE | 25
Figu
re 1
2. G
roun
dwat
er fl
oodi
ng fr
om th
e ai
rpor
t thr
ough
Wai
kīkī
with
0.9
8 m
eter
s (3.
2 fe
et) o
f sea
leve
l rise
(map
cre
dit:
Shel
lie H
abel
WHITE PAPER REPORT: CLIMATE CHANGE & SEA LEVEL RISE
PRIMARY URBAN CENTER DEVELOPMENT PLAN UPDATE | 26
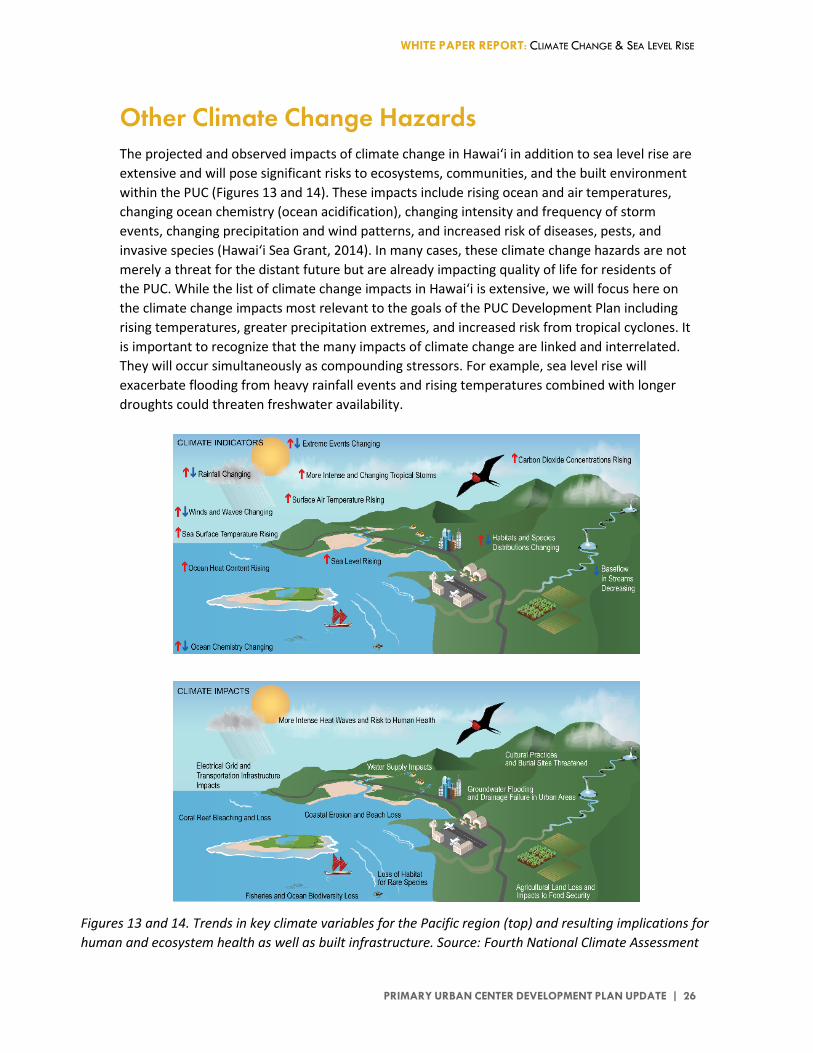
Other Climate Change Hazards The projected and observed impacts of climate change in Hawai‘i in addition to sea level rise are extensive and will pose significant risks to ecosystems, communities, and the built environment within the PUC (Figures 13 and 14). These impacts include rising ocean and air temperatures, changing ocean chemistry (ocean acidification), changing intensity and frequency of storm events, changing precipitation and wind patterns, and increased risk of diseases, pests, and invasive species (Hawai‘i Sea Grant, 2014). In many cases, these climate change hazards are not merely a threat for the distant future but are already impacting quality of life for residents of the PUC. While the list of climate change impacts in Hawai‘i is extensive, we will focus here on the climate change impacts most relevant to the goals of the PUC Development Plan including rising temperatures, greater precipitation extremes, and increased risk from tropical cyclones. It is important to recognize that the many impacts of climate change are linked and interrelated. They will occur simultaneously as compounding stressors. For example, sea level rise will exacerbate flooding from heavy rainfall events and rising temperatures combined with longer droughts could threaten freshwater availability.
Figures 13 and 14. Trends in key climate variables for the Pacific region (top) and resulting implications for human and ecosystem health as well as built infrastructure. Source: Fourth National Climate Assessment
WHITE PAPER REPORT: CLIMATE CHANGE & SEA LEVEL RISE
PRIMARY URBAN CENTER DEVELOPMENT PLAN UPDATE | 27
Rising Temperatures
Current Trend Over the last century, surface air temperatures in Hawai‘i have risen consistently and at a rate slightly faster than the global average (Safeeq 2012; Giambelluca 2008; Marra and Kruk, 2017). The current rate of warming is about 0.3°F per decade and that rate continues to accelerate (Safeeq 2012; Giambelluca 2008). Statewide, the average air temperature has risen by 0.76°F in the last century, and 2015 and 2016 were the warmest years on record (McKenzie 2016). In Honolulu, the number of days with temperatures above 90°F has increased by 200% over the last 50 years, from 5 days per year in 1948 to 15 days per year in 2016 (Marra and Kruk, 2017). During that same time period, the number of nights with temperatures dropping below 65°F has decreased by 50% from an average of 30 nights per year in the early 1950s to 15 nights per year in 2017 (Marra and Kruk, 2017).
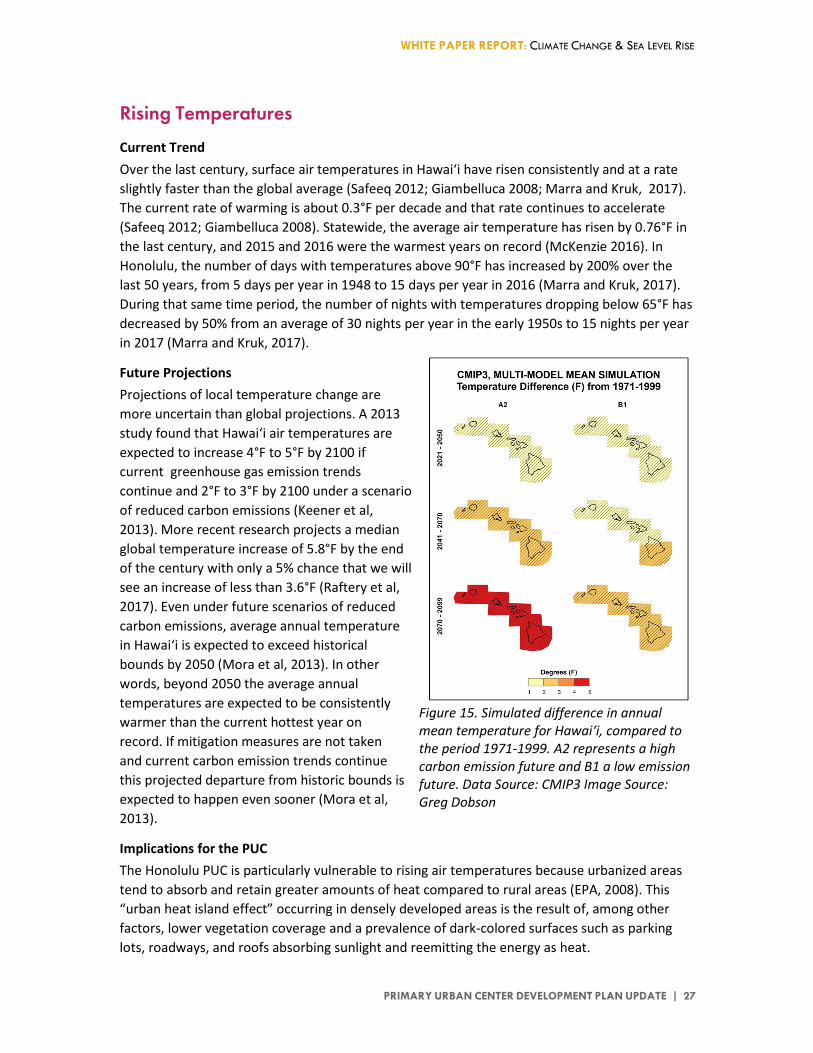
Future Projections Projections of local temperature change are more uncertain than global projections. A 2013 study found that Hawai‘i air temperatures are expected to increase 4°F to 5°F by 2100 if current greenhouse gas emission trends continue and 2°F to 3°F by 2100 under a scenario of reduced carbon emissions (Keener et al, 2013). More recent research projects a median global temperature increase of 5.8°F by the end of the century with only a 5% chance that we will see an increase of less than 3.6°F (Raftery et al, 2017). Even under future scenarios of reduced carbon emissions, average annual temperature in Hawai‘i is expected to exceed historical bounds by 2050 (Mora et al, 2013). In other words, beyond 2050 the average annual temperatures are expected to be consistently warmer than the current hottest year on record. If mitigation measures are not taken and current carbon emission trends continue this projected departure from historic bounds is expected to happen even sooner (Mora et al, 2013).
Implications for the PUC The Honolulu PUC is particularly vulnerable to rising air temperatures because urbanized areas tend to absorb and retain greater amounts of heat compared to rural areas (EPA, 2008). This “urban heat island effect” occurring in densely developed areas is the result of, among other factors, lower vegetation coverage and a prevalence of dark-colored surfaces such as parking lots, roadways, and roofs absorbing sunlight and reemitting the energy as heat.
Figure 15. Simulated difference in annual mean temperature for Hawai‘i, compared to the period 1971-1999. A2 represents a high carbon emission future and B1 a low emission future. Data Source: CMIP3 Image Source: Greg Dobson
WHITE PAPER REPORT: CLIMATE CHANGE & SEA LEVEL RISE
PRIMARY URBAN CENTER DEVELOPMENT PLAN UPDATE | 28
Public Health Rising air temperatures and more frequent extreme heat events pose a significant threat to public health in the PUC. Warmer temperatures negatively impact air quality and exacerbate asthma, allergies, and respiratory illnesses (U.S. Global Change Research Program, 2016). More frequent extreme heat events may also result in a rise of heat related deaths and illnesses including heatstroke, cardiovascular, and kidney disease especially among children and the elderly (Hawai‘i Department of Health, 2015; NRDC, 2013).
Built Environment Increased temperatures and more extreme heat events will place added pressure on electrical infrastructure with higher demand for air conditioning. Historically, heat waves in urban areas have resulted in blackouts when infrastructure proved unable to keep pace with sharp spikes in electricity demand for cooling (Miller et al, 2007). During the strong El Niño of 2015, record heat forced the local energy utility in Honolulu to issue emergency public service announcements asking residents to restrict air conditioning use to reduce stress on the electrical grid (City and County of Honolulu Climate Change Commission, 2018).
Greater Precipitation Extremes Current Trend Local precipitation patterns vary greatly across the Hawaiian Islands based on trade winds, topography, mid-latitude weather systems, and broader patterns of climate variability including El Niño Southern Oscillation and Pacific Decadal Oscillation (Marra and Kruk, 2017; Schroeder 1993). The general trend in recent decades has been declining rainfall across all of the islands (Frazier and Giambelluca, 2016). Hawai‘i has also seen a decline of 20-70% in base stream flows across the state over the last century (Oki, 2004; Bassiouni & Oki 2012; Giambelluca, 1991). While the overall trend is towards declining average precipitation, extremes are also becoming more common with Hawai‘i experiencing both more frequent heavy rainfall events and more sustained droughts (Kruk et al, 2015). Future Projections Globally, climate change is predicted to result in greater precipitation extremes with an increase in the number of extreme rainfall events and more frequent and longer droughts (Marra and Kruk, 2017). Efforts to model future trends in precipitation locally in the Hawaiian Islands remain uncertain with projections for the end of this century range from small increases to a 30% increase in rainfall in wet areas and from a small decrease to a decrease of up to 60% in dry areas (USGCRP, 2018). Regardless of the uncertainty surrounding projections for future rainfall patterns in Hawai‘i, rising sea levels and groundwater inundation will reduce drainage capacity and increase the risk of flooding when heavy rainfall events do occur. Climate change is also expected to influence the timing and intensity of the El Niño–Southern Oscillation. Recent climate models suggest that both El Niño and La Niña extremes will double in the 21st century compared to the previous century. This would have significant impacts not just on precipitation patterns in the Pacific region but also air and ocean temperatures, water levels, trade winds, and storms (Perlwitz et al. 2017).

WHITE PAPER REPORT: CLIMATE CHANGE & SEA LEVEL RISE
PRIMARY URBAN CENTER DEVELOPMENT PLAN UPDATE | 29
Implications for PUC
Public Health Increased runoff combined with warmer temperatures will likely result in negative impacts on water quality in the PUC leading to higher risks of illness from waterborne pathogens and more frequent beach closings (Hawai‘i Department of Health, 2015). While the PUC has fewer onsite wastewater treatment and disposal systems compared to more rural areas of the state, a recent study found 259 active cesspool sites within the PUC and of those 86% are likely already compromised due to inundation (Habel et al, 2017).
Freshwater Availability In addition to water quality concerns, climate change could have important implications for freshwater availability in the PUC. If the trend of longer droughts and declining base stream flows continues, it will negatively impact ground-water storage and recharge placing added stress on the state’s primary source of drinking water (Oki, 2004; Leong, 2014). Warming air temperatures contributing to increased evaporation would further reduce water supplies (City and County of Honolulu Climate Change Commission, 2018). O‘ahu depends heavily on groundwater and could experience chronic water shortages if faced with the compounding future stressors of decreased rainfall, higher temperatures, and population growth (USGCRP, 2018).
Increased Risk from Tropical Cyclones Trends Tropical cyclones are relatively rare in Hawai‘i. Only eight named storms directly impacted the Hawaiian Islands between 1979 and 2010 (Murakami et al., 2013). However, the state’s isolation and heavy dependence on imports makes it extremely vulnerable to the impacts of tropical cyclones. The long-term economic impact of Hurricane Iniki, the largest hurricane on record to hit the Hawaiian Islands, provides a stark demonstration of this vulnerability. Hurricane Iniki made landfall on Kaua‘i in 1992. In the aftermath of the storm it took seven years for per capita income on the island to rebound to pre-hurricane levels and even longer to achieve full population and labor force recovery (Coffman and Noy, 2011). Future Projections Globally, climate change is expected to result in more intense tropical cyclones (Leong et al. 2014). Modeling of tropical cyclones in the broader Pacific Ocean has predicted a northward shift in storm tracks that would result in tropical cyclones reaching the Hawaiian Islands more frequently (Murakami et al. 2013). The impact of more frequent and intense tropical cyclones in the Hawaiian Islands would be further magnified by sea level rise contributing to more damaging storm surge. Figure 16 depicts storm surge inundation from a direct strike of a Category 4 hurricane to the PUC at present day sea level and Figure 17 depicts storm surge with one meter (3.3 feet) of sea level rise. The scenario is based on a storm similar to Hurricane Iniki, and does not include additional flooding from rainfall. The model shows that the depth and extent of storm surge flooding will increase dramatically with sea level rise in all low-lying coastal areas of the PUC.
WHITE PAPER REPORT: CLIMATE CHANGE & SEA LEVEL RISE
PRIMARY URBAN CENTER DEVELOPMENT PLAN UPDATE | 30
Implications for PUC
Because a significant portion of Hawaii’s population, economic assets, and critical infrastructure are concentrated within the PUC the consequences of a tropical cyclone hitting the area would have state-wide impacts. Built Environment The main airport for the State of Hawai‘i is located within the PUC and serves as a major transportation hub servicing more than 20 million visitors annually. The airport is located on a low-lying coastal plain with one of four active runways built completely offshore and is therefore highly vulnerable to storm surge. The State’s primary port of entry for overseas cargo, Honolulu Harbor, is also located within the PUC. Hawai‘i is highly dependent on imported goods. An estimated 88% of the food and more than 80% of the energy consumed within the state is imported primarily through the port system (Loke and Leong, 2013; Hawaiian Electric, 2018). Because of the state’s geographic isolation and dependence on imports, emergency officials recommend that residents be prepared with enough water, food, and supplies to last at least two weeks in the event of a major natural disaster. Economy An estimated 76% of total employment on O‘ahu is concentrated in the PUC and much of that in low-lying coastal areas. A vulnerability assessment conducted by the National Disaster Preparedness Training Center found that in Waikīkī alone (an area responsible for generating 9.6% of the state’s tax revenue) a Category 4 hurricane would result in an expected $2.3 billion in property damage and business interruption losses. The economic damage associated with a tropical cyclone would be further magnified by sea level rise contributing to higher storm surge. Public Health In addition to threatening loss of life and injury, tropical cyclones present significant risk to food security in Hawai‘i. With 88% of food imported, the state’s food supply is highly vulnerable to disaster events that could disrupt shipping and distribution (Loke and Leong, 2013).
WHITE PAPER REPORT: CLIMATE CHANGE & SEA LEVEL RISE
PRIMARY URBAN CENTER DEVELOPMENT PLAN UPDATE | 31
Figu
re 1
6. M
odel
ed h
urric
ane
stor
m su
rge
inun
datio
n de
pths
bas
ed o
n a
cate
gory
four
hur
rican
e st
rikin
g ur
ban
Hono
lulu
bas
ed o
n pr
esen
t-da
y se
a le
vel (
paci
oos.
haw
aii.e
du/s
hore
line/
slr-h
onol
ulu/
).

WHITE PAPER REPORT: CLIMATE CHANGE & SEA LEVEL RISE
PRIMARY URBAN CENTER DEVELOPMENT PLAN UPDATE | 32
Figu
re 1
7.
Mod
eled
hur
rican
e st
orm
surg
e in
unda
tion
dept
hs b
ased
on
a ca
tego
ry fo
ur h
urric
ane
strik
ing
urba
n Ho
nolu
lu w
ith o
ne m
eter
(3.3
fe
et) o
f sea
leve
l rise
(pac
ioos
.haw
aii.e
du/s
hore
line/
slr-h
onol
ulu/
).

WHITE PAPER REPORT: CLIMATE CHANGE & SEA LEVEL RISE
PRIMARY URBAN CENTER DEVELOPMENT PLAN UPDATE | 33
Considerations for Planning and Adaptation Overarching Themes Supporting each of the adaptation strategies discussed below are two overarching themes. These key approaches should be integrated into all aspects of the PUC Development Plan in keeping with directive No. 18-2 which requires all City departments and agencies to, “consider how sea level rise and associated climate change risks will impact the City’s residents and visitors, infrastructure, communities, policies and programs, investments, and natural resources, cultural and recreation sites, and fiscal security…”
Consider 3.2 feet of sea level rise (3.2 SLR-XA) for all planning decisions and 6 feet of sea level rise for planning decisions with especially long lifespans or low risk tolerance. Planning decisions made today through the PUC DP will shape development with life spans extending into the latter half of this century and beyond. Considering the 3.2 SLR-XA as a hazard overlay in all planning decisions is a critical first step in preparing for and adapting to sea level rise. For planning decision related to critical infrastructure with particularly long expected lifespans or low risk tolerance, 6 feet of sea level rise should be considered. This aligns with the requirements of directive No. 18-2 and the recommendations of the City Climate Change Commission Sea Level Rise Guidence and the State Sea Level Rise Report.
Support resilience actions that provide multiple benefits Resilience actions that provide multiple benefits allow for more effective leveraging of resources and acknowledge the connections between climate change vulnerabilities and broader social, economic, and cultural factors impacting quality of life in the PUC. There are many opportunities to enhance resilience to present-day natural hazards, climate change, and sea level rise by strategically incorporating adaptation measures into ongoing community improvement projects and planning efforts. By taking a regional and long-term view, the PUC DP process can help identify resilience actions with multiple benefits. In this approach the PUC DP should also consider opportunities to align policies and planning actions with the O‘ahu Resilience Strategy and the updated City Hazard Mitigation Plan (both currently in development) as well as other related plans and policies.
Other Sea Level Rise Planning and Adaptation Strategies Planning efforts in the PUC can benefit from the example of other communities that have implemented innovative and effective adaptation strategies. Additionally, a host of tools and guidance documents have been developed by experts to identify and summarize best practices for adaptation. Included in this section alongside adaptation and mitigation strategies for consideration in the Honolulu PUC DP are case studies which highlight other communities that have implemented similar strategies successfully and best practices which offer guidelines developed by experts to aid planners and decision makers in choosing and implementing strategies effectively.
WHITE PAPER REPORT: CLIMATE CHANGE & SEA LEVEL RISE
PRIMARY URBAN CENTER DEVELOPMENT PLAN UPDATE | 34
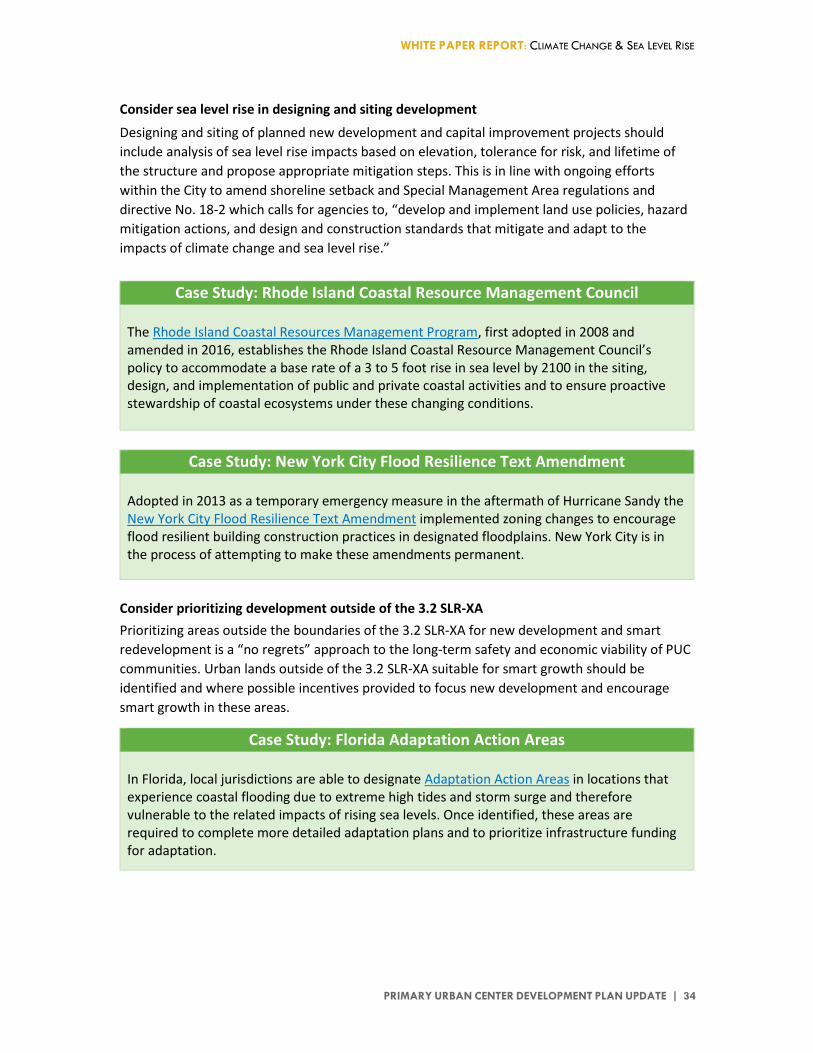
Consider sea level rise in designing and siting development
Designing and siting of planned new development and capital improvement projects should include analysis of sea level rise impacts based on elevation, tolerance for risk, and lifetime of the structure and propose appropriate mitigation steps. This is in line with ongoing efforts within the City to amend shoreline setback and Special Management Area regulations and directive No. 18-2 which calls for agencies to, “develop and implement land use policies, hazard mitigation actions, and design and construction standards that mitigate and adapt to the impacts of climate change and sea level rise.”
Case Study: Rhode Island Coastal Resource Management Council
The Rhode Island Coastal Resources Management Program, first adopted in 2008 and amended in 2016, establishes the Rhode Island Coastal Resource Management Council’s policy to accommodate a base rate of a 3 to 5 foot rise in sea level by 2100 in the siting, design, and implementation of public and private coastal activities and to ensure proactive stewardship of coastal ecosystems under these changing conditions.
Case Study: New York City Flood Resilience Text Amendment
Adopted in 2013 as a temporary emergency measure in the aftermath of Hurricane Sandy the New York City Flood Resilience Text Amendment implemented zoning changes to encourage flood resilient building construction practices in designated floodplains. New York City is in the process of attempting to make these amendments permanent.
Consider prioritizing development outside of the 3.2 SLR-XA Prioritizing areas outside the boundaries of the 3.2 SLR-XA for new development and smart redevelopment is a “no regrets” approach to the long-term safety and economic viability of PUC communities. Urban lands outside of the 3.2 SLR-XA suitable for smart growth should be identified and where possible incentives provided to focus new development and encourage smart growth in these areas.
Case Study: Florida Adaptation Action Areas In Florida, local jurisdictions are able to designate Adaptation Action Areas in locations that experience coastal flooding due to extreme high tides and storm surge and therefore vulnerable to the related impacts of rising sea levels. Once identified, these areas are required to complete more detailed adaptation plans and to prioritize infrastructure funding for adaptation.
WHITE PAPER REPORT: CLIMATE CHANGE & SEA LEVEL RISE
PRIMARY URBAN CENTER DEVELOPMENT PLAN UPDATE | 35
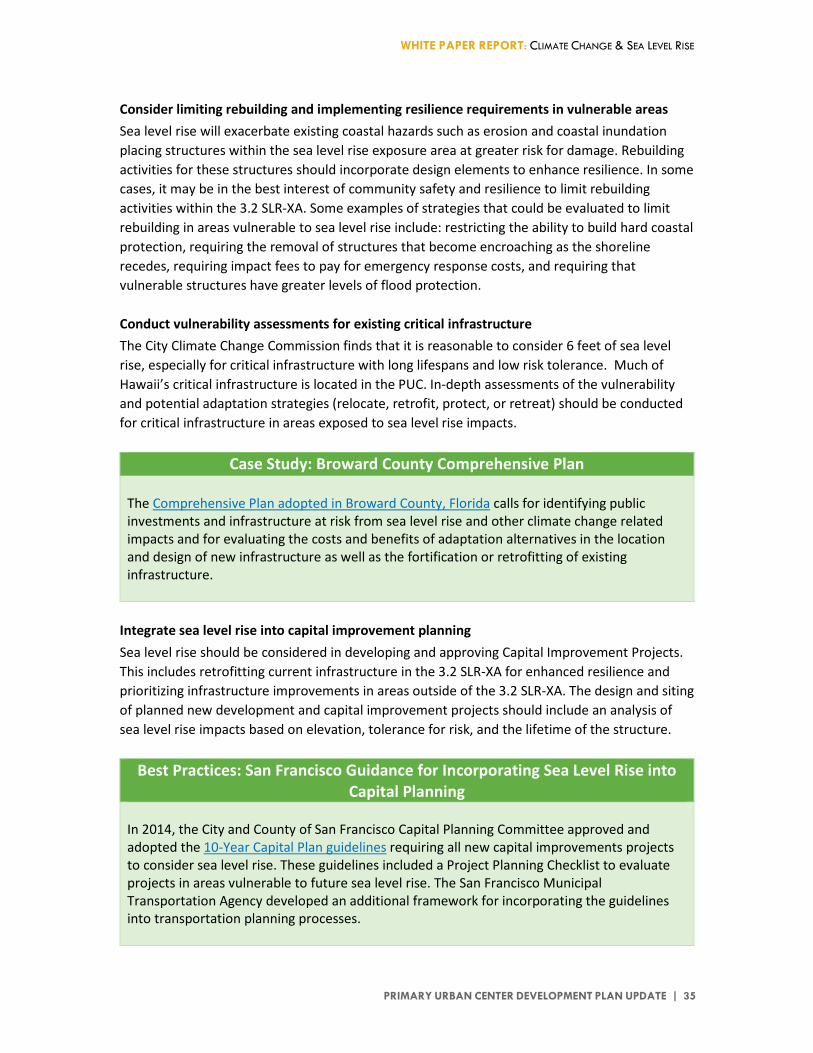
Consider limiting rebuilding and implementing resilience requirements in vulnerable areas Sea level rise will exacerbate existing coastal hazards such as erosion and coastal inundation placing structures within the sea level rise exposure area at greater risk for damage. Rebuilding activities for these structures should incorporate design elements to enhance resilience. In some cases, it may be in the best interest of community safety and resilience to limit rebuilding activities within the 3.2 SLR-XA. Some examples of strategies that could be evaluated to limit rebuilding in areas vulnerable to sea level rise include: restricting the ability to build hard coastal protection, requiring the removal of structures that become encroaching as the shoreline recedes, requiring impact fees to pay for emergency response costs, and requiring that vulnerable structures have greater levels of flood protection. Conduct vulnerability assessments for existing critical infrastructure The City Climate Change Commission finds that it is reasonable to consider 6 feet of sea level rise, especially for critical infrastructure with long lifespans and low risk tolerance. Much of Hawaii’s critical infrastructure is located in the PUC. In-depth assessments of the vulnerability and potential adaptation strategies (relocate, retrofit, protect, or retreat) should be conducted for critical infrastructure in areas exposed to sea level rise impacts.
Case Study: Broward County Comprehensive Plan The Comprehensive Plan adopted in Broward County, Florida calls for identifying public investments and infrastructure at risk from sea level rise and other climate change related impacts and for evaluating the costs and benefits of adaptation alternatives in the location and design of new infrastructure as well as the fortification or retrofitting of existing infrastructure.
Integrate sea level rise into capital improvement planning Sea level rise should be considered in developing and approving Capital Improvement Projects. This includes retrofitting current infrastructure in the 3.2 SLR-XA for enhanced resilience and prioritizing infrastructure improvements in areas outside of the 3.2 SLR-XA. The design and siting of planned new development and capital improvement projects should include an analysis of sea level rise impacts based on elevation, tolerance for risk, and the lifetime of the structure.
Best Practices: San Francisco Guidance for Incorporating Sea Level Rise into Capital Planning
In 2014, the City and County of San Francisco Capital Planning Committee approved and adopted the 10-Year Capital Plan guidelines requiring all new capital improvements projects to consider sea level rise. These guidelines included a Project Planning Checklist to evaluate projects in areas vulnerable to future sea level rise. The San Francisco Municipal Transportation Agency developed an additional framework for incorporating the guidelines into transportation planning processes.
WHITE PAPER REPORT: CLIMATE CHANGE & SEA LEVEL RISE
PRIMARY URBAN CENTER DEVELOPMENT PLAN UPDATE | 36
Enhance community resilience through expanded parklands Wetlands, beaches, and floodplains can provide critical protection against inundation from sea level rise and increased storm events. Strategically expanding parklands and establishing new parks to provide buffer areas around wetlands, beaches, and floodplains will allow for natural migration and expansion of these areas as sea levels rise. In some cases, it may be advisable to limit new development or rebuilding activities in these buffer areas to preserve the important flood mitigation services and wildlife habitat they provide.
Case Study: Wetlands Buffers in Massachusetts Wetland regulations for the Town of Falmouth, MA require consideration of sea level rise for development within the 100-year floodplain in order to allow for landward migration of salt marshes, coastal dunes, and barrier beaches. The Town of Barnstable established a 50-foot buffer zone around wetland areas to accommodate increased flooding with sea level rise.
Best Practices: Resource Guide for Planning, Designing, and Implementing
Green Infrastructure in Parks Developed by the National Recreation and Park Association the Resource Guide for Planning, Designing, and Implementing Green Infrastructure in Parks outlines best practices for integrating green infrastructure concepts and practices into park design, construction, and maintenance. The guide offers strategies, examples, and resources for each stage of green infrastructure projects from siting and design through implementation.
Support beach preservation Beaches are important community resources and economic assets for the PUC. Waikīkī Beach alone brings an estimated $2.22 billion to the local economy (Tarui et al, 2018). The State Sea Level Rise Report recommends development of public-private partnerships for beach preservation. This type of partnership is already underway in the PUC through the Waikiki Beach Special Improvement District Association (WBSIDA). The PUC planning process should support the WBSIDA and similar efforts to maintain beaches that provide critical economic, social, and resilience benefits to the area. This is consistent with directive No. 18-2 which call for action to conserve and enhance natural shoreline wherever possible.
Case Study: Waikiki Beach Special Improvement District Created in 2015 by city ordinance, the Waikiki Beach Special Improvement District aims to preserve and restore the beaches of Waikīkī and provide consistent and credible management for beach revitalization. Commercial properties in the area are accessed a Special Improvement Tax based on property value. The Waikiki Beach Special Improvement District Association (a private non-profit entity with representation from property owners, stakeholders, and state and county government) manages the district. The Waikiki Beach Special Improvement District is nationally recognized as an innovative and effective example of public-private partnership addressing the complicated challenges of beach management.

WHITE PAPER REPORT: CLIMATE CHANGE & SEA LEVEL RISE
PRIMARY URBAN CENTER DEVELOPMENT PLAN UPDATE | 37
Consider adopting design standards to enhance resilience in government buildings and public and affordable housing projects Design standards should be established to enhance resilience in government buildings and affordable housing projects. These structures can serve as example of resilient design for the public. Some examples of potential design standards include: utilizing green roofs and lighter colored surfaces (parking lots, pavement, rooftops, etc.) to combat the urban heat island effect, placing critical electrical and mechanical equipment on higher floors to protect from flooding, and employing measures to protect underground utilities and telecommunications infrastructure from water damage.
Best Practices: New York City Climate Resiliency Design Guidelines In April of 2017 the Mayor’s Office of Recovery and Resiliency in New York City developed standardized guidance for incorporating multiple climate change impacts into all new construction and substantial improvements of City buildings and infrastructure. The New York City Climate Resiliency Design Guidelines address impacts including projected changes in temperature, storm events, and sea levels. The guidelines also include a recommendation that large projects conduct a full climate risk assessment and develop a resilient design specific to each facility.
Best Practices: Strategies for Multifamily Building Resilience
Funded through the U.S. Department of Housing and Urban Development, Strategies for Multifamily Building Resilience offers approaches specifically for multifamily buildings to enhance resilience. While these guidelines focus on extreme weather events many of the standards outlined also provide benefits for climate change adaptation more broadly.
Plan for disaster recovery Effective pre-disaster planning enhances a community’s ability to build back stronger and more resilient in the aftermath of a disaster. Pre-disaster planning considers the objectives, resources, and needs of the community and guides post-disaster decisions and investments in a strategic fashion (FEMA, 2017). Elements of pre-disaster planning should be integrated as part of the PUC DP update community visioning process. Incorporating elements of pre-disaster planning into the PUC DP provides an important opportunity for cross plan integration. In particular, the PUC DP should be aligned with the ongoing update of the City and County of Honolulu Multi-Hazard Pre-Disaster Mitigation Plan as well as the Office of Climate Change Sustainability, and Resiliency effort to conduct island-wide pre-disaster planning.
Best Practices: FEMA Pre-Disaster Recovery Planning Guide for Local Governments
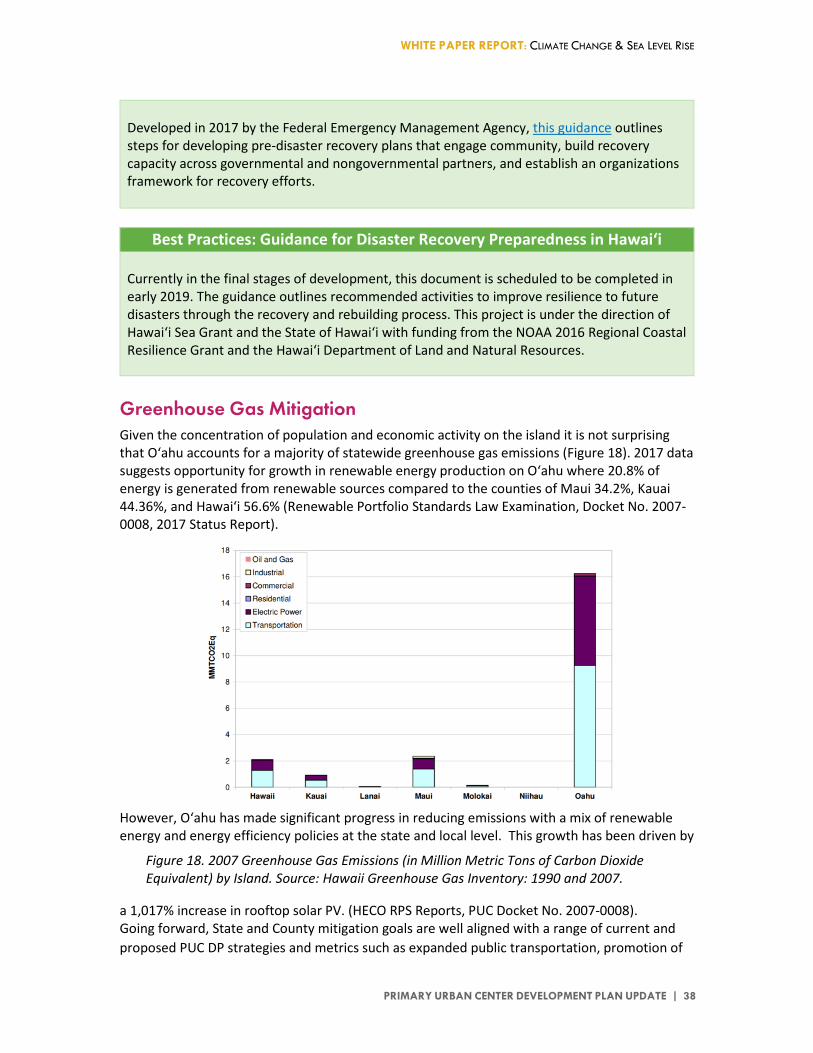
WHITE PAPER REPORT: CLIMATE CHANGE & SEA LEVEL RISE
PRIMARY URBAN CENTER DEVELOPMENT PLAN UPDATE | 38
Developed in 2017 by the Federal Emergency Management Agency, this guidance outlines steps for developing pre-disaster recovery plans that engage community, build recovery capacity across governmental and nongovernmental partners, and establish an organizations framework for recovery efforts.
Best Practices: Guidance for Disaster Recovery Preparedness in Hawai‘i
Currently in the final stages of development, this document is scheduled to be completed in early 2019. The guidance outlines recommended activities to improve resilience to future disasters through the recovery and rebuilding process. This project is under the direction of Hawaiʻi Sea Grant and the State of Hawaiʻi with funding from the NOAA 2016 Regional Coastal Resilience Grant and the Hawaiʻi Department of Land and Natural Resources.
Greenhouse Gas Mitigation Given the concentration of population and economic activity on the island it is not surprising that O‘ahu accounts for a majority of statewide greenhouse gas emissions (Figure 18). 2017 data suggests opportunity for growth in renewable energy production on O‘ahu where 20.8% of energy is generated from renewable sources compared to the counties of Maui 34.2%, Kauai 44.36%, and Hawai‘i 56.6% (Renewable Portfolio Standards Law Examination, Docket No. 2007-0008, 2017 Status Report).
However, O‘ahu has made significant progress in reducing emissions with a mix of renewable energy and energy efficiency policies at the state and local level. This growth has been driven by
a 1,017% increase in rooftop solar PV. (HECO RPS Reports, PUC Docket No. 2007-0008). Going forward, State and County mitigation goals are well aligned with a range of current and proposed PUC DP strategies and metrics such as expanded public transportation, promotion of
Figure 18. 2007 Greenhouse Gas Emissions (in Million Metric Tons of Carbon Dioxide Equivalent) by Island. Source: Hawaii Greenhouse Gas Inventory: 1990 and 2007.

WHITE PAPER REPORT: CLIMATE CHANGE & SEA LEVEL RISE
PRIMARY URBAN CENTER DEVELOPMENT PLAN UPDATE | 39
walkable and bikeable neighborhoods, increased access to parks and greenspace, and enhanced climate resiliency.
Figure 20. O‘ahu Greenhouse Gas Emission Inventory 2005 and 2015, and Percent Change. Source: Office of Climate Change, Sustainability and Resiliency. In 2015, Hawai‘i committed to 100% renewable electricity generation by 2045 (Act 97). The state has been making steady progress towards this goal, primarily through expanded solar power, with minor contributions from wind power. Beyond expanding use of renewable energy, it is important to make efforts to reduce energy use. The PUC DP can address building-level energy use by encouraging the use of sustainable rating systems (such as LEED-NC, LEED-ND or Well Building), supporting incentives to promote residential and commercial energy efficiency retrofits, supporting the implementation of stronger baseline efficiency regulations for new construction, and supporting cool/green roof implementation. In December 2017 the mayors of
Sector 2005 (MT CO2e) 2015 (MT CO2e) % ChangeResidential Energy 2,031,914.00 1,530,991.00 -24.7%Commercial Energy 2,415,494.00 2,103,939.00 -12.9%Manufacturing and Construction 2,506,989.00 2,166,697.00 -13.6%Energy Industries 1,946,098.00 1,627,611.00 -16.4%On-road Transportation 3,080,107.00 2,944,333.00 -4.4%Air Transportation 2,551,340.00 1,935,156.00 -24.2%Marine Transportation 1,205,959.00 451,637.00 -62.5%Off-road/ Other Transportation 134,352.00 113,912.00 -15.2%Waste and Wastewater 723,335.00 774,878.00 7.1%IPPU 365,048.00 391,060.00 7.1%AFOFLU 567,852.00 608,315.00 7.1%Total 17,528,488.00 14,648,529.00 -16.4%
Figure 19. City and County of Honolulu 2005 and 2015 Greenhouse Gas Inventory (Sectorial breakdown in Metric Tons of Carbon Dioxide Equivalent). Source: Office of Climate Change, Sustainability and Resiliency.
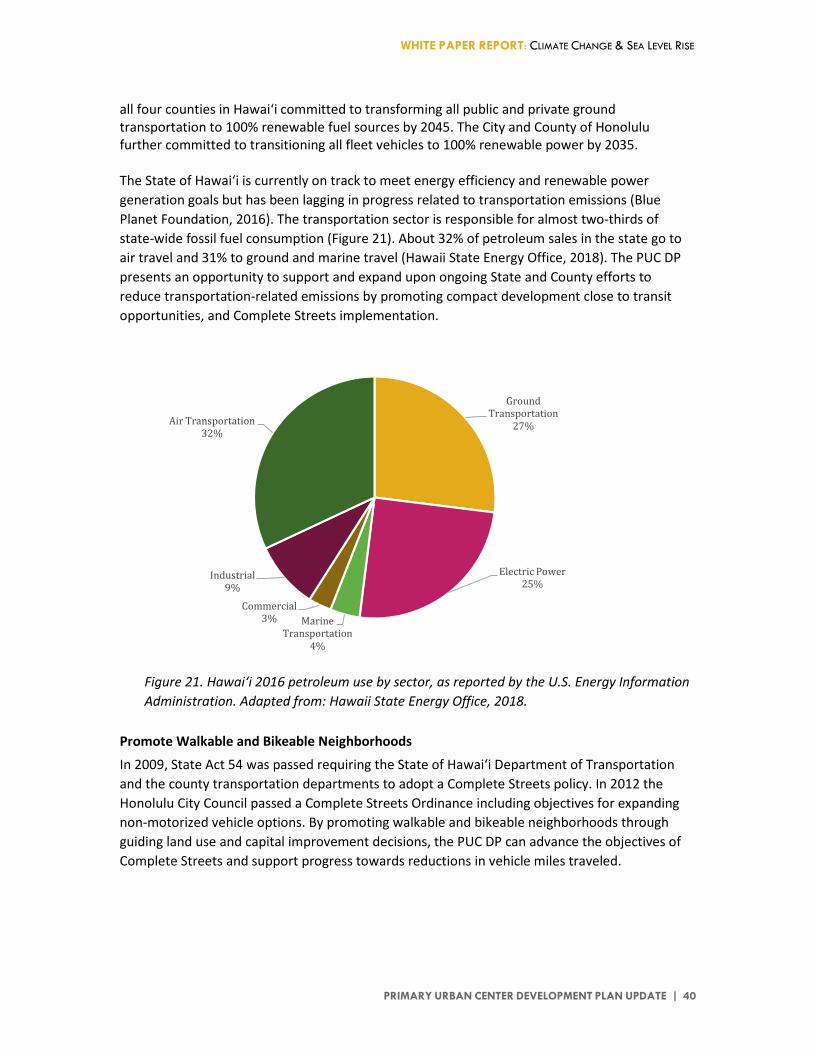
WHITE PAPER REPORT: CLIMATE CHANGE & SEA LEVEL RISE
PRIMARY URBAN CENTER DEVELOPMENT PLAN UPDATE | 40
all four counties in Hawai‘i committed to transforming all public and private ground transportation to 100% renewable fuel sources by 2045. The City and County of Honolulu further committed to transitioning all fleet vehicles to 100% renewable power by 2035. The State of Hawai‘i is currently on track to meet energy efficiency and renewable power generation goals but has been lagging in progress related to transportation emissions (Blue Planet Foundation, 2016). The transportation sector is responsible for almost two-thirds of state-wide fossil fuel consumption (Figure 21). About 32% of petroleum sales in the state go to air travel and 31% to ground and marine travel (Hawaii State Energy Office, 2018). The PUC DP presents an opportunity to support and expand upon ongoing State and County efforts to reduce transportation-related emissions by promoting compact development close to transit opportunities, and Complete Streets implementation.
Promote Walkable and Bikeable Neighborhoods
In 2009, State Act 54 was passed requiring the State of Hawai‘i Department of Transportation and the county transportation departments to adopt a Complete Streets policy. In 2012 the Honolulu City Council passed a Complete Streets Ordinance including objectives for expanding non-motorized vehicle options. By promoting walkable and bikeable neighborhoods through guiding land use and capital improvement decisions, the PUC DP can advance the objectives of Complete Streets and support progress towards reductions in vehicle miles traveled.
Ground Transportation
27%
Electric Power25%
Marine Transportation
4%
Commercial3%
Industrial9%
Air Transportation32%
Figure 21. Hawai‘i 2016 petroleum use by sector, as reported by the U.S. Energy Information Administration. Adapted from: Hawaii State Energy Office, 2018.
WHITE PAPER REPORT: CLIMATE CHANGE & SEA LEVEL RISE
PRIMARY URBAN CENTER DEVELOPMENT PLAN UPDATE | 41
Best Practices: Honolulu Complete Streets Design Manual Developed in 2016 the Honolulu Complete Streets Design Manual provides guidance for planning and designing streets that meet Complete Streets objectives. The manual is targeted to City and County of Honolulu staff, design professionals, private developers, community groups, and others involved in street planning and design. This guidance applies to all projects that impact the public right-of way along City and County of Honolulu streets, including the construction of new streets and improvements to existing streets.
Promote Transit Oriented Development The Department of Planning and Permitting is already in the process of establishing Neighborhood Transit Oriented Development Plans and adopting zoning regulations that reflect these plans. Continuing to support transit oriented development while also considering the impacts of climate change on these neighborhoods will advance both climate change mitigation (reducing greenhouse gas emissions) and adaptation (preparing for climate change impacts in siting and design of future development and infrastructure). The PUC DP should pay special attention to the key pedestrian streets, tree canopy, connections, and design improvements, that would increase the viability of walking for short trips and increase the ease of public transit use.
Expand Electric Vehicle Infrastructure Increasing electric vehicle use is an important component of meeting emission reduction goals for the transportation sector. Hawai‘i has in recent years fallen short of electric vehicle use goals (Blue Planet Foundation, 2016). Strategies to reduce barriers to electric vehicle use include promoting public-private partnership to install more charging stations and facilitating renewable energy integration to reduce electricity prices (McKenzie, 2015 and Elkind and Ku, 2013).
Best Practices: Guidebook for Commercial Electric Vehicle Charging Station Installations
The Guidebook for Commercial Electric Vehicle Charging Station Installations was prepared in support of the Hawai‘i Clean Energy Initiative. It provides guidance for planning, installing, and operating electric vehicle charging infrastructure at commercial facilities in Hawai‘i. The guidance also provides costs estimates for funding and operating charging stations under different business models.
Expand the Urban Tree Canopy State Act 15 sets a deadline of 2023 for developing a plan to meet the 2045 zero emissions target. This same act established a Greenhouse Gas Sequestration Task Force. State Act 16 directs the State Office of Planning to work with the task force to create a carbon offset program. In the case of the PUC DP expansion of the urban tree canopy is particularly relevant to supporting statewide carbon sequestration goals.

WHITE PAPER REPORT: CLIMATE CHANGE & SEA LEVEL RISE
PRIMARY URBAN CENTER DEVELOPMENT PLAN UPDATE | 42
A 2012 report on Honolulu’s urban tree canopy found that within the PUC boundaries the existing canopy covered about 20% of land and 46% of land was suitable for planting new trees including lawns, sidewalks, street medians, and parking lots (MacFaden and O’Neil-Dunne, 2012). In March 2018, Mayor Caldwell launched a new initiative to plant 100,000 trees in Oahu's urban areas by 2025 with the long-term goal of achieving 35% urban canopy coverage in Honolulu by 2035.
Best Practices: Hawai‘i Forest Action Plan The 2016 Hawai‘i Forest Action Plan developed by the State Department of Land and Natural Resources includes extensive recommendations for policies and actions to increase urban tree cover and prepare urban forests for climate change impacts. A few gaps and recommendations identified in the 2016 Hawai‘i Forest Action Plan relevant to the PUC include:
• In planning for tree planting consider both the Possible Tree Canopy Area and 3.2 ft Sea Level Rise Exposure Area to strategically plant trees that reduce risks of increased erosion and storm events.
• Plan urban canopy expansion to improve community health and well-being (e.g. plant more trees in low-income neighborhoods, increase access to fruit trees, reduce heat islands and cool urban schools, create more tree-lined urban trails, and slow storm water runoff).
• Utilize native trees and trees with high tolerance for expected climate change impacts (flooding, drought, salt water intrusion, storms, and rising temperatures).
• Incentivize tree planting during development and redevelopment projects.
Best Practices: Melbourne Urban Forest Diversity Guidelines The City of Melbourne Australia developed Urban Forestry Diversity Guidelines to accompany the city’s Urban Forestry Strategy. These guidelines include recommended tree species for use in specific street and park locations based on a range of criteria including interaction with the surrounding built environment, ecological diversity, ability to adapt to changing climate conditions, aesthetics, and longevity. The guidelines also include recommendations for enhancing the resilience of the urban tree population through species diversity.
WHITE PAPER REPORT: CLIMATE CHANGE & SEA LEVEL RISE
PRIMARY URBAN CENTER DEVELOPMENT PLAN UPDATE | 43
References
Anderson, T. R., Fletcher, C. H., Barbee, M. M., Frazer, L. N., & Romine, B. M. (2015). Doubling of coastal erosion under rising sea level by mid-century in Hawaii. Natural Hazards, 78(1), 75-103. doi:10.1007/s11069-015-1698-6
Anderson, T. R., Fletcher, C. H., Barbee, M. M., Romine, B. M., Lemmo, S., & Delevaux, J. M. (2018). Modeling multiple sea level rise stresses reveals up to twice the land at risk compared to strictly passive flooding methods. Scientific Reports, 8(1). doi:10.1038/s41598-018-32658-x
Bassiouni, M., & Oki, D. S. (2012). Trends and shifts in streamflow in Hawai‘i, 1913-2008. Hydrological Processes, 27(10), 1484-1500. doi:10.1002/hyp.9298
Blue Planet Foundation (2016) Hawai‘i Energy Report Card. Retrieved from https://blueplanetfoundation.org/energy-report-card/
Chu, P., Chen, Y. R., & Schroeder, T. A. (2010). Changes in Precipitation Extremes in the Hawaiian Islands in a Warming Climate. Journal of Climate, 23(18), 4881-4900. doi:10.1175/2010jcli3484.1
Church, J.A., and N.J. White. 2011. "Sea-Level Rise from the Late 19th to the Early 21st Century." Surveys in Geophysics 32 (4-5):585-602. doi: 10.1007/s10712-011-9119-1.
City and County of Honolulu, Kirk Caldwell, Mayor. Rev. 3/7/2017. New Extreme Tsunami Evacuation Zones – Information Updates and Frequently Asked Questions. Available at: http://www.honolulu.gov/demhazards/tsunamimaps.html. Last viewed 3/28/2018.
City and County of Honolulu Climate Change Commission (2018). Climate Change Brief. Retrieved from https://www.resilientoahu.org/resources/
Coffman, M., & Noy, I. (2011). Hurricane Iniki: Measuring the long-term economic impact of a natural disaster using synthetic control. Environment and Development Economics, 17(02), 187-205. doi:10.1017/s1355770x11000350
Davidson-Arnott, R. G. (2005). Conceptual Model of the Effects of Sea Level Rise on Sandy Coasts. Journal of Coastal Research, 216, 1166-1172. doi:10.2112/03-0051.1
Deltares. 2017. "XBeach Open Source Community." Accessed May 31, 2017. https://oss.deltares.nl/web/xbeach.
Elkind, E. N., & Ku, A. (2013). Electric Vehicle Paradise: How Hawaii Can Lead the World in Deployment (Rep.). Retrieved from http://maui.hawaii.edu/mauieva/docs/EVparadise.pdf
Fasullo, J. T., Nerem, R. S., & Hamlington, B. (2016). Is the detection of accelerated sea level rise imminent? Scientific Reports, 6(1). doi:10.1038/srep31245
FEMA (2017). Pre-Disaster Recovery Planning Guide for Local Governments. FD 008-03
WHITE PAPER REPORT: CLIMATE CHANGE & SEA LEVEL RISE
PRIMARY URBAN CENTER DEVELOPMENT PLAN UPDATE | 44
Fletcher, C.H., Grossman, E.E., Richmond, B.M., Gibbs, A.E. (2002) Atlas of natural hazards in the Hawaiian coastal zone. U.S. Geological Survey, Denver, CO, Geologic Investigations Series I-2761, 182p. http://geopubs.wr.usgs.gov/i-map/i2761/
Fletcher, C.H., Romine, B.M., Genz, A.S., Barbee, M.M., Dyer, M., Anderson, T.R., Lim, S.C., Vitousek, S., Bochicchio, C., and Richmond, B.M., (2012), National assessment of shoreline change: Historical shoreline change in the Hawaiian Islands: U.S. Geological Survey Open-File Report 2011–1051, 55 p.
Frazier, A. G., & Giambelluca, T. W. (2016). Spatial trend analysis of Hawaiian rainfall from 1920 to 2012. International Journal of Climatology, 37(5), 2522-2531. doi:10.1002/joc.4862
Giambelluca, T.W. & U.S. Geological Survey & Hawaii. Commission on Water Resource Management & University of Hawaii at Mānoa. Water Resources Center (1991). Drought in Hawai'i. State of Hawaii, Dept. of Land and Natural Resources, Commission on Water Resource Management, Honolulu, Hawaii
Giambelluca, T. W., Diaz, H. F., & Luke, M. S. (2008). Secular temperature changes in Hawai‘i. Geophysical Research Letters, 35(12). doi:10.1029/2008gl034377
Habel, S., Fletcher, C. H., Rotzoll, K., & El-Kadi, A. I. (2017). Development of a model to simulate groundwater inundation induced by sea-level rise and high tides in Honolulu, Hawaii. Water Research, 114, 122-134. doi:10.1016/j.watres.2017.02.035
Hansen, J., M. Sato, P. Hearty, R. Ruedy, M. Kelley, V. Masson-Delmotte, G. Russell, G. Tselioudis, J.,Cao, E. Rignot, I. Velicogna, E. Kandiano, K. von Schuckmann, P. Kharecha, A.N. Legrande, M., Bauer, and K.W. Lo. (2015). Ice melt, sea level rise and superstorms: Evidence from paleoclimate data, climate modeling, and modern observations that 2 °C global warming is highly dangerous. Atmospheric Chemistry and Physics Discussions, 15(14), 20059-20179. doi:10.5194/acpd-15-20059-2015
Hawaii Clean Energy Initiative Transportation Energy Analysis (2015). Prepared by the International Council on Clean Transportation for Hawai‘i Department of Business, Economic Development & Tourism Hawai‘i State Energy Office
Hawai‘i Department of Health (2015). Hawaii Climate Change and Health Working Group Preliminary Report and Recommendations. Retrieved from http://health.hawaii.gov/opppd/files/2015/12/HCR108-SLH2015.pdf
Hawai‘i Climate Change Mitigation and Adaptation Commission. (2017) Hawai‘i Sea Level Rise Vulnerability and Adaptation Report. Prepared by Tetra Tech, Inc. and the State of Hawai‘i Department of Land and Natural Resources, Office of Conservation and Coastal Lands, under the State of Hawai‘i Department of Land and Natural Resources Contract No: 64064.
Hawaiian Electric. (December 2018). Retrieved from https://www.hawaiianelectric.com/clean-energy-hawaii/clean-energy-facts/renewable-energy-sources

WHITE PAPER REPORT: CLIMATE CHANGE & SEA LEVEL RISE
PRIMARY URBAN CENTER DEVELOPMENT PLAN UPDATE | 45
Hawaii State Energy Office Department of Business, Economic Development, and Tourism. (June 2018) Hawaii Energy Facts and Figures. Retrieved from: https://energy.hawaii.gov/wp-content/uploads/2018/06/HSEO_2018_EnergyFactsFigures.pdf
Hay, C. C., Morrow, E., Kopp, R. E., & Mitrovica, J. X. (2017). Erratum: Probabilistic reanalysis of twentieth-century sea-level rise. Nature. doi:10.1038/nature24466
IPCC. 2014. Climate Change 2014: Synthesis Report. Contribution of Working Groups I, II and III to the Fifth Assessment Report of the Intergovernmental Panel on Climate Change [Core Writing Team, R.K. Pachauri and L.A. Meyer (eds.)]. IPCC, Geneva, Switzerland.
Keener, V. W., Hamilton, K., Izuka, S. K., Kunkel, K. E., Stevens, L. E., & Sun, L. (2013). Regional Climate Trends and Scenarios for the U.S. National Climate Assessment. Part 8. Climate of the Pacific Islands. NOAA Technical Report NESDIS 142-8.
Keener, V.W., R.E. Kopp, C.P. Weaver, J. Obeysekera, R.M. Horton, C. Zervas. (2017). Global and Regional Sea Level Rise Scenarios for the United States. NOAA Technical Report NOS CO-OPS 083.
Kruk, M. C., A. M. Lorrey, G. M. Griffiths, M. Lander, E. J. Gibney, H. J. Diamond, and J. J. Marra, (2015) On the state of the knowledge of rainfall extremes in the western and northern Pacific basin. International Journal of Climatology, 35 (3), 321–336. doi:10.1002/joc.3990
Leong, J. A., J. J. Marra, M. L. Finucane, T. Giambelluca, M. Merrifield, S. E. Miller, J. Polovina, E. Shea, M. Burkett, J. Campbell, P. Lefale, F. Lipschultz, L. Loope, D. Spooner, and B. Wang, 2014: Ch. 23: Hawai‘i and U.S. Affiliated Pacific Islands. Climate Change Impacts in the United States: The Third National Climate Assessment, J. M. Melillo, Terese (T.C.) Richmond, and G. W. Yohe, Eds., U.S. Global Change Research Program, 537-556. doi:10.7930/J0W66HPM.
Loke, M. K., & Leung, P. (2013). Hawaii's food consumption and supply sources: Benchmark estimates and measurement issues. Agricultural and Food Economics, 1(1), 10. doi:10.1186/2193-7532-1-10
MacFaden and O’Neil-Dunne (2012) A Report on Honolulu’s Existing and Possible Tree Canopy. Retrieved from: http://dlnr.hawaii.gov/forestry/files/2013/03/TreeCanopy_Report_Honolulu-4-12-2012.pdf
Marra, J.J., and Kruk, M.C. (2017) State of Environmental Conditions in Hawai‘i and the U.S. Affiliated Pacific Islands under a Changing Climate. Retrieved from: https://coralreefwatch.noaa.gov/satellite/publications/state_of_the_environment_2017_hawaii-usapi_noaa-nesdis-ncei_oct2017.pdf
McKenzie, K (2015). The State of Electric Vehicles In Hawaii (Rep.). Retrieved from: http://evtc.fsec.ucf.edu/publications/documents/HNEI-05-15.pdf
McKenzie, M.M. (2016) Regional temperature trends in Hawaiʻi: A century of change, 1916–2015 (MS thesis). Dept. of Geog., University of Hawaiʻi at Mānoa.
WHITE PAPER REPORT: CLIMATE CHANGE & SEA LEVEL RISE
PRIMARY URBAN CENTER DEVELOPMENT PLAN UPDATE | 46
Merrifield, M. A., & Maltrud, M. E. (2011). Regional sea level trends due to a Pacific trade wind intensification. Geophysical Research Letters, 38(21). doi:10.1029/2011gl049576
Miller, N. L., Hayhoe, K., Jin, J., & Auffhammer, M. (2008). Climate, Extreme Heat, and Electricity Demand in California. Journal of Applied Meteorology and Climatology, 47(6), 1834-1844. doi:10.1175/2007jamc1480.1
Mora, Camilo & Frazier, Abby & Longman, R & Dacks, Rachel & M Walton, Maya & J Tong, Eric & J Sanchez, Joseph & Kaiser, Lauren & Stender, Yuko & Anderson, James & M Ambrosino, Christine & Fernandez-Silva, Iria & M Giuseffi, Louise & Giambelluca, Thomas. (2013). The projected timing of climate departure from recent variability. Nature. 502. 183-187. 10.1038/nature12540.
Murakami, H., Wang, B., Li, T., & Kitoh, A. (2013). Projected increase in tropical cyclones near Hawaii. Nature Climate Change, 3(8), 749-754. doi:10.1038/nclimate1890
NASA. (2015, August 26). NASA Science Zeros in on Ocean Rise: How Much? How Soon? [Press release]. Retrieved from https://www.nasa.gov/press-release/nasa-science-zeros-in-on-ocean-rise-how-much-how-soon
Natural Resources Defense Council (2013) Extreme Heat: More Intense Hot Days and Heat Waves. Retrieved from: http://www.nrdc.org/health/climate/heat.asp
Nerem, R. S., Chambers, D. P., Choe, C., & Mitchum, G. T. (2010). Estimating Mean Sea Level Change from the TOPEX and Jason Altimeter Missions. Marine Geodesy, 33(Sup1), 435-446. doi:10.1080/01490419.2010.491031
Nerem, R.S., B. D., Beckley, J. T., Fasullo, B. D., Hamlington, D., Masters, and G. T. Mitchum. (2018). Climate-change–driven accelerated sea-level rise detected in the altimeter era. Proceedings of the National Academy of Science of the United States.
Oki, D.S. 2004. Trends in Streamflow Characteristics at Long-Term Gaging Stations, Hawaii . U.S. Geological Survey Scientific Investigations Report No. 2004-5080. Retrieved from: http://pubs.usgs.gov/sir/2004/5080/
Perlwitz, J., T. Knutson, J. P. Kossin, and A. N. LeGrande. (2017) Large-Scale Circulation and Climate Variability. Climate Science Special Report: Fourth National Climate Assessment, Volume I. Wuebbles, D. J., D. W. Fahey, K. A. Hibbard, D. J. Dokken, B. C. Stewart, and T. K. Maycock, Eds., U.S. Global Change Research Program, Washington, DC, USA, 161–184. doi:10.7930/J0RV0KVQ
Raftery, A. E., Zimmer, A., Frierson, D. M., Startz, R., & Liu, P. (2017). Less than 2 °C warming by 2100 unlikely. Nature Climate Change, 7(9), 637-641. doi:10.1038/nclimate3352
Renewable Portfolio Standards Law Examination, Docket No. 2007-0008. https://puc.hawaii.gov/wp-content/uploads/2018/02/RPS-HECO-2017.pdf and https://puc.hawaii.gov/wp-content/uploads/2018/04/RPS-KIUC-2017.pdf
WHITE PAPER REPORT: CLIMATE CHANGE & SEA LEVEL RISE
PRIMARY URBAN CENTER DEVELOPMENT PLAN UPDATE | 47
Safeeq, M., Mair, A., & Fares, A. (2012). Temporal and spatial trends in air temperature on the Island of Oahu, Hawaii. International Journal of Climatology, 33(13), 2816-2835. doi:10.1002/joc.3629
Schroeder, T., 1993: Climate controls. Prevailing Trade Winds, M. Sanderson, Ed., University of Hawaii Press.
Sweet, W.V., R.E. Kopp, R.E. Weaver, J. Obeysekera, R.M. Horton, E.R. Thieler, and C. Zervas. (2017). Global and Regional Sea Level Rise Scenarios for the United States. Silver Spring, MD: NOAA Technical Report NOS CO-OPS 083.
Tarui, N. M. Peng, D. Eversole. (2018). Economic Impact Analysis of the Potential Erosion of Waikīkī Beach: A 2016 Update.
Tripati, A. K., Roberts, C. D., & Eagle, R. A. (2009). Coupling of CO2 and Ice Sheet Stability Over Major Climate Transitions of the Last 20 Million Years. Science, 326(5958), 1394-1397. doi:10.1126/science.1178296
University of Hawai‘i Sea Grant College Program (2014) Climate Change Impacts in Hawai‘i - A summary of climate change and its impacts to Hawai‘i’s ecosystems and communities. UNIHI-SEAGRANT-TT-12-04.
U.S. Energy Information Administration.1990-2015 Net Generation by State by Type of Producer by Energy Source (EIA-906, EIA-920, EIA-923) Retrieved from: http://www.eia.gov/electricity/data/state/ U.S. Environmental Protection Agency (2008). Reducing Urban Heat Islands: Compendium of Strategies. Retrieved from: https://www.epa.gov/heat-islands/heat-island-compendium U.S. Global Change Research Program (2016). The Impacts of Climate Change on Human Health in the United States: A Scientific Assessment, Chapter 3: Air Quality Impacts. Retrieved from: https://health2016.globalchange.gov/air-quality-impacts
USGCRP, 2018: Impacts, Risks, and Adaptation in the United States: Fourth National Climate Assessment, Volume II [Reidmiller, D.R., C.W. Avery, D.R. Easterling, K.E. Kunkel, K.L.M. Lewis, T.K. Maycock, and B.C. Stewart (eds.)]. U.S. Global Change Research Program, Washington, DC, USA. doi:10.7930/NCA4.2018.
USGCRP, 2017: Climate Science Special Report: Fourth National Climate Assessment, Volume I [Wuebbles, D.J., et al., eds.]. U.S. Global Change Research Program, Washington, DC, USA, 470 pp, doi: 10.7930/J0J964J6.
Yi, S., Sun, W., Heki, K., & Qian, A. (2015). An increase in the rate of global mean sea level rise since 2010. Geophysical Research Letters, 42(10), 3998-4006. doi:10.1002/2015gl063902
Appendix A
Following is a summary of methods used in the Hawai’i Sea Level Rise Vulnerability and
Adaptation Report to model and map hazards and vulnerabilities with sea level rise. Please
refer to that Report and Anderson et al. (2018) for full details on these methods.
Passive flooding was modeled by the University of Hawaii Coastal Geology Group (UHCGG) in
GIS by digitally raising a mean higher high water level calculated from local tide gauge data, at
increasing increments, over a high-resolution digital terrain model. The model identifies areas
prone to still-water flooding at high tide on a daily basis - either directly by marine water, or
indirectly by groundwater or through storm drains. A passive flooding model provides an
effective initial screening of low-lying areas prone to chronic flooding from sea level rise.
However, this type of model generally underestimates sea level rise exposure as it does not
consider the effects of wave overwash and coastal erosion, important factors for high-energy
wave-exposed shores like south Oʻahu.
As observed during the king tides of 2017, wave run-up and overwash increase at the shoreline
with elevated water levels. Annual high-wave flooding with sea level rise was modeled by the
UHCGG utilizing the XBeach model from the Deltares Research Group (Deltares 2017). A
statistical annual-returning highest wave event was calculated from offshore buoy data
following Vitousek and Fletcher (2008). The XBeach model is used to transform the annual
waves across the fringing reef and calculate run-up heights over the shoreline at various
increments of sea level rise. The high wave flooding hazard area depicts areas prone to chronic
flooding from wave overwash once per year on average.
Historical shoreline change studies using aerial photographs and survey charts going back to the
early 1900s found that about 50% of beaches along South Oʻahu (Barbers Point to Hawaii Kai)
are undergoing chronic beach erosion (shoreline retreat), which is lower than the 70% of
beaches found to be eroding on Kauaʻi, Oʻahu, and Maui overall (Fletcher et al. 2012). The
relatively lower erosion along South Oʻahu may be due to widespread efforts to stabilize
shorelines by seawalls, groins, and other coastal engineering projects over the past century.
Regardless, increasing coastal erosion with sea level rise remains a significant risk in the PUC as
evidenced by ongoing beach erosion problems at Waikīkī and Ala Moana. The UHCGG modeled
coastal erosion hazards for beaches using a “hybrid” model developed by Anderson et al. (2015),
which combines observed historical shoreline erosion trends with the Davidson-Arnott model of
beach response to sea level rise (Davidson-Arnott 2005). The areas seaward of the modeled
erosion hazard line have an 80% probability of being affected by chronic coastal erosion (i.e.,
land loss) at a particular sea level scenario.
Passive flooding, annual high wave flooding, and coastal erosion were modeled at 0.5, 1.1, 2.0,
3.2 feet of sea level rise based on “business as usual” greenhouse gas emissions scenario from
the IPCC AR5. The State Sea Level Rise Report gives particular focus to the 1.1 foot sea level rise
scenario as a present day or near-term hazard and the 3.2 feet of sea level rise scenario as a
primary focus for planning for sea level rise in the latter half of this century.

Tetra Tech, Inc. the lead author of the State Sea Level Rise Report, conducted a vulnerability
assessment by combining the passive flooding, wave flooding, and coastal erosion hazard areas
into an overall Sea Level Rise Exposure Area (SLR-XA). The SLR-XA represents the projected area
exposed to chronic flooding with sea level rise. Some areas within the SLR-XA may be affected
by one, two, or all three of the modeled hazard types. It is generally assumed in the State Sea
Level Rise Report that areas within the SLR-XA would become uninhabitable due to chronic
flooding with sea level rise if adaptation measures are not implemented, if flooding and land
loss becomes too severe to adapt in place, or if relocation/retreat is employed as a preferred
alternative to adapting in place.
For the vulnerability assessment in the State Sea Level Rise Report, Tetra Tech collected
geospatial data from State and county GIS programs to calculate a range of potential losses of
land, buildings, infrastructure, critical facilities, populations, and natural resources.
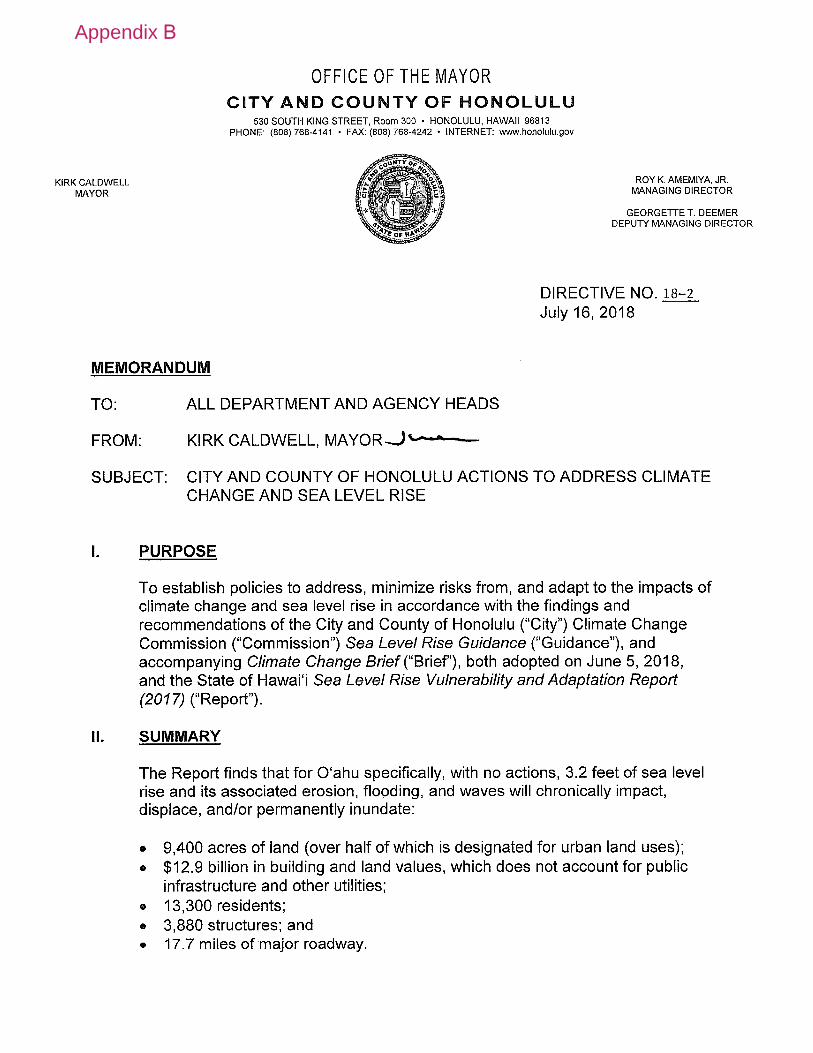
Appendix B
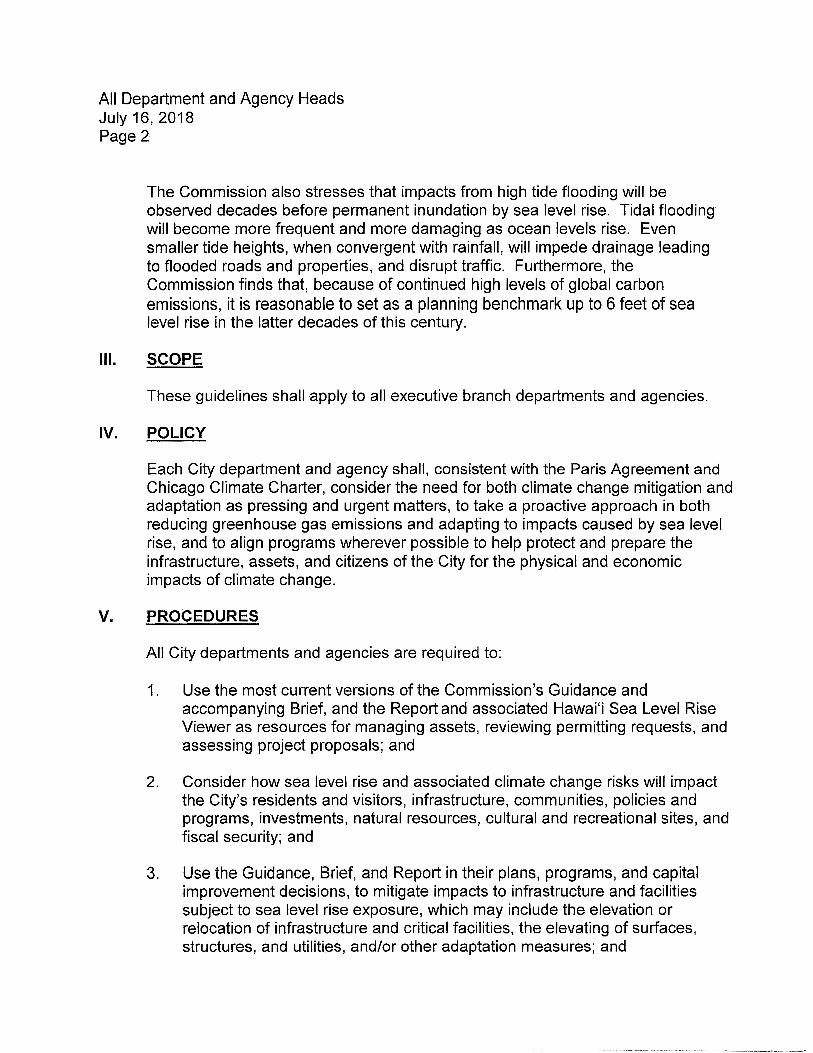


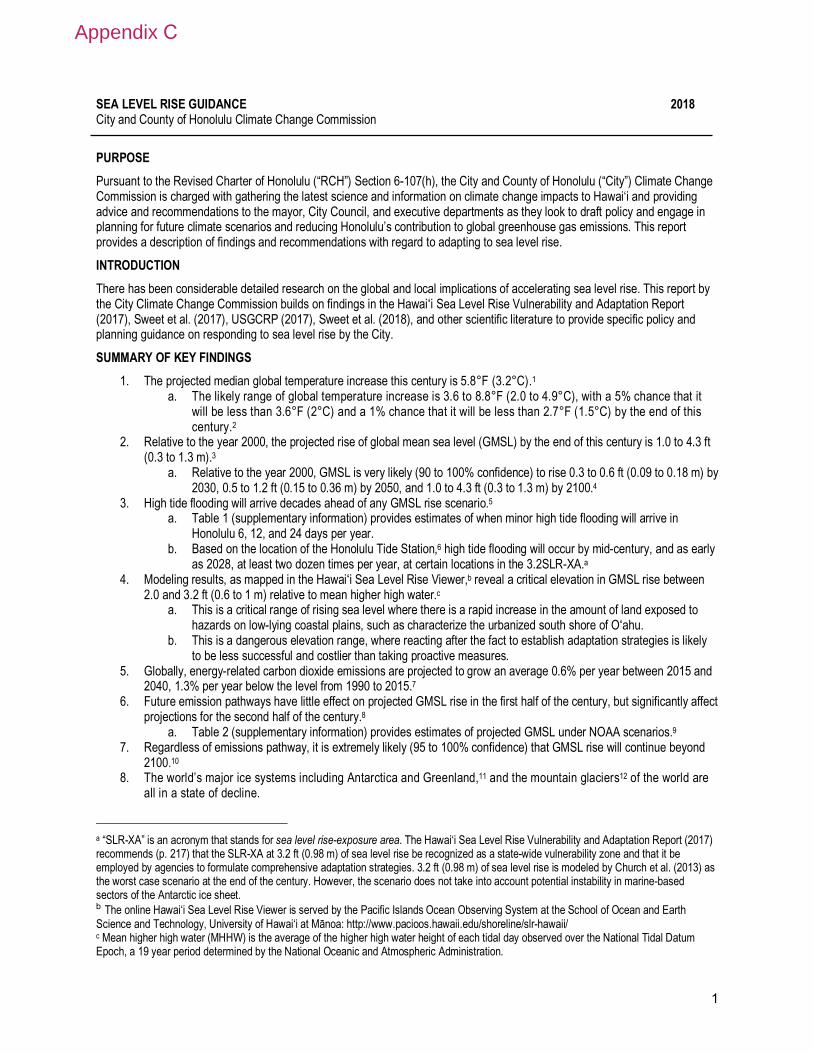
1
SEA LEVEL RISE GUIDANCE 2018 City and County of Honolulu Climate Change Commission
PURPOSE Pursuant to the Revised Charter of Honolulu (“RCH”) Section 6-107(h), the City and County of Honolulu (“City”) Climate Change Commission is charged with gathering the latest science and information on climate change impacts to Hawai‘i and providing advice and recommendations to the mayor, City Council, and executive departments as they look to draft policy and engage in planning for future climate scenarios and reducing Honolulu’s contribution to global greenhouse gas emissions. This report provides a description of findings and recommendations with regard to adapting to sea level rise. INTRODUCTION There has been considerable detailed research on the global and local implications of accelerating sea level rise. This report by the City Climate Change Commission builds on findings in the Hawaiʻi Sea Level Rise Vulnerability and Adaptation Report (2017), Sweet et al. (2017), USGCRP (2017), Sweet et al. (2018), and other scientific literature to provide specific policy and planning guidance on responding to sea level rise by the City. SUMMARY OF KEY FINDINGS
1. The projected median global temperature increase this century is 5.8°F (3.2°C).1a. The likely range of global temperature increase is 3.6 to 8.8°F (2.0 to 4.9°C), with a 5% chance that it
will be less than 3.6°F (2°C) and a 1% chance that it will be less than 2.7°F (1.5°C) by the end of thiscentury.2
2. Relative to the year 2000, the projected rise of global mean sea level (GMSL) by the end of this century is 1.0 to 4.3 ft(0.3 to 1.3 m).3
a. Relative to the year 2000, GMSL is very likely (90 to 100% confidence) to rise 0.3 to 0.6 ft (0.09 to 0.18 m) by2030, 0.5 to 1.2 ft (0.15 to 0.36 m) by 2050, and 1.0 to 4.3 ft (0.3 to 1.3 m) by 2100.4
3. High tide flooding will arrive decades ahead of any GMSL rise scenario.5a. Table 1 (supplementary information) provides estimates of when minor high tide flooding will arrive in
Honolulu 6, 12, and 24 days per year.b. Based on the location of the Honolulu Tide Station,6 high tide flooding will occur by mid-century, and as early
as 2028, at least two dozen times per year, at certain locations in the 3.2SLR-XA.a4. Modeling results, as mapped in the Hawaiʻi Sea Level Rise Viewer,b reveal a critical elevation in GMSL rise between
2.0 and 3.2 ft (0.6 to 1 m) relative to mean higher high water.ca. This is a critical range of rising sea level where there is a rapid increase in the amount of land exposed to
hazards on low-lying coastal plains, such as characterize the urbanized south shore of Oʻahu.b. This is a dangerous elevation range, where reacting after the fact to establish adaptation strategies is likely
to be less successful and costlier than taking proactive measures.5. Globally, energy-related carbon dioxide emissions are projected to grow an average 0.6% per year between 2015 and
2040, 1.3% per year below the level from 1990 to 2015.76. Future emission pathways have little effect on projected GMSL rise in the first half of the century, but significantly affect
projections for the second half of the century.8a. Table 2 (supplementary information) provides estimates of projected GMSL under NOAA scenarios.9
7. Regardless of emissions pathway, it is extremely likely (95 to 100% confidence) that GMSL rise will continue beyond 2100.10
8. The world’s major ice systems including Antarctica and Greenland,11 and the mountain glaciers12 of the world areall in a state of decline.
a “SLR-XA” is an acronym that stands for sea level rise-exposure area. The Hawai‘i Sea Level Rise Vulnerability and Adaptation Report (2017) recommends (p. 217) that the SLR-XA at 3.2 ft (0.98 m) of sea level rise be recognized as a state-wide vulnerability zone and that it be employed by agencies to formulate comprehensive adaptation strategies. 3.2 ft (0.98 m) of sea level rise is modeled by Church et al. (2013) as the worst case scenario at the end of the century. However, the scenario does not take into account potential instability in marine-based sectors of the Antarctic ice sheet. b The online Hawai‘i Sea Level Rise Viewer is served by the Pacific Islands Ocean Observing System at the School of Ocean and Earth Science and Technology, University of Hawai‘i at Mānoa: http://www.pacioos.hawaii.edu/shoreline/slr-hawaii/ c Mean higher high water (MHHW) is the average of the higher high water height of each tidal day observed over the National Tidal Datum Epoch, a 19 year period determined by the National Oceanic and Atmospheric Administration.
Appendix C

2
a. Research indicates that on multiple occasions over the past three million years, when global temperatures increased 1.8 to 5.4oF (1 to 3oC), melting polar ice sheets caused global sea levels to rise at least 20 ft (6 m) above present levels.13
b. If atmospheric warming exceeds 2.7 to 3.6oF (1.5 to 2oC) above present (ca. 2015), collapse of the major Antarctic ice shelves triggers a centennial- to millennial-scale response of the Antarctic ice sheet that produces a long-term commitment (an unstoppable contribution) to sea-level rise.14 Substantial Antarctic ice loss can be prevented only by limiting greenhouse gas emissions to RCP2.6d levels. Higher-emissions scenarios lead to ice loss from Antarctica that will raise sea level by 1.9 to 9.8 ft (0.6 to 3 m) by the year 2300.15
c. Antarctica has the potential to contribute more than 3.28 ft (1 m) of sea-level rise by 2100 and more than 49.2 ft (15 m) by 2500, if emissions continue unabated. In this case atmospheric warming will soon become the dominant driver of ice loss, but prolonged ocean warming will delay its recovery for thousands of years.16
d. Emerging science regarding Antarctic ice sheet stability suggests that under high emission pathways, a GMSL rise exceeding 8 ft (2.4 m) by 2100 is physically possible.17
e. The Greenland ice sheet is more sensitive to long-term climate change than previously thought. Studies18 estimate that the warming threshold leading to an essentially ice-free state is in the range of 1.4 to 5.8°F (0.8 to 3.2°C), with a best estimate of 2.9°F (1.6°C) above preindustrial levels. The Arctic is on track to double this amount of warming before mid-century.19
f. Further melting of mountain glaciers cannot be prevented in the current century - even if all emissions were stopped now.20 Around 36% of the ice still stored in mountain glaciers today will melt even without further emissions of greenhouse gases. That means: more than one-third of the glacier ice that still exists today in mountain glaciers can no longer be saved even with the most ambitious measures.
9. Rising seas threaten human communities and natural ecosystems in multiple ways. a. Urbanized coastal areas become increasingly vulnerable to four types of flooding during high water and high
wave events: 1) Flooding across the shoreline due to wave run-up. 2) Saltwater intrusion of engineered drainage systems. 3) Groundwater inundation.21
a) Intrusion of buried infrastructure and other buried assets that are not sealed. b) Formation of new wetlands, initially concurrent with high tide.
4) Rainstorms, especially concurrent with high tide. b. Land loss and coastal erosion.
1) If the back-beach area is composed of sand-rich dunes, sandy paleo shoreline deposits, or high wave sand berms, the released sand nourishes the retreating beach.
2) If the back-beach area is hardened, a beach is prevented from retreating. This leads to beach erosion, beach narrowing, and beach loss. Hardening has caused at least 5.4 mi (8.7 km) of beach loss on Oʻahu.22
c. Saltwater will intrude streams and coastal wetlands, increasing the salinity of the environment and threatening low-lying agriculture (e.g., kalo farming) and wildlife sanctuaries.
d. Wave, and eventually still water overtopping of Loko I‘a kuapā (fishpond walls) will increase. 1) Interior circulation will change (including at mākāhā). 2) Upland discharge into the pond will change. 3) Fishpond connections to the shore will become unstable.
e. Wave energy at the shore will increase. 1) Muddy shore deposits may be released.
f. Damaging flooding will increase when hurricanes, tsunamis, and seasonal high waves strike. g. Annual high waves, which arrive in Hawai i̒ seasonally, will flood further landward and cause more damage,
as sea level continues to rise.
d To provide guidance for developing mitigation and adaptation strategies, scientists have defined four different 21st century pathways of greenhouse gas emissions called “RCP’s” for Representative Concentration Pathways. The RCP’s include a stringent mitigation scenario (RCP2.6), two intermediate scenarios (RCP4.5 and RCP6.0), and one scenario with very high greenhouse gas emissions (RCP8.5).
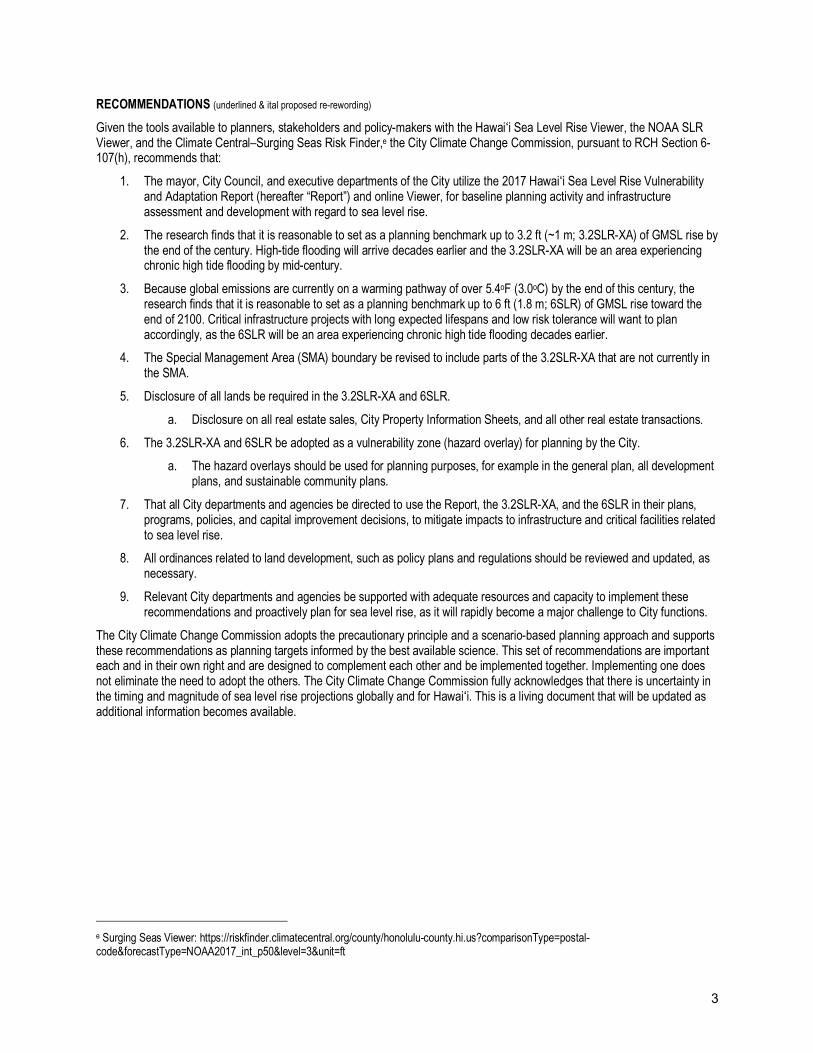
3
RECOMMENDATIONS (underlined & ital proposed re-rewording) Given the tools available to planners, stakeholders and policy-makers with the Hawaiʻi Sea Level Rise Viewer, the NOAA SLR Viewer, and the Climate Central–Surging Seas Risk Finder,e the City Climate Change Commission, pursuant to RCH Section 6-107(h), recommends that:
1. The mayor, City Council, and executive departments of the City utilize the 2017 Hawaiʻi Sea Level Rise Vulnerability and Adaptation Report (hereafter “Report”) and online Viewer, for baseline planning activity and infrastructure assessment and development with regard to sea level rise.
2. The research finds that it is reasonable to set as a planning benchmark up to 3.2 ft (~1 m; 3.2SLR-XA) of GMSL rise by the end of the century. High-tide flooding will arrive decades earlier and the 3.2SLR-XA will be an area experiencing chronic high tide flooding by mid-century.
3. Because global emissions are currently on a warming pathway of over 5.4oF (3.0oC) by the end of this century, the research finds that it is reasonable to set as a planning benchmark up to 6 ft (1.8 m; 6SLR) of GMSL rise toward the end of 2100. Critical infrastructure projects with long expected lifespans and low risk tolerance will want to plan accordingly, as the 6SLR will be an area experiencing chronic high tide flooding decades earlier.
4. The Special Management Area (SMA) boundary be revised to include parts of the 3.2SLR-XA that are not currently in the SMA.
5. Disclosure of all lands be required in the 3.2SLR-XA and 6SLR. a. Disclosure on all real estate sales, City Property Information Sheets, and all other real estate transactions.
6. The 3.2SLR-XA and 6SLR be adopted as a vulnerability zone (hazard overlay) for planning by the City. a. The hazard overlays should be used for planning purposes, for example in the general plan, all development
plans, and sustainable community plans. 7. That all City departments and agencies be directed to use the Report, the 3.2SLR-XA, and the 6SLR in their plans,
programs, policies, and capital improvement decisions, to mitigate impacts to infrastructure and critical facilities related to sea level rise.
8. All ordinances related to land development, such as policy plans and regulations should be reviewed and updated, as necessary.
9. Relevant City departments and agencies be supported with adequate resources and capacity to implement these recommendations and proactively plan for sea level rise, as it will rapidly become a major challenge to City functions.
The City Climate Change Commission adopts the precautionary principle and a scenario-based planning approach and supports these recommendations as planning targets informed by the best available science. This set of recommendations are important each and in their own right and are designed to complement each other and be implemented together. Implementing one does not eliminate the need to adopt the others. The City Climate Change Commission fully acknowledges that there is uncertainty in the timing and magnitude of sea level rise projections globally and for Hawaiʻi. This is a living document that will be updated as additional information becomes available.
e Surging Seas Viewer: https://riskfinder.climatecentral.org/county/honolulu-county.hi.us?comparisonType=postal-code&forecastType=NOAA2017_int_p50&level=3&unit=ft

4
SUPPLEMENTARY INFORMATION NOAA has published a model of high tide flooding for the Honolulu Tide Station (Sweet et al., 2018). Relative to MHHW, the threshold for minor high tide flooding is 1.7 ft (0.52 m), for moderate high tide flooding is 2.6 ft (0.8 m), and for major high tide flooding is 3.8 ft (1.17 m). High tide flooding will arrive decades ahead of global mean sea level rise. High tide flooding, as defined by NOAA, has never occurred at the Honolulu Tide Station as none of these thresholds has ever been crossed. Table 1 provides estimates of when minor high tide flooding will arrive in Honolulu 6, 12, and 24 days per year using the NOAA model.
Because of the exponential nature of the NOAA sea level scenarios, the doubling time of high tide flooding is rapid in all scenarios. High tide flooding events are likely to cluster around the summer and winter solstices. High tide flooding will occur first at certain locations in the 3.2SLR-XA as defined in the Hawaiʻi Sea Level Rise Vulnerability and Adaptation Report (2017). High tide flooding can take several forms. Beach erosion will be pronounced during high tide flooding events. Storm drain flooding will occur where marine water blocks drainage and spills out onto the street, or where runoff cannot drain and causes flooding around storm drain sites. Groundwater inundation will develop where the water table rises to break the ground surface and creates a wetland. At first this flooding will be most common when high tide and precipitation occur simultaneously, but eventually will occur without precipitation at high tide. Rainfall that occurs at high tide when storm drains are blocked and the ground is saturated will lead to widespread flooding. Marine flooding will occur at high tide when seawater flows across the shoreline. Wave flooding will occur at high tide during typical seasonal swell events as waves run-up past the shoreline and into the backshore. Tsunami and storm surge occurring at high tide will cause greater flood damage than historically. Global mean sea level will rise 3.2 ft (~1 m) relative to the year 2000. NOAA (Sweet et al., 2017) has published scenarios that provide estimates, by decade, of when GMSL will hit this benchmark (Table 2).
Table 2 - When will global mean sea level rise 3.2 feet (~1 m)?
Intermediate Scenario end of the century
Intermediate High Scenario decade of the 2080’s
High Scenario decade of the 2070’s
Extreme Scenario decade of the 2060’s
Gravitational forces will cause regional sea level in the North Central Pacific to rise above the global mean (Spada et al., 2015). NOAA suggests planners use higher scenarios for large projects with low risk tolerance. This recommendation is also made by the U.S. Army Corps of Engineers. Modeling of sea level rise impacts on Oʻahu (Report) reveals the following:
1. Homes and businesses on Oahu’s shorelines will be severely impacted by sea level rise. Nearly 4,000 structures will be chronically flooded with 3.2 ft (~1 m) of sea level rise (Figure 1).
2. Of the 9,400 acres of land located within the 3.2SLR-XA, over half is designated for urban land uses, making O‘ahu the most vulnerable of all the islands.
Table 1 - When will minor (0.52 m) high tide flooding occur in Honolulu? Scenario 6 x per year 12 x per year 24 x per year
Intermediate Scenario 2038 2041-2042 2044-2045
Intermediate High Scenario 2030 2033 2035-2036
High Scenario 2025-2026 2028-2029 2030-2031 Extreme Scenario 2024 2026 2028-2029
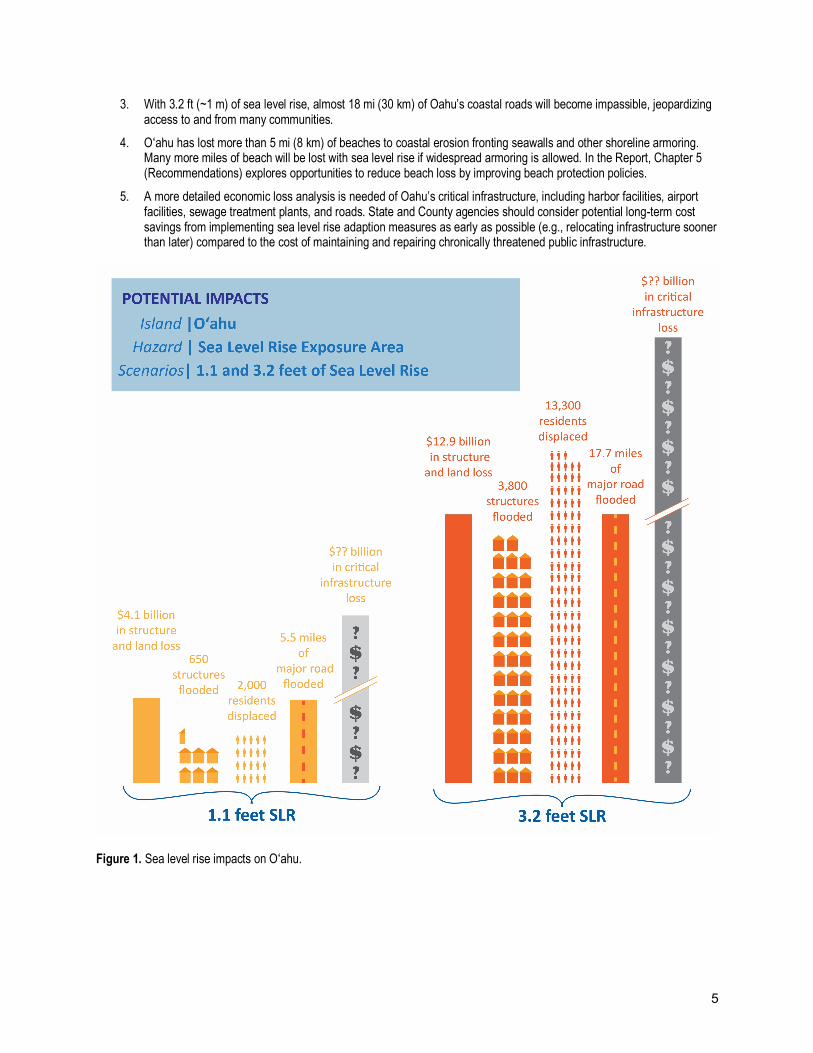
5
3. With 3.2 ft (~1 m) of sea level rise, almost 18 mi (30 km) of Oahu’s coastal roads will become impassible, jeopardizing access to and from many communities.
4. Oʻahu has lost more than 5 mi (8 km) of beaches to coastal erosion fronting seawalls and other shoreline armoring. Many more miles of beach will be lost with sea level rise if widespread armoring is allowed. In the Report, Chapter 5 (Recommendations) explores opportunities to reduce beach loss by improving beach protection policies.
5. A more detailed economic loss analysis is needed of Oahu’s critical infrastructure, including harbor facilities, airport facilities, sewage treatment plants, and roads. State and County agencies should consider potential long-term cost savings from implementing sea level rise adaption measures as early as possible (e.g., relocating infrastructure sooner than later) compared to the cost of maintaining and repairing chronically threatened public infrastructure.
Figure 1. Sea level rise impacts on Oʻahu.

6
REFERENCES, ADDITIONAL READING, AND ENDNOTES Anderson, T.R., et al. (2015) Doubling of coastal erosion under rising sea level by mid-century in Hawaiʻi. Natural Hazards, 78(1), 75–103. https://doi.org/10.1007/s11069-015-1698-6. Anderson, T.R., et al. (in review) Modeling recurrent sea level rise stresses reveals 50% more land at risk. Manuscript. Church, J.A., et al. (2013) Sea Level Change. In: Climate Change 2013: The Physical Science Basis. Contribution of Working Group I to the Fifth Assessment Report of the Intergovernmental Panel on Climate Change [Stocker, T.F., et al., eds.)]. Cambridge University Press, Cambridge, United Kingdom and New York, NY, USA. Dutton, A., et al. (2015) Sea-level rise due to polar ice-sheet mass loss during past warm periods, Science, 10 Jul., v. 349, Is. 6244, DOI: 10.1126/science.aaa4019 EIA (2017) International Energy Outlook 2017, U.S. Energy Information Administration, https://www.eia.gov/outlooks/ieo/pdf/0484(2017).pdf Fletcher, C.H., et al. (2012) National assessment of shoreline change: Historical shoreline change in the Hawaiian Islands: U.S. Geological Survey Open-File Report 1051. Golledge, N.R., et al. (2015) The multi-millennial Antarctic commitment to future sea-level rise, Nature, 2015; 526 (7573): 421 DOI: 10.1038/nature15706. Habel, S., et al. (2017) Development of a model to simulate groundwater inundation induced by sea-level rise and high tides in Honolulu, Hawaiʻi, Water Research. ISSN 0043-135.http://dx.doi.org/10.1016/j.watres.2017.02.035 Hawaiʻi Sea Level Rise Vulnerability and Adaptation Report (2017) Prepared by Tetra Tech, Inc. and the State of Hawaiʻi Department of Land and Natural Resources, for the Hawaiʻi Climate Mitigation and Adaptation Commission Office of Conservation and Coastal Lands, under the State of Hawaiʻi Department of Land and Natural Resources Contract No: 64064. Kane, H.H., et al. (2015) Modeling sea-level rise vulnerability of coastal environments using ranked management concerns. Climate Change. DOI 10.1007/s10584-015-1377-3 Kopp, R.E., et al. (2017) Evolving understanding of Antarctic ice-sheet physics and ambiguity in probabilistic sea-level projections, Earth’s Future, 5, 1217-1233, https://doi.org/10.1002/2017EF000663, Dec. 13. Lentz, E.E., et al. (2016) Evaluation of dynamic coastal response to sea-level rise modifies inundation likelihood. Nature Climate Change, 6, 696–700, doi:10.1038/nclimate2957. Levermann, A., et al. (2013) The multimillennial sea-level commitment of global warming: Proceedings of the National Academy of Sciences, July 15, DOI: 10.1073/pnas.1219414110. Raftery, A.E., et al. (2017) Less than 2oC warming by 2100 unlikely, Nature Climate Change, 7, 637-641, DOI: 10.1038/nclimate3352. Rockström, J., et al. (2017) A roadmap for rapid decarbonization. Science, 355 (6331): 1269 DOI: 10.1126/science.aah3443 Romine, B.M., et al. (2016) Beach erosion under rising sea-level modulated by coastal geomorphology and sediment availability on carbonate reef-fringed island coasts. Sedimentology, 63(5), 1321-1332.
Spada, G., et al. (2013) The gravitationally consistent sea-level fingerprint of future terrestrial ice loss. Geophysical Research Letters, 40, 482–486. Sweet, W.V., et al. (2017) Global and regional sea level rise scenarios for the United States, NOAA Technical Report NOS CO-OPS 083. Sweet, W.V., et al. (2018) Patterns and projections of high tide flooding along the U.S. coastline using a common impact threshold. NOAA Technical Report NOS CO-OPS 086. Tollefson, J. (2018) Can the world kick its fossil fuel addiction fast enough? Nature, 556, 422-425, DOI: 10.1038/d41586-018-04931-6.XXX USACE, Frequently Asked Questions about the Sea Level Rise Planning Tool, “Which sea level rise scenario should I use?” http://www.corpsclimate.us/Sandy/FAQs.asp
7
USGCRP, 2017: Climate Science Special Report: Fourth National Climate Assessment, Volume I [Wuebbles, D.J., et al., eds.]. U.S. Global Change Research Program, Washington, DC, USA, 470 pp, doi: 10.7930/J0J964J6.
1 Raftery, A.E., et al. (2017) Less than 2oC warming by 2100 unlikely, Nature Climate Change, 7, 637-641, DOI: 10.1038/nclimate3352. 2 Raftery et al. (2017) 3 USGCRP (2017) Climate Science Special Report: Fourth National Climate Assessment, Volume I [Wuebbles, D.J., et al. eds.]. U.S. Global Change Research Program, Washington, DC, USA, 470 pp, doi: 10.7930/J0J964J6. 4 USGCRP (2017) 5 Sweet, W.V., et al. (2018) Patterns and projections of high tide flooding along the U.S. coastline using a common impact threshold. NOAA Technical Report NOS CO-OPS 086. 6 Sweet et al (2018) 7 EIA (2017) International Energy Outlook 2017, U.S. Energy Information Administration, https://www.eia.gov/outlooks/ieo/pdf/0484(2017).pdf 8 Sweet, W.V., et al. (2017) Global and regional sea level rise scenarios for the United States, NOAA Technical Report NOS CO-OPS 083. 9 Sweet et al. (2017) 10 USGCRP (2017) 11 Data from NASA's GRACE satellites show that the land ice sheets in both Antarctica and Greenland have been losing mass since 2002. Both ice sheets have seen an acceleration of ice mass loss since 2009: https://climate.nasa.gov 12 Marzeion, B., et al. (2018) Limited influence of climate change mitigation on short-term glacier mass loss, Nature Climate Change, DOI: 10.1038/s41558-018-0093-1 13 Dutton, A., et al. (2015) Sea-level rise due to polar ice-sheet mass loss during past warm periods, Science, 10 Jul., v. 349, Is. 6244, DOI: 10.1126/science.aaa4019 14 Golledge, N.R., et al. (2015) The multi-millennial Antarctic commitment to future sea-level rise, Nature, 2015; 526 (7573): 421 DOI: 10.1038/nature15706. 15 Golledge et al. (2015) 16 DeConto, R.M. and Pollard, D. (2016) Contribution of Antarctica to past and future sea-level rise, Nature, 531 (7596):591–597. 17 USGCRP (2017) 18 Robinson, A., et al. (2012) Multistability and Critical Thresholds of the Greenland Ice Sheet, Nature Climate Change, 2, 429–432, doi: 10.1038/NCLIMATE1449 19 Smith, S.J., et al. (2015) Near-term acceleration in the rate of temperature change, Nature Climate Change, March 9, DOI: 10.1038/nclimate2552. 20 Marzeion et al. (2018) 21 Habel, S., et al. (2017) Development of a model to simulate groundwater inundation induced by sea-level rise and high tides in Honolulu, Hawaiʻi, Water Research. ISSN 0043-135.http://dx.doi.org/10.1016/j.watres.2017.02.035 22 Fletcher, C.H., et al. (2012) National assessment of shoreline change: Historical shoreline change in the Hawaiian Islands: U.S. Geological Survey Open-File Report 1051.