Climate Change & Sea Level Rise
73
Climate Change & Sea Level Rise A Technical Resource Paper for the North Shore, Oʻahu Sustainable Communities Plan
Transcript of Climate Change & Sea Level Rise

Climate Change & Sea Level Rise A Technical Resource Paper for the North Shore, Oʻahu Sustainable Communities Plan
Climate Change and Sea Level Rise Resource Paper
North Shore Sustainable Communities Plan Update | 2
Content and Structure This technical resource paper prepared by the University of Hawaiʻi Sea Grant College Program (Hawaiʻi Sea Grant) provides an overview of current conditions and issues related to climate change and sea level rise and their impact on land use in the North Shore Sustainable Communities Plan (NSSCP) area within the City & County of Honolulu (City), which includes the moku of Waialua and a western portion of moku of Koʻolau Loa. The details on existing and future conditions and considerations for planning will inform the NSSCP update and are intended to serve as supporting background information that will assist in the development of the guiding policies for the NSSCP. The primary authors of the document are Brad Romine, Dolan Eversole, and Katy Hintzen.
Suggested Citation: Romine, B.M., Eversole, D., Hintzen, K.D., 2021. Climate Change and Sea Level Rise, A Technical Resource Paper for the North Shore, Oʻahu Sustainable Communities Plan. Prepared by the University of Hawaiʻi Sea Grant College Program for SSFM International Inc. and the City and County of Honolulu. (TT-21-02)
This paper is funded through a subconsultant agreement between SSFM International, Inc. and the University of Hawaiʻi through funding from the City & County of Honolulu. This paper is also made possible in part by a grant/cooperative agreement from the National Oceanic and Atmospheric Administration, Project A/AS-1, which is sponsored by the University of Hawai‘i Sea Grant College Program, SOEST, under Institutional Grant No. NA18OAR4170076 from NOAA Office of Sea Grant, Department of Commerce. The views expressed herein are those of the authors and do not necessarily reflect the views of NOAA or any of its subagencies. UNIHI-SEAGRANT-TT-21-02.
Cover Photo Credit: Shellie Habel, Hawaiʻi Sea Grant.
Climate Change and Sea Level Rise Resource Paper
North Shore Sustainable Communities Plan Update | 3
Executive Summary Purpose and Intent This technical resource paper addresses climate change and sea level rise considerations for the North Shore Sustainable Communities Plan (NSSCP) update based on the latest and best available science and planning resources. The data and recommendations provided here are principally focused on sea level rise and the associated current and future impacts. The North Shore community has expressed a high degree of concern about coastal hazards risks on the North Shore including coastal erosion and flooding. The recommendations included here are consistent with recent climate and coastal zone management policy priorities of the State of Hawai‘i and the City and County of Honolulu (City) (see Appendix 2, Relevant City and State Initiatives and Policies). This technical resource paper is intended to help inform the community and other stakeholders of the North Shore, the City Department of Planning and Permitting (DPP), and other City offices involved in the NSSCP update process and assist with related coastal hazards, climate change, and coastal zone management policy development and decision-making. The document is intended to inform all stages of the NSSCP update from community engagement and outreach through development of specific actions and policies by approaching climate change, sea level rise adaptation, and coastal hazards resilience as cross-cutting considerations in community visioning, outreach, developing land use alternatives, and developing actions and policies.
Key Takeaways: Coastal Hazards and Climate Science
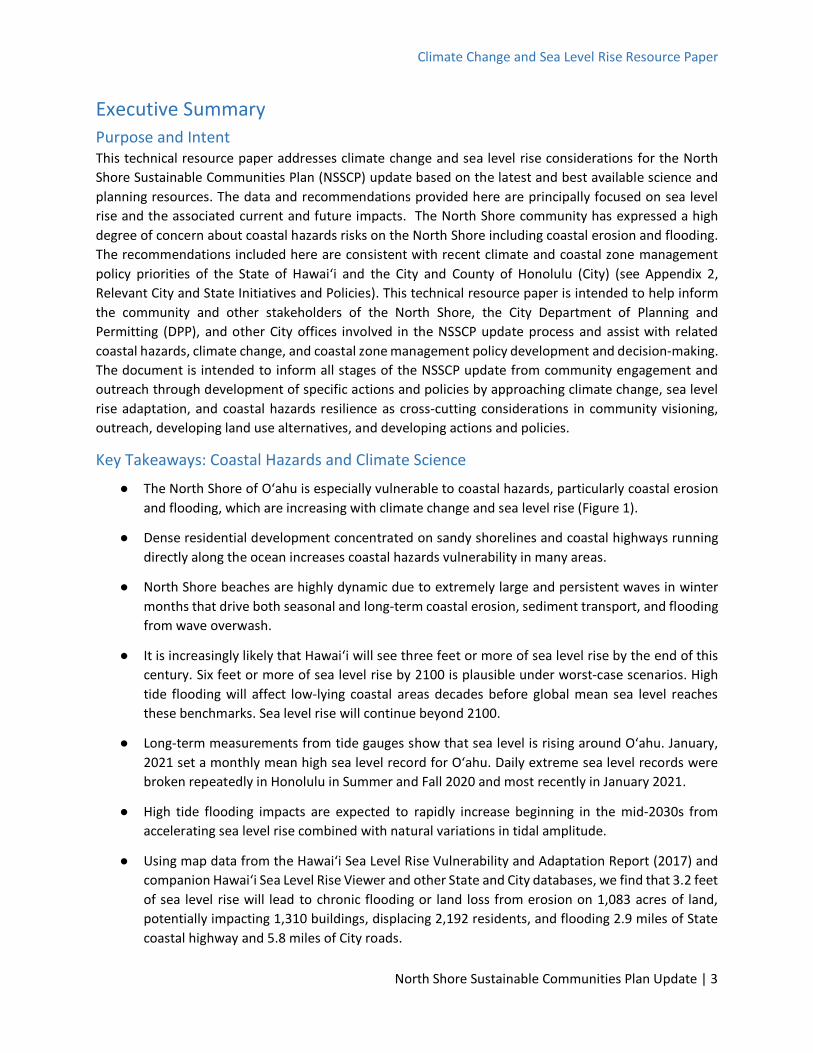
● The North Shore of Oʻahu is especially vulnerable to coastal hazards, particularly coastal erosion and flooding, which are increasing with climate change and sea level rise (Figure 1).
● Dense residential development concentrated on sandy shorelines and coastal highways running directly along the ocean increases coastal hazards vulnerability in many areas.
● North Shore beaches are highly dynamic due to extremely large and persistent waves in winter months that drive both seasonal and long-term coastal erosion, sediment transport, and flooding from wave overwash.
● It is increasingly likely that Hawai‘i will see three feet or more of sea level rise by the end of this century. Six feet or more of sea level rise by 2100 is plausible under worst-case scenarios. High tide flooding will affect low-lying coastal areas decades before global mean sea level reaches these benchmarks. Sea level rise will continue beyond 2100.
● Long-term measurements from tide gauges show that sea level is rising around Oʻahu. January, 2021 set a monthly mean high sea level record for Oʻahu. Daily extreme sea level records were broken repeatedly in Honolulu in Summer and Fall 2020 and most recently in January 2021.
● High tide flooding impacts are expected to rapidly increase beginning in the mid-2030s from accelerating sea level rise combined with natural variations in tidal amplitude.
● Using map data from the Hawaiʻi Sea Level Rise Vulnerability and Adaptation Report (2017) and companion Hawaiʻi Sea Level Rise Viewer and other State and City databases, we find that 3.2 feet of sea level rise will lead to chronic flooding or land loss from erosion on 1,083 acres of land, potentially impacting 1,310 buildings, displacing 2,192 residents, and flooding 2.9 miles of State coastal highway and 5.8 miles of City roads.

Climate Change and Sea Level Rise Resource Paper
North Shore Sustainable Communities Plan Update | 4
● These projected impacts are also expected to disproportionally affect North Shore communities with 30% of Oʻahu’s and 20% of the State’s impacted buildings located on the North Shore.
● 2.5 miles, or about 28%, of beachfront residential North Shore properties presently have a home within 20 feet or less of the shoreline, defined as “imminently threatened” by State DLNR. With 2.4 feet of sea level rise, likely in the middle to latter half of this century, this is projected to increase to 3.4 miles, or about 40%, of beachfront residences within 20 feet or less of the shoreline.
● Sea level rise and coastal erosion is leading to disproportionate impacts to frontline populations (those living near the shoreline) and Native Hawaiian communities with strong identity and place-based ties to coastal resources.
● Global atmospheric concentration of carbon dioxide, a key greenhouse gas, has increased by 47% since pre-industrial levels in 1850; the highest in 3 million years.
● Increasing global average temperature has tracked closely with increasing carbon dioxide indicating a net increase of about 1.8° F (0.99° C) since 1880. The ten warmest years, globally, have all occurred since 2005 and 2011-2020 was the warmest decade on record. 2015 and 2016 were the warmest years on record in Hawaiʻi.
● Model projections for Hawaiʻi, considering a range of greenhouse gas emissions scenarios, indicate that air temperatures will increase 1.8° to 7.2° F (2° to 4° C) in this century.
● Public health risks associated with rising temperatures and extreme heat events include increased respiratory illnesses, heatstroke, and cardiovascular and kidney disease.
● Statewide, Hawai‘i has seen a decline of 20-70% in base stream flows over the last century and there is a trend of longer and more severe droughts that increases risks for agriculture and wildfire. The North Shore has a moderate to high community fire risk, which may be increasing in recent decades with decline of agriculture and replacement with fire-prone grasslands.
● Globally, climate change is expected to result in more intense tropical cyclones. Modeling for Hawaii’s region of the Pacific Ocean has predicted a northward shift in storm tracks that would result in more tropical cyclones reaching Hawaiʻi.
● Ocean surface temperatures around Hawaiʻi have had a statistically significant increase between 1° and 1.5° F since 1901 resulting in increasing ocean heat waves and coral bleaching, which can have widespread impacts to coastal and marine ecosystems. Scientific projections indicate that corals in Hawaiʻi will bleach annually by 2040 if the current trend of warming continues and if corals are unable to adapt.
Key Takeaways: Policy and Planning Considerations
● Climate change adaptation and mitigation strategies should be integrated into all aspects of the NSSCP as cross-cutting considerations. The North Shore must prepare for coming impacts while also contributing to minimizing greenhouse gas emissions that are driving climate change.

Climate Change and Sea Level Rise Resource Paper
North Shore Sustainable Communities Plan Update | 5
● Using the 3.2 feet Sea Level Rise Exposure Area (SLR-XA) from the 2017 State Sea Level Rise Vulnerability and Adaptation Report as a hazard overlay is a critical first step in preparing for adapting to sea level rise impacts. Planning decisions related to critical infrastructure with long expected lifespans or low risk tolerance may also consider 6 feet of sea level rise as a planning benchmark. This aligns with Mayoral Directive No. 18-2, which requires City departments and agencies to use the Hawaiʻi Sea Level Rise Vulnerability and Adaptation Report and the City Climate Change Commission’s Sea Level Rise Guidance in planning, programing, and capital improvement decisions. However, utility of the 6-foot sea level rise layer is presently limited for the North Shore as it does not consider erosion and high wave runup.
● Adaptation actions and policies for climate change and sea level rise should carefully consider and account for social vulnerability and social equity across the North Shore’s diverse community. The City’s Climate Change and Social Equity Guidance Document and the Ola Oʻahu Resilience Strategy provide key recommendations to make sure the most vulnerable communities and populations receive the focus and resources they need.
● The NSSCP should support and prioritize resilience actions that provide multiple benefits and strategically incorporate adaptation measures into ongoing projects and planning efforts, acknowledging connections between climate change and natural hazards vulnerabilities and broader societal and environmental factors impacting quality of life on the North Shore.
● The City should continue to coordinate climate change planning and adaptation through an interdepartmental working group such as the City’s resilience team, the City Climate Change Commission and/or the One Water Honolulu climate resiliency panel to support cooperation and consistency among resilience and adaptation planning. Regular contact with State and federal agencies is also needed to address the long-term, complex, and cross-jurisdictional nature of shoreline hazards, sea level rise adaptation, and coastal resource conservation.
● The NSSCP can prioritize and set the initial groundwork for more detailed and community-based vulnerability assessment and adaptation planning including prioritizing pilot adaptation projects. Beachfront communities on the North Shore are an epicenter of coastal erosion and flooding impacts and risks. Pilot adaptation projects including but not limited to managed retreat (i.e., planned relocation of threatened development) can be used to demonstrate the viability of adaptation approaches and develop collaborative pathways for planning, funding, and implementation for the most vulnerable priority locations identified through vulnerability assessment, community engagement, and the NSSCP.
● The NSSCP presents an opportunity to build on City and State efforts to reduce greenhouse gas emissions by increasingly facilitating use of electric vehicles and safe multi-modal transportation (e.g., bike paths), household to community scale renewable energy projects that directly benefit the community, and increased carbon sequestration in agricultural and restored forest lands.
Climate Change and Sea Level Rise Resource Paper
North Shore Sustainable Com
munities Plan U
pdate | 6
Figure 1. Area exposed to chronic flooding with 3.2 feet of sea level rise within the North Shore Sustainable Communities Plan area . See Figures 14-18 for neighborhood-scale exposure maps. (Sea Level Rise Exposure Area (SLR-XA) data source: hawaiisealevelriseviewer.org).

Climate Change and Sea Level Rise Resource Paper
North Shore Sustainable Communities Plan Update | 7
Purpose and Intent This technical resource paper addresses climate change and sea level rise considerations for the North Shore Sustainable Communities Plan (NSSCP) update based on the latest and best available science and planning resources. The data and recommendations provided here are principally focused on sea level rise and the associated current and future impacts. The North Shore community has expressed a high degree of concern about coastal hazards risks on the North Shore including coastal erosion and flooding.
The recommendations included here are consistent with recent climate and coastal zone management policy priorities of the State of Hawai‘i and the City and County of Honolulu (City) (see Appendix 2, Relevant City and State Initiatives and Policies). This technical resource paper is intended to help inform the community and other stakeholders of the North Shore, the City Department of Planning and Permitting (DPP), and other City offices involved in the NSSCP update process and assist with related coastal hazards, climate change, and coastal zone management policy development and decision-making. The document is intended to inform all stages of the NSSCP update from community engagement and outreach through development of specific actions and policies by approaching climate change, sea level rise adaptation, and coastal hazards resilience as cross-cutting considerations in community visioning, outreach, developing land use alternatives, and developing actions and policies.
According to the Fourth (2017) U.S. National Climate Assessment (Wuebbles, D.J., et al. 2017), “Climate change creates new risks and exacerbates existing vulnerabilities in communities across the United States, presenting growing challenges to human health and safety, quality of life, and the rate of economic growth.” Climate change, sea level rise, heat waves, drought, and extreme storms present urgent risks for the North Shore community. In particular, sea level rise is leading to increasing frequency and severity of coastal erosion and damaging high wave flooding impacts to beach environments, shorefront homes, and coastal roads.
This technical resource paper compiles the latest and best available science on climate change and sea level rise with particular attention to relevance for the North Shore community to inform the update of the NSSCP. The technical resource paper includes a community-scale sea level rise exposure assessment for the NSSCP area using existing data from the 2017 State of Hawaiʻi Sea Level Rise Vulnerability and Adaptation Report (Hawaii Climate Change Mitigation and Adaptation Commission, 2017) and companion Hawaiʻi Sea Level Rise Viewer (Hawaiʻi Climate Change Mitigation and Adaptation Commission, 2021; hawaiisealevelriseviewer.org), State and City GIS programs and other sources are utilized to inform all the steps of the NSSCP update. Guidance and recommendations are provided on potential actions and policies to improve community resilience and sustainability in response to coastal hazards, climate change, and sea level rise risks. Substantial detail is provided on coastal processes and geology in the NSSCP in the
In June 2018, reports from the State and City Climate Change Commissions directly informed Mayoral Directive No. 18-2 (City & County of Honolulu, 2018). Still in effect, the Directive instructs all executive branch departments and agencies to, “consider the need for both climate change mitigation and adaptation as pressing and urgent matters, to take a proactive approach in both reducing greenhouse gas emissions and adapting to impacts caused by sea level rise, and to align programs wherever possible to help protect and prepare the infrastructure, assets, and citizens of the City for the physical and economic impacts of climate change.”.
Climate Change and Sea Level Rise Resource Paper
North Shore Sustainable Communities Plan Update | 8
following section as background information to support understanding of natural hazards and climate change risks for the area.
Environmental Setting and Existing Coastal Hazards Key Takeaways*
● Concentrated residential development and transportation infrastructure along the shoreline increases vulnerability to natural hazards on the North Shore.
● Many shorefront houses and portions of the coastal highway on the North Shore are built directly atop a shorefront dune, within the active beach system as shown by recent erosion and wave overwash events in these areas.
● North Shore beaches would naturally migrate landward over time with ongoing erosion, sustained by existing sand deposits in the backshore, if shoreline development doesn’t interfere.
● O‘ahu’s North Shore coastline is highly dynamic due to exposure to extremely large waves in winter months driving both seasonal and long-term beach erosion and wave runup (coastal marine flooding).
● Most coastal development on the seaward side of Farrington and Kamehameha Highways is vulnerable to direct marine inundation and rainfall flooding.
● 200 On-site Sewage Disposal Systems (OSDS, e.g., cesspools and septic systems) are within the 1.1 feet Sea Level Rise Exposure Area (SLR-XA), a water level reached during extreme tides over the last few years, suggesting that some of these systems may already be compromised by groundwater and/or coastal erosion.
● Coastal management in Hawaiʻi is complicated by multiple overlapping governmental jurisdictions at the shoreline (i.e., landward edge of the sandy beach), which is progressively migrating landward into public and private lands with increasing erosion and high wave runup.
This paper supports addressing climate change and sea level rise adaptation through a two-pronged approach:
Adaptation: Actions that reduce the vulnerability of society to climate change impacts. This includes attempts to reduce harm or take advantage of new opportunities resulting from climate change and recognizing that climate change impacts are occurring and will continue due to greenhouse gas emissions that have already occurred and will continue for the foreseeable future.
Mitigation: Efforts to reduce future climate changes, which are critical for minimizing future impacts. This includes reducing greenhouse gas emissions and increasing the uptake of carbon dioxide through land-use change and forestry.
(Adapted from the 2014 National Climate Assessment (Wuebbles, D.J., et al. 2017))

Climate Change and Sea Level Rise Resource Paper
North Shore Sustainable Communities Plan Update | 9
● Proactive planning and adaptation measures addressing climate change and sea level risks will also make North Shore communities more resilient to present-day hazards including coastal erosion, extreme high wave events and tsunami, and rainfall flooding.
*Citations for key takeaways are provided in the following text.
The NSSCP area extends from Kaʻena Point in the west to Waialeʻe Gulch in the east and encompasses a western portion of the Koʻolau Mountain Range, a northern portion of central Oʻahu, and an eastern portion of the Waiʻanae Mountain Range. The NSSCP area includes most of the moku of Waialua in the west and a portion of the moku of Koʻolau Loa in the east and 19 ahupuaʻa from Kaʻena in the west to Waialeʻe in the east.
Figure 2. Moku and ahupuaʻa within the NSSCP area.
Coastal Geologic and Geographic Setting
The NSSCP coastline may be divided into three sub-regions based on geography and development patterns: Mokulēʻia-Waialua, Haleʻiwa, and Kawailoa-Pūpūkea/Sunset Beach (see Figure 1 for location and extents). Mokulēʻia-Waialua in the west, from Kaʻena Point to Haleʻiwa (Ahupuaʻa of Kaʻena to Kamananui), is generally characterized by single-family residential development along the shoreline from Waialua to Dillingham Airfield and conservation lands extending from Dillingham Airfield to Kaʻena Point, and backed by agricultural lands and forest reserves of the northeastern side of the Waiʻanae Mountains. Mokulēʻia-Waialua Beach (see figures 14-18 for locations) is a nearly continuous 7-mile-long north-facing beach extending from Camp Erdman to Waialua. The communities of Mokulēʻia and Waialua are built on a broad low-lying coastal plain comprised of beach and dune deposits and backed by alluvium (soil) deposits from the foothills of the Waiʻanae Range (Figure 3). The shoreline at Kaʻena is characterized by
Climate Change and Sea Level Rise Resource Paper
North Shore Sustainable Communities Plan Update | 10
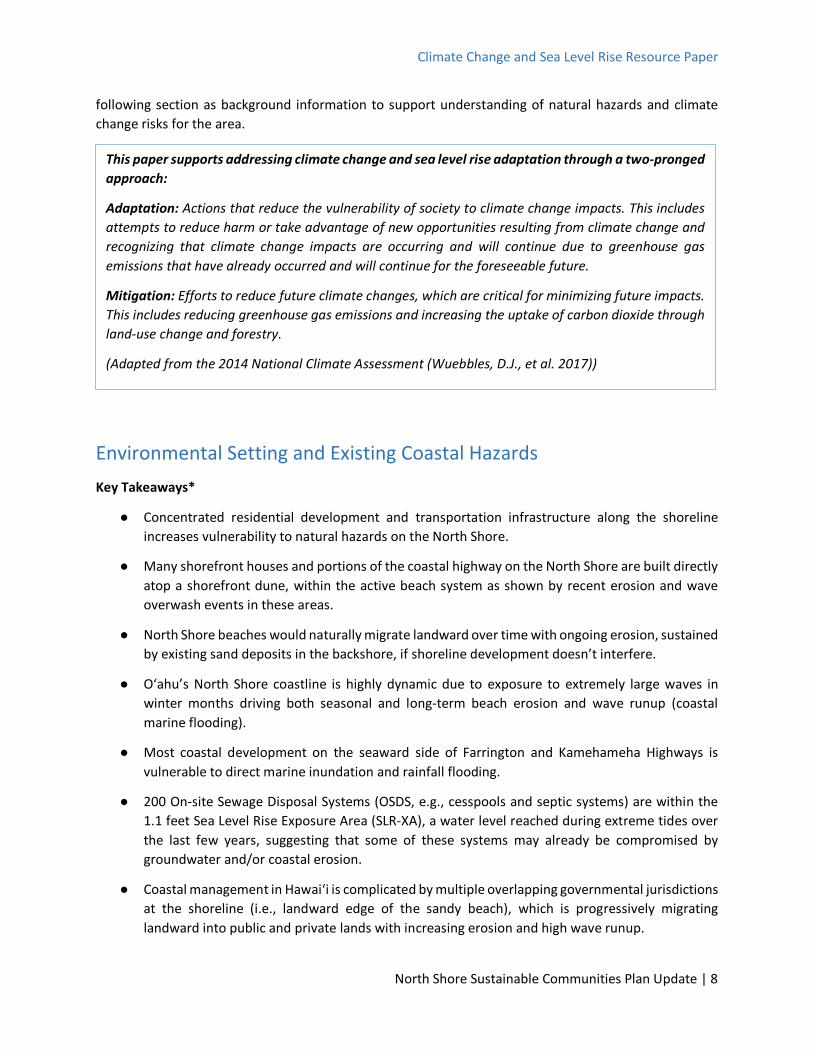
an elevated fossil reef limestone shelf overlain with intermittent “perched” beaches and backed by the pali (cliffs) of the western end of the Waiʻanae Range. A shallow fringing reef extends from Waialua to near Kaʻena Point. Most of the inner reef shelf is characterized by fossil reef pavement (relict limestone reef deposits) that is partially covered by turf algae (limu) or it is uncolonized. Live coral growth is mostly limited to deeper waters off the fringing reef along the North Shore due to scouring and breakage in the high-energy surf zone.
Figure 3. Generalized geology map for the North Shore of Oʻahu showing beach, dune, and other marine deposits along the coast and upland alluvium (eroded sediments and soil) and volcanic geology. Variations in backshore geology are one important factor in where beaches may be sustained with rising sea level and coastal erosion.
Haleʻiwa (ahupuaʻa of Paʻalaʻa) is the commercial town center of the North Shore. The shoreline is characterized by residential shorefront development between Kaiaka and Haleʻiwa Aliʻi Beach Park, breakwalls and docks of Haleʻiwa Harbor at the center of town, and engineered shoreline (beach fill, coastal armoring) at Haleʻiwa Beach Park along the eastern end of the town’s shoreline, which abuts the limestone headlands and narrow beaches of Puaʻena Point Beach Park. The single-family homes, few apartment buildings, and small businesses of Haleʻiwa Town are built on a low-lying coastal plain comprised of relict beach and fossil reef deposits and backed by variably-intermixed alluvial and riverine deposits from Anahulu River and ʻOpaeʻula Stream. A wide fringing reef fronts the western shoreline of Haleʻiwa from Kaiaka Point to Haleʻiwa Harbor. A deep channel in the reef fronts Haleʻiwa Harbor and Haleʻiwa Beach Park at the mouth of the Anahulu River. The Haleʻiwa Channel and dozens of other channels that bisect Oʻahu’s fringing reefs are relicts from periods of lower sea level, most recently during the past ice age that ended about 12,000 years ago, when sea level was hundreds of feet lower than
Climate Change and Sea Level Rise Resource Paper
North Shore Sustainable Communities Plan Update | 11
present and streams eroded through the limestone reef deposits while they were emerged above sea level.
The Kawailoa-Pūpūkea/Sunset Beach region (ahupuaʻa of Kawailoa to Waialeʻe) extends from Puaʻena Point near Haleʻiwa to Waiale‘e near Kawela Bay. The shoreline is characterized by a fossil limestone bench at Puaʻena Point, extensive beachrock deposits variably backed or covered by beach sand between Puaʻena and Papailoa, a series of pocket beaches and limestone and basalt headlands from Laniākea to Waimea Bay, a wide beach and stream mouth between basalt headlands at Waimea Bay, fossil reef limestone headlands at Sharks Cove and Pūpūkea Beach Park, and an almost continuous beach extending from the rocky headland at Pūpūkea Beach Park (Ke Iki Beach) to Waialeʻe. The shoreline throughout this area is extremely dynamic fronted by a fringing limestone reef of varying width and depth, upon which world-famous surfing waves break during winter months. The most notable gaps in the fringing reef are the channels at Waimea Bay and Sunset Beach.
Shoreline development in this area is characterized by single-family homes built on the narrow, low-lying coastal plain between the beach and steep pali backing much of this area. Kamehameha Highway, the only access into and out of this area, runs immediately along the shoreline in several locations. Development is particularly concentrated on the makai side of Kamehameha Highway with little setback between homes or the shoreline in most areas.
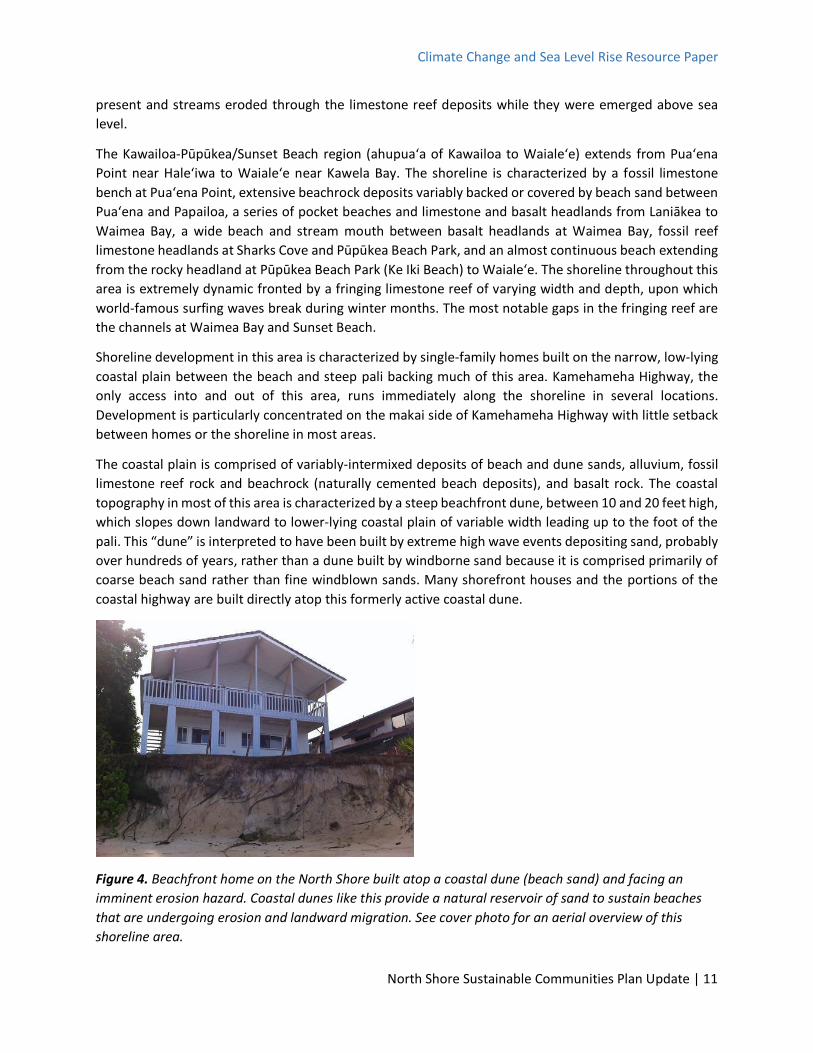
The coastal plain is comprised of variably-intermixed deposits of beach and dune sands, alluvium, fossil limestone reef rock and beachrock (naturally cemented beach deposits), and basalt rock. The coastal topography in most of this area is characterized by a steep beachfront dune, between 10 and 20 feet high, which slopes down landward to lower-lying coastal plain of variable width leading up to the foot of the pali. This “dune” is interpreted to have been built by extreme high wave events depositing sand, probably over hundreds of years, rather than a dune built by windborne sand because it is comprised primarily of coarse beach sand rather than fine windblown sands. Many shorefront houses and the portions of the coastal highway are built directly atop this formerly active coastal dune.
Figure 4. Beachfront home on the North Shore built atop a coastal dune (beach sand) and facing an imminent erosion hazard. Coastal dunes like this provide a natural reservoir of sand to sustain beaches that are undergoing erosion and landward migration. See cover photo for an aerial overview of this shoreline area.
Climate Change and Sea Level Rise Resource Paper
North Shore Sustainable Communities Plan Update | 12
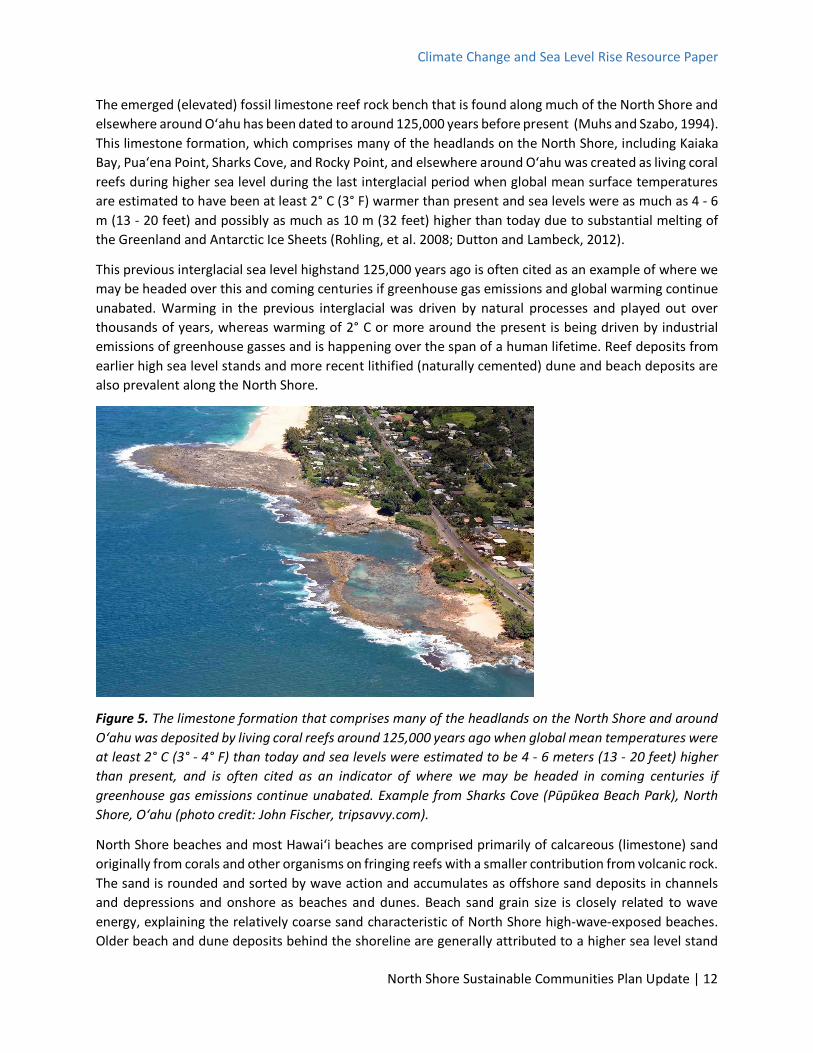
The emerged (elevated) fossil limestone reef rock bench that is found along much of the North Shore and elsewhere around Oʻahu has been dated to around 125,000 years before present (Muhs and Szabo, 1994). This limestone formation, which comprises many of the headlands on the North Shore, including Kaiaka Bay, Puaʻena Point, Sharks Cove, and Rocky Point, and elsewhere around Oʻahu was created as living coral reefs during higher sea level during the last interglacial period when global mean surface temperatures are estimated to have been at least 2° C (3° F) warmer than present and sea levels were as much as 4 - 6 m (13 - 20 feet) and possibly as much as 10 m (32 feet) higher than today due to substantial melting of the Greenland and Antarctic Ice Sheets (Rohling, et al. 2008; Dutton and Lambeck, 2012).
This previous interglacial sea level highstand 125,000 years ago is often cited as an example of where we may be headed over this and coming centuries if greenhouse gas emissions and global warming continue unabated. Warming in the previous interglacial was driven by natural processes and played out over thousands of years, whereas warming of 2° C or more around the present is being driven by industrial emissions of greenhouse gasses and is happening over the span of a human lifetime. Reef deposits from earlier high sea level stands and more recent lithified (naturally cemented) dune and beach deposits are also prevalent along the North Shore.
Figure 5. The limestone formation that comprises many of the headlands on the North Shore and around O‘ahu was deposited by living coral reefs around 125,000 years ago when global mean temperatures were at least 2° C (3° - 4° F) than today and sea levels were estimated to be 4 - 6 meters (13 - 20 feet) higher than present, and is often cited as an indicator of where we may be headed in coming centuries if greenhouse gas emissions continue unabated. Example from Sharks Cove (Pūpūkea Beach Park), North Shore, Oʻahu (photo credit: John Fischer, tripsavvy.com).
North Shore beaches and most Hawaiʻi beaches are comprised primarily of calcareous (limestone) sand originally from corals and other organisms on fringing reefs with a smaller contribution from volcanic rock. The sand is rounded and sorted by wave action and accumulates as offshore sand deposits in channels and depressions and onshore as beaches and dunes. Beach sand grain size is closely related to wave energy, explaining the relatively coarse sand characteristic of North Shore high-wave-exposed beaches. Older beach and dune deposits behind the shoreline are generally attributed to a higher sea level stand

Climate Change and Sea Level Rise Resource Paper
North Shore Sustainable Communities Plan Update | 13
(1 - 2 m) in equatorial areas about 5,000 years ago that resulted from a delayed effect related to isostatic adjustment of the Earth’s mantle with the shrunken (melted) polar ice caps (Fletcher and Jones, 1996). These relict backshore deposits are an important repository of sand that may naturally sustain beaches with modern sea level rise and coastal erosion if shoreline development doesn’t interfere with the landward migration of the beach system.
Marine and Atmospheric Setting
Oʻahu’s North Shore coastline is highly dynamic with strong winter North Pacific waves breaking on the fringing reef and against steep beaches during winter months and relatively calm conditions during summer months. These waves regularly reach breaking wave heights (faces) of 30 feet or more in winter. This seasonal variability and extremely high-energy wave climate leads to large variations in beach width from winter to summer and even from one swell to the next, depending on wave size and direction. Seasonal and chronic beach erosion and wave-induced flooding are hazards throughout this area and are discussed in more detail in the following section on Existing Natural Hazards.
Northeast tradewinds occur about 75 percent of the year with greater prevalence in summer months. The tradewinds blow alongshore or slightly offshore depending on shoreline aspect along the north to northwest facing shoreline of the North Shore. Small but persistent waves driven by the northeast tradewinds are the primary force moving sand along North Shore beaches in summer months.
Annual air temperatures average about 75° F on the North Shore with an average winter temperature (December - February) of 71° F and average summer temperature (June - August) of 78° F (NOAA-NCEI, www.ncdc.noaa.gov/data-access). The annual average highest temperature is 84° F and average lowest is 65° F. Heat index or apparent temperatures (temperature perceived by people) can approach 100° F during periods of high temperature, high humidity, and low tradewinds, most often in mid-summer to early fall.
Average annual rainfall is 30 inches at Camp Erdman (Mokulēʻia), 55 inches at Waimea Arboretum (Waimea River Valley), and 34 inches at Poamoho Experimental Farm (722 feet elevation) (Giambelluca, et al., 2013). Summer months are typically somewhat drier than fall, winter, and spring. Waimea Arboretum averages 16 inches of rain December through February, 13 inches March through May, 11 inches June through August, and 15 inches September through November. Rainfall is generally more abundant in the east of the NSSCP area in the vicinity of the Koʻolau Range. This rainfall is driven by the persistent moisture-laden northeast tradewinds rising up over the mountain ranges. Storm fronts sweep in from the North Pacific bringing rain and winds in winter months or as cut-off low pressure systems from the west. Occasional tropical storms bring rainfall from east or south in summer and into early fall.
Regulatory Setting Coastal management in Hawaiʻi is complicated by multiple overlapping governmental jurisdictions at the shoreline. The shoreline as defined for regulatory purposes as “the annual highest wash of the waves, other than storm or tsunami waves, during the season when the highest wash of the waves occurs” (Hawaiʻi Administrative Rules (HAR) §13-222-2). The shoreline serves as the baseline for measuring shoreline construction and activities setbacks, the jurisdictional boundary between State administration on the seaward side and City administration on the landward side, and also defines the boundary between
Climate Change and Sea Level Rise Resource Paper
North Shore Sustainable Communities Plan Update | 14
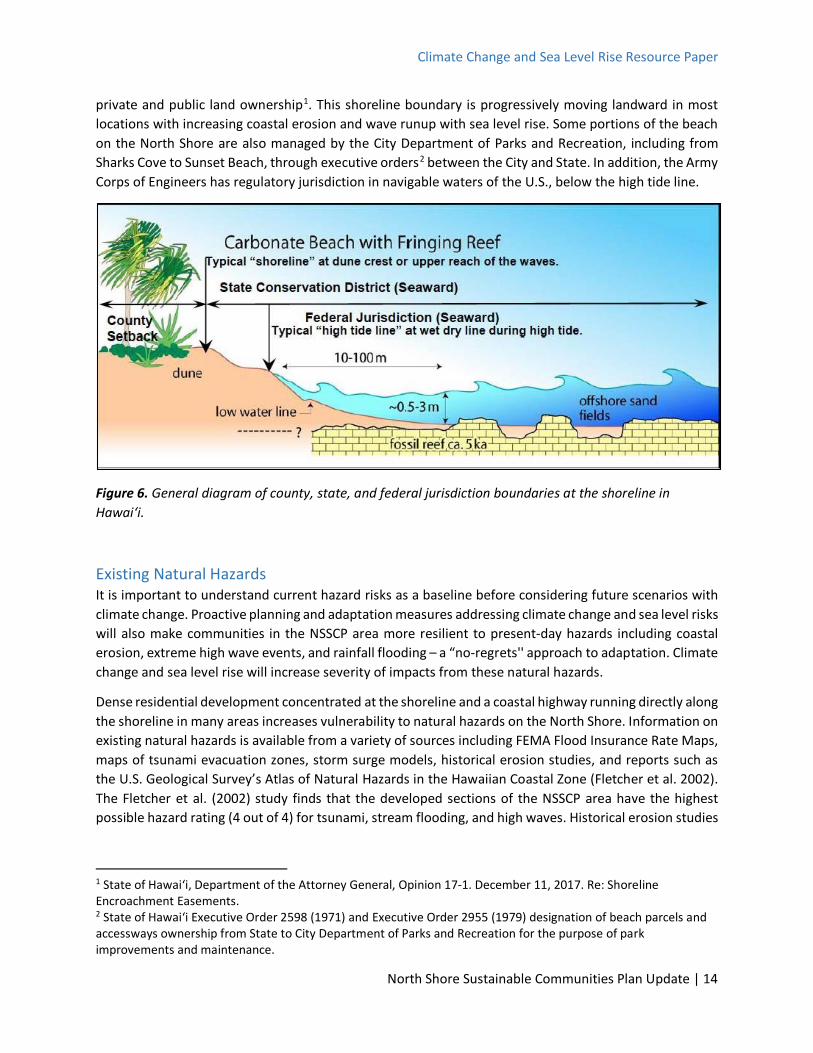
private and public land ownership1. This shoreline boundary is progressively moving landward in most locations with increasing coastal erosion and wave runup with sea level rise. Some portions of the beach on the North Shore are also managed by the City Department of Parks and Recreation, including from Sharks Cove to Sunset Beach, through executive orders2 between the City and State. In addition, the Army Corps of Engineers has regulatory jurisdiction in navigable waters of the U.S., below the high tide line.
Figure 6. General diagram of county, state, and federal jurisdiction boundaries at the shoreline in Hawaiʻi.
Existing Natural Hazards It is important to understand current hazard risks as a baseline before considering future scenarios with climate change. Proactive planning and adaptation measures addressing climate change and sea level risks will also make communities in the NSSCP area more resilient to present-day hazards including coastal erosion, extreme high wave events, and rainfall flooding – a “no-regrets'' approach to adaptation. Climate change and sea level rise will increase severity of impacts from these natural hazards.
Dense residential development concentrated at the shoreline and a coastal highway running directly along the shoreline in many areas increases vulnerability to natural hazards on the North Shore. Information on existing natural hazards is available from a variety of sources including FEMA Flood Insurance Rate Maps, maps of tsunami evacuation zones, storm surge models, historical erosion studies, and reports such as the U.S. Geological Survey’s Atlas of Natural Hazards in the Hawaiian Coastal Zone (Fletcher et al. 2002). The Fletcher et al. (2002) study finds that the developed sections of the NSSCP area have the highest possible hazard rating (4 out of 4) for tsunami, stream flooding, and high waves. Historical erosion studies
1 State of Hawaiʻi, Department of the Attorney General, Opinion 17-1. December 11, 2017. Re: Shoreline Encroachment Easements. 2 State of Hawaiʻi Executive Order 2598 (1971) and Executive Order 2955 (1979) designation of beach parcels and accessways ownership from State to City Department of Parks and Recreation for the purpose of park improvements and maintenance.

Climate Change and Sea Level Rise Resource Paper
North Shore Sustainable Communities Plan Update | 15
and shorter-term beach monitoring projects have documented widespread chronic and seasonal erosion hazards along the North Shore. (Fletcher, et al. 2012).
Rainfall and Stream Flooding Flood Insurance Rate Maps (FIRMs) from the Federal Emergency Management Agency (FEMA) depict the 1%-annual-chance-flood zones (“100-year flood”), which are also called Special Flood Hazard Areas (SFHA), and for less-frequent floods (Figure 7). The FIRMs are used by the National Flood Insurance Program (NFIP) for floodplain management, mitigation, and insurance purposes and by State and City agencies for building standards, such as building heights above flood elevations. The FIRMS are based on observation and modeling using a database of historical floods and do not consider future changes in flood hazards with climate change. Most residential development in the Mokulēʻia-Waialua portion of the NSSCP area as well as Farrington Highway are located within the SFHA and many homes are prone to both land-based stormwater flooding (Zone A) and marine flooding from high waves (Zone VE). The coastal VE Zone extends into much of Haleʻiwa Town with other areas around streams prone to riverine flooding (Zone A). Portions of Haleʻiwa were damaged by stormwater flooding in March, 2021. In the Kawailoa-Sunset portion of the NSSCP, the SFHA extends up to and beyond Kamehameha Highway in most areas. Flooding hazards on the low-lying coastal plain result from combined exposure to high wave runup and stormwater flooding at the base of steep watersheds. Most development on the North Shore’s coastal plain is located in FEMA Zone X, which is defined as areas that would be inundated by a 0.2-percent-annual-chance-flood (“500-year flood”). The FEMA flood hazard zones may be viewed on the State’s Flood Hazard Assessment Tool and are also available on the Hawaiʻi Sea Level Rise Viewer.
Figure 7. FEMA Special Flood Hazard Zones for the North Shore.
Tsunami Tsunami are waves generated by distant or localized geologic events, most often by large earthquakes that cause rapid movement of the seafloor. Hawai‘i is encircled by the “ring of fire,” a band of major subduction faults and volcanic zones surrounding the Pacific Ocean. According to Fletcher et al. (2002), tsunamis in 1946, 1952, and 1957 caused widespread flooding along the North Shore and the NSSCP has an overall high hazard rating (4 out of 4) for tsunami due to the low-lying coastal topography. The highest

Climate Change and Sea Level Rise Resource Paper
North Shore Sustainable Communities Plan Update | 16
tsunami flood elevation reported in the 2002 Fletcher report in the NSSCP area was 36 feet in the vicinity of Kaʻena Point from the 1946 Aleutian Islands (Alaska) earthquake and tsunami. The 2011 Japan tsunami caused no severe damage on land in the NSSCP area but caused flooding and damage to docks and boats in Haleʻiwa Harbor. In general, runups with major tsunami have been higher along the exposed coastline of the NSSCP relative to other areas on O‘ahu. Most coastal development, both fire stations, three of four area public schools, and the full extent of State coastal highway in the NSSCP are within the primary tsunami evacuation zone. In March 2017, the City released maps of Extreme Tsunami Evacuation Zones (XTEZ) based on “a newly recognized risk of tsunami from a very large Aleutian (Alaska, Magnitude 9+) event” (City and County of Honolulu, 2017). The XTEZ evacuation zone is significantly larger and higher than the standard tsunami evacuation zone. Tsunami Evacuation Zone Maps may be viewed and downloaded at the City’s Tsunami Evacuation Zone mapping tool.
Coastal Erosion and Beach Loss Seasonal and chronic coastal erosion is a major hazard throughout Hawaiʻi, and the NSSCP coastline has some of the most immediate and severe examples of erosion impacts in the State. While coastal erosion and beach loss are commonly used interchangeably, coastal erosion refers to the loss of sand from a beach, and in many severe cases loss of backshore land area, due to wave action and elevated water levels washing sand away. Beach loss is specific to the narrowing and eventual loss of a beach usually fronting a hardened structure like a seawall or natural rock feature. Chronic shoreline erosion on the North Shore is typically characterized by seasonal beach narrowing and backshore land loss, evidenced by a steep scarp or vertical erosion cut into the dune and vegetation line, that never fully recovers in following years.
North Shore beaches are particularly prone to short-term beach erosion as sand shifts with seasonal and shorter term changes in wave conditions. Seasonal beach erosion can be a serious but temporary hazard to beachfront development. When a beach doesn’t fully recover from seasonal erosion from year to year, the beach is undergoing chronic or long-term erosion. Chronic beach erosion happens due to an overall imbalance between the sand coming into and going out along a section of shoreline. This balance is often referred to as a sediment budget and accounts for complex interchange of sand both along and across the beach system, including nearshore sand deposits and beachfront dunes, driven by waves and currents.
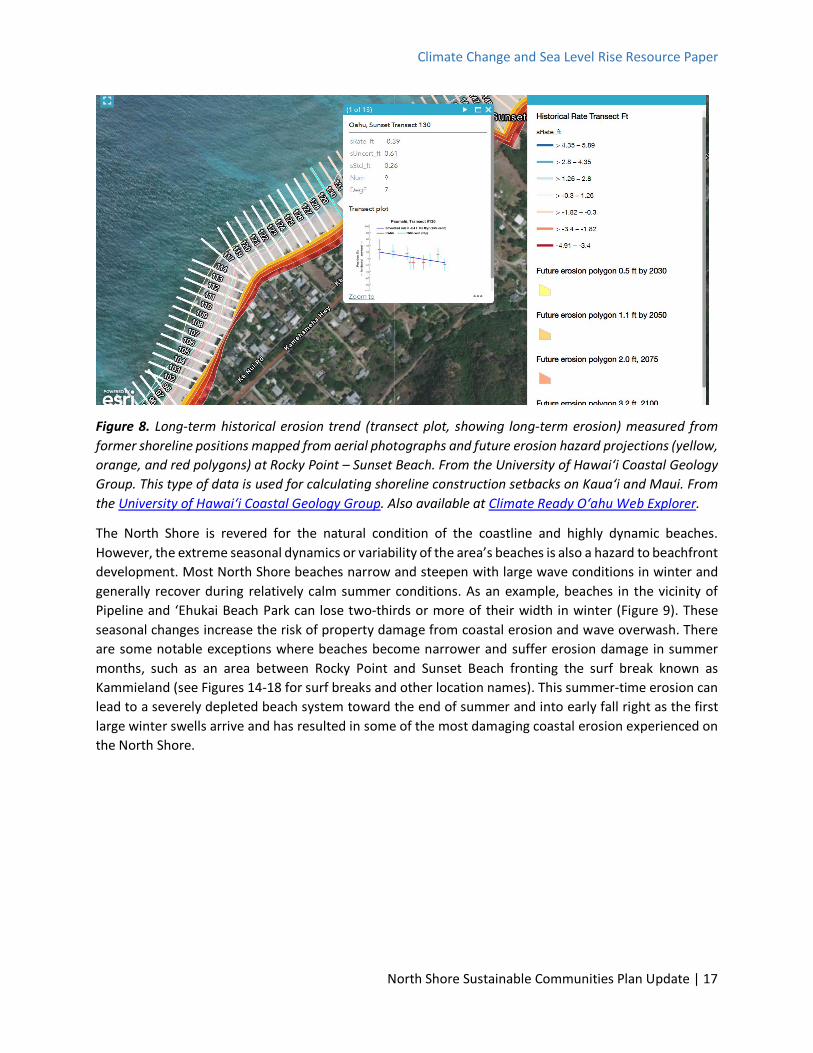
Long-term sea level rise, punctuated by recent record high tides, are likely contributing to coastal erosion on the North Shore, as shorelines are predominantly moving landward and toward higher elevation with rising water levels. The University of Hawai‘i Coastal Geology Group uses aerial photographs and survey charts going back as far as the early 1900s to map and quantify historical rates of shoreline change around O‘ahu, available on the University of Hawaiʻi Coastal Geology Group website or Climate Ready Oʻahu Web Explorer (Figure 8). These studies also account for shorter-term changes measured in seasonal beach profile surveys. There is a need to better quantify sediment budgets of North Shore beaches to gain an understanding of the volume and pathways of sand being transported seasonally and over the long-term and how these budgets may be affected by increasing sea level rise and possibly changing wave conditions.
Climate Change and Sea Level Rise Resource Paper
North Shore Sustainable Communities Plan Update | 17
Figure 8. Long-term historical erosion trend (transect plot, showing long-term erosion) measured from former shoreline positions mapped from aerial photographs and future erosion hazard projections (yellow, orange, and red polygons) at Rocky Point – Sunset Beach. From the University of Hawaiʻi Coastal Geology Group. This type of data is used for calculating shoreline construction setbacks on Kauaʻi and Maui. From the University of Hawaiʻi Coastal Geology Group. Also available at Climate Ready Oʻahu Web Explorer.
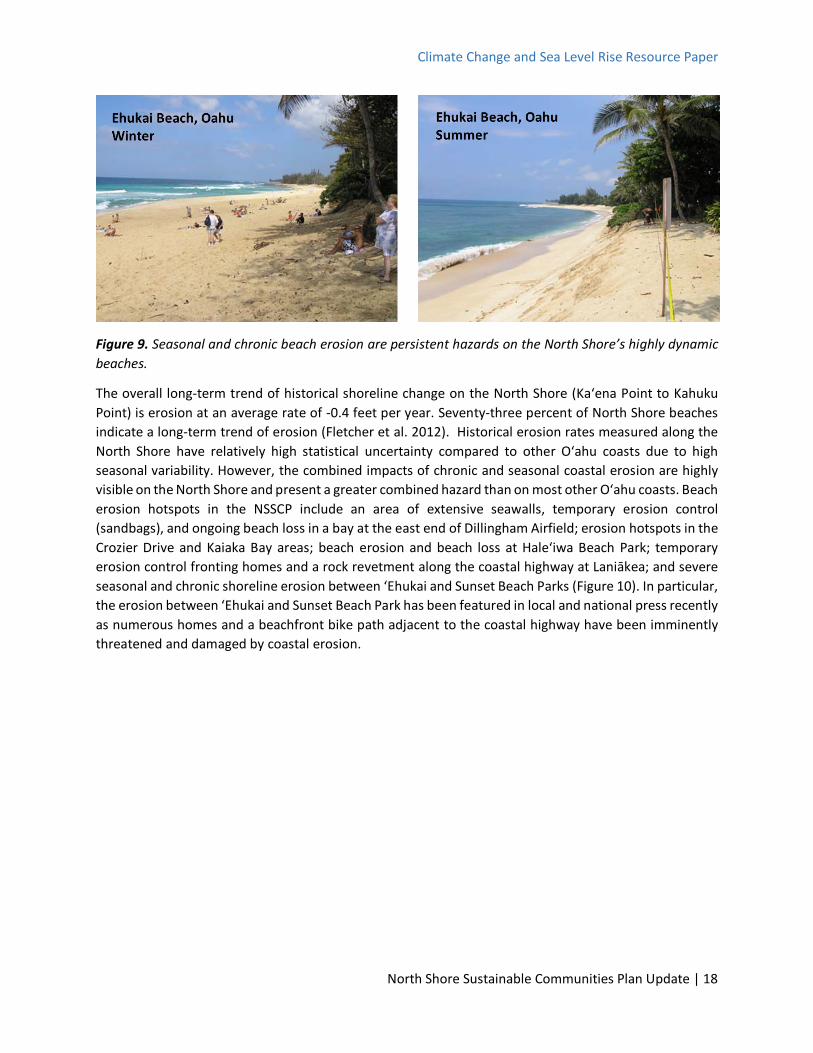
The North Shore is revered for the natural condition of the coastline and highly dynamic beaches. However, the extreme seasonal dynamics or variability of the area’s beaches is also a hazard to beachfront development. Most North Shore beaches narrow and steepen with large wave conditions in winter and generally recover during relatively calm summer conditions. As an example, beaches in the vicinity of Pipeline and ʻEhukai Beach Park can lose two-thirds or more of their width in winter (Figure 9). These seasonal changes increase the risk of property damage from coastal erosion and wave overwash. There are some notable exceptions where beaches become narrower and suffer erosion damage in summer months, such as an area between Rocky Point and Sunset Beach fronting the surf break known as Kammieland (see Figures 14-18 for surf breaks and other location names). This summer-time erosion can lead to a severely depleted beach system toward the end of summer and into early fall right as the first large winter swells arrive and has resulted in some of the most damaging coastal erosion experienced on the North Shore.
Climate Change and Sea Level Rise Resource Paper
North Shore Sustainable Communities Plan Update | 18
Figure 9. Seasonal and chronic beach erosion are persistent hazards on the North Shore’s highly dynamic beaches.
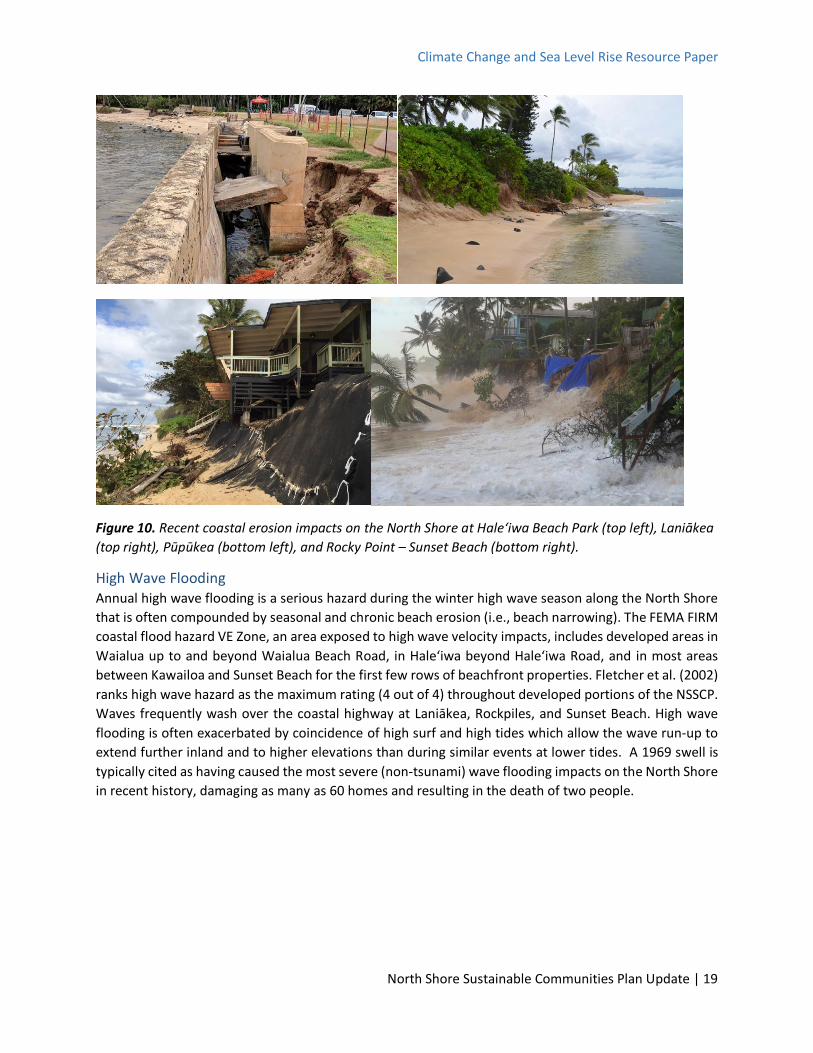
The overall long-term trend of historical shoreline change on the North Shore (Kaʻena Point to Kahuku Point) is erosion at an average rate of -0.4 feet per year. Seventy-three percent of North Shore beaches indicate a long-term trend of erosion (Fletcher et al. 2012). Historical erosion rates measured along the North Shore have relatively high statistical uncertainty compared to other Oʻahu coasts due to high seasonal variability. However, the combined impacts of chronic and seasonal coastal erosion are highly visible on the North Shore and present a greater combined hazard than on most other Oʻahu coasts. Beach erosion hotspots in the NSSCP include an area of extensive seawalls, temporary erosion control (sandbags), and ongoing beach loss in a bay at the east end of Dillingham Airfield; erosion hotspots in the Crozier Drive and Kaiaka Bay areas; beach erosion and beach loss at Haleʻiwa Beach Park; temporary erosion control fronting homes and a rock revetment along the coastal highway at Laniākea; and severe seasonal and chronic shoreline erosion between ʻEhukai and Sunset Beach Parks (Figure 10). In particular, the erosion between ̒ Ehukai and Sunset Beach Park has been featured in local and national press recently as numerous homes and a beachfront bike path adjacent to the coastal highway have been imminently threatened and damaged by coastal erosion.
Climate Change and Sea Level Rise Resource Paper
North Shore Sustainable Communities Plan Update | 19
Figure 10. Recent coastal erosion impacts on the North Shore at Haleʻiwa Beach Park (top left), Laniākea (top right), Pūpūkea (bottom left), and Rocky Point – Sunset Beach (bottom right).
High Wave Flooding Annual high wave flooding is a serious hazard during the winter high wave season along the North Shore that is often compounded by seasonal and chronic beach erosion (i.e., beach narrowing). The FEMA FIRM coastal flood hazard VE Zone, an area exposed to high wave velocity impacts, includes developed areas in Waialua up to and beyond Waialua Beach Road, in Haleʻiwa beyond Haleʻiwa Road, and in most areas between Kawailoa and Sunset Beach for the first few rows of beachfront properties. Fletcher et al. (2002) ranks high wave hazard as the maximum rating (4 out of 4) throughout developed portions of the NSSCP. Waves frequently wash over the coastal highway at Laniākea, Rockpiles, and Sunset Beach. High wave flooding is often exacerbated by coincidence of high surf and high tides which allow the wave run-up to extend further inland and to higher elevations than during similar events at lower tides. A 1969 swell is typically cited as having caused the most severe (non-tsunami) wave flooding impacts on the North Shore in recent history, damaging as many as 60 homes and resulting in the death of two people.

Climate Change and Sea Level Rise Resource Paper
North Shore Sustainable Communities Plan Update | 20
Figure 11. High wave flooding is a hazard in many locations on the North Shore in winter months (Sunset Beach Park, left, and Rockpiles, right).
Hurricane and Storm Risk Hurricane strikes in the Hawaiian Islands are infrequent compared to many other islands in the Western Pacific and Caribbean. However, a direct pass from a hurricane or tropical storm on the North Shore is possible and perhaps inevitable if considering a long-enough time span. Hurricane landfall in Hawaiʻi in any given year has a relatively low probability of occurring but would have an extremely high impact. A hurricane landfall on Oʻahu would likely lead to island-wide impacts including cutting off coastal highways, isolating communities, and lasting disruption to utilities and other critical services, possibly including emergency services. Figure 12 depicts storm surge inundation, color-coded to show flooding depth in meters, from a direct strike of a Category 4 hurricane to the NSSCP area. The scenario is based on a storm similar to Hurricane Iniki, which struck Kaua‘i in September 1992 as a Category 4 storm, and does not include additional flooding from rainfall. A storm of this magnitude would cause severe storm surge flooding in low-lying coastal areas of Mokulēʻia, Waialua, Haleʻiwa, and Kawailoa. Less severe tropical storms and winter cold front storms can also have damaging impacts on the North Shore contributing to wave runup and erosion on the shoreline as well as upland flooding from heavy rain.
Figure 12. Storm surge hazard from a Category 4 hurricane impacting the North Shore. Yellow areas indicate flooding of greater than 3 feet (National Storm Surge Hazard Maps, NOAA).

Climate Change and Sea Level Rise Resource Paper
North Shore Sustainable Communities Plan Update | 21
Drought and Fire Drought and wildfire are often overlooked hazards for Hawaiʻi. Statewide there is a trend of longer and more severe droughts (Chu, 2010). Hawai‘i has also seen a decline of 20-70% in base stream flows across the state over the last century including at Wahiawā in an upper watershed of the North Shore (Oki, 2004). Droughts can have severe impacts on agriculture and increase wildfire risks.
Each year the percentage of total land area burned in the State is comparable to and often greater than the fire-prone western U.S. states. Based on assessment and mapping by the Hawaiʻi Wildfire Management Organization (HWMO), coastal areas on the North Shore have a moderately high to high wildfire risk (Figure 13) (HWMO, 2015). The average area burned per year in Hawaiʻi has increased 400% over the past century. Wildfires occur year-round in the State and are most often the result of human-caused ignitions in non-native grass and shrub lands, which continue to expand their coverage.
Figure 13. Oʻahu wildfire risk map from Hawaiʻi Wildfire Management Organization (HWMO) indicates moderately high to high wildfire risk for North Shore coastal areas (HWMO, 2015).
The extent of grasslands, especially along Mokulēʻia, Waialua, and Haleʻiwa makes those areas of the North Shore particularly vulnerable to fire risk. The grasslands are highly sensitive to drought events with fire risk becoming high when rains stop for extended periods. These areas of grasslands and fuel loads may also be increasing with decline of agriculture in the area over the past few decades.
Climate Change and Sea Level Rise Resource Paper
North Shore Sustainable Communities Plan Update | 22
Climate Change and Sea Level Rise Outlook for Hawaiʻi and the North Shore Hawai‘i and the North Shore are experiencing the effects of climate change today in the form of increasing air and sea surface temperatures, rising sea level, overall decline in rainfall, and decrease in stream base flow (Keener et al. 2018). Hawai‘i, including the North Shore, is uniquely and disproportionately vulnerable to impacts associated with climate change and sea level rise with a coastal-focused society and economy and remote location in the Central North Pacific. Hazards and vulnerabilities related to climate change and sea level rise are increasing as the global atmosphere and oceans warm.
Appendix 1 provides a more detailed discussion of global and regional climate change observations and projections based on the Intergovernmental Panel on Climate Change’s (IPCC) 5th Assessment Report (AR5), 4th U.S. National Climate Assessment, Pacific Islands Regional Climate Assessment, Honolulu Climate Change Commission’s 2018 Climate Change Brief and Sea Level Rise Guidance, referenced research and reports therein, as well as more recent scientific publications and reports. Key takeaways from the global and regional climate change and sea level rise observations and projections in Appendix 1 are:
• Carbon dioxide and other heat-trapping atmospheric greenhouse gas concentrations are increasing:
o Global atmospheric concentrations of carbon dioxide, a key greenhouse gas, have increased by 47% since pre-industrial levels in 1850. The present level of 415 ppm is the highest in 3 million years.
o Atmospheric concentrations of other important greenhouse gases including methane, nitrous oxide, and chlorofluorocarbons have also increased over the past century.
● Air temperature is increasing globally, in Hawai’i, and on the North Shore:
o Increasing global average temperature has tracked closely with increasing carbon dioxide with a net increase of about 1.8° F (0.99° C) since 1880 and a distinct increase in warming since the 1950s. 2020 was the second warmest year in the 140-year global record (only 0.02° C shy of the warmest year in 2016). The ten warmest years have all occurred since 2005 and 2011-2020 was the warmest decade on record.
o Average air temperature in Hawaiʻi has risen by 0.75° F (0.42° C) over the past 100 years and 2015 and 2016 were the warmest on record.
o The IPCC AR5 Representative Concentration Pathway (RCP) 2.6 scenario of stringent greenhouse gas reductions aims to keep global warming below 2°C (3.6°F) above pre-industrial temperatures. The RCP 8.5 “business as usual” scenario, without substantial global efforts to constrain emissions, would lead to 4°-5°C (7.2°-9° F) of warming.
o Model projections indicate that mean surface temperatures will increase approximately 2.7°F to 4.5°F (1.5°C to 2.5°C) by midcentury and 3.6°F to 7.2°F (2°C to 4°C) by end of century under the RCP 4.5 (intermediate) and RCP 8.5 emissions scenarios. The greatest warming is expected at higher elevations on Oʻahu. .
Climate Change and Sea Level Rise Resource Paper
North Shore Sustainable Communities Plan Update | 23
o Public health risks for North Shore communities associated with rising temperatures and extreme heat events include increased respiratory illnesses, heatstroke, and cardiovascular and kidney disease.
● Ocean temperatures are increasing around Hawaiʻi and the North Shore:
o Global average sea surface temperature increased by 1.8° F (1.0° C) over the past 100 years and half of this rise occurred since 1990. Ocean surface temperatures around Hawaiʻi and the North Shore have had a statistically significant increase between 1° F and 1.5° F since 1901.
o Increasing ocean temperatures are contributing to sea level rise, ocean heat waves, and coral bleaching. Widespread coral bleaching and coral death occurred in Hawaiʻi during ocean heat waves in the summers of 2014 and 2015.
o The State of Hawaiʻi Division of Aquatic Resources estimates that the North Shore lost 8.4% of its live coral cover in the 2014-2015 bleaching event.
o Scientific projections indicate that corals in Hawaiʻi will bleach annually by 2040 if the current trend of warming continues and if corals are unable to adapt.
● Sea level is rising globally, around Hawaiʻi, and for the North Shore due to melting of glaciers and ice sheets and expansion of ocean water as it warms:
o As a result of global atmospheric and ocean warming, mountain glaciers and the Antarctic and Greenland ice sheets are losing ice mass (i.e., melting). The West Antarctic ice sheet has been reported to be in “unstoppable retreat” and Greenland is approaching net ice loss across the entire ice sheet.
o Observations from tide gauges around the world and satellite-based altimetry data show that the rate of global mean sea level is rising at an increasing rate (accelerating) due to expansion of warming surface ocean waters and from melting of land-based glaciers and ice caps and is presently rising at a global mean rate of 3.3 mm/yr (0.13 in/yr).
o Long-term measurements of sea level from tide gauge stations, including at Honolulu Harbor and Kāneʻohe on Oʻahu, show that sea level is rising around Hawai‘i, though relative rates of sea level rise vary from island to island due to localized geologic and oceanic factors.
o January 2021 set a monthly mean high sea level record for Oʻahu. Daily extreme sea level records were broken in Honolulu in June, July, September, October, and November 2020 and most recently on January 13-14, 2021.
o Global mean sea level will rise a minimum of 65 cm (2.13 feet) by 2100 if the present rate of acceleration continues.
o Continued global warming is expected to increase the rate of acceleration such that by the end of the century global mean sea level may reach or exceed about 1 m (3.2 feet) above recent mean sea level.
Climate Change and Sea Level Rise Resource Paper
North Shore Sustainable Communities Plan Update | 24
o Sea level rise around Hawai‘i and the North Shore is projected to be greater than global mean sea level rise. An intermediate sea level scenario from NOAA projects a local sea level rise of 1.31 m (4.3 feet) by the end of the century.
o According to the 4th National Climate Assessment, emerging science regarding Antarctic ice sheet instability indicates that under high emission scenarios, global mean sea level rise exceeding 2.4 meters (8 feet) by 2100 is physically possible, though the probability of this has not been assessed.
o State of Hawai‘i and City sea level rise planning guidance suggests planning for at least 3.2 feet of sea level rise and up to 6 feet for critical infrastructure.
o Flooding with extreme high tides will affect low-lying roads and structures on the North Shore decades before projected mean sea levels from NOAA and others are reached. High tide flooding impacts are expected to rapidly increase beginning in the mid-2030s from accelerating sea level rise combined with natural variations in tidal amplitude.
o It is extremely likely that global sea level rise will continue beyond 2100.
● Patterns of drought and extreme weather are changing in Hawaiʻi and on the North Shore:
o Statewide there is a trend of longer and more severe droughts. Hawai‘i has also seen a decline of 20-70% in base stream flows across the State over the last century including at Wahiawā in an upper watershed of the North Shore.
o Globally, climate change is expected to result in more intense tropical cyclones (Leong et al. 2014). Modeling of tropical cyclones in the broader Pacific Ocean has predicted a northward shift in storm tracks that would result in tropical cyclones reaching the Hawaiian Islands more frequently.
Sea Level Rise Hazards and Vulnerabilities This section provides an assessment of hazard exposure and vulnerabilities to sea level rise for the NSSCP area. The assessment uses publicly available map data from the Hawaiʻi Sea Level Rise Vulnerability and Adaptation Report (Hawaiʻi Climate Change Mitigation and Adaptation Commission, 2017), companion State of Hawai‘i Sea Level Rise Viewer (Hawaiʻi Climate Change Mitigation and Adaptation Commission, 2021; hawaiisealevelriseviewer.org), State and City Geographic Information System (GIS) programs, and recent scientific research from the University of Hawai‘i. This assessment is intended to be consistent with recent City and State directives and recommendations for addressing climate change and sea level rise. Honolulu Mayoral Directive 18-2 calls for planning, land-use, and capital improvement decisions to utilize the 2017 State Sea Level Rise Report and accompanying Sea Level Rise Viewer. The first recommendation of the State Sea Level Rise Report is to “Support sustainable and resilient land use and community development.” In addition, the State Planning Act (HRS Chapter 226, Part III) Climate Change Adaptation Priority Guidelines “Encourage planning and management of the natural and built environments that effectively integrate climate change policy.” A series of sea level rise exposure maps are provided below. Please see the Hawai‘i Sea Level Rise Viewer to explore the map data.
Climate Change and Sea Level Rise Resource Paper
North Shore Sustainable Communities Plan Update | 25
The 2017 State Sea Level Rise Report used cutting-edge modeling by the University of Hawai‘i Coastal Geology Group (Coastal Geology Group) at the School of Ocean and Earth Sciences and Technology to map areas exposed to three types of chronic sea level rise hazards:
1) Passive (“bathtub” or still-water) flooding 2) Annual high wave flooding 3) Shoreline erosion
The coastal hazard modeling produced a series of SLR-XA map products. As described in the Climate Change and Sea Level Rise Outlook of the State Sea level Rise Report, global mean sea level rise of 3.2 feet appears likely by the end of the century and possibly sooner, especially if dramatic cuts to greenhouse gas emissions are not made starting in this decade. Consequently, the model with 3.2 feet of sea level rise (from here on referred to as the SLR-XA, unless otherwise noted) represents the combined area at risk of passive flooding, wave flooding, and coastal erosion in this century. Some areas within the SLR-XA may be affected by one, two, or all three of the modeled hazard types. It is generally assumed in the State Sea Level Rise Report that areas within the SLR-XA would become uninhabitable with sea level rise if adaptation measures are not implemented or if flooding and land loss becomes too severe to adapt in place.
The SLR-XA depicts areas exposed to chronic flooding or land loss with sea level rise, that is, areas that would be flooded at least once per year with the annual high wave model, and as often as daily with the passive flooding and erosion models. Frequency and severity (e.g., depth and velocity) of chronic flooding in the SLR-XA would increase with time.
The SLR-XA does not account for less frequent but more severe floods such as the those depicted in FEMA Flood Insurance Rate Maps, which will also increase in frequency and severity with sea level rise. The 2018 State Hazard Mitigation Plan modeled a 1%-annual-chance coastal flood zone with 3.2 feet of sea level rise (1%CFZ 3.2), which has been added to the Hawaiʻi Sea Level Rise Viewer (under “Other Overlays”).
Descriptions of the modeling methods employed in mapping the SLR-XA are available in the State Sea Level Rise Report, Anderson et al. (2018), and online at hawaiisealevelriseviewer.org. More details for understanding and interpreting the SLR-XA models, including assumptions and limitations, as well as guidance for utilizing the SLR-XA is available in Guidance for Using the Sea Level Rise Exposure Area in Local Planning and Permitting Decisions (Romine et al., 2020).
● Map data from the Sea Level Rise Viewer and State and City GIS program were collected and clipped to the NSSCP area to assess exposure and vulnerability to sea level rise. Following the recommendations of the City Climate Change Commission and the State Sea Level Rise Report, and consistent with county planning across Hawaiʻi, we consider the SLR-XA as the primary planning benchmark for new and existing development with expected lifespans into the latter half of this century. Areas within the SLR-XA will experience high-tide flooding decades before 3.2 feet of global mean sea level rise is reached. The frequency of high tide flooding is expected to begin to rapidly increase in the mid-2030s due to accelerating sea level rise coinciding with an 18.6-year cycle of maximum tidal amplitude (Thompson, et al. 2021). Following the recommendations of the City Climate Change Commission, 6 feet of sea level rise is considered a planning benchmark for critical infrastructure with long (greater than 50-year) expected lifespans and low tolerance of risk. However, utility of the 6-foot sea level rise layer is presently limited for the North Shore as
Climate Change and Sea Level Rise Resource Paper
North Shore Sustainable Communities Plan Update | 26
it does not consider erosion and high wave runup and therefor underestimates the risk for this area.
With 3.2 feet of sea level rise in the NSSCP area, based on the SLR-XA*:
● 1,083 acres of land is exposed to chronic sea level rise flooding or land loss from erosion
● Within that area, 1,310 buildings are at risk of damage or loss, the vast majority of them single-family homes (78% are zoned residential).
o This is about one-third of the buildings at risk from sea level rise on O’ahu, due to relatively high exposure to coastal erosion and high-wave flooding and dense residential development along the shoreline in most areas (i.e., lots of individual buildings).
o This could potentially displace 2,192 residents or about 12% of the population in the NSSCP area.
● 2.9 miles of coastal State highway including 10 bridges, which in some areas provide the only access ways into and out of the community, and an additional 5.8 miles of City roads will be exposed to chronic flooding and/or damage by erosion. Public utilities, beachfront parking areas, bike paths and other public assets along these roads will also be impacted.
● Looking at exposure to loss from chronic flooding and/or coastal erosion by neighborhood (see Figure 1 for neighborhood extents):
o Mokulēʻia: 308 homes and other buildings are at risk; 66% are zoned Residential, 17% are zoned Agricultural; 1 mile of coastal highway exposed
o Waialua: 306 homes and other buildings are at risk, 98% are zoned Residential; 43 feet of coastal highway exposed
o Haleʻiwa: 271 homes and other buildings are at risk, 62% are zoned Residential, 38% are zoned Country (mix agricultural/residential/business); 540 feet of coastal highway
o Kawailoa: 151 homes and other buildings are at risk, 81% are zoned Residential; 1 mile of coastal highway exposed
o Pūpūkea – Sunset Beach: 270 homes and other buildings are at risk, 82% are zoned Residential; 0.8 miles of coastal highway exposed
● 2.5 miles, or about 28%, of beachfront residential North Shore properties presently have a home within 20 feet or less of the shoreline, defined as “imminently threatened” by State DLNR. This is projected to increase to 3.4 miles, or about 40%, of beachfront residences within 20 feet or less of the shoreline with 2.4 feet of sea level rise that would occur around 2080 in the NOAA Intermediate sea level rise scenario or in the 2050s in the High scenario,.
● Passive flooding from impaired drainage and rising groundwater levels is a risk in some agricultural lands in Waialua, behind Kaiaka Bay in Haleʻiwa, in Kawailoa and Papailoa, and may affect river levels and drainage in Waimea Valley.
● Sea level rise will also increase impacts from less frequent but more severe coastal floods (e.g., a 1%-annual-chance coastal flood for properties within FEMA special flood hazard areas, which
Climate Change and Sea Level Rise Resource Paper
North Shore Sustainable Communities Plan Update | 27
includes most of the coastal plain, from the shoreline up to, and in some locations beyond, Farrington and Kamehameha Highways.
● Water pollution may increase with increasing passive marine and groundwater flooding to 639 onsite sewage disposal systems (OSDS, e.g., cesspools and septic tanks) within the SLR-XA. 200 OSDS systems are within the 1.1 feet SLR-XA suggesting that some of these systems may already be compromised by groundwater and coastal erosion.
● Sea level rise impacts to surf breaks are unknown at this time and will depend on changes in water depth over the reefs and adaptation approaches on land. In particular, shoreline armoring (seawalls, revetments) can lead to seasonal and permanent beach loss blocking alongshore access and increasing wave reflection (backwash) off of the shoreline structures.
* These summary results are based on present development and population within the SLR-XA and do not account for future adaptation or other land use changes.
As seen in Figures 14 to 18, most homes between the beach and nearest alongshore road or highway are exposed to coastal erosion and annual high wave flooding. The SLR-XA extends beyond the coastal highway in some areas of Mokulēʻia and Kawailoa – Sunset Beach. The most immediate concern is in areas already undergoing chronic shoreline erosion and impacts to beachfront development. These high-priority vulnerable areas include: Mokulēʻia near the east end of Dillingham Airfield, sections of the Crozier Drive community, at the east end of Waialua, Haleʻiwa Beach Park, sections of Papailoa and Laniākea, between ʻEhukai Beach Park and Rocky Point, and from Rocky Point to Sunset Beach Park.
Based on an overlay of the SLR-XA on present-day tax parcel data in the NSSCP area:
● $1.1 billion in structures and land could be lost due to chronic flooding and land loss with coastal erosion with 3.2 feet of sea level rise (assuming no adaptation measures are implemented).
● The highest economic impacts are to high-value beachfront lands throughout the North Shore in addition to some commercial properties around Haleʻiwa Boat Harbor and Haleʻiwa Beach Park.
The monetary impacts to roads, utilities, and other critical infrastructure is unknown and needs more study but even temporary disruption of access roads will have significant social, economic, and public safety impacts. As stated previously, the economic loss calculations do not include other impacts such as losses of future business income. With 3.2 feet of sea level rise and without adaptation measures, the coastal highway will be exposed to erosion and coastal flooding at several locations in the western half of Mokulēʻia, at Haleʻiwa Beach Park, at Laniākea and around Chun’s surfbreak, Rockpiles, and at Sunset Beach Park.
Sea level rise will lead to fundamental changes in the development patterns of the North Shore beachfront community. The SLR-XA does not provide a “snapshot” of the future shoreline location. However, climate change and sea level rise science and the models collectively point to a future where much of the beachfront development on the North Shore is no longer sustainable in the current footprints, especially if beach and marine resource conservation and coastal access is prioritized as directed by State and City law and expressed by the North Shore community. The impacts of sea-level rise and coastal erosion are already playing out with numerous beachfront homes in the Sunset Beach area teetering on the edge of collapse atop severely eroded dunes. However, a concerted and proactive, community-based planning and visioning effort can identify priorities for sea level rise adaptation on the
Climate Change and Sea Level Rise Resource Paper
North Shore Sustainable Communities Plan Update | 28
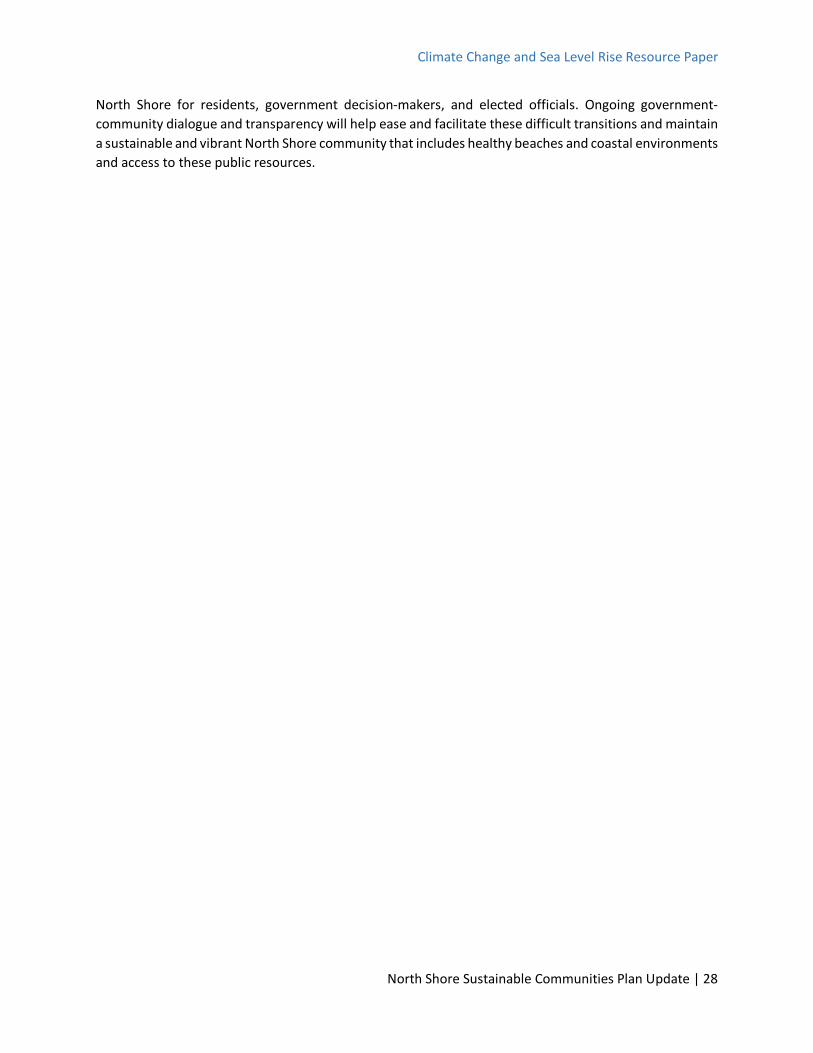
North Shore for residents, government decision-makers, and elected officials. Ongoing government-community dialogue and transparency will help ease and facilitate these difficult transitions and maintain a sustainable and vibrant North Shore community that includes healthy beaches and coastal environments and access to these public resources.

Climate Change and Sea Level Rise Resource Paper
North Shore Sustainable Com
munities Plan U
pdate | 29
Figure 14. Sea Level Rise Exposure Area (SLR-XA) with 3.2 feet of sea level rise at West Mokulēʻia , North Shore.
Climate Change and Sea Level Rise Resource Paper
North Shore Sustainable Com
munities Plan U
pdate | 30
Figure 15. Sea Level Rise Exposure Area (SLR-XA) with 3.2 feet of sea level rise at East Mokulēʻia, North Shore.
Climate Change and Sea Level Rise Resource Paper
North Shore Sustainable Com
munities Plan U
pdate | 31
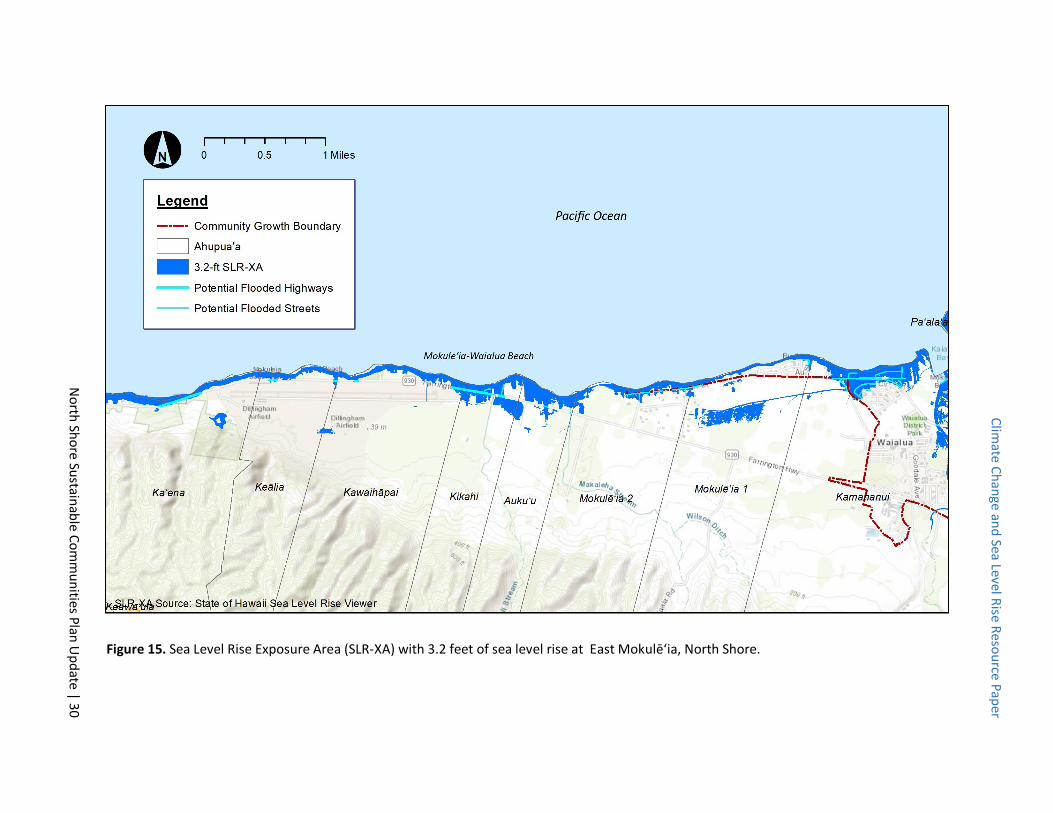
Figure 16. Sea Level Rise Exposure Area (SLR-XA) with 3.2 feet of sea level rise at Waialua and Haleʻiwa, North Shore.

Climate Change and Sea Level Rise Resource Paper
North Shore Sustainable Com
munities Plan U
pdate | 32
Figure 17. Sea Level Rise Exposure Area (SLR-XA) with 3.2 feet of sea level rise at Kawailoa, North Shore.
Climate Change and Sea Level Rise Resource Paper
North Shore Sustainable Com
munities Plan U
pdate | 33
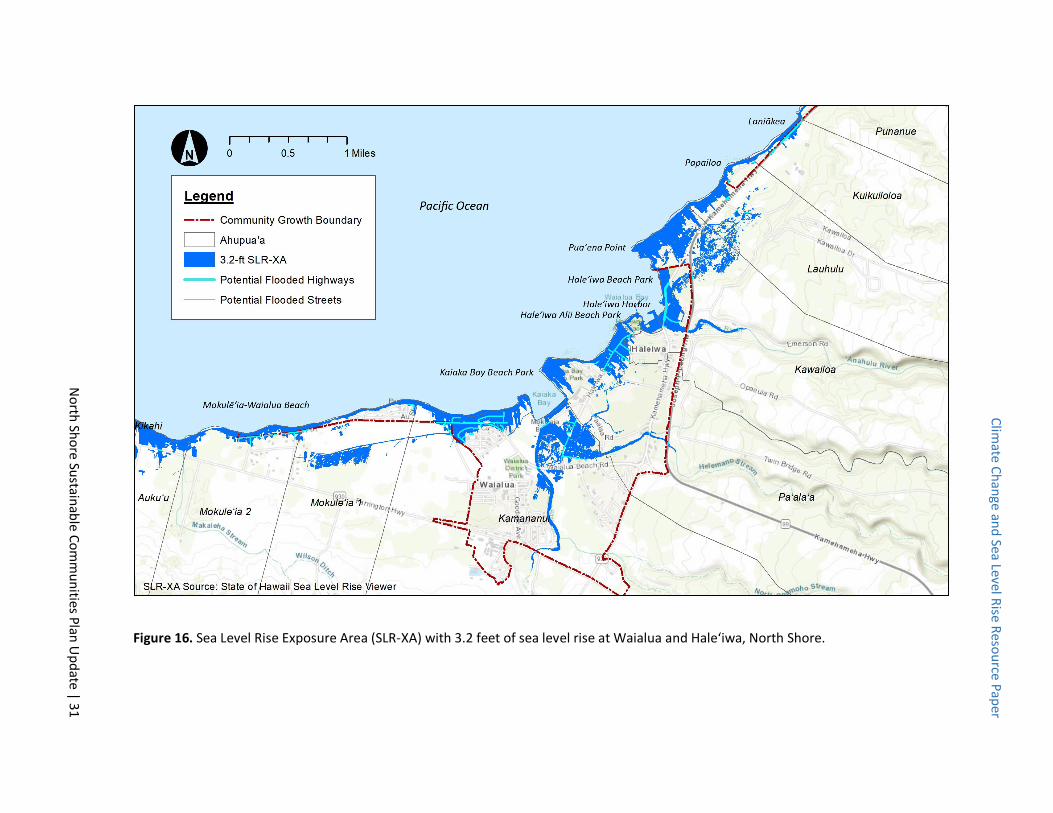
Figure 18. Sea Level Rise Exposure Area (SLR-XA) with 3.2 feet of sea level rise at Pūpūkea – Sunset Beach, North Shore.
Climate Change and Sea Level Rise Resource Paper
North Shore Sustainable Communities Plan Update | 34
Social Vulnerability The NSSCP community has high social vulnerability based on an index developed for the Oʻahu Resilience Strategy (City and County of Honolulu, 2019). The Social Vulnerability Index (SOVI) was developed to rank a community’s resilience considering vulnerability and adaptive capacity across multiple indicators. Adaptive capacity in this case refers to the ability of communities to adjust to shocks and stresses from natural and man-made hazard impacts. The SOVI is intended to help locate the most vulnerable populations, understand the primary drivers of vulnerability, and recognize the different effects on vulnerability posed by the different hazards, and then, target actions to the most vulnerable communities and populations to assist in increasing adaptive capacity.
The indicators used in calculating social vulnerability to hazards in the SOVI are socio-economic status including median income, poverty, education level, and unemployment; household composition including children, elderly, single parenting, and family size; minority / language status including disability and language barriers; and housing / transportation including access to transportation, medical services, and local food. The hazards (shocks and stressors) included in calculating the SOVI are based on location in or out of hazard zones for tsunami, FEMA special flood hazard areas, hurricane storm surge, and SLR-XA.
Climate Risks for the North Shore In a 2020 risk assessment for the Climate Ready Oʻahu Adaptation Strategy (City and County of Honolulu, 2020; climatereadyoahu.org), the City Office of Climate Change, Sustainability, and Resiliency (OCCSR) analyzed five priority near-term climate risks: hurricane, “rain bomb,” sea level rise and coastal erosion, decrease in precipitation, and increase in temperature, at an island-wide scale and at the community plan scale for 2020 and 2050. Risk assessment goes beyond exposure and vulnerability by rating the likelihood that a hazard will cause harm. With input from local communities, a risk assessment can help in prioritizing needs and adaptation strategies. In conducting the risk assessment, the authors provide the following definitions:
● Climate hazard: Climate change-related events or indicators, such as temperature or precipitation. Climate hazards include both shock and stress events.
○ Shock: An individual extreme event (e.g., storm) or disaster that occurs over a relatively short period of time (e.g., day(s) or weeks)
○ Stress: A gradual change in climate baseline that occurs over many years (e.g., sea level rise)
● Likelihood: The probability or expected frequency that a climate hazard is expected to occur ● Consequence: A measure of the severity of impacts from a climate hazard ● Risk: The chance that a hazard will cause harm. Risk is a function of the likelihood of an adverse
impact occurring and the severity of its consequences.
The analysis identified sea level rise and coastal erosion as a top risk with disproportionate impacts likely to occur to frontline populations (those living near the shoreline) and native Hawaiian and Pacific Islander communities with strong identity and place-based ties to coastal resources. Increase in temperature was identified as another high risk that can significantly impact human health, energy demand through increased use of air conditioning, and the environment.
Climate Change and Sea Level Rise Resource Paper
North Shore Sustainable Communities Plan Update | 35
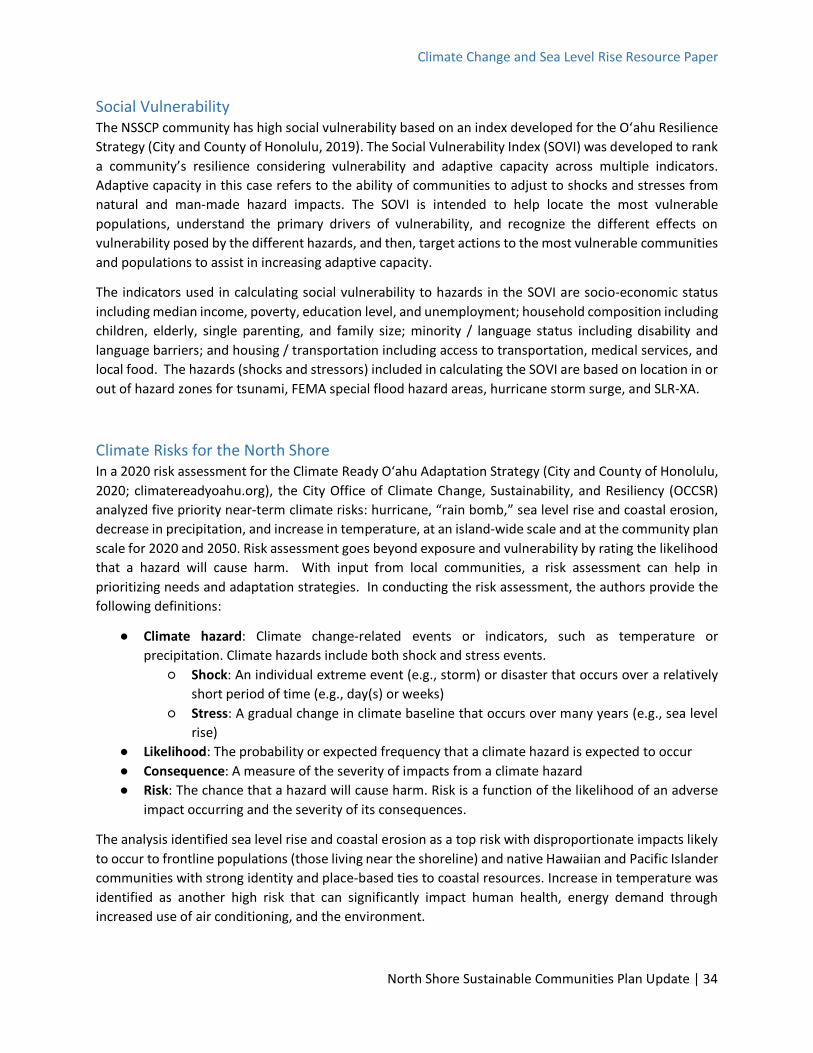
Climate Hazard Scenario Current Rating
2050 Rating
Sea level rise and coastal erosion
Sea level rise and associated coastal erosion on a trajectory to 3.2 feet by 2100 with impacts due to high tides and/or coastal hazard events decades in advance
Medium High
Increase in temperature
Increase in average annual temperature of 2.7°F to 4.5°F contributing to heat waves
Medium High
“Rain bomb” Significant rain event with 4 inches of rain/hour Medium Medium Decrease in precipitation
Leeward side of island becomes up to 60% drier contributing to droughts
Medium Medium
Hurricane Landfall of a major hurricane with storm surge, rainfall, and high winds
Low Medium
Table 1. Climate hazard risk ratings for the North Shore at present and 2050 for five hazard types. See the City’s 2020 report for more detail including rating methodology (City and County of Honolulu, 2020).
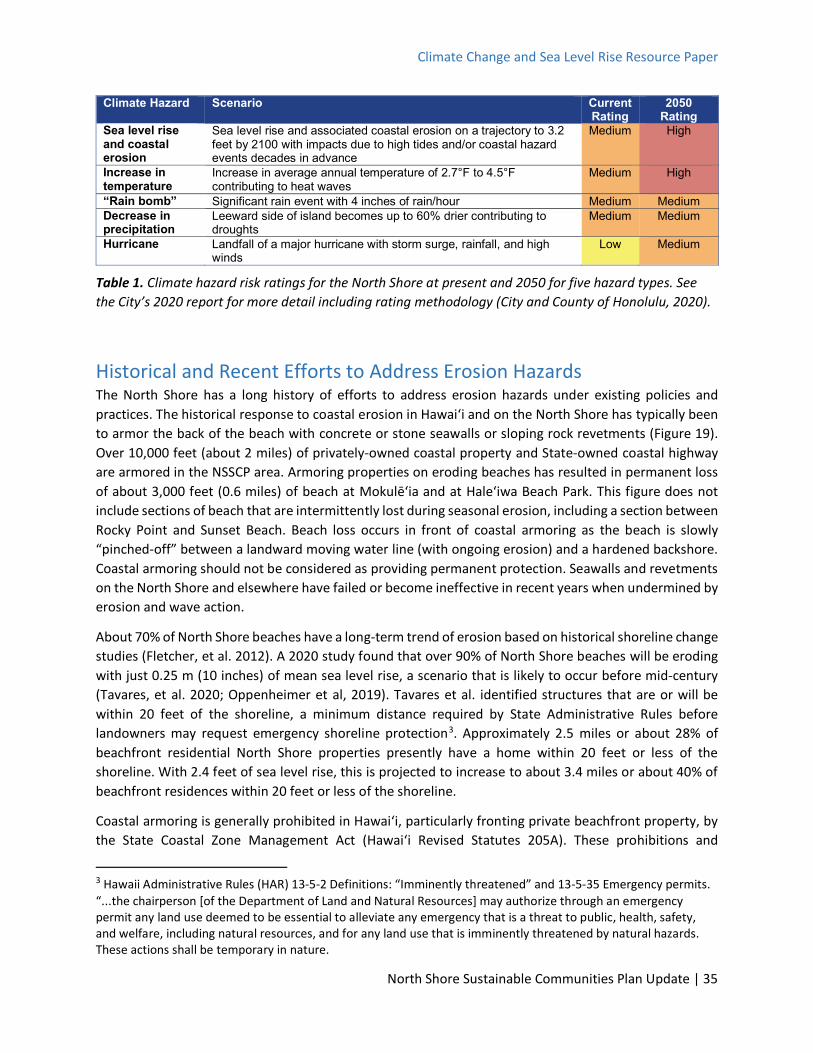
Historical and Recent Efforts to Address Erosion Hazards The North Shore has a long history of efforts to address erosion hazards under existing policies and practices. The historical response to coastal erosion in Hawaiʻi and on the North Shore has typically been to armor the back of the beach with concrete or stone seawalls or sloping rock revetments (Figure 19). Over 10,000 feet (about 2 miles) of privately-owned coastal property and State-owned coastal highway are armored in the NSSCP area. Armoring properties on eroding beaches has resulted in permanent loss of about 3,000 feet (0.6 miles) of beach at Mokulēʻia and at Haleʻiwa Beach Park. This figure does not include sections of beach that are intermittently lost during seasonal erosion, including a section between Rocky Point and Sunset Beach. Beach loss occurs in front of coastal armoring as the beach is slowly “pinched-off” between a landward moving water line (with ongoing erosion) and a hardened backshore. Coastal armoring should not be considered as providing permanent protection. Seawalls and revetments on the North Shore and elsewhere have failed or become ineffective in recent years when undermined by erosion and wave action.
About 70% of North Shore beaches have a long-term trend of erosion based on historical shoreline change studies (Fletcher, et al. 2012). A 2020 study found that over 90% of North Shore beaches will be eroding with just 0.25 m (10 inches) of mean sea level rise, a scenario that is likely to occur before mid-century (Tavares, et al. 2020; Oppenheimer et al, 2019). Tavares et al. identified structures that are or will be within 20 feet of the shoreline, a minimum distance required by State Administrative Rules before landowners may request emergency shoreline protection3. Approximately 2.5 miles or about 28% of beachfront residential North Shore properties presently have a home within 20 feet or less of the shoreline. With 2.4 feet of sea level rise, this is projected to increase to about 3.4 miles or about 40% of beachfront residences within 20 feet or less of the shoreline.
Coastal armoring is generally prohibited in Hawai‘i, particularly fronting private beachfront property, by the State Coastal Zone Management Act (Hawai‘i Revised Statutes 205A). These prohibitions and
3 Hawaii Administrative Rules (HAR) 13-5-2 Definitions: “Imminently threatened” and 13-5-35 Emergency permits. “...the chairperson [of the Department of Land and Natural Resources] may authorize through an emergency permit any land use deemed to be essential to alleviate any emergency that is a threat to public, health, safety, and welfare, including natural resources, and for any land use that is imminently threatened by natural hazards. These actions shall be temporary in nature.
Climate Change and Sea Level Rise Resource Paper
North Shore Sustainable Communities Plan Update | 36
protections for beach resources and public access were recently strengthened through State Act 16 (Senate Bill 2060, Session Laws Hawaiʻi 2020). Recognizing the negative impacts of coastal armoring on beaches, the State Board of Land and Natural Resources has a no-tolerance policy for unpermitted coastal armoring, which has been carried out through numerous civil enforcement actions and court cases on the North Shore and elsewhere.
In an effort to provide affected homeowners some temporary options for erosion control, the State Department of Land and Natural Resources has authorized “softer” temporary emergency erosion control measures under HAR 13-5 (Figure 20). These include geotextile blankets draped over eroded dunes and sand pushing (dune restoration using heavy machinery) at several sites on the North Shore to protect homes threatened by extreme erosion. These projects are paid for and conducted by private residents with authorization from the State. These “soft” erosion control approaches may also have negative environmental effects if not implemented and managed carefully, such as potentially transferring erosion to neighboring unprotected properties, restricting lateral public access, and shedding materials onto the active beach and marine environment when temporary structures fail. It is unknown how long the State will continue to provide these increasingly controversial, temporary, and discretionary authorizations as the number of critically vulnerable properties increases.
The City regularly conducts sand pushing fronting North Shore beach parks and public access ways to restore erosion damage from seasonal high waves and foot traffic erosion. In 2019, a successful community project at Sunset Beach Park was carried out to re-vegetate the sand dune, restored by a City sand pushing effort, using native dune plant species and fencing fronting the beachfront bike path that has been relocated slightly farther inland following erosion damage. The State DLNR generally prohibits planting of vegetation seaward of the shoreline (i.e., annual high wash of the waves) in front of private properties to conserve alongshore access and prevent landowners from claiming portions of the public beach.
Haleʻiwa Beach Park is the only example of a major beach nourishment project on the North Shore. The beach, offshore breakwall, and terminal rock groin were originally constructed in 1965, and repaired several times in the late 1960s and in the 1970s after storms or large wave events, through cooperation between the U.S. Army Corps of Engineers and Hawaiʻi Department of Transportation. The City and State DLNR, Office of Conservation and Coastal Lands are currently working with the Army Corps of Engineers to develop a beach restoration project at Haleʻiwa Beach Park. Beach nourishment has not been conducted on other segments of the North Shore due to the typically high-energy ocean conditions and risk that a multi-million-dollar nourishment project may be washed away by the next large winter swell.
Prior to the 2019 Sunset Beach Park dune restoration project, the City relocated a failed section of the beachfront bike path landward (Figure 21). This is perhaps the first example of landward relocation (i.e., “managed retreat”) of public infrastructure on the North Shore in response to increasing erosion impacts.
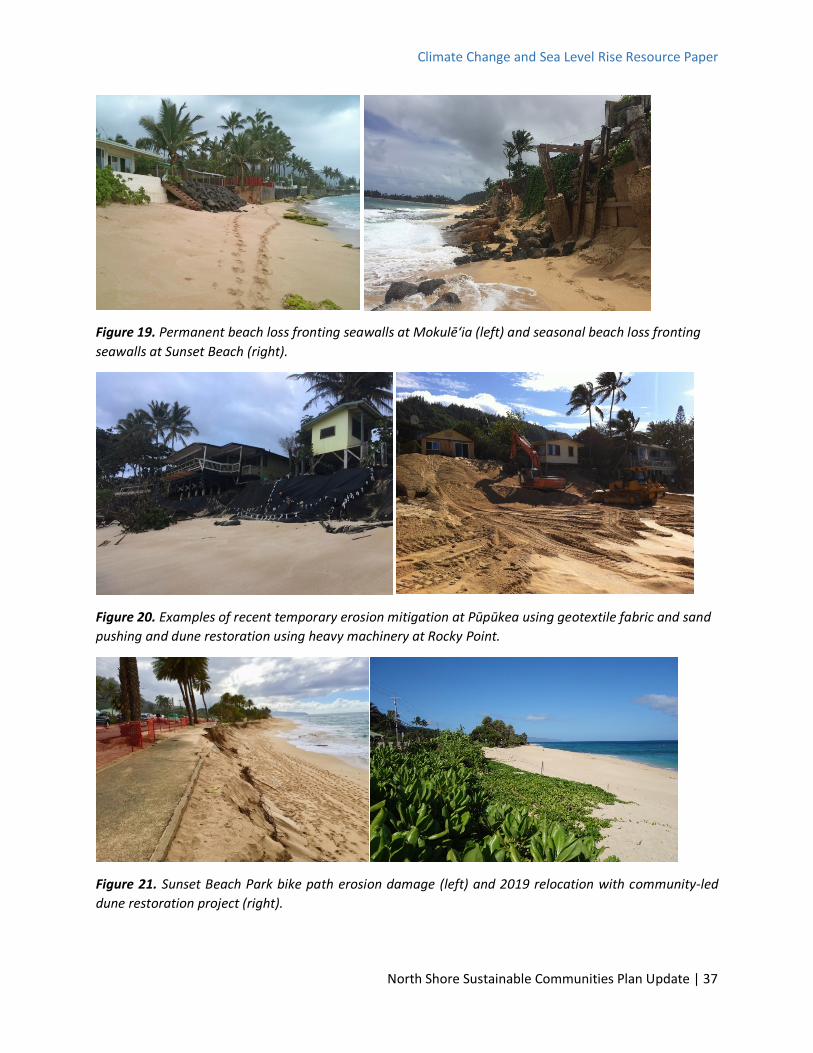
Climate Change and Sea Level Rise Resource Paper
North Shore Sustainable Communities Plan Update | 37
Figure 19. Permanent beach loss fronting seawalls at Mokulēʻia (left) and seasonal beach loss fronting seawalls at Sunset Beach (right).
Figure 20. Examples of recent temporary erosion mitigation at Pūpūkea using geotextile fabric and sand pushing and dune restoration using heavy machinery at Rocky Point.
Figure 21. Sunset Beach Park bike path erosion damage (left) and 2019 relocation with community-led dune restoration project (right).
Climate Change and Sea Level Rise Resource Paper
North Shore Sustainable Communities Plan Update | 38
Application of Managed Retreat Strategies to the North Shore The State of Hawaiʻi Office of Planning - Coastal Zone Management Program conducted a study in 2019, Assessing the Feasibility and Implications of Managed Retreat Strategies for Vulnerable Coastal Areas in Hawaiʻi (Hawaiʻi Office of Planning, Coastal Zone Management Program, 2019). Key findings of the study included:
● Case studies of managed retreat programs from outside Hawaiʻi showed more success when the community was supportive and relocation was voluntary and determined locally.
● State and county long-range plans must provide for managed retreat, including identifying lands where it is possible to retreat to.
● Catastrophic (disaster) events result in greater impetus for retreat.
● Funding mechanisms will have to be instituted by government for retreat to occur.
● New laws will need to be adopted to implement and facilitate retreat. This may include but is not limited to increased shoreline setbacks and rebuilding restrictions, as well as legal mechanisms such as transfer of development rights and rolling easements.
● Areas retreated from should be left as open space for a resilient coastline.
While there is strong community and stakeholder interest in further exploring various coastal adaptation options for the North Shore, next steps are urgently needed to advance discussions of managed retreat strategies toward actionable solutions and implementation strategies, building on the State’s 2019 managed retreat report. The NSSCP can support prioritizing the development of a sea level rise and coastal hazards adaptation strategy, including managed retreat where appropriate, through the plan’s policies and actions. The NSSCP can guide decision-making about what uses are permitted near the shoreline and what land use patterns and densities are necessary to ensure a resilient and sustainable community. The plan can also identify areas where it may be possible to relocate impacted landowners to, weighing competing priorities such as conserving agricultural and forested lands, especially in the context of the current community growth boundaries. Implementing managed retreat as a result of a coastal disaster may be the most effective vehicle but requires having post-disaster redevelopment scenarios and alternatives in place, which may be discussed and retained through the NSSCP community engagement, visioning and planning process.
The 2019 managed retreat report concluded that property buyouts to facilitate managed retreat can be problematic. High real estate values on the North Shore may make widespread buyouts at market value unlikely. On the other hand, discounted or lower value buyouts can provide some relief to affected landowners and an opportunity to expand lightly developed or undeveloped (restored) beachfront parklands on the North Shore for the community’s benefit. Innovative financing programs for managed retreat have been proposed such as in California Senate Bill 1293 (2019-2020) that would establish a revolving loan program to fund government purchases of critically vulnerable coastal properties and rent them back to the former owner or someone else, perhaps even as short-term vacation rentals, recovering money to pay off as much of the loan as possible until the property is no longer safe to live in4. Community
4 California Senate Bill 1293 (2019-2020) California Infrastructure and Economic Development Bank: Sea Level Rise Revolving Loan Program. See also NPR March 21, 2021 report: California Has A New Idea For Homes At Risk From Rising Seas: Buy, Rent, Retreat.
Climate Change and Sea Level Rise Resource Paper
North Shore Sustainable Communities Plan Update | 39
outreach and discussion as part of, or building on, the NSSCP update provide an opportunity to gauge community sentiment about using public funds or financing options for purchasing prioritized private beachfront properties for eventual conversion to public park and beach areas.
Making managed retreat a viable option for the North Shore cannot wait decades. With numerous beachfront homes presently on the brink of collapse on North Shore beaches, the most critically vulnerable sites on the North Shore can serve as demonstration sites for adaptation, including managed retreat. These pilot projects can explore and establish pathways for cooperation in planning, policy, financing, and implementing managed retreat strategies for other critically vulnerable beachfront areas on Oʻahu and statewide.
Clearly more work is needed beyond the NSSCP to evaluate managed retreat as a viable option. The 2019 Office of Planning report recommended convening a “multi-prong statewide leadership committee” with subject matter expertise in social science, coastal hazards, economics and tax, law and land use, and planning to “devise a comprehensive, cohesive managed retreat plan with identified implementable pilot projects at the end of its limited term.” Various agencies and organizations, including the University of Hawaiʻi can provide research and technical capacity to further expand our understanding of the key challenges and potential solutions to support the development of a managed retreat strategy. The NSSCP can set the stage and prioritize options and further planning benchmarks for adapting to coastal hazards and sea level rise on the North Shore in a holistic and comprehensive manner.
Managed retreat and other adaptation options are also discussed in Considerations for Planning and Adaptation and Appendix 3.
Considerations for Planning and Adaptation Community plan updates in each of the counties are including expanded consideration, policies, and actions to address climate change and sea level rise. Many of these recent efforts are described in Hawaiʻi Sea Grant’s and the State’s 2020 Guidance for Addressing Sea Level Rise in Community Planning in Hawaiʻi (Courtney, et al., 2020), which was developed in close cooperation with each of the county planning departments including representatives from the DPP. The following recommendations come from the recent guidance document and actions included in recent plans, with specific considerations to address the unique qualities and needs of the North Shore communities. The recommendations are provided as guidance for the DPP and the community to consider and are not intended to be prescriptive.
• Include climate change and sea level rise as cross-cutting considerations throughout plan development. The results of this sea level rise exposure and vulnerability assessment can be used in analyzing existing and future conditions across relevant plan elements. Population growth, natural resources, affordable housing, sustainability, and overall community vitality have a strong nexus with climate change and sea level rise adaptation.
• Consider 3.2 feet of sea level rise (3.2 SLR-XA) for all planning decisions. Planning decisions made today through the NSSCP will shape development with life spans extending into the latter half of this century and beyond. Considering the 3.2 SLR-XA as a hazard overlay in all planning decisions is a critical first step in preparing for and adapting to sea level rise impacts. For planning decisions
Climate Change and Sea Level Rise Resource Paper
North Shore Sustainable Communities Plan Update | 40
related to critical infrastructure with particularly long expected lifespans and/or low risk tolerance (e.g., highways, utilities, wastewater systems, emergency facilities), 6 feet of sea level rise should be considered. A risk-based approach to new development or major upgrades to existing development should include a critical assessment of future exposure to hazards and alternatives to mitigate hazards or relocate the development to areas outside the hazard exposure area. This aligns with the requirements of Mayoral Directive No. 18-2, City Climate Change Commission Sea Level Rise Guidance, and the recommendations of the State Sea Level Rise Report.
• Consider social vulnerability and social equity as cross-cutting considerations throughout plan development. The NSSCP area is highly diverse from a socioeconomic perspective with a wide range in income, education, and employment; household composition; minority and language status; and access to affordable housing, transportation, medical services; plus, an overall high cost of living. City OCCSR calculated a Socioeconomic Vulnerability Index (SOVI) for Oʻahu including the North Shore for the Oʻahu Resilience Strategy that includes consideration of vulnerability to coastal hazards and sea level rise. SOVI data is intended to help in targeting actions to the most vulnerable communities and populations to assist in increasing adaptive capacity to natural hazards and climate change. In December 2020, the City Climate Change Commission provided a Climate Change and Social Equity Guidance Document defining social equity in the context of climate change, explaining its importance, beginning to identify conditions that create resiliency and vulnerability on Oʻahu, and provide key findings and recommendations with regard to climate mitigation and adaptation initiatives (City and County of Honolulu, Climate Change Commission, 2020a). The guidance document’s key recommendations are:
1. Center social equity in all City climate change adaptation and mitigation plans. 2. Identify frontline communities that potentially are or will be experiencing chronic climate
or socioeconomic stressors that could worsen the impact of climate change-induced shocks.
3. Review Oʻahu's Resilience Strategy to determine areas that include equity components and where additional focus on equity is needed.
4. Collaborate with communities to share resources and information about community risks, needs, and abilities.
5. Focus on outreach to underserved communities through expanding accessibility options and providing information in the preferred format and languages of the island’s diverse communities.
• Coordinate climate change planning and adaptation through an interdepartmental working
group. A working group with members from key City departments can support cooperation and consistency among vulnerability assessments and identify potential adaptation strategies that cross multiple sectors. This may be accomplished through the City’s Resilience Team, Climate Commission, and/or a One Water Panel (see following recommendation on One Water Collaboration). Consider including a GIS specialist that can support the working group with data requests and analyses. In addition to coordination among City departments, regular contact with State and federal agencies is recommended in order to address the long-term, complex, and cross-jurisdictional nature of adapting to sea level rise.

Climate Change and Sea Level Rise Resource Paper
North Shore Sustainable Communities Plan Update | 41
• Take a “One Water for Climate Resiliency” approach in planning for climate change and sea
level rise. In a July 2020 memo, the City Climate Change Commission provided its support for a One Water Collaboration Framework as an integrated water management system approach to coordinate planning and infrastructure investment among City agencies for climate resiliency (City and County of Honolulu, Climate Change Commission, 2020b). The memo notes that many climate change impacts involve water, either too much or too little, and Oʻahu “will experience tremendous impacts from multiple sources of water that require changes to critical infrastructure.”
• Use the results of this technical resource paper in developing sea level rise –informed land use and development alternatives for the NSSCP. Through community engagement and visioning processes incorporating the results of this paper, identify and evaluate land use alternatives and tradeoffs that will improve community sustainability and resilience, minimize harm to the natural environment, and preserve and restore natural and cultural landscapes and resources. In considering sea level rise hazards and adaptation, it is recommended that visioning extend over a 50-year timeframe or more, beyond the typical 20-year outlook for community plans. Land use decisions made today will have impacts well into the latter half of this century.
• Support resilience actions that provide multiple benefits. Resilience actions that provide multiple benefits allow for more effective leveraging of resources and acknowledge the connections between climate change vulnerabilities and broader societal and environmental factors impacting quality of life on the North Shore. There are many opportunities to enhance resilience to present-day natural hazards, climate change, and sea level rise by strategically incorporating adaptation measures into ongoing community improvement projects and planning efforts. By taking a regional and long-term view, the NSSCP process can help identify some of those resilience actions with multiple benefits. In this approach the NSSCP should also consider opportunities to align policies and planning actions with the O‘ahu Resilience Strategy, City Hazard Mitigation Plan, City Climate Action Plan, and other related plans and policies.
• Support beach conservation and maintain public shoreline access by improving coordination with State agencies including the Department of Land and Natural Resources – Office of Conservation and Coastal Lands (OCCL) in enforcing prohibitions against unauthorized shoreline development, particularly unpermitted shoreline armoring, and applying nature-based approaches for sea level rise adaptation and conservation of beaches. OCCL and City Parks Department should continue to coordinate efforts to maintain and enforce access to and along the shoreline, even as shorelines change. Other City offices such as the Department of Facilities and Maintenance may be called upon to assist with cleanup efforts when beachfront structures collapse onto public beaches. The State Office of Planning - Coastal Zone Management Program has a key role in ocean and resource management planning, conducting and supporting research and planning projects, and State-level policy development and guidance.
• Identify areas for relocation of vulnerable development and adjust growth boundaries accordingly. City government, ideally with help from the State and perhaps federal assistance,
Climate Change and Sea Level Rise Resource Paper
North Shore Sustainable Communities Plan Update | 42
will need to develop alternatives to help beachfront land owners facing imminent erosion threats to relocate if beach conservation is to be prioritized as required by State and City law. These programs may include purchasing high-priority properties outright, transfer of development rights (TDR), land swaps, tax credits, purchase to rent agreements, and conservation easements to provide impacted landowners some relief in relocating. As an initial step, the NSSCP can identify lands outside of the SLR-XA and other hazard zones that could serve as “receiving areas” for relocating residents from impacted and highly vulnerable areas. This may require adjusting growth boundaries and rezoning in some areas, which will require challenging discussions about what that means in the context of a Sustainable Communities Plan. See the recommendation below to prioritize development of a managed retreat program for private property owners experiencing severe coastal erosion and/or recurring flooding impacts.
Specific Policy Actions to Consider
• Consider draft ordinances for priority actions to be submitted to Council with the plan. Revisions to ordinances and rules needed to support implementation of priority actions determined by the NSSCP should be submitted to the City Council along with the draft community plan. This can expedite plan implementation and ensure consistency between the plan and implementing rules and regulations. As an example, to support implementation of the West Kauaʻi Community Plan, the County of Kauaʻi developed ordinances that were adopted concurrently by the Kauaʻi Planning Commission including allowing for the establishment of a new Special Treatment - Coastal Edge (ST-CE) District that specifies additional performance requirements for development in particularly vulnerable areas along the coastline.
• Revise existing shoreline regulatory and development policies. The City is conducting coordinated efforts to update shoreline construction setback requirements (Revised Ordinances of Honolulu (ROH) Chapter 23) and Special Management Area regulations (ROH Chapter 25) that can reflect increased understanding of sea level rise risks and impacts and support improved coastal hazards resilience and environmental protections on the North Shore. In each, the City may also consider regulatory tools for phasing-out non-conforming structures in high-hazard areas and/or structures that are causing environmental harm.
• Pursue special improvement districts or other shared community or neighborhood-scale funding mechanisms for sea level rise and coastal hazards adaptation. These funding mechanisms may be used to support nature-based conservation and resilience strategies and exit strategies for land owners impacted by land loss from coastal erosion or severe recurring flooding. Hawaii Revised Statute (HRS) §46-80.5 Special Improvement District allows for the creation of special localized tax collections for community benefit. There are several Special Improvement Districts on O’ahu that serve as successful examples.
• Adopt or update local building codes to improve resilience. This may include policies such as prohibiting slab-on-grade construction or other concrete foundations in high hazard beach areas to support adaptation or relocation and requiring additional freeboard and flood-proofing in

Climate Change and Sea Level Rise Resource Paper
North Shore Sustainable Communities Plan Update | 43
increasingly flood-prone areas. Additional adaptation planning considering a range of projected coastal hazards risks will be needed to identify areas that may be suitable for adaptation in place rather than eventual relocation or abandonment.
• Integrate sea level rise considerations in floodplain management and regulation. Special flood hazard areas in FEMA Flood Insurance Rate Maps are mapped based on historical events and do not consider changing flood risks with climate change and sea level rise. The City’s Multi-Hazard Pre-Disaster Mitigation Plan, updated in 2020, includes a priority action to produce regulatory coastal flooding maps (100-year and 500-year) that account for future climate effects on storm intensities and sea level rise and requiring 500-year flood elevations in design of critical and essential facilities. Utilizing a Design Flood Elevation (DFE) that is above the FEMA Base Flood Elevation (BFE) is becoming a national industry-standard for resilience and adaptation strategy.
Considerations for Building on the NSSCP at Multiple Scales
• Link the NSSCP with other related plans through interdepartmental coordination including but not limited to the O‘ahu Resilience Strategy, Climate Ready Oʻahu (City) island-wide Climate Adaptation Strategy (in prep) and Climate Action Plan, O‘ahu and North Shore Watershed Management Plans, and State and City Hazard Mitigation Plans.
• Include sea level rise considerations in the planning, design, and maintenance of City facilities and infrastructure. This should begin with conducting more detailed sector-specific vulnerability assessments through the City’s Climate Adaptation Strategy (planned, in-prep) and related efforts for critical infrastructure, parks and recreational facilities, natural and cultural resources, transportation, and other assets. Collaborative work should follow principles from the City’s One Water Panel, which is focused on sea level rise adaptation in City projects including integrating resource management, clearly defining roles and processes, identifying interrelated needs and effects, coordinating at multiple stages and at multiple staff levels, and identifying new approaches to funding adaptation and planning.
• Conduct More Detailed and Community-Based Vulnerability Assessment for the North Shore. This technical resource paper building on the 2017 State Sea Level Rise Report provides a comprehensive assessment of exposure to sea level rise and other climate impacts and an initial assessment of vulnerabilities. More detailed vulnerability assessment is needed to identify people and assets at risk, quantify likelihood of damage or loss, and prioritize adaptation strategies at scales smaller than the NSSCP area. This can include building on community participation in the NSSCP to conduct expanded, collaborative discussions among diverse stakeholders to identify vulnerabilities and generate priorities for adaptation through processes like those demonstrated in a 2020 West Kauaʻi Community Vulnerability Assessment for the West Kauaʻi Community Plan update (Spirandelli, et al. 2020). In addition, more detailed exposure and vulnerability assessment is needed for sea level rise scenarios greater than 3.2 feet. The City Climate Change Commission recommends considering 6 feet of sea level rise for the most critical infrastructure. However, we are unable to thoroughly assess the effects that 6 feet of sea level

Climate Change and Sea Level Rise Resource Paper
North Shore Sustainable Communities Plan Update | 44
rise would have on the NSSCP area at this time. The 6-foot sea level rise exposure area from NOAA and in the Hawaiʻi Sea Level Rise Viewer is based on passive flooding only and does not consider impacts from waves or coastal erosion, which are critical in understanding hazard exposure in a high-energy coastal environment like the North Shore. Improved data for higher sea level rise scenarios will likely be available in the next two to three years through ongoing research and sea level rise exposure mapping at the University of Hawaiʻi School of Ocean and Earth Science and Technology.
• Consider developing a disaster recovery and redevelopment plans. City and State planners and the North Shore community should collectively consider what should be rebuilt or repaired and what highly-vulnerable areas should not be rebuilt following a major coastal disaster, such as an extreme high wave event, hurricane, or tsunami. Natural hazard events causing major damage to public and private development should be evaluated as opportunities to improve community resilience to recurring and future hazards by building back smarter and stronger and in some cases, not building back at all. A disaster redevelopment alternative describes potential land use and development changes that would be triggered should a catastrophic event occur in an area that is critically vulnerable to flooding and coastal erosion within the sea level rise exposure area. A disaster redevelop scenario may be linked to the NSSCP and the City’s Multi-Hazard Pre-Disaster Mitigation Plan for future reference and to inform broader disaster recovery preparedness activities. More guidance on these topics is available in the Guidance for Disaster Recovery Preparedness in Hawaiʻi prepared by Hawaiʻi Sea Grant and the State of Hawaiʻi (Courtney, et al. 2019).
• Develop pilot adaptation projects. Beachfront communities on the North Shore are an epicenter of coastal erosion and flooding impacts and risks. Utilizing a priority list of erosion hot spots on the North Shore, pilot adaptation projects can be used to demonstrate the viability of adaptation approaches and develop collaborative pathways for planning, funding, and implementation for the most vulnerable priority locations identified through this vulnerability assessment, community engagement, and the NSSCP planning and community engagement process. These pilot programs can then be incentivized and scaled-up if proven effective.
• Plan for development of a managed retreat program for private property owners experiencing severe coastal erosion and/or recurring flooding impacts. Recent erosion events, climate change and sea level rise projections discussed herein and SLR-XA map data unfortunately point to a future where the shoreline will increasingly erode landward throughout the North Shore and wave overwash and groundwater will increasingly flood low-elevation areas. On the North Shore, these impacts are falling largely on private coastal homeowners experiencing increasing land loss and catastrophic damage to shorefront homes undermined by coastal erosion. State law, including the Coastal Zone Management Act (HRS 205A) prohibits coastal hardening of beachfront private property unless a clear benefit to the public can be demonstrated. The science is clear that hardening shorelines in response to chronic beach erosion is detrimental to the beach environment and public access. City government, ideally with help from the State and perhaps even with federal assistance, will need to develop legal and financial mechanisms to support beachfront land owners in relocating from coastal properties facing severe coastal hazards, if
Climate Change and Sea Level Rise Resource Paper
North Shore Sustainable Communities Plan Update | 45
beach conservation is to remain a priority as required by State and County law. These programs may include purchasing high-priority properties for conservation and parks land, purchase to rent agreements, transfer of development rights (TDR), land swaps, tax credits, and conservation easements to provide impacted landowners some relief in relocating. With these scenarios, willing sellers could be offered additional incentives to be part of the early adopters of strategic retreat that could help to promote this strategy.
• Develop and implement programs to address onsite sewage disposal systems in the sea level rise exposure area. As described in the Sea Level Rise Hazards and Vulnerabilities section, many onsite sewage disposal systems (OSDS; e.g., cesspool or septic systems) in shoreline areas of the North Shore are likely compromised or will be in coming decades with rising sea and groundwater levels, which will increase discharge of nutrients and pathogens into coastal waters risking the health of marine ecosystems and beach and ocean users. The City should continue to work with the State Department of Health and other partners to incentivize and enforce mandated upgrades and relocations of OSDS systems out of hazard areas for priority locations.
• Develop an adaptation strategy. An implementation, monitoring, and evaluation strategy may be included in a community plan or may be identified as a key action or next step. The strategy can include triggers, which are a phased implementation approach that details timing, sequence, and pathways for implementing key policies and actions, such as relocating threatened development. The strategy can include near, mid, and long-term strategies, each with particular triggers. A monitoring and evaluation strategy can also define roles and responsibilities for implementation, monitoring and evaluation, and reporting to the community, climate change commission, county council, an interdepartmental climate adaptation working group, and other venues. However, it is important that a triggered or phased implementation plan not delay preemptive actions for the most critically vulnerable areas presently being impacted by erosion and flooding. Also, it's crucial that near-term strategies such as dune restoration, for example, not give a false sense of long-term security that may stimulate increased development density and avoidance of other adaptation measures in highly vulnerable areas.
Greenhouse Gas Mitigation Strategies for Consideration in the NSSCP
• Increase incentives for residential and centralized renewable electricity generation. In 2015, Hawai‘i committed to 100% renewable electricity generation by 2045 (Act 97). The State has been making steady progress towards this goal through expanded solar and wind power generation. However, improved community equity and justice consideration is needed in locating renewable energy projects based on recent public concerns and pushback against wind energy projects on the North Shore and in neighboring Ko‘olau Loa. Deeper consideration and discussion is also needed related to direct benefits of renewable energy projects to the North Shore community and scalability of projects, e.g., larger projects also serving areas beyond the North Shore or smaller-scale projects solely benefiting the North Shore communities.
Climate Change and Sea Level Rise Resource Paper
North Shore Sustainable Communities Plan Update | 46
• Improve energy efficiency in commercial and residential buildings. The NSSCP can address building-level energy use by encouraging the use of sustainable rating systems (such as LEED or Envision certification), supporting incentives to promote residential and commercial energy efficiency retrofits, and implementing stronger efficiency regulations for new construction.
• Continue to improve walkable and bikeable neighborhoods. The transportation sector is responsible for almost two-thirds of statewide fossil fuel consumption (Blue Planet Foundation, 2016). Reducing automobile use is a key factor in reducing fossil fuel consumption on the North Shore. Bike paths are already highly used along the North Shore. However, there is currently no bike path or even a safe roadside shoulder between Waimea Bay and Haleʻiwa. Existing bike paths could be improved to allow for expanded and safer multi-modal use (e.g., electric bikes and scooters). The City Department of Transportation Services is planning for expansion of existing multimodal paths on the North Shore through the Oʻahu Pedestrian Plan and Oʻahu Bike Plan (http://www.honolulu.gov/completestreets/912-site-dts-cat/site-dts-te-cat/28679-complete-streets-planning.html).
• Increase access and use of sustainable public transportation. In December 2017, the mayors of all four counties in Hawai‘i committed to transforming all public and private ground transportation to 100% renewable fuel sources by 2045. In addition, there is community interest in developing a shuttle system for visitors to the North Shore to reduce vehicle traffic and provide alternatives.
• Expand electric vehicle infrastructure. Increasing electric vehicle use is an important component of meeting emission reduction goals for the transportation sector. Hawai‘i has in recent years fallen short of electric vehicle use goals (Blue Planet Foundation, 2016). Strategies to reduce barriers to electric vehicle use include promoting public-private partnership to install more charging stations and facilitating renewable energy integration to reduce electricity prices (McKenzie, 2015 and Elkind & Ku, 2013).
• Explore opportunities for carbon capture and sequestration. In 2018, State Act 15 set a deadline of 2023 for developing a plan to meet the 2045 zero emissions target and established a Greenhouse Gas Sequestration Task Force. That same year, Act 16 passed, directing the State Office of Planning to work with the task force to create a carbon offset program. In the case of the North Shore, carbon capture and sequestration in agricultural and forested lands is particularly relevant to supporting statewide carbon sequestration goals. Soil carbon sequestration and production of biofuels on former sugar cane or grazing lands are potential opportunities for the North Shore to increase local agricultural jobs, diversify the local economy, and contribute to emissions reductions.
Climate Change and Sea Level Rise Resource Paper
North Shore Sustainable Communities Plan Update | 47
References
Anderson, T. R., Fletcher, C. H., Barbee, M. M., Romine, B. M., Lemmo, S., & Delevaux, J. M. S. 2018. Modeling multiple sea level rise stresses reveals up to twice the land at risk compared to strictly passive flooding methods. Scientific reports, 8(1), 14484. doi:10.1038/s41598-018-32658-x
Bassiouni, M., and D.S. Oki. 2013. Trends and shifts in streamflow in Hawaii, 1913-2008. Hydrological Processes 27(10):1484-1500
Blue Planet Foundation (2016) Hawai‘i Energy Report Card. Retrieved from https://blueplanetfoundation.org/energy-report-card/
Cai, W., et al. 2015a. Increasing frequency of extreme El Niño events due to greenhouse warming. Nature Climate Change 4, 111–116, doi:10.1038/nclimate2100. 39
Cai, W., et al. 2015b. Increasing frequency of extreme La Niña events induced by greenhouse warming, Nature Climate Change, 5, 132–137, doi: 10.1038/nclimate2492
California Coastal Commission. 2018. Residential Adaptation Policy Guidance: Interpretive Guidelines for Addressing Sea Level Rise in Local Coastal Programs. Draft. July. Retrieved from https://www.coastal.ca.gov/climate/slr/vulnerability-adaptation/residential/
Chu, et al. 2010. Changes in Precipitation Extremes in the Hawaii an Islands in a Warming Climate. Journal of Climate 23(18):4881–4900. doi:10.1175/2010JCLI3484.1
City and County of Honolulu, Kirk Caldwell, Mayor. 2018. Mayoral Directive No. 18-2. Available at: https://www.honolulu.gov/rep/site/dpptod/climate_docs/MAYORS_DIRECTIVE_18-2.pdf.
City and County of Honolulu. 2019. Ola Oʻahu Resilience Strategy. Available at: https://resilientoahu.org/resilience-strategy
City and County of Honolulu, Climate Change Commission. 2020a. Climate Change and Social Equity. Available at: https://resilientoahu.org/climate-change-commission/#guidance.
City and County of Honolulu, Climate Change Commission. 2020b. One Water for Climate Resiliency White Paper. Available at: https://resilientoahu.org/climate-change-commission/#guidance
City and County of Honolulu, Kirk Caldwell, Mayor. Rev. 3/7/2017. New Extreme Tsunami Evacuation Zones – Information Updates and Frequently Asked Questions. Available at: http://www.honolulu.gov/site-dem-sitearticles/35781-tsunami.html
City and County of Honolulu, Office of Climate Change, Sustainability, and Resiliency. 2020. Climate Ready Oʻahu: Risk Assessment Results. Available at: https://www.climatereadyoahu.org/
Coffman, M. and Ilan, N. 2009. A Hurricane’s Long-Term Economic Impact: the Case of Hawaii ’s Iniki. Department of Urban Planning and UHERO, University of Hawai‘i at Mānoa. Working Paper No. 09-5.
Courtney, C.A; Gelino, K; Romine, B.M.; Hintzen, K.D.; Addonizio-Bianco, C.; Owens, T.M.; Lander, M.; and Buika, J. 2019. Guidance for Disaster Recovery Preparedness in Hawai'i. Prepared by Tetra Tech, Inc. for the University of Hawai'i Sea Grant College Program and State of Hawai'i Department of Land

Climate Change and Sea Level Rise Resource Paper
North Shore Sustainable Communities Plan Update | 48
and Natural Resources and Office of Planning, with funding from National Oceanic and Atmospheric Administration Office for Coastal Management award no. NA16NOS4730016. Available at: https://seagrant.soest.hawaii.edu/resources/program-publications/
Courtney, C., Romine, B., Lander, M., Hintzen, K., Owens, T., & Pap, R. 2020. Guidance for Addressing Sea Level Rise in Community Planning in Hawai'i. Prepared by Tetra Tech, Inc. for the University of Hawai'i Sea Grant College Program and State of Hawai'i Department of Land and Natural Resources and Office of Planning. Management Award No. NA16NOS4730016. Available at: https://seagrant.soest.hawaii.edu/resources/program-publications/
Dutton, A. and Lambeck, K. 2012. Ice Volume and Sea Level During the Last Interglacial. Science Vol. 337, Issue 6091, pp. 216-219
Eakin, C.M., G. Liu, A.M. Gomez, J.L. De La Cour, S.F., Heron, W.J. Skirving, E.F. Geiger, K.V. Tirak, and A.E., Strong, 2016: Global coral bleaching 2014-2017: Status and an appeal for observations. Reef Encounter, 31 (1), 20-26
Elkind, E. N., & Ku, A. 2013. Electric Vehicle Paradise: How Hawaii Can Lead the World in Deployment (Rep.). Retrieved from http://maui.hawaii.edu/mauieva/docs/EVparadise.pdf
Fletcher, C.H., Grossman, E.E., Richmond, B.M., Gibbs, A.E. 2002. Atlas of natural hazards in the Hawaiian coastal zone. U.S. Geological Survey, Denver, CO, Geologic Investigations Series I-2761, 182p. http://geopubs.wr.usgs.gov/i-map/i2761/
Fletcher, C.H. and Jones, A.T., 1996. Sea-level highstand recorded in Holocene shoreline deposits on O‘ahu, Hawaii. Journal of Sedimentary Research, 66(3), pp. 632-641
Fletcher, C.H., Romine, B.M., Genz, A.S., Barbee, M.M., Dyer, M., Anderson, T.R., Lim, S.C., Vitousek, S., Bochicchio, C., and Richmond, B.M., 2012, National assessment of shoreline change: Historical shoreline change in the Hawaiian Islands: U.S. Geological Survey Open-File Report 2011–1051, 55 p.
Frazier, A.G., Giambelluca, T.W. 2016. Spatial trend analysis of Hawaiian rainfall from 1920 to 2012. International Journal of Climatology. Vol. 37-5
Frazier, A. G., and Giambelluca, T. W. 2017. Spatial trend analysis of Hawaiian rainfall from 1920 to 2012. Int. J. Climatol., 37(5), 2522-2531. doi: 10.1002/joc.4862
Giambelluca, T.W., Q. Chen, A.G. Frazier, J.P. Price, Y.-L. Chen, P.-S. Chu, J.K. Eischeid, and D.M. Delparte. 2013. Online Rainfall Atlas of Hawai‘i. Bull. Amer. Meteor. Soc. 94, 313-316, doi: 10.1175/BAMS-D-11-00228.1. http://rainfall.geography.hawaii.edu/
Golledge, N.R., et al. 2015. The multi-millennial Antarctic commitment to future sea-level rise, Nature, 526 (7573): 421 DOI: 10.1038/nature15706.
Giambelluca, et al. 1991. Drought in Hawaiʻi. Department of Land and Natural Resources, R88, Honolulu, Hawaiʻi
Hawaiʻi Climate Change Mitigation and Adaptation Commission. 2017. Hawaiʻi Sea Level Rise Vulnerability and Adaptation Report. Prepared by Tetra Tech, Inc. and the State of Hawaiʻi Department
Climate Change and Sea Level Rise Resource Paper
North Shore Sustainable Communities Plan Update | 49
of Land and Natural Resources, Office of Conservation and Coastal Lands, under the State of Hawaiʻi Department of Land and Natural Resources Contract No: 64064
Hawaiʻi Climate Change Mitigation and Adaptation Commission. 2021. State of Hawaiʻi Sea Level Rise Viewer. Version 1.04. Prepared by the Pacific Islands Ocean Observing System (PacIOOS) for the University of Hawaiʻi Sea Grant College Program and the State of Hawaiʻi Department of Land and Natural Resources, Office of Conservation and Coastal Lands, with funding from National Oceanic and Atmospheric Administration Office for Coastal Management Award No. NA16NOS4730016 and under the State of Hawaiʻi Department of Land and Natural Resources Contract No. 64064. http://hawaiisealevelriseviewer.org
Hawaiʻi Office of Planning, Coastal Zone Management Program. 2019. Assessing the Feasibility and Implications of Managed Retreat Strategies for Vulnerable Coastal Areas in Hawaiʻi. Prepared with support from SSFM International, Inc.
Hawaiʻi Wildfire Management Association (HWMO). 2015. Communities at Risk from Wildfires - State of Hawaiʻi Map. Available at: https://www.hawaiiwildfire.org/fire-resource-library-blog/communities-at-risk-state-map
Intergovernmental Panel on Climate Change (IPCC). 2014. Climate Change 2014: Synthesis Report. Contribution of Working Groups I, II and III to the Fifth Assessment Report of the Intergovernmental Panel on Climate Change [Core Writing Team, R.K. Pachauri and L.A. Meyer (eds.)]. IPCC, Geneva, Switzerland
Keener, V.W., et al. 2018. Chapter 27, Hawai‘i and Pacific Islands, Fourth National Climate Assessment, U.S. Global Change Research Program
Kruk, M. C., et al. 2015. On the state of the knowledge of rainfall extremes in the western and northern Pacific basin, Int. J. Climatology, 35(3), 321–336
Leong, J. A., J. J. Marra, M. L. Finucane, T. Giambelluca, M. Merrifield, S. E. Miller, J. Polovina, E., Shea, M. Burkett, J. Campbell, P. Lefale, F. Lipschultz, L. Loope, D. Spooner, and B. Wang. 2014. Ch. 23: Hawai‘i and U.S. Affiliated Pacific Islands. Climate Change Impacts in the United States: The Third National Climate Assessment, J. M. Melillo, Terese (T.C.) Richmond, and G. W. Yohe, Eds., U.S. Global Change Research Program, 537-556. doi:10.7930/J0W66HPM
Lindsey, R. 2020. Climate Change: Glacier Mass Balance. NOAA Climate.gov. https://www.climate.gov/news-features/understanding-climate/climate-change-glacier-mass-balance
Lindsey, R. and Michon, S. 2020. Climate Change: Artic Sea Ice. NOAA Climate.gov. https://www.climate.gov/news-features/understanding-climate/climate-change-minimum-arctic-sea-ice-extent
Marra, J.J., and Kruk, M.C. 2017. State of Environmental Conditions in Hawai‘i and the U.S. Affiliated Pacific Islands under a Changing Climate: https://coralreefwatch.noaa.gov/satellite/publications/state_of_the_environment_2017_hawaii-usapi_noaa-nesdis-ncei_oct2017.pdf

Climate Change and Sea Level Rise Resource Paper
North Shore Sustainable Communities Plan Update | 50
McKenzie, K. 2015. The State of Electric Vehicles In Hawaiʻi (Rep.). Retrieved from: http://evtc.fsec.ucf.edu/publications/documents/HNEI-05-15.pdf
McKenzie, M.M. 2016. Regional temperature trends in Hawaiʻi: A century of change, 1916–2015 (MS thesis). Dept. of Geog., University of Hawaiʻi at Mānoa
Merrifield, M.A., Maltrud, M.E., 2011. Regional sea level trends due to a Pacific tradewind intensification. Geophysical Research Letters 38 (21)
Mora, et al. 2013. The projected timing of climate departure from recent variability. Nature 502:183–187
Murakami, H., Wang, B., Li, T., Kitoh, Akio. 2013. Projected increase in tropical cyclones near Hawaii. Nature Climate Change. Vol 3, 749-754
Nerem, R.S., B. D., Beckley, J. T., Fasullo, B. D., Hamlington, D., Masters, and G. T. Mitchum. 2018. Climate-change–driven accelerated sea-level rise detected in the altimeter era. Proceedings of the National Academy of Science of the United States
National Oceanic and Atmospheric Administration (NOAA). 2021. Research News: Despite pandemic shutdowns, carbon dioxide and methane surged in 2020 Carbon dioxide levels are now higher than at anytime in the past 3.6 million years. https://research.noaa.gov/article/ArtMID/587/ArticleID/2742/Despite-pandemic-shutdowns-carbon-dioxide-and-methane-surged-in-2020
National Oceanic and Atmospheric Administration (NOAA). 2020. Global Climate Report - Annual 2020: 2020 year-to-date temperatures versus previous years. Available at: https://www.ncdc.noaa.gov/sotc/global/202013/supplemental/page-1
Landerer, F.W. and Jentoft-Nilsen, M. 2020. Greenland Ice Mass Loss 2002-2020. https://svs.gsfc.nasa.gov/31156.
Marzeion, B., et al. 2018. Limited influence of climate change mitigation on short-term glacier mass loss, Nature Climate Change
New York Times Weather Chart. 2016. https://www.nytimes.com/interactive/2016/02/19/us/2015-year-in-weather-temperature-precipitation.html#honolulu_hi
Oki, D.S. 2004. Trends in Streamflow Characteristics at Long-Term Gaging Stations, Hawaii . U.S. Geological Survey Scientific Investigations Report No. 2004-5080. http://pubs.usgs.gov/sir/2004/5080/
Oppenheimer, M., et al. 2019. Sea Level Rise and Implications for Low-Lying Islands, Coasts and Communities. In: IPCC Special Report on the Ocean and Cryosphere in a Changing Climate [H.-O. Pörtner, et al. (eds.)]
Pacific ENSO Applications Climate (PEAC) Center. El Nino and its Impacts on Hawaii: https://www.weather.gov/media/peac/one_pagers/El%20Nino%20Impacts%20on%20Hawaii.pdf
Pacific Islands Regional Climate Assessment (PIRCA). 2016. Expert Consensus on Downscaled Climate Projections for the Main Hawaiian Islands. PIRCA Information Sheet, HI. http://bit.ly/2yoY0Il

Climate Change and Sea Level Rise Resource Paper
North Shore Sustainable Communities Plan Update | 51
Raftery, A.E., et al. 2017. Less than 2°C warming by 2100 unlikely, Nature Climate Change, 7, 637-641, DOI: 10.1038/nclimate3352.
Robinson, A., et al. 2012. Multistability and Critical Thresholds of the Greenland Ice Sheet, Nature Climate Change, 2, 429–432
Romine, B.M.; Habel, S.; Lemmo, S.J.; Pap, R.A.; Owens, T.M.; Lander, M.; Anderson, T.R. 2020. Guidance for Using the Sea Level Rise Exposure Area in Local Planning and Permitting Decisions. Prepared by the University of Hawaii Sea Grant College Program with the Hawaiʻi Department of Land and Natural Resources - Office of Conservation and Coastal Lands for the Hawaiʻi Climate Change Mitigation and Adaptation Commission - Climate Ready Hawaiʻi Initiative. (Sea Grant Publication TT-20-01)
Schroeder, T., 1993. Climate controls. Prevailing Trade Winds, M. Sanderson, Ed., University of Hawaii Press
Smith, S.J., et al. 2015. Near-term acceleration in the rate of temperature change, Nature Climate Change, March 9, DOI: 10.1038/nclimate2552
Spirandelli, D., Pap, R., Summer, A., and Braich, E. 2020. West Kaua‘i Community Vulnerability Assessment. University of Hawai‘i Sea Grant College Program.
Sweet, W., Kopp, R., Weaver, C., Obeysekera, J., Horton, R., Thieler, E., & Zervas, C. 2017. Global and regional sea level rise scenarios for the United States (NOAA technical report NOS CO-OPS 083). Silver Spring, MD: US Department of Commerce, National Oceanic and Atmospheric Administration, National Ocean Service--Center for Operational Oceanographic Produces and Services
Tavares, K., Fletcher, C.H. & Anderson, T.R. 2020. Risk of shoreline hardening and associated beach loss peaks before mid-century: Oʻahu, Hawaiʻi. Nature Scientific Reports, 10: 13633. DOI:10.1038/s41598-020-70577-y
Thompson, P.R., Widlansky, M.J., Hamlington, B.D., Merrifield, M.A., Marra, J.J., Mitchum, G.T., Sweet, W. 2021. Rapid increases and extreme months in projections of United States high-tide flooding. Nature Climate Change 11, 584-590.
Timm, O.E., et al. 2015, Stat. downscaling of rainfall changes in HI, based on CMIP5 model proj., JGR Atmos, 120(1), 92–112, doi:10.1002/2014JD022059
Timm, O.E. 2017. Future warming rates over the Hawaiian Islands based on elevation-dependent scaling factors. International Journal of Climatology. Vol. 37, Issue S1 p. 1093-1104
Thoman, R.L., Richter-Menge, J., Druckenmiller, M.L., Eds. 2020. Arctic Report Card 2020. NOAA Arctic Program. DOI: 10.25923/mp5p-t549
University of Hawaiʻi, Social Sciences Research Institute. 2017. Coral Bleaching Recovery Plan. Prepared for the State of Hawaiʻi Department of Land and Natural Resources, Division of Aquatic Resources
McKenzie, K. 2015. The State of Electric Vehicles in Hawaiʻi (Rep.). Retrieved from: http://evtc.fsec.ucf.edu/publications/documents/HNEI-05-15.pdf
Muhs, D.R. and Szabo, B.J. 1994. New uranium-series ages of the Waimanalo Limestone, O‘ahu, Hawaiʻi: Implications for sea level during the last interglacial period. Marine Geology 118: 315-326
Climate Change and Sea Level Rise Resource Paper
North Shore Sustainable Communities Plan Update | 52
Raftery, A. E., Zimmer, A., Frierson, D. M., Startz, R., & Liu, P. 2017. Less than 2 °C warming by 2100 unlikely. Nature Climate Change, 7(9), 637-641. doi:10.1038/nclimate3352
Rohling, E., Grant, K., Hemleben, C. et al. 2008. High rates of sea-level rise during the last interglacial period. Nature Geosci Vol. 1, pp. 38–42
Sweet, W.V., R.E. Kopp, R.E. Weaver, J. Obeysekera, R.M. Horton, E.R. Thieler, and C. Zervas. 2017. Global and Regional Sea Level Rise Scenarios for the United States. Silver Spring, MD: NOAA Technical Report NOS CO-OPS 083
U.S. Department of Commerce, National Oceanic & Atmospheric Administration, National Environmental Satellite, Data, and Information Service. 1981-2010 Station Normals of Temperature, Precipitation, and Heating and Cooling Degree Days. Generated on 01/21/2021. https://www.ncdc.noaa.gov/data-access
Wuebbles, D.J., D.W. Fahey, K.A. Hibbard, B. DeAngelo, S. Doherty, K. Hayhoe, R. Horton, J.P. Kossin, P.C. Taylor, A.M. Waple, and C.P. Weaver, 2017: Executive summary. In: Climate Science Special Report: Fourth National Climate Assessment, Volume I [Wuebbles, D.J., D.W. Fahey, K.A. Hibbard, D.J. Dokken, B.C. Stewart, and T.K. Maycock (eds.)]. U.S. Global Change Research Program, Washington, DC, USA, pp. 12-34, doi: 10.7930/J0DJ5CTG
Zhang, C., et al. 2016. Dynamical downscaling of the climate for the Hawaiian Islands. Part II: Projection for the late twenty-first century, Journal of Climate 29: 8333–8354. doi:10.1175/JCLI-D-16-0038.1

Climate Change and Sea Level Rise Resource Paper
North Shore Sustainable Communities Plan Update | 53
Appendix 1: Global and Regional Climate Change and Sea Level Rise Outlook
We are experiencing the effects of climate change in Hawai‘i today in the form of increasing air and sea surface temperatures, sea level rise, and changing rainfall patterns (Keener 2018). Hawai‘i, including the North Shore, is uniquely vulnerable to impacts associated with climate change and sea level rise due to our coastal-focused society and economy and remote location in the Central Pacific.
According to the Intergovernmental Panel on Climate Change (IPCC) Fifth Assessment Report, "Warming of the climate system is unequivocal, and since the 1950s, many of the observed changes are unprecedented over decades to millennia. The atmosphere and ocean have warmed, the amounts of snow and ice have diminished, sea level has risen, and the concentrations of greenhouse gases have increased."
In June of 2018, the Honolulu Climate Change Commission provided a Climate Change Brief on local, regional, and global impacts of climate change based on peer-reviewed scientific literature and Sea Level Rise Guidance building on the findings of the 2017 State Sea Level Rise Report and other recent governmental reports and scientific literature “to provide specific policy and planning guidance on responding to sea level rise.”
Here we provide a summary of global and regional climate change and sea level rise observations and projections based on recent peer-reviewed scientific research, national and inter-national governmental reports including the IPCC AR5, U.S. National Climate Assessment, and local reports and guidance including from the Honolulu Climate Change Commission and the State Sea Level Rise Vulnerability and Adaptation Report.
Greenhouse Gas Emissions Observations Measurements from Mauna Loa Observatory on Hawaiʻi Island and from gases trapped in ice cores extracted from Greenland and Antarctica show that atmospheric concentrations of carbon dioxide, a key greenhouse gas, have increased by 50% since pre-industrial levels in 1850 and the present level of 416 ppm is the highest it has been in 3.6 million years (climate.nasa.gov; NOAA, 2021). CO2 concentrations are rising primarily due to burning of fossil fuels, including coal, oil, and natural gas, releasing carbon that plants removed from the atmosphere through photosynthesis over millions of years. Land use changes such as deforestation have also reduced ability of the biosphere to take up CO2 from the atmosphere.
According to NOAA (climate.gov), “the last time the atmospheric CO₂ amounts were this high was more than 3 million years ago, when temperature was 2°–3°C (3.6°–5.4°F) higher than during the pre-industrial era, and sea level was 15–25 meters (50–80 feet) higher than today.”
Atmospheric concentrations of other important greenhouse gases including methane, nitrous oxide, and chlorofluorocarbons have also increased over the past century. Atmospheric carbon dioxide concentrations are of particular concern because of the gas’ particularly long residence time in the atmosphere, relative to other greenhouse gases. About half of the CO2 emitted since 1850 remains in the
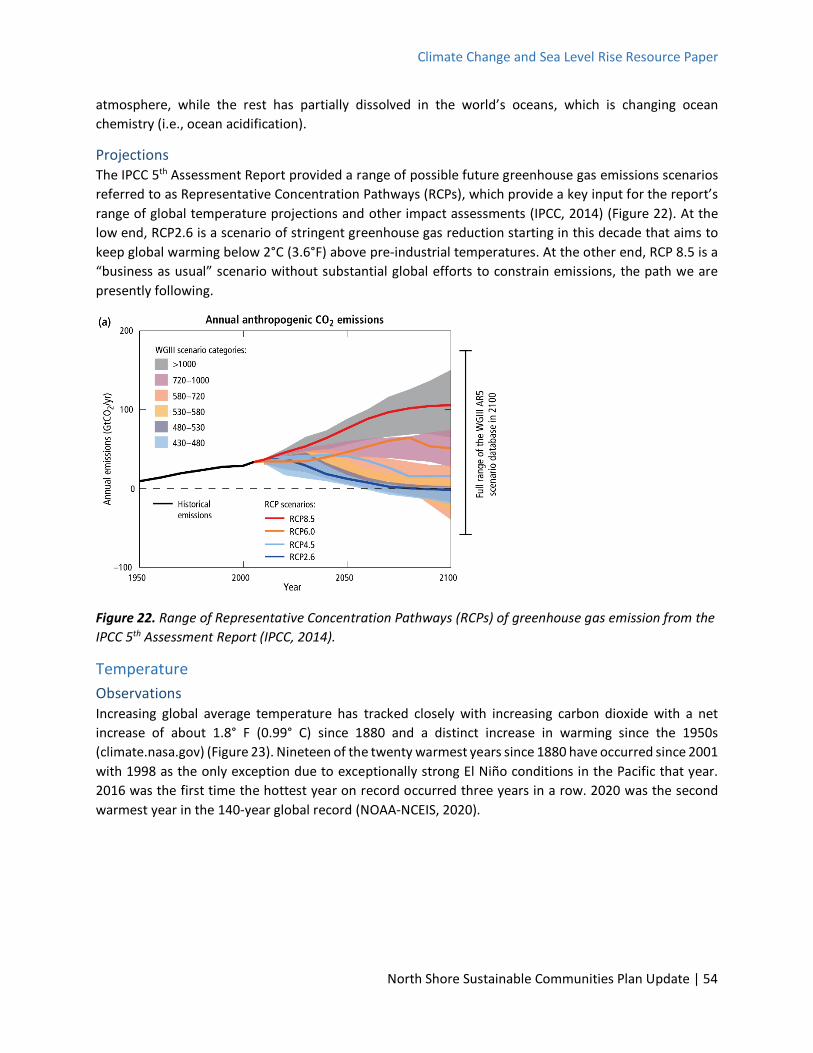
Climate Change and Sea Level Rise Resource Paper
North Shore Sustainable Communities Plan Update | 54
atmosphere, while the rest has partially dissolved in the world’s oceans, which is changing ocean chemistry (i.e., ocean acidification).
Projections The IPCC 5th Assessment Report provided a range of possible future greenhouse gas emissions scenarios referred to as Representative Concentration Pathways (RCPs), which provide a key input for the report’s range of global temperature projections and other impact assessments (IPCC, 2014) (Figure 22). At the low end, RCP2.6 is a scenario of stringent greenhouse gas reduction starting in this decade that aims to keep global warming below 2°C (3.6°F) above pre-industrial temperatures. At the other end, RCP 8.5 is a “business as usual” scenario without substantial global efforts to constrain emissions, the path we are presently following.
Figure 22. Range of Representative Concentration Pathways (RCPs) of greenhouse gas emission from the IPCC 5th Assessment Report (IPCC, 2014).
Temperature Observations Increasing global average temperature has tracked closely with increasing carbon dioxide with a net increase of about 1.8° F (0.99° C) since 1880 and a distinct increase in warming since the 1950s (climate.nasa.gov) (Figure 23). Nineteen of the twenty warmest years since 1880 have occurred since 2001 with 1998 as the only exception due to exceptionally strong El Niño conditions in the Pacific that year. 2016 was the first time the hottest year on record occurred three years in a row. 2020 was the second warmest year in the 140-year global record (NOAA-NCEIS, 2020).
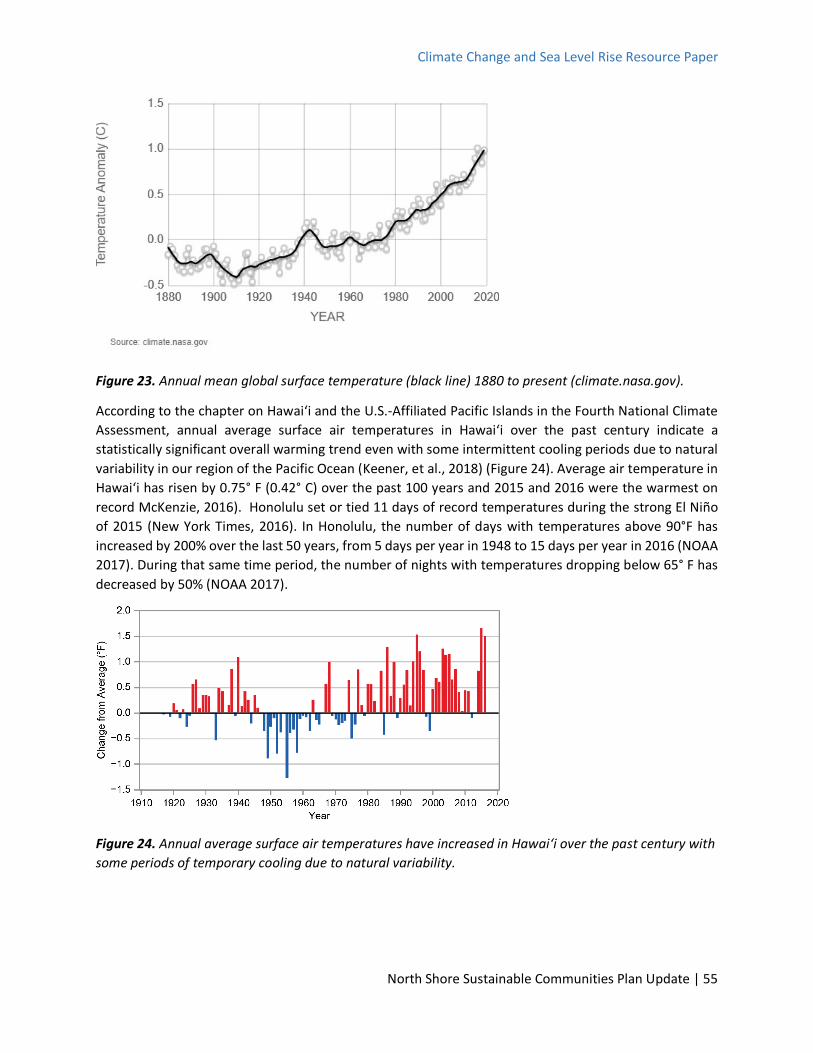
Climate Change and Sea Level Rise Resource Paper
North Shore Sustainable Communities Plan Update | 55
Figure 23. Annual mean global surface temperature (black line) 1880 to present (climate.nasa.gov).
According to the chapter on Hawaiʻi and the U.S.-Affiliated Pacific Islands in the Fourth National Climate Assessment, annual average surface air temperatures in Hawaiʻi over the past century indicate a statistically significant overall warming trend even with some intermittent cooling periods due to natural variability in our region of the Pacific Ocean (Keener, et al., 2018) (Figure 24). Average air temperature in Hawaiʻi has risen by 0.75° F (0.42° C) over the past 100 years and 2015 and 2016 were the warmest on record McKenzie, 2016). Honolulu set or tied 11 days of record temperatures during the strong El Niño of 2015 (New York Times, 2016). In Honolulu, the number of days with temperatures above 90°F has increased by 200% over the last 50 years, from 5 days per year in 1948 to 15 days per year in 2016 (NOAA 2017). During that same time period, the number of nights with temperatures dropping below 65° F has decreased by 50% (NOAA 2017).
Figure 24. Annual average surface air temperatures have increased in Hawaiʻi over the past century with some periods of temporary cooling due to natural variability.
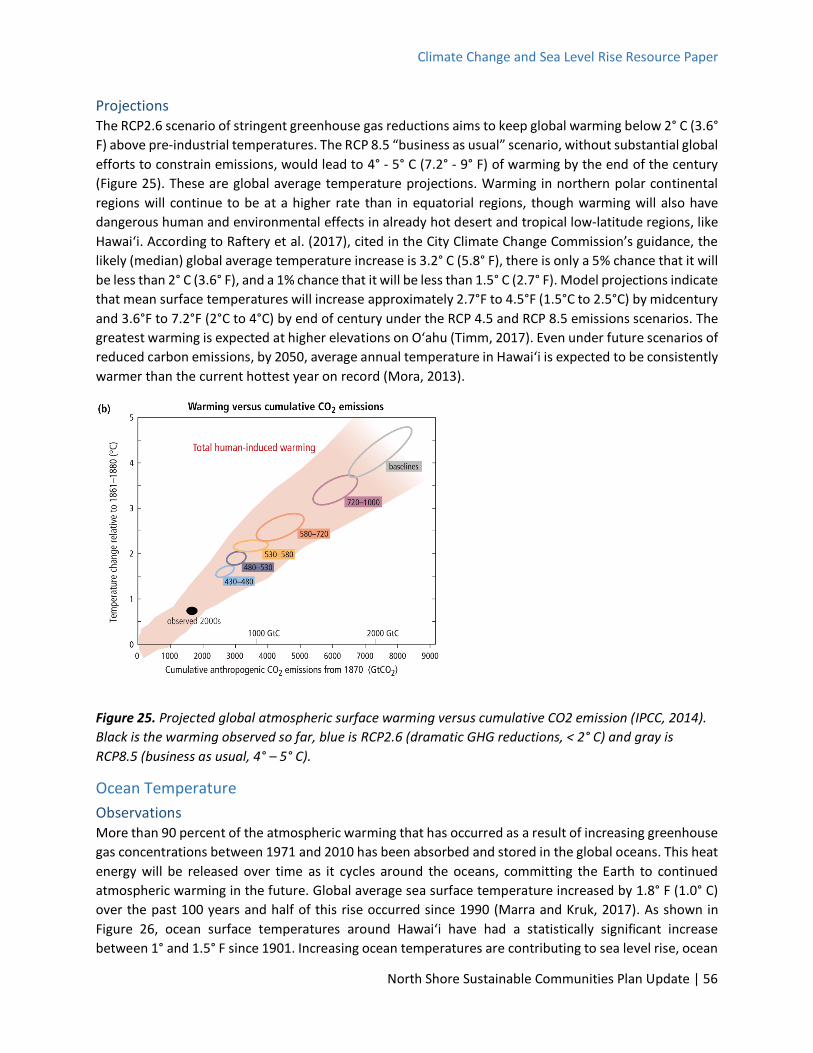
Climate Change and Sea Level Rise Resource Paper
North Shore Sustainable Communities Plan Update | 56
Projections The RCP2.6 scenario of stringent greenhouse gas reductions aims to keep global warming below 2° C (3.6° F) above pre-industrial temperatures. The RCP 8.5 “business as usual” scenario, without substantial global efforts to constrain emissions, would lead to 4° - 5° C (7.2° - 9° F) of warming by the end of the century (Figure 25). These are global average temperature projections. Warming in northern polar continental regions will continue to be at a higher rate than in equatorial regions, though warming will also have dangerous human and environmental effects in already hot desert and tropical low-latitude regions, like Hawaiʻi. According to Raftery et al. (2017), cited in the City Climate Change Commission’s guidance, the likely (median) global average temperature increase is 3.2° C (5.8° F), there is only a 5% chance that it will be less than 2° C (3.6° F), and a 1% chance that it will be less than 1.5° C (2.7° F). Model projections indicate that mean surface temperatures will increase approximately 2.7°F to 4.5°F (1.5°C to 2.5°C) by midcentury and 3.6°F to 7.2°F (2°C to 4°C) by end of century under the RCP 4.5 and RCP 8.5 emissions scenarios. The greatest warming is expected at higher elevations on Oʻahu (Timm, 2017). Even under future scenarios of reduced carbon emissions, by 2050, average annual temperature in Hawai‘i is expected to be consistently warmer than the current hottest year on record (Mora, 2013).
Figure 25. Projected global atmospheric surface warming versus cumulative CO2 emission (IPCC, 2014). Black is the warming observed so far, blue is RCP2.6 (dramatic GHG reductions, < 2° C) and gray is RCP8.5 (business as usual, 4° – 5° C).
Ocean Temperature Observations More than 90 percent of the atmospheric warming that has occurred as a result of increasing greenhouse gas concentrations between 1971 and 2010 has been absorbed and stored in the global oceans. This heat energy will be released over time as it cycles around the oceans, committing the Earth to continued atmospheric warming in the future. Global average sea surface temperature increased by 1.8° F (1.0° C) over the past 100 years and half of this rise occurred since 1990 (Marra and Kruk, 2017). As shown in Figure 26, ocean surface temperatures around Hawaiʻi have had a statistically significant increase between 1° and 1.5° F since 1901. Increasing ocean temperatures are contributing to sea level rise, ocean
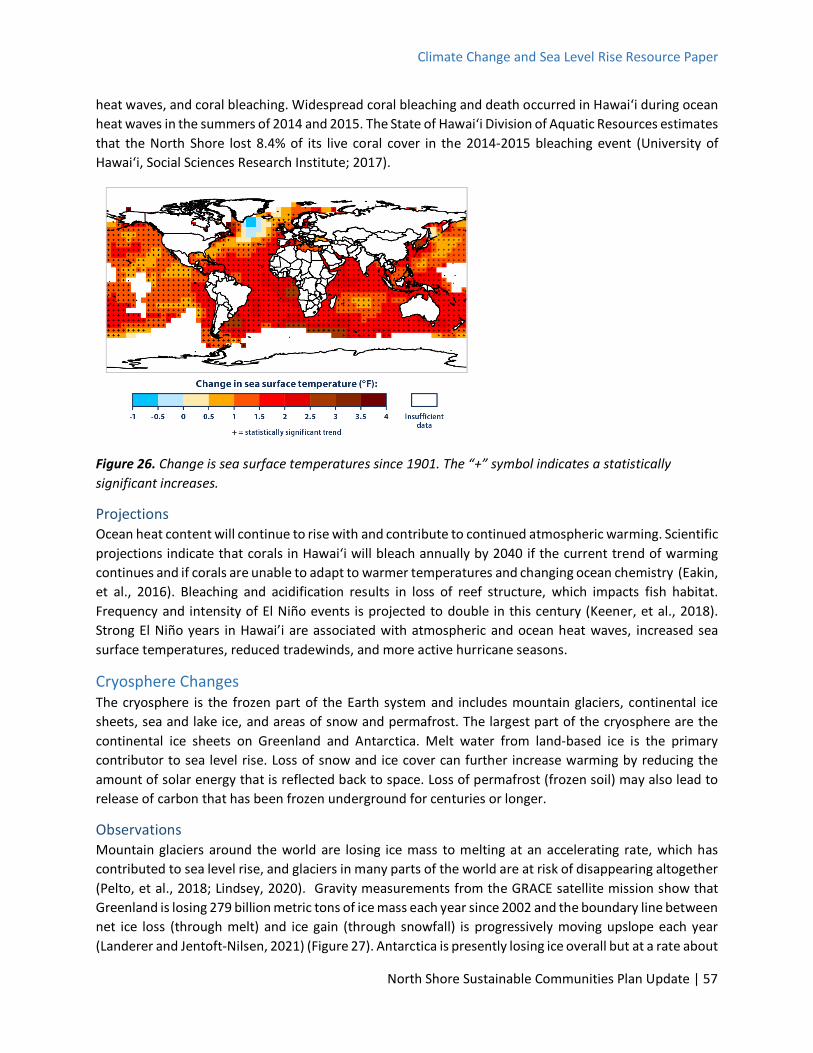
Climate Change and Sea Level Rise Resource Paper
North Shore Sustainable Communities Plan Update | 57
heat waves, and coral bleaching. Widespread coral bleaching and death occurred in Hawaiʻi during ocean heat waves in the summers of 2014 and 2015. The State of Hawaiʻi Division of Aquatic Resources estimates that the North Shore lost 8.4% of its live coral cover in the 2014-2015 bleaching event (University of Hawaiʻi, Social Sciences Research Institute; 2017).
Figure 26. Change is sea surface temperatures since 1901. The “+” symbol indicates a statistically significant increases.
Projections Ocean heat content will continue to rise with and contribute to continued atmospheric warming. Scientific projections indicate that corals in Hawaiʻi will bleach annually by 2040 if the current trend of warming continues and if corals are unable to adapt to warmer temperatures and changing ocean chemistry (Eakin, et al., 2016). Bleaching and acidification results in loss of reef structure, which impacts fish habitat. Frequency and intensity of El Niño events is projected to double in this century (Keener, et al., 2018). Strong El Niño years in Hawai’i are associated with atmospheric and ocean heat waves, increased sea surface temperatures, reduced tradewinds, and more active hurricane seasons.
Cryosphere Changes The cryosphere is the frozen part of the Earth system and includes mountain glaciers, continental ice sheets, sea and lake ice, and areas of snow and permafrost. The largest part of the cryosphere are the continental ice sheets on Greenland and Antarctica. Melt water from land-based ice is the primary contributor to sea level rise. Loss of snow and ice cover can further increase warming by reducing the amount of solar energy that is reflected back to space. Loss of permafrost (frozen soil) may also lead to release of carbon that has been frozen underground for centuries or longer.
Observations Mountain glaciers around the world are losing ice mass to melting at an accelerating rate, which has contributed to sea level rise, and glaciers in many parts of the world are at risk of disappearing altogether (Pelto, et al., 2018; Lindsey, 2020). Gravity measurements from the GRACE satellite mission show that Greenland is losing 279 billion metric tons of ice mass each year since 2002 and the boundary line between net ice loss (through melt) and ice gain (through snowfall) is progressively moving upslope each year (Landerer and Jentoft-Nilsen, 2021) (Figure 27). Antarctica is presently losing ice overall but at a rate about

Climate Change and Sea Level Rise Resource Paper
North Shore Sustainable Communities Plan Update | 58
half that of Greenland (149 billion metric tons per year) with ice loss mostly concentrated in West Antarctica. The West Antarctic ice sheet has been reported to be in “unstoppable retreat” (Joughlin, et al., 2014; Rignot, et al., 2014). Arctic sea ice extent, which does not contribute to sea level rise but is an important indicator of Arctic warming, is decreasing 13.1 percent per decade relative to the 1981-2010 average and 2020 was the second-smallest on record (Lindsey and Michon, 2020; Thoman, et al., 2020).
Figure 27. Observations of Greenland ice mass loss (melt) from the GRACE satellite mission. (NASA Hyperwall, 2021, https://svs.gsfc.nasa.gov/31156).
Projections Even the most aggressive emissions reductions will not stop further melting of mountain glaciers (Merzeion, et al., 2018). Atmospheric warming of more than 1.5° to 2° C (2.7° to 3.6° F), the target maximum temperature in IPCC RCP2.6, will still produce an unstoppable contribution to sea level rise from the Antarctic ice sheet (Golledge, et al., 2015). Recent studies estimate that the warming threshold for an ice-free Greenland is in the range of 1.4° to 5.8°F (0.8° to 3.2°C), with a best estimate of 2.9°F (1.6°C) above preindustrial levels, though this will take centuries for the melt to occur (Robinson, et al., 2012). If emissions continue unabated, the Arctic will likely double this amount of warming by mid-century (Smith, et al., 2015).
Sea Level Rise Observations Observations from tide gauges around the world and satellite-based altimetry data show that the rate of global mean sea level rise is accelerating due to expansion of warming surface ocean waters and from melting of land-based glaciers and ice caps (Figure 28). Satellite altimetry shows that global mean sea level is rising at a rate of about 3.3 mm/yr (0.13 in/yr) since 1993 with a measurable acceleration in the rates since then (Nerem et al., 2018). Global mean sea level will rise a minimum of 65 cm (2.13 feet) by 2100 if the present rate of acceleration continues. Long-term measurements of sea level from tide gauge stations show that sea level is rising around Hawai‘i, though rates vary from island to island due to varying rates of subsidence and possibly oceanic variability (Merrifield and Maltrud, 2011).
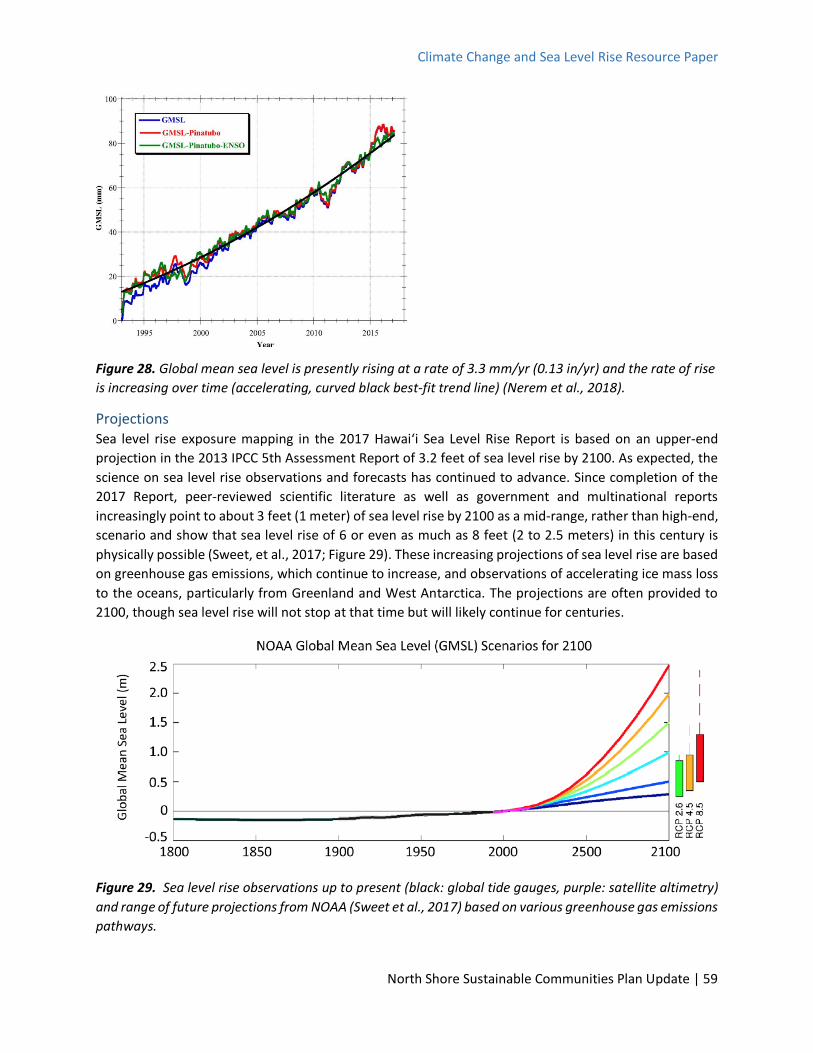
Climate Change and Sea Level Rise Resource Paper
North Shore Sustainable Communities Plan Update | 59
Figure 28. Global mean sea level is presently rising at a rate of 3.3 mm/yr (0.13 in/yr) and the rate of rise is increasing over time (accelerating, curved black best-fit trend line) (Nerem et al., 2018).
Projections Sea level rise exposure mapping in the 2017 Hawai‘i Sea Level Rise Report is based on an upper-end projection in the 2013 IPCC 5th Assessment Report of 3.2 feet of sea level rise by 2100. As expected, the science on sea level rise observations and forecasts has continued to advance. Since completion of the 2017 Report, peer-reviewed scientific literature as well as government and multinational reports increasingly point to about 3 feet (1 meter) of sea level rise by 2100 as a mid-range, rather than high-end, scenario and show that sea level rise of 6 or even as much as 8 feet (2 to 2.5 meters) in this century is physically possible (Sweet, et al., 2017; Figure 29). These increasing projections of sea level rise are based on greenhouse gas emissions, which continue to increase, and observations of accelerating ice mass loss to the oceans, particularly from Greenland and West Antarctica. The projections are often provided to 2100, though sea level rise will not stop at that time but will likely continue for centuries.
Figure 29. Sea level rise observations up to present (black: global tide gauges, purple: satellite altimetry) and range of future projections from NOAA (Sweet et al., 2017) based on various greenhouse gas emissions pathways.

Climate Change and Sea Level Rise Resource Paper
North Shore Sustainable Communities Plan Update | 60
Continued global warming is expected to increase the rate of acceleration such that by the end of the century sea level will reach or exceed about 1 m (3.2 feet) above recent mean sea level. The most recent projections of global mean sea level rise are published in the 2019 IPCC Special Report on the Ocean and Cryosphere in a Changing Climate (SROCC) (Oppenheimer et al., 2019) where it was found that:
a) In a low greenhouse gas emissions scenario, which would require dramatic reductions in emissions over the next few decades, sea level rise relative to mean sea level 1986-2005, will reach 0.43 meters (1.41 feet) with a likely range of 0.29–0.59 meters (0.95-1.94 feet) by 2100.
b) In a high greenhouse gas emissions scenario, which we are currently tracking at or above, sea level rise relative to mean sea level 1986-2005, will reach 0.84 meters (2.76 feet) with a likely range of 0.61–1.10 meters (2.00 feet-3.61 feet) by 2100.
The SROCC also projects multi-meter sea level rise by 2300:
● 0.6–1.07 meters (1.97-3.51 feet) for low emissions
● 2.3–5.4 meters (10.5-17.72 feet) for high emissions
Importantly, the SROCC acknowledges that processes controlling the timing of future ice-shelf loss and the extent of ice sheet instabilities, could increase Antarctica’s contribution to global mean sea level rise substantially higher than reported.
According to the 4th National Climate Assessment, emerging science regarding Antarctic ice sheet stability indicates that under high emission scenarios, sea level rise exceeding 8 feet (2.4 meters) by 2100 is physically possible, although the probability of such an extreme outcome cannot currently be assessed (Sweet et al., 2017). Regardless of emissions, it is extremely likely that global mean sea level rise will continue beyond 2100.
High tide flooding will impact low-lying coastal areas decades before global mean sea level rise projections are realized. High sea level records were broken repeatedly in Honolulu in 2020 and 2021. If sea level rise tracks closely with the NOAA Intermediate scenario, many locations in the United States including Hawaiʻi will experience a rapid increase in the frequency of high tide flooding events beginning in the mid-2030s due to global sea level rise coinciding with a maximum in an 18.6-year cycle in tidal amplitude, i.e., rising mean sea level combined with higher astronomical tides (Thompson, et al. 2021).
Changes in Precipitation Observations Statewide there is a trend of longer and more severe droughts (Chu 2010). Hawai‘i has also seen a decline of 20-70% in base stream flows across the State over the last century (Oki 2004; Bassiouni & Oki 2013; Giambelluca 1991). Average annual rainfall on O‘ahu has decreased by about 1% (20.4 mm or 0.8 in) per decade following the overall statewide trend of drying (Giambelluca, et al., 2013; Frazier and Giambelluca, 2017)) . Statistically significant decreases of 2% to 4% in average annual rainfall have occurred around the Northern Ko‘olau Range and North-Central O‘ahu with the most marked decreases during the typically rainy season between November and April (Figure 30). Heavy rainfall events and droughts are becoming more common in the Pacific Region and consecutive wet days and consecutive dry days are both increasing resulting in increasing runoff, erosion, flooding, and water shortages (Kruk, et al., 2015).
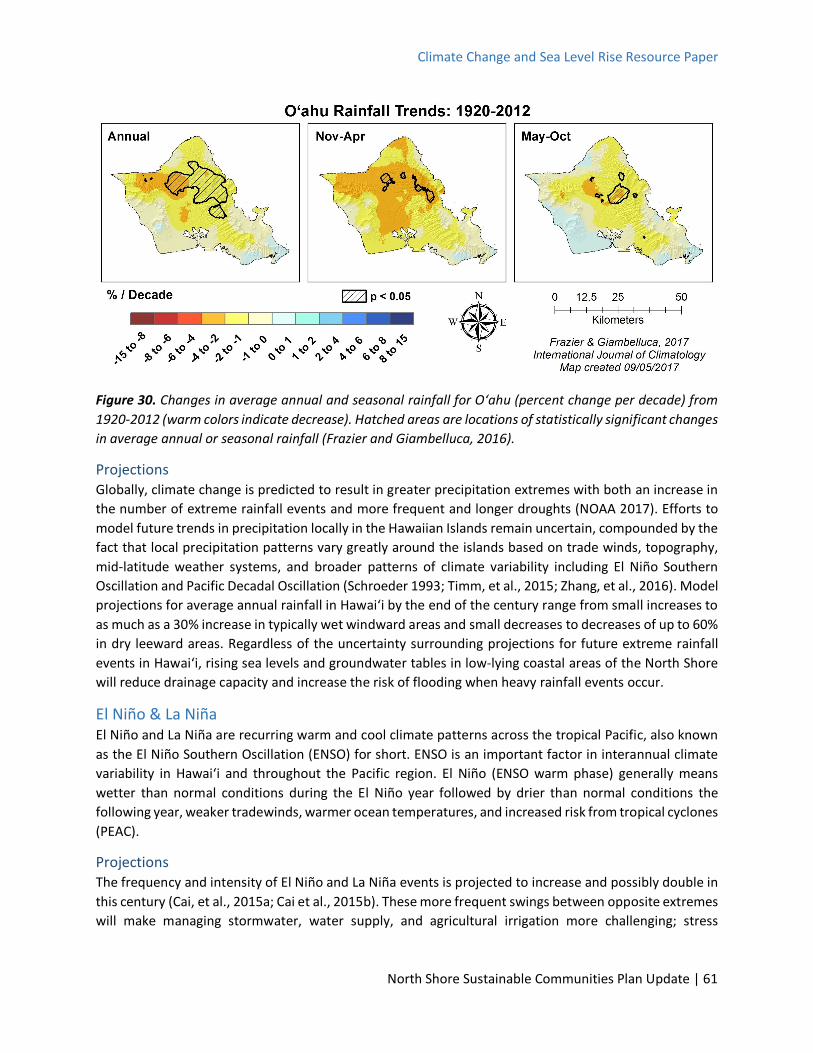
Climate Change and Sea Level Rise Resource Paper
North Shore Sustainable Communities Plan Update | 61
Figure 30. Changes in average annual and seasonal rainfall for Oʻahu (percent change per decade) from 1920-2012 (warm colors indicate decrease). Hatched areas are locations of statistically significant changes in average annual or seasonal rainfall (Frazier and Giambelluca, 2016).
Projections Globally, climate change is predicted to result in greater precipitation extremes with both an increase in the number of extreme rainfall events and more frequent and longer droughts (NOAA 2017). Efforts to model future trends in precipitation locally in the Hawaiian Islands remain uncertain, compounded by the fact that local precipitation patterns vary greatly around the islands based on trade winds, topography, mid-latitude weather systems, and broader patterns of climate variability including El Niño Southern Oscillation and Pacific Decadal Oscillation (Schroeder 1993; Timm, et al., 2015; Zhang, et al., 2016). Model projections for average annual rainfall in Hawaiʻi by the end of the century range from small increases to as much as a 30% increase in typically wet windward areas and small decreases to decreases of up to 60% in dry leeward areas. Regardless of the uncertainty surrounding projections for future extreme rainfall events in Hawai‘i, rising sea levels and groundwater tables in low-lying coastal areas of the North Shore will reduce drainage capacity and increase the risk of flooding when heavy rainfall events occur.
El Niño & La Niña El Niño and La Niña are recurring warm and cool climate patterns across the tropical Pacific, also known as the El Niño Southern Oscillation (ENSO) for short. ENSO is an important factor in interannual climate variability in Hawaiʻi and throughout the Pacific region. El Niño (ENSO warm phase) generally means wetter than normal conditions during the El Niño year followed by drier than normal conditions the following year, weaker tradewinds, warmer ocean temperatures, and increased risk from tropical cyclones (PEAC).
Projections The frequency and intensity of El Niño and La Niña events is projected to increase and possibly double in this century (Cai, et al., 2015a; Cai et al., 2015b). These more frequent swings between opposite extremes will make managing stormwater, water supply, and agricultural irrigation more challenging; stress

Climate Change and Sea Level Rise Resource Paper
North Shore Sustainable Communities Plan Update | 62
terrestrial and marine ecosystems; and increase wildfire risk as fuel loads (e.g., nonnative grasslands) experience heavy growth during rainy periods and drying during following drought periods.
Increased Risk from Tropical Cyclones Observations Tropical cyclones are relatively rare in Hawai‘i. Only eight named storms directly impacted the Hawaiian Islands between 1979 and 2010 (Murakami et al., 2013). However, the State’s isolation and heavy dependence on imports makes it extremely vulnerable to the impacts of tropical cyclones. The long-term economic impact of Hurricane Iniki, the largest hurricane on record to hit the Hawaiian Islands, provides a stark demonstration of this vulnerability. Hurricane Iniki made landfall on Kaua‘i in 1992. In the aftermath of the storm it took seven years for per capita income on the island to rebound to pre-hurricane levels and even longer to achieve full population and labor force recovery (Coffman & Noy, 2009).
Projections Globally, climate change is expected to result in more intense tropical cyclones (Leong et al. 2014). Modeling of tropical cyclones in the broader Pacific Ocean has predicted a northward shift in storm tracks that would result in tropical cyclones reaching the Hawaiian Islands more frequently (Murakami et al. 2013). The impact of more frequent and intense tropical cyclones in the Hawaiian Islands would be further magnified by sea level rise contributing to more damaging storm surge.

Climate Change and Sea Level Rise Resource Paper
North Shore Sustainable Communities Plan Update | 63
Appendix 2: Relevant City and State Initiatives and Policies
Hawai‘i State Planning Act, Climate Change Adaptation Priority Guidelines: In 2012, the Hawai‘i State Planning Act was amended to include priority guidelines to address the impacts of climate change (State Act 286, 2012). State and county planners are required to ensure that the Guidelines are considered in developing and updating all plans.
Hawai‘i Climate Change Mitigation & Adaptation Initiatives (State Act 83, 2014 and replaced by Act 32, 2017): Hawai‘i was the first state to pass legislation implementing parts of the Paris Agreement. Act 32 renamed the Interagency Climate Adaptation Committee the “Hawai‘i Climate Change Mitigation and Adaptation Commission” (State Climate Change Commission). The State Climate Change Commission provides direction, facilitation, coordination, and planning among State and county agencies, federal agencies, and other partners on climate change.
Mayoral Directive No. 18-2: City and County of Honolulu Actions to Address Climate Change and Sea Level Rise: Issued on July 16, 2018 this directive requires all City departments and agencies under the mayor’s jurisdiction to use the most current versions of the Honolulu Climate Change Commission’s Sea Level Rise Guidance and the State Sea Level Rise Report in their planning, programing, and capital improvement decisions to mitigate impacts to infrastructure and critical facilities subject to sea level rise. City departments and agencies are also called to work cooperatively to develop and implement land use policies, hazard mitigation actions, and design and construction standards that mitigate and adapt to the impacts of climate change and sea level rise.
City and County of Honolulu Climate Change Commission Guidance: The Honolulu Climate Change Commission is charged with gathering the latest science and information on climate change impacts to Hawai‘i and providing advice and recommendations to the mayor, City Council, and executive departments as they look to draft policy and engage in planning for future climate scenarios and reducing Honolulu’s contribution to global greenhouse gas emissions. The data and recommendations included in this technical resource paper draw heavily from the recommendations and communications issued by the Honolulu Climate Change Commission including the Sea Level Rise Guidance and Climate Change Brief adopted on June 5, 2018.
Honolulu Resilience Strategy: The City and County of Honolulu's Office of Climate Change, Sustainability and Resiliency (OCCSR) was established by City Charter in 2016. The OCCSR is mandated to seek information on the potential impacts of climate change on city facilities and coordinate across city departments in developing actions and policies to address climate change. The Executive Director of the Office of Climate Change, Sustainability, and Resiliency led the development of the Resilience Strategy as part of Honolulu’s membership in the 100 Resilient Cities network.
Climate Ready Oʻahu, Climate Adaptation Strategy (CAS): The CAS, being led by OCCSR through the Climate Ready Oʻahu initiative, includes an island-wide risk assessment that incorporates the needs and values of Oʻahu and its residents and evaluates potential climate impacts on important infrastructure, public assets, and populations. The resource is intended to help inform updates, implementation, and cross-coordination of community plans, departmental functional plans, and a multi-hazard pre-disaster mitigation plan and will include recommendations for integrating climate risks into decision making and adaptation strategies for City departments to implement.
Climate Change and Sea Level Rise Resource Paper
North Shore Sustainable Communities Plan Update | 64
Oʻahu General Plan (Proposed Revised Plan, 2017): Revisions to the Oʻahu General Plan were transmitted to the City Council in April 2018. Assuming the revised plan is adopted, there are many policies in the updated plan that support climate change and sea level rise adaptation; including evaluating impacts of sea level rise on public infrastructure, preparing for the anticipated impacts of sea level rise on communities and facilities; encouraging, siting and design solutions to reduce risks to natural hazards with climate change and sea level rise, and integrating climate change adaptation into the planning, design, and construction of all significant improvements to and development of the built environment.
State of Hawai‘i Hazard Mitigation Plan: The 2018 update of the State Hazard Mitigation Plan includes an expanded risk assessment incorporating the latest science and projections on climate change and sea level rise from the State Sea Level Rise Report and elsewhere. The plan included mapping and assessment of potential impacts of a 1%-annual-chance coastal flood zone with 3.2 feet of sea level rise for comparison with existing FEMA special flood hazard areas in the coastal zone. The map layer was added to the Hawai‘i Sea Level Rise Viewer and State GIS program websites in 2021.
Multi-Hazard Pre-Disaster Mitigation Plan for the City & County of Honolulu: The 2020 update of the City’s hazard mitigation plan identifies and profiles hazard events that have the potential to cause fatalities, injuries, property damage, damage to the environment, interruption of business, and other types of losses. Hazards assessed in the plan include but are not limited to climate change effects, coastal erosion, tropical cyclones, droughts, and wildfires. Priority actions include incorporating climate change risks in critical facilities and infrastructure, establishing more stringent shoreline construction setbacks and Special Management Area permit requirements accounting for climate change and sea level rise, and producing regulatory coastal flooding maps (100-year and 500-year) that account for future climate effects on storm intensities and sea level rise and requiring 500-year flood elevations in design of critical and essential facilities.
Hawaiʻi Coastal Zone Management Act: Recent updates to the State Coastal Zone Management Act (CZMA, Hawaiʻi Revised Statutes (HRS) 205A) through Act 16 (SLH 2020) provide increased statutory support for integrating sea level rise considerations in planning and permit review. The updates to the CZMA include recognition that coastal hazards are increasing with sea level rise, strengthened prohibitions against coastal armoring, increased scrutiny for shorefront development exposed to coastal hazards, and strengthened protections for beaches and other coastal environments.
Climate Change and Sea Level Rise Considerations in Environmental Assessments: State administrative rules for environmental assessments (Hawaiʻi Administrative Rules (HAR) 11-200.1 under Hawaiʻi Revised Statutes (HRS) 343) were updated through State Act 17, SLH 2018, which directed the State Environmental Council to adopt rules requiring all environmental assessments and environmental impact statements to include consideration of climate change and sea level rise.
Shoreline Certification and Public/Private Coastal Land Ownership: In a December 11, 2017 memorandum to the Chairperson of the Board of Land and Natural Resources, the State of Hawai‘i Attorney General affirmed the Board’s and the DLNR’s interpretation that “The State owns all lands makai of the upper reaches of the wash of the waves, usually evidenced by the edge of vegetation or by the line of debris left by the wash of the waves”, “This line (the shoreline) is identical -- and indeed defines -- the dividing line between public and private property (the ownership line)” and “if the shoreline moves landward, then the ownership line also moves mauka” (Attorney General Op. No. 17-1). This opinion provides some legal clarification to a growing problem: that the “shoreline,” which serve as the principal
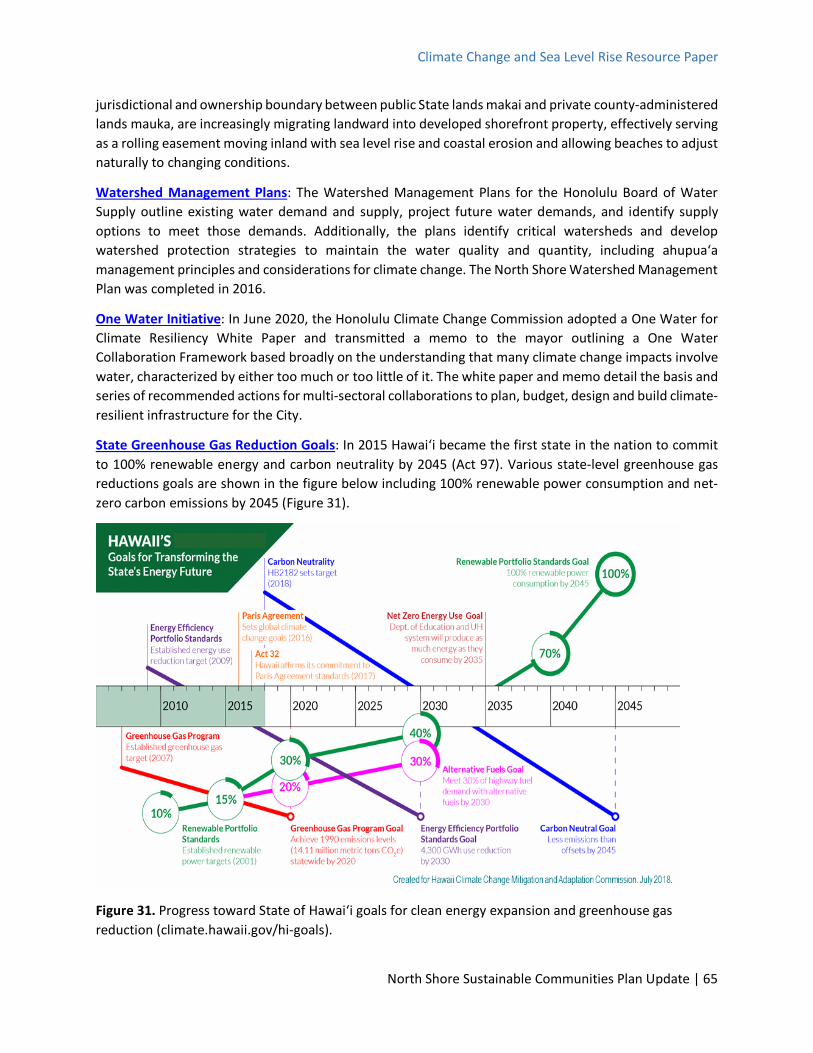
Climate Change and Sea Level Rise Resource Paper
North Shore Sustainable Communities Plan Update | 65
jurisdictional and ownership boundary between public State lands makai and private county-administered lands mauka, are increasingly migrating landward into developed shorefront property, effectively serving as a rolling easement moving inland with sea level rise and coastal erosion and allowing beaches to adjust naturally to changing conditions.
Watershed Management Plans: The Watershed Management Plans for the Honolulu Board of Water Supply outline existing water demand and supply, project future water demands, and identify supply options to meet those demands. Additionally, the plans identify critical watersheds and develop watershed protection strategies to maintain the water quality and quantity, including ahupuaʻa management principles and considerations for climate change. The North Shore Watershed Management Plan was completed in 2016.
One Water Initiative: In June 2020, the Honolulu Climate Change Commission adopted a One Water for Climate Resiliency White Paper and transmitted a memo to the mayor outlining a One Water Collaboration Framework based broadly on the understanding that many climate change impacts involve water, characterized by either too much or too little of it. The white paper and memo detail the basis and series of recommended actions for multi-sectoral collaborations to plan, budget, design and build climate-resilient infrastructure for the City.
State Greenhouse Gas Reduction Goals: In 2015 Hawai‘i became the first state in the nation to commit to 100% renewable energy and carbon neutrality by 2045 (Act 97). Various state-level greenhouse gas reductions goals are shown in the figure below including 100% renewable power consumption and net-zero carbon emissions by 2045 (Figure 31).
Figure 31. Progress toward State of Hawaiʻi goals for clean energy expansion and greenhouse gas reduction (climate.hawaii.gov/hi-goals).
Climate Change and Sea Level Rise Resource Paper
North Shore Sustainable Communities Plan Update | 66
One Climate One Oʻahu - City & County of Honolulu Climate Action Plan 2020-2025: The Climate Action Plan (CAP) lays out the City’s pathway to carbon neutrality (zero net Greenhouse gas emissions) by 2045 as required by City Ordinance 20-47. The CAP development included input through island-wide surveys, 11 community meetings, and 11 City departments. The plan presents 9 climate strategies, which should be cross-cutting considerations in the NSSCP:
1. Encourage density and mixed land use in strategic areas 2. Enable and provide multiple modes of green transportation 3. Encourage mode shift through parking efficiency 4. Electrify the city fleet and support high efficiency vehicles 5. Reduce energy demand by increasing energy efficiency 6. Maximize energy efficiency and renewable energy throughout city operations and assets 7. Expand renewable energy planning and expedite permitting 8. Promote waste prevention 9. Maximize waste resource efficiency
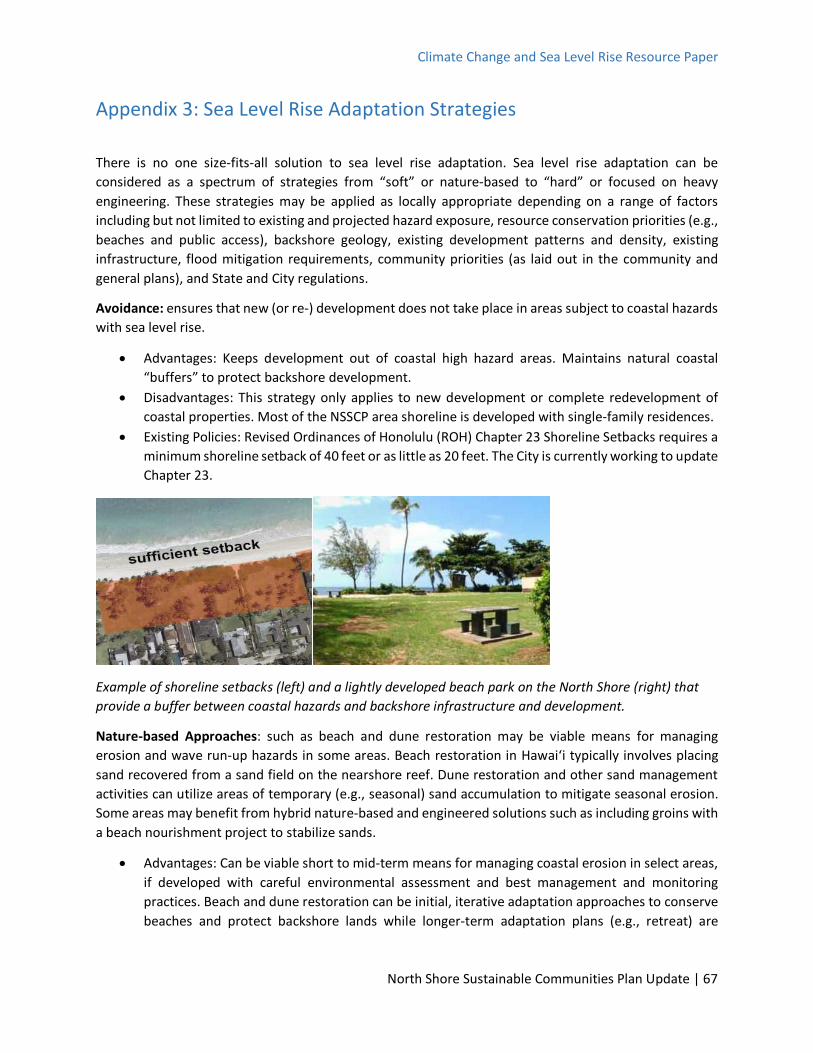
Climate Change and Sea Level Rise Resource Paper
North Shore Sustainable Communities Plan Update | 67
Appendix 3: Sea Level Rise Adaptation Strategies
There is no one size-fits-all solution to sea level rise adaptation. Sea level rise adaptation can be considered as a spectrum of strategies from “soft” or nature-based to “hard” or focused on heavy engineering. These strategies may be applied as locally appropriate depending on a range of factors including but not limited to existing and projected hazard exposure, resource conservation priorities (e.g., beaches and public access), backshore geology, existing development patterns and density, existing infrastructure, flood mitigation requirements, community priorities (as laid out in the community and general plans), and State and City regulations.
Avoidance: ensures that new (or re-) development does not take place in areas subject to coastal hazards with sea level rise.
• Advantages: Keeps development out of coastal high hazard areas. Maintains natural coastal “buffers” to protect backshore development.
• Disadvantages: This strategy only applies to new development or complete redevelopment of coastal properties. Most of the NSSCP area shoreline is developed with single-family residences.
• Existing Policies: Revised Ordinances of Honolulu (ROH) Chapter 23 Shoreline Setbacks requires a minimum shoreline setback of 40 feet or as little as 20 feet. The City is currently working to update Chapter 23.
Example of shoreline setbacks (left) and a lightly developed beach park on the North Shore (right) that provide a buffer between coastal hazards and backshore infrastructure and development.
Nature-based Approaches: such as beach and dune restoration may be viable means for managing erosion and wave run-up hazards in some areas. Beach restoration in Hawaiʻi typically involves placing sand recovered from a sand field on the nearshore reef. Dune restoration and other sand management activities can utilize areas of temporary (e.g., seasonal) sand accumulation to mitigate seasonal erosion. Some areas may benefit from hybrid nature-based and engineered solutions such as including groins with a beach nourishment project to stabilize sands.
• Advantages: Can be viable short to mid-term means for managing coastal erosion in select areas, if developed with careful environmental assessment and best management and monitoring practices. Beach and dune restoration can be initial, iterative adaptation approaches to conserve beaches and protect backshore lands while longer-term adaptation plans (e.g., retreat) are

Climate Change and Sea Level Rise Resource Paper
North Shore Sustainable Communities Plan Update | 68
developed. These are particularly well-suited for public park areas and right-of-ways that get high foot traffic erosion.
• Disadvantages: Beach and dune restoration is only viable in select areas with a suitable sand source to match the existing beach (usually sands recovered from the near-offshore area) and where coastal processes and marine environmental conditions make it logistically, environmentally, and economically feasible (may not be possible in most of the NSSCP area’s high wave environment).
• Existing Programs and Policies: The Hawaii Department of Land and Natural Resources has a Small-Scale Beach Restoration (SSBR) permitting program to facilitate permitting of nature-based beach and dune restoration projects.
Example of sand pushing to mitigate seasonal erosion at Sunset Beach.
Accommodation: requiring that structures be built or retrofit to be more resilient to coastal flooding, such as elevating structures on post and pier and flood-proofing utilities, also known as “adapting in-place.”
• Advantages: Adaptation in-place may be effective for development that is exposed to infrequent coastal and/or rainfall flooding.
• Disadvantages: Not an effective long-term approach in areas exposed to coastal erosion or recurring high wave flooding as structures will eventually encroach into public beach areas as the shoreline rolls back landward, resulting in negative impacts to coastal environments and public shoreline access.
• Existing Programs and Policies: Flood mitigation requirements are administered through the City Department of Planning and Permitting pursuant to ROH Chapter 21 Flood Hazard Areas. The City Multi-Hazard Pre-Disaster Mitigation Plan calls for producing regulatory coastal flooding maps (100-year and 500-year) that account for future climate effects on storm intensities and sea level rise and requiring 500-year flood elevations in design of critical and essential facilities.
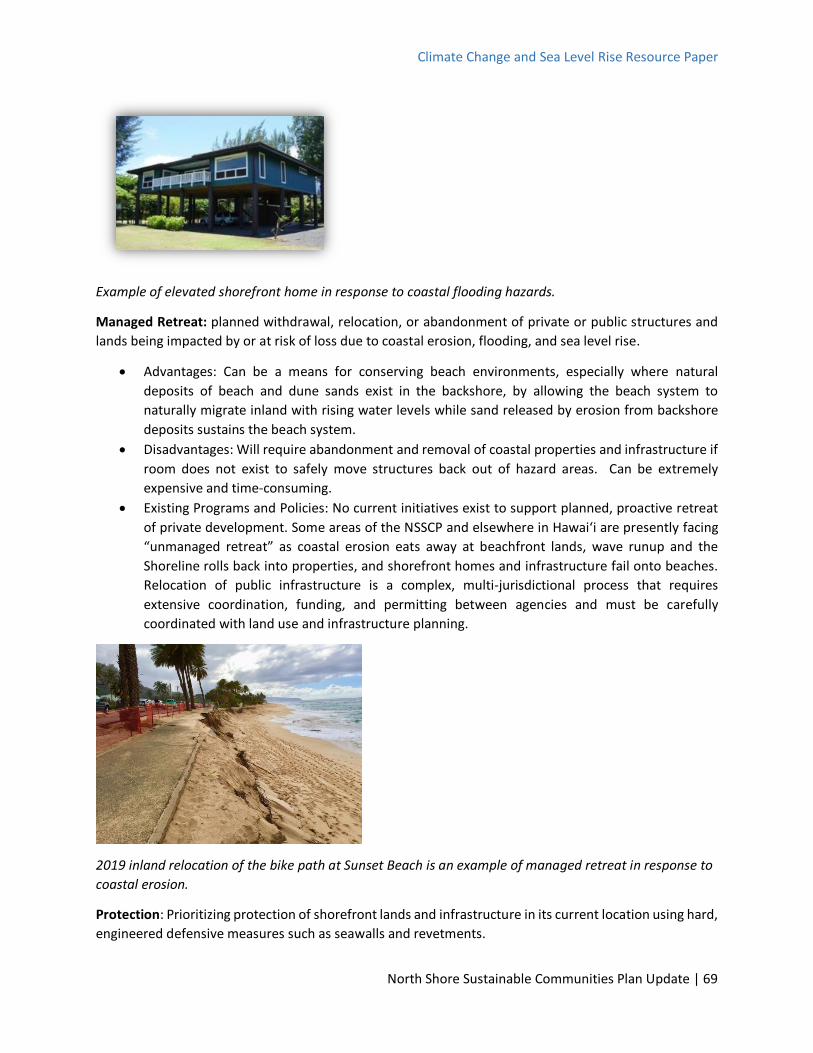
Climate Change and Sea Level Rise Resource Paper
North Shore Sustainable Communities Plan Update | 69
Example of elevated shorefront home in response to coastal flooding hazards.
Managed Retreat: planned withdrawal, relocation, or abandonment of private or public structures and lands being impacted by or at risk of loss due to coastal erosion, flooding, and sea level rise.
• Advantages: Can be a means for conserving beach environments, especially where natural deposits of beach and dune sands exist in the backshore, by allowing the beach system to naturally migrate inland with rising water levels while sand released by erosion from backshore deposits sustains the beach system.
• Disadvantages: Will require abandonment and removal of coastal properties and infrastructure if room does not exist to safely move structures back out of hazard areas. Can be extremely expensive and time-consuming.
• Existing Programs and Policies: No current initiatives exist to support planned, proactive retreat of private development. Some areas of the NSSCP and elsewhere in Hawaiʻi are presently facing “unmanaged retreat” as coastal erosion eats away at beachfront lands, wave runup and the Shoreline rolls back into properties, and shorefront homes and infrastructure fail onto beaches. Relocation of public infrastructure is a complex, multi-jurisdictional process that requires extensive coordination, funding, and permitting between agencies and must be carefully coordinated with land use and infrastructure planning.
2019 inland relocation of the bike path at Sunset Beach is an example of managed retreat in response to coastal erosion.
Protection: Prioritizing protection of shorefront lands and infrastructure in its current location using hard, engineered defensive measures such as seawalls and revetments.

Climate Change and Sea Level Rise Resource Paper
North Shore Sustainable Communities Plan Update | 70
• Benefits: Intended to protect backshore development such as critical public infrastructure and facilities from erosion and wave overwash.
• Drawbacks: Has been widely demonstrated to lead to beach loss and ecosystem damage when installed on eroding beaches. Can also lead to loss of rocky intertidal environments as these environments are submerged and “squeezed” between the structure and rising water levels. Failure of older seawalls has also been widespread in Hawaiʻi as structures are undermined by wave action. Will not protect low-lying lands against flooding from groundwater rise.
• Existing Programs and Policies: The Hawaii Coastal Zone Management Act (HRS 205A) prohibits shoreline armoring, particularly fronting private properties fronted by beaches.
Permanent beach loss front seawalls at Mokulēʻia (left) and seasonal beach loss fronting seawalls at Sunset Beach (Kammieland, right).
Adaptation Pathways and Triggers
Adaptation pathways is an emerging concept for sea level rise adaptation that considers the challenges of uncertain timing and severity of sea level rise and associated impacts and provides a framework for sequencing adaptation measures based on observable events that will “trigger” an adaptation management response. Triggers in this case are observed impacts beyond one or more pre-identified thresholds such as average sea level, extent or severity of flooding or erosion, frequency of damage, financial harm, or recurrence of storm events. The first step in an adaptation pathway might include strategies to minimize present risk, such as a shoreline setback policy based on historical rates of shoreline erosion. Exceeding an initial threshold would trigger the next phase of adaptation such as managed relocation plans for the most vulnerable development and infrastructure.
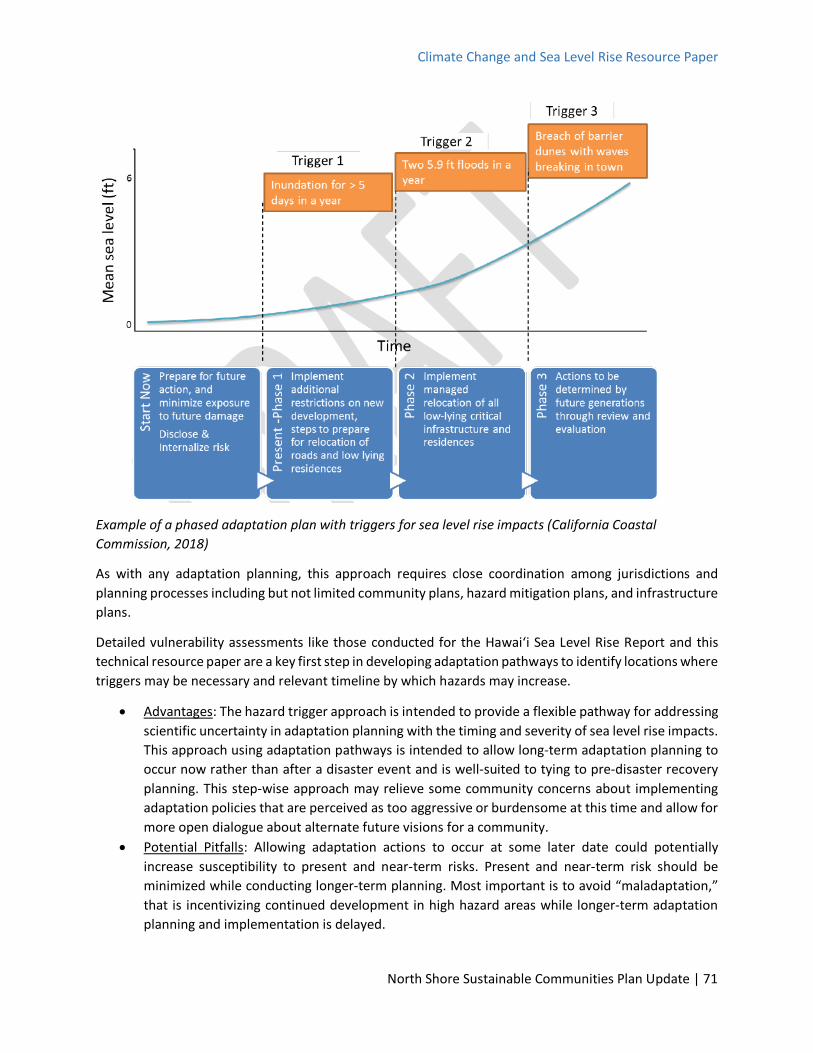
Climate Change and Sea Level Rise Resource Paper
North Shore Sustainable Communities Plan Update | 71
Example of a phased adaptation plan with triggers for sea level rise impacts (California Coastal Commission, 2018)
As with any adaptation planning, this approach requires close coordination among jurisdictions and planning processes including but not limited community plans, hazard mitigation plans, and infrastructure plans.
Detailed vulnerability assessments like those conducted for the Hawaiʻi Sea Level Rise Report and this technical resource paper are a key first step in developing adaptation pathways to identify locations where triggers may be necessary and relevant timeline by which hazards may increase.
• Advantages: The hazard trigger approach is intended to provide a flexible pathway for addressing scientific uncertainty in adaptation planning with the timing and severity of sea level rise impacts. This approach using adaptation pathways is intended to allow long-term adaptation planning to occur now rather than after a disaster event and is well-suited to tying to pre-disaster recovery planning. This step-wise approach may relieve some community concerns about implementing adaptation policies that are perceived as too aggressive or burdensome at this time and allow for more open dialogue about alternate future visions for a community.
• Potential Pitfalls: Allowing adaptation actions to occur at some later date could potentially increase susceptibility to present and near-term risks. Present and near-term risk should be minimized while conducting longer-term planning. Most important is to avoid “maladaptation,” that is incentivizing continued development in high hazard areas while longer-term adaptation planning and implementation is delayed.
Climate Change and Sea Level Rise Resource Paper
North Shore Sustainable Communities Plan Update | 72
• Existing High-hazard Areas: Hazard triggers probably have been reached for portions of the North Shore and other coastal areas in Hawaiʻi that are presently experiencing severe coastal erosion and recurring flooding. Management responses are needed now for these areas, which can serve as demonstration or pilot adaptation sites for transferring adaptation mechanisms and lessons-learned to other vulnerable areas.

Climate Change and Sea Level Rise Resource Paper
North Shore Sustainable Communities Plan Update | 73
Appendix 4: Other Key Resources and Tools In addition to the State Sea Level Rise Report and Viewer, the following resources may be helpful in assessing sea level rise vulnerabilities and developing adaptation actions and policies:
● Guidance for Addressing Sea Level Rise in Community Planning: This project led by Hawaiʻi Sea Grant worked with State and county government to produce a guidance document and conduct outreach to address sea level rise and coastal hazards in the county general and community planning process. https://seagrant.soest.hawaii.edu/resources/program-publications
● Guidance for Using the Sea Level Rise Exposure Area in Local Planning and Permitting Decisions: This report developed by Hawaiʻi Sea Grant and the DLNR Office of Conservation and Coastal Lands is a supplement to the 2017 State Sea Level Rise Report and Hawaiʻi Sea Level Rise Viewer to assist State and county planners, natural resource and infrastructure managers, and others with understanding and using the Sea Level Rise Exposure Area (SLR-XA) from the Report and Viewer in day to day planning and permitting decisions, particularly at the project or property-level scale, while understanding the methods, assumptions, and limitations of the data. http://climate.hawaii.gov/hi-adaptation/
● Guidance for Disaster Recovery Preparedness in Hawaiʻi: This project led by Hawaiʻi Sea Grant worked with State and county government to establish resilience-focused recovery practices before a disaster hits to enable communities to recover quickly while also adapting to sea level rise and protecting sensitive coastal environments through recommended preparedness activities and model planning and policy resources. https://seagrant.soest.hawaii.edu/resources/program-publications
● Assessing the Feasibility and Implications of Managed Retreat Strategies for Vulnerable Coastal Areas in Hawai‘i: This report by The State Office of Planning Coastal Zone Management Program makes findings regarding retreat programs and their relative significance to Hawai‘i and a specific multi-prong recommendation regarding the feasibility of retreat in Hawai‘i. https://planning.hawaii.gov/czm/ormp/ormp-action-team-project-on-the-feasibility-of-managed-retreat-for-hawaii/
● Hawaiʻi 2018 Hazard Mitigation Plan: The 2018 update of the State’s Hazard Mitigation Plan includes expanded consideration of climate change and sea level rise hazards, including hazard assessment using the SLR-XA and a 1% Annual-Chance Coastal Flood Zone with 3.2 feet of sea level rise (1%CFZ-3.2) modeled for the Plan. https://dod.hawaii.gov/hiema/sert-resources/hazard-mitigation/
● NOAA Coastal Flood Exposure Mapper: An online visualization tool that supports communities that are assessing their coastal hazard risks and vulnerabilities. The tool depicts community-level impacts from passive sea level rise flooding, up to 10 feet above average high tides. This tool is helpful for initial consideration of vulnerabilities beyond 3.2 feet of sea level rise (e.g., 6 feet for critical infrastructure), particularly for low-lying backshore areas. The sea level rise map layers in the NOAA tool depict passive flooding only and do not consider wave runup or coastal erosion as in the Hawai‘i Sea Level Rise Viewer and, therefore, may significantly underestimate sea level rise hazards on wave-exposed shorelines. https://coast.noaa.gov/digitalcoast/tools/flood-exposure.html