Chesapeake Investor Presentation for the Howard Weil Annual Energy Conference
Scotia Howard Weil 46th Annual Energy Conference
March 26, 2018
www.icdrilling.com
Preliminary MattersVarious statements contained in this presentation, including those that express a belief, expectation or intention, as well as those that are not statements of historical fact, are forward-looking statements. These forward-
looking statements may include projections and estimates concerning the timing and success of specific projects and our future revenues, income and capital spending. Our forward-looking statements are generally
accompanied by words such as “estimate,” “project,” “predict,” “believe,” “expect,” “anticipate,” “potential,” “plan,” “goal,” “will” or other words that convey the uncertainty of future events or outcomes. The
forward-looking statements in this presentation speak only as of the date of this presentation; we disclaim any obligation to update these statements unless required by law, and we caution you not to rely on them
unduly. We have based these forward-looking statements on our current expectations and assumptions about future events. While our management considers these expectations and assumptions to be reasonable,
they are inherently subject to significant business, economic, competitive, regulatory and other risks, contingencies and uncertainties, most of which are difficult to predict and many of which are beyond our control.
These and other important factors, including those discussed under “Risk Factors” and “Management’s Discussion and Analysis of Financial Condition and Results of Operations” included in the Company’s filings
with the Securities and Exchange Commission, including the Company’s Annual Report on Form 10-K, may cause our actual results, performance or achievements to differ materially from any future results,
performance or achievements expressed or implied by these forward-looking statements. These risks, contingencies and uncertainties include, but are not limited to, the following:
• our inability to implement our business and growth strategy;
• a sustained decrease in domestic spending by the oil and natural gas exploration and production industry;
• decline in or substantial volatility of crude oil and natural gas commodity prices;
• fluctuation of our operating results and volatility of our industry;
• inability to maintain or increase pricing on our contract drilling services;
• delays in construction or deliveries of reactivated, upgraded, converted or new-build land drilling rigs;
• the loss of material customers, financial distress or management changes of potential customers or failure to obtain contract renewals and additional customer contracts for our drilling services;
• an increase in interest rates and deterioration in the credit markets;
• our inability to raise sufficient funds through debt financing and equity issuances needed to fund future rig construction projects;
• additional leverage associated with borrowings to fund rig conversions and additional newbuild rigs;
• our inability to comply with the financial and other covenants in debt agreements that we may enter into as a result of reduced revenues and financial performance;
• a substantial reduction in borrowing base under our revolving credit facility as a result of a decline in the appraised value of our drilling rigs or substantial reduction in our rig utilization;
• overcapacity and competition in our industry; unanticipated costs, delays and other difficulties in executing our long-term growth strategy;
• the loss of key management personnel;
• new technology that may cause our drilling methods or equipment to become less competitive;
• labor costs or shortages of skilled workers;
• the loss of or interruption in operations of one or more key vendors;• the effect of operating hazards and severe weather on our rigs, facilities, business, operations and financial results, and limitations on our insurance coverage;• increased regulation of drilling in unconventional formations;• the incurrence of significant costs and liabilities in the future resulting from our failure to comply with new or existing environmental regulations or an accidental release of hazardous substances into the environment;• the potential failure by us to establish and maintain effective internal control over financial reporting;• lack of operating history as a contract drilling company; and• uncertainties associated with any registration statement, including financial statements, we may be required to file with the SEC.
All forward-looking statements are necessarily only estimates of future results, and there can be no assurance that actual results will not differ materially from expectations, and, therefore, you are cautioned not to place undue reliance on such statements. Any forward-looking statements are qualified in their entirety by reference to the factors discussed throughout this presentation and in the Company’s filings with the Securities and Exchange Commission, including the Company’s Annual Report on Form 10-K. Further, any forward-looking statement speaks only as of the date of this presentation, and we undertake no obligation to update any forward-looking statement to reflect events or circumstances after the date on which the statement is made or to reflect the occurrence of unanticipated events.
Adjusted Net Loss, EBITDA and adjusted EBITDA are supplemental non-GAAP financial measures that are used by management and external users of the Company’s financial statements, such as industry analysts, investors, lenders and rating agencies. The Company’s management believes adjusted Net Loss, EBITDA and adjusted EBITDA are useful because such measures allow the Company and its stockholders to more effectively evaluate its operating performance and compare the results of its operations from period to period and against its peers without regard to its financing methods or capital structure. See non-GAAP financial measures at the end of this presentation for a full reconciliation of Net Loss to adjusted Net Loss, EBITDA and adjusted EBITDA.
2
ICD Rig Location
1. Based upon date of initial drilling operations for newbuild 200 Series rig or converted 100 series rig.2. Market data as of 3/22/18. Credit facility, debt, shares outstanding and cash balances as of 12/31/17. Debt balance excludes $1.3 million of current and long-term vehicle capital lease
obligations.3. Total credit facility commitment less outstanding borrowings @ 12/31/17 plus cash balance @ 12/31/17.
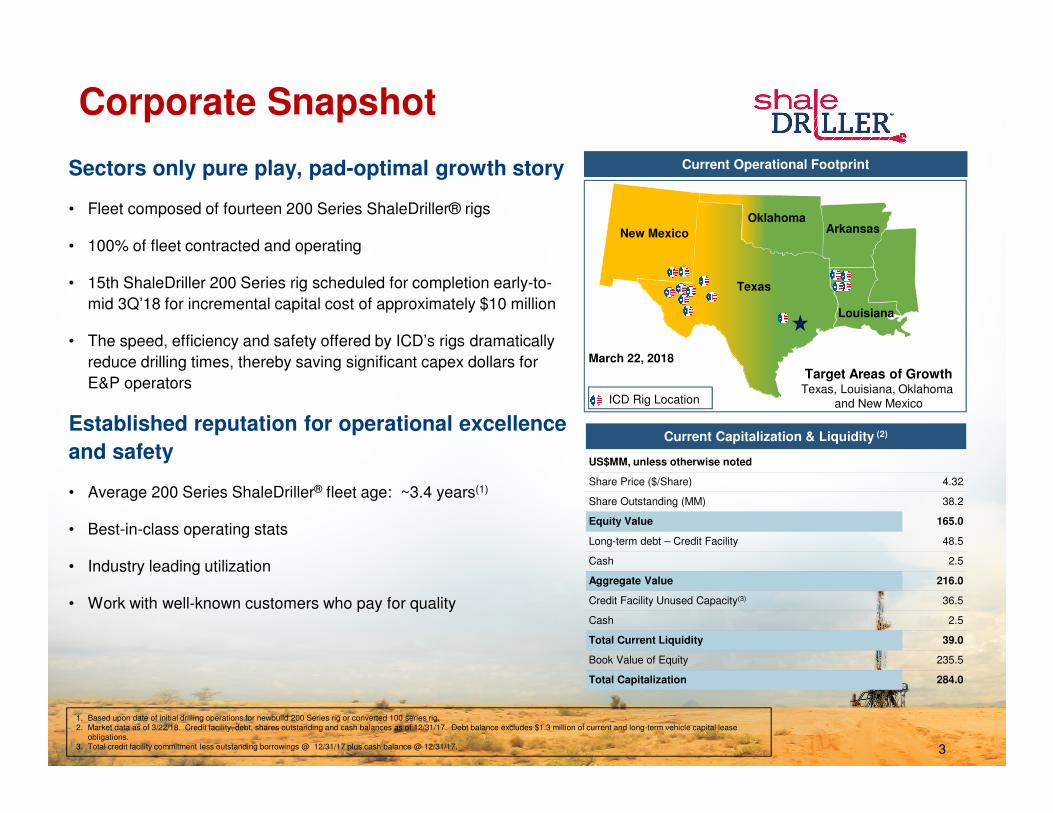
Corporate Snapshot
Sectors only pure play, pad-optimal growth story
• Fleet composed of fourteen 200 Series ShaleDriller® rigs
• 100% of fleet contracted and operating
• 15th ShaleDriller 200 Series rig scheduled for completion early-to-
mid 3Q’18 for incremental capital cost of approximately $10 million
• The speed, efficiency and safety offered by ICD’s rigs dramatically
reduce drilling times, thereby saving significant capex dollars for
E&P operators
Established reputation for operational excellence
and safety
• Average 200 Series ShaleDriller® fleet age: ~3.4 years(1)
• Best-in-class operating stats
• Industry leading utilization
• Work with well-known customers who pay for quality
Current Operational Footprint
Current Capitalization & Liquidity (2)
US$MM, unless otherwise noted
Share Price ($/Share) 4.32
Share Outstanding (MM) 38.2
Equity Value 165.0
Long-term debt – Credit Facility 48.5
Cash 2.5
Aggregate Value 216.0
Credit Facility Unused Capacity(3) 36.5
Cash 2.5
Total Current Liquidity 39.0
Book Value of Equity 235.5
Total Capitalization 284.0
3
Texas
OklahomaArkansas
Louisiana
New Mexico
Target Areas of GrowthTexas, Louisiana, Oklahoma
and New Mexico
March 22, 2018
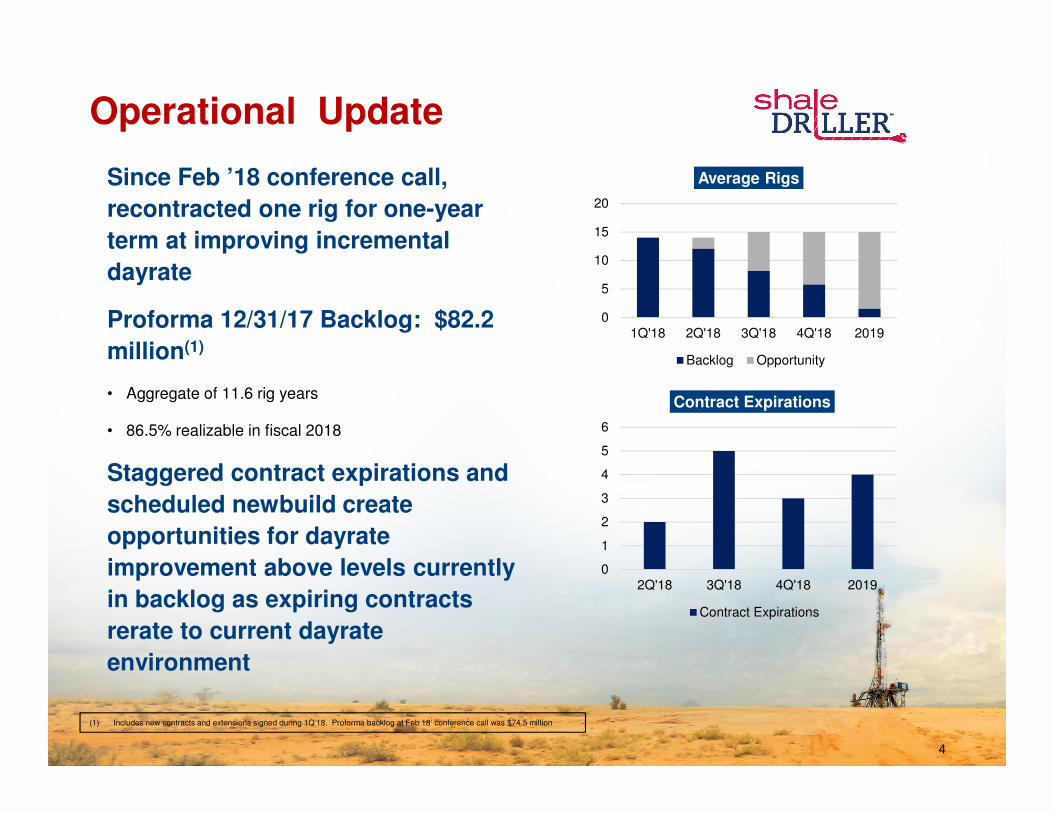
Operational Update
Since Feb ’18 conference call,
recontracted one rig for one-year
term at improving incremental
dayrate
Proforma 12/31/17 Backlog: $82.2
million(1)
• Aggregate of 11.6 rig years
• 86.5% realizable in fiscal 2018
Staggered contract expirations and
scheduled newbuild create
opportunities for dayrate
improvement above levels currently
in backlog as expiring contracts
rerate to current dayrate
environment
0
5
10
15
20
1Q'18 2Q'18 3Q'18 4Q'18 2019
Average Rigs
Backlog Opportunity
0
1
2
3
4
5
6
2Q'18 3Q'18 4Q'18 2019
Contract Expirations
Contract Expirations
(1) Includes new contracts and extensions signed during 1Q’18. Proforma backlog at Feb 18’ conference call was $74.5 million
4
High-Quality Customer Base
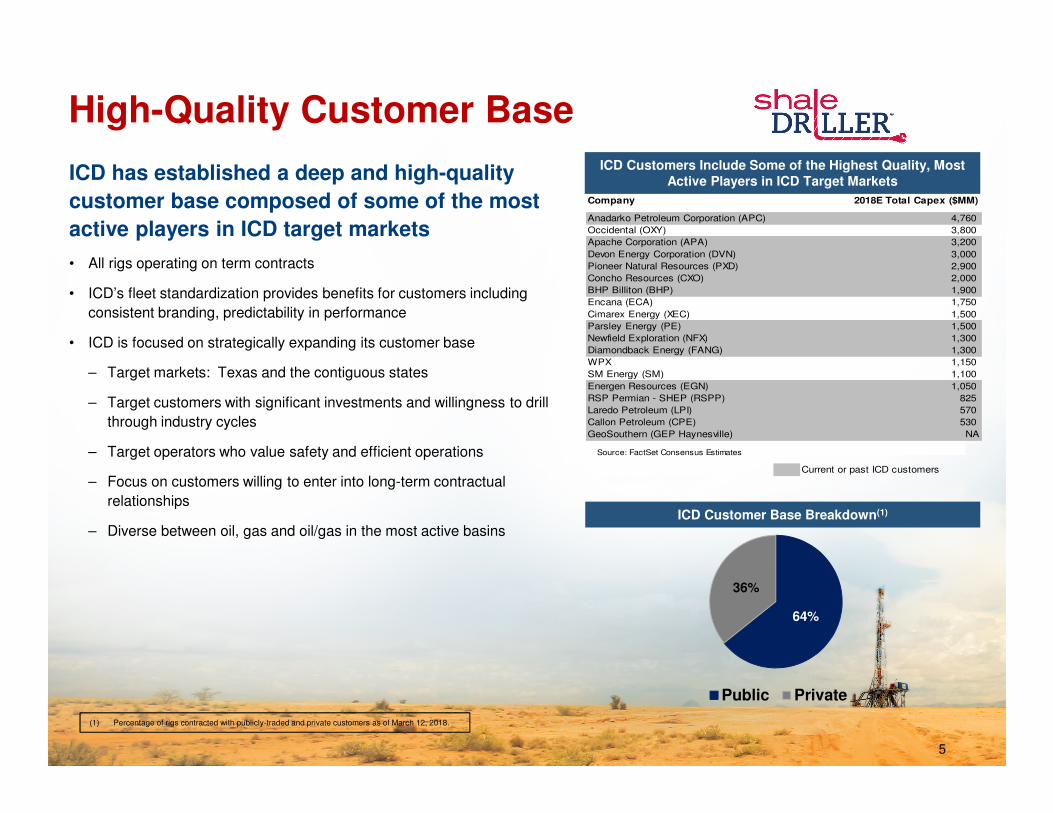
ICD Customers Include Some of the Highest Quality, Most Active Players in ICD Target MarketsICD has established a deep and high-quality
customer base composed of some of the most
active players in ICD target markets
• All rigs operating on term contracts
• ICD’s fleet standardization provides benefits for customers including
consistent branding, predictability in performance
• ICD is focused on strategically expanding its customer base
– Target markets: Texas and the contiguous states
– Target customers with significant investments and willingness to drill
through industry cycles
– Target operators who value safety and efficient operations
– Focus on customers willing to enter into long-term contractual
relationships
– Diverse between oil, gas and oil/gas in the most active basins
5
ICD Customer Base Breakdown(1)
64%
36%
Public Private
(1) Percentage of rigs contracted with publicly-traded and private customers as of March 12, 2018.
Company 2018E Total Capex ($MM)
Anadarko Petroleum Corporation (APC) 4,760
Occidental (OXY) 3,800
Apache Corporation (APA) 3,200
Devon Energy Corporation (DVN) 3,000
Pioneer Natural Resources (PXD) 2,900
Concho Resources (CXO) 2,000
BHP Billiton (BHP) 1,900
Encana (ECA) 1,750
Cimarex Energy (XEC) 1,500
Parsley Energy (PE) 1,500
Newfield Exploration (NFX) 1,300
Diamondback Energy (FANG) 1,300
WPX 1,150
SM Energy (SM) 1,100
Energen Resources (EGN) 1,050
RSP Permian - SHEP (RSPP) 825
Laredo Petroleum (LPI) 570
Callon Petroleum (CPE) 530
GeoSouthern (GEP Haynesville) NA
Source: FactSet Consensus Estimates
Current or past ICD customers
Land Drilling Update
6
Operators embracing wellbore manufacturing model, focusing on the safest
operations and rigs that consistently eliminate non-productive time and
deliver high-quality, completable wellbores
• Pad-optimal rigs represent equipment that is best suited for wellbore manufacturing
• Drill more wells per year; accelerate E&P operators’ production profiles and cash flows
• Eliminate substantial spread costs
As lateral length and pad size and complexity continue to expand, the value
proposition of pad-optimal rig technology increases significantly
Market access to pad-optimal rigs is extremely limited, with ICD and
competitor pad-optimal fleets at full effective utilization
• AC is no longer a differentiating technology
ShaleDriller® rigs eliminate non-productive time, drill longer laterals faster and for less cost, and
materially reduce spread costs/cycle times
� ICD does not work at the margin: pad-optimal equipment essential for development of core E&P acreage in lower commodity price environment
�Systems flexibility to partner with E&P and other service companies to achieve full systems optimization from technology/data integration
ICD’s Compelling Value Proposition
7
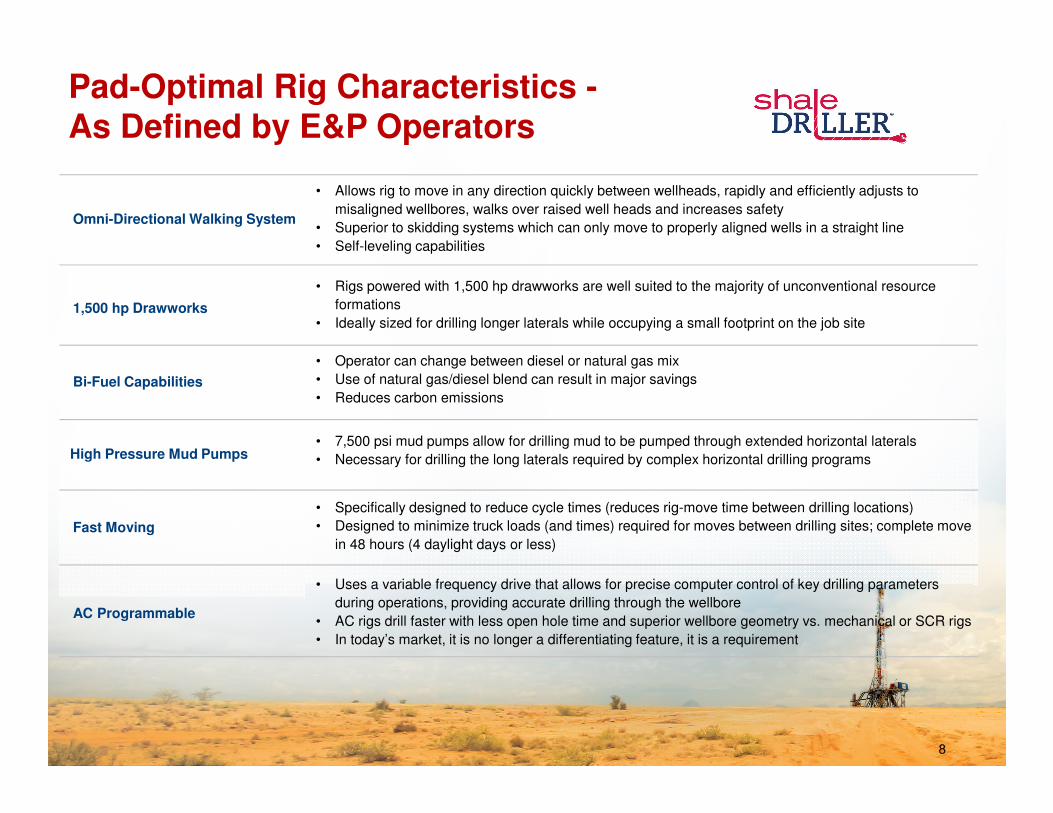
High Pressure Mud Pumps
Pad-Optimal Rig Characteristics -As Defined by E&P Operators
Omni-Directional Walking System
• Allows rig to move in any direction quickly between wellheads, rapidly and efficiently adjusts to
misaligned wellbores, walks over raised well heads and increases safety
• Superior to skidding systems which can only move to properly aligned wells in a straight line
• Self-leveling capabilities
1,500 hp Drawworks
• Rigs powered with 1,500 hp drawworks are well suited to the majority of unconventional resource
formations
• Ideally sized for drilling longer laterals while occupying a small footprint on the job site
Bi-Fuel Capabilities
• Operator can change between diesel or natural gas mix
• Use of natural gas/diesel blend can result in major savings
• Reduces carbon emissions
• 7,500 psi mud pumps allow for drilling mud to be pumped through extended horizontal laterals
• Necessary for drilling the long laterals required by complex horizontal drilling programs
8
Fast Moving
• Specifically designed to reduce cycle times (reduces rig-move time between drilling locations)
• Designed to minimize truck loads (and times) required for moves between drilling sites; complete move
in 48 hours (4 daylight days or less)
AC Programmable
• Uses a variable frequency drive that allows for precise computer control of key drilling parameters
during operations, providing accurate drilling through the wellbore
• AC rigs drill faster with less open hole time and superior wellbore geometry vs. mechanical or SCR rigs
• In today’s market, it is no longer a differentiating feature, it is a requirement
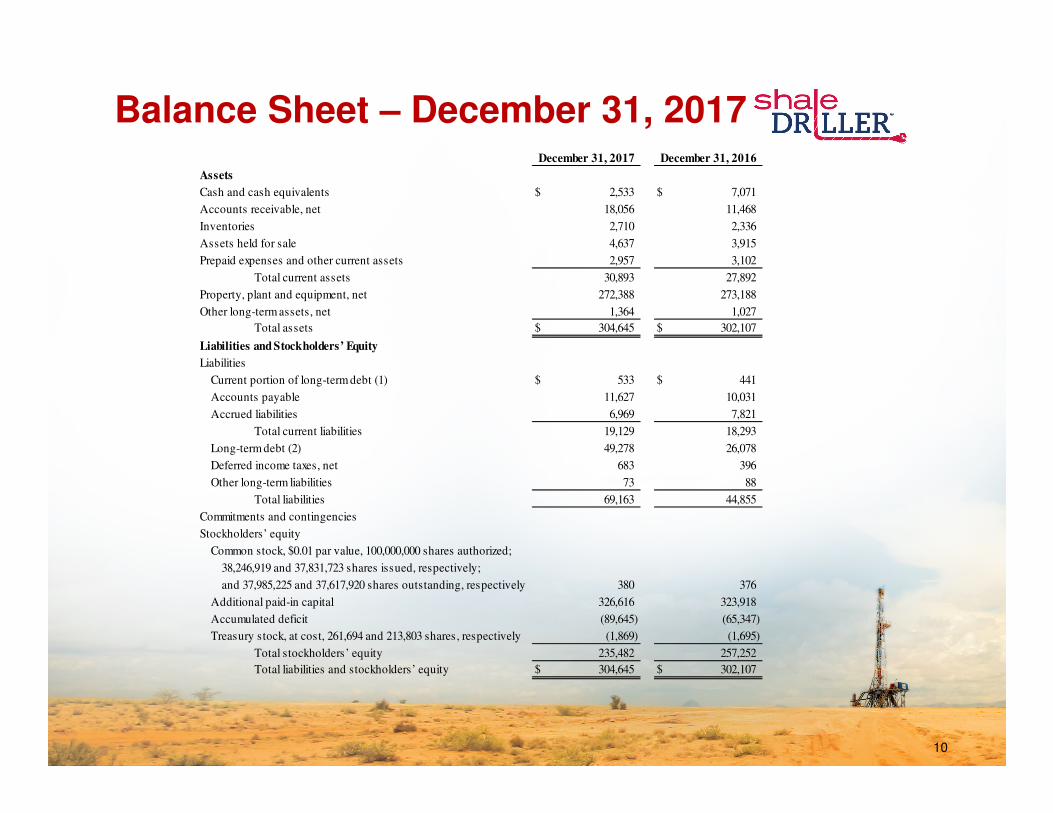
Balance Sheet – December 31, 2017
10
December 31, 2017 December 31, 2016
Assets
Cash and cash equivalents 2,533$ 7,071$
Accounts receivable, net 18,056 11,468
Inventories 2,710 2,336
Assets held for sale 4,637 3,915
Prepaid expenses and other current assets 2,957 3,102
Total current assets 30,893 27,892
Property, plant and equipment, net 272,388 273,188
Other long-term assets, net 1,364 1,027
Total assets 304,645$ 302,107$
Liabilities and Stockholders’ Equity
Liabilities
Current portion of long-term debt (1) 533$ 441$
Accounts payable 11,627 10,031
Accrued liabilities 6,969 7,821
Total current liabilities 19,129 18,293
Long-term debt (2) 49,278 26,078
Deferred income taxes, net 683 396
Other long-term liabilities 73 88
Total liabilities 69,163 44,855
Commitments and contingencies
Stockholders’ equity
Common stock, $0.01 par value, 100,000,000 shares authorized;
38,246,919 and 37,831,723 shares issued, respectively;
and 37,985,225 and 37,617,920 shares outstanding, respectively 380 376
Additional paid-in capital 326,616 323,918
Accumulated deficit (89,645) (65,347)
Treasury stock, at cost, 261,694 and 213,803 shares, respectively (1,869) (1,695)
Total stockholders’ equity 235,482 257,252
Total liabilities and stockholders’ equity 304,645$ 302,107$
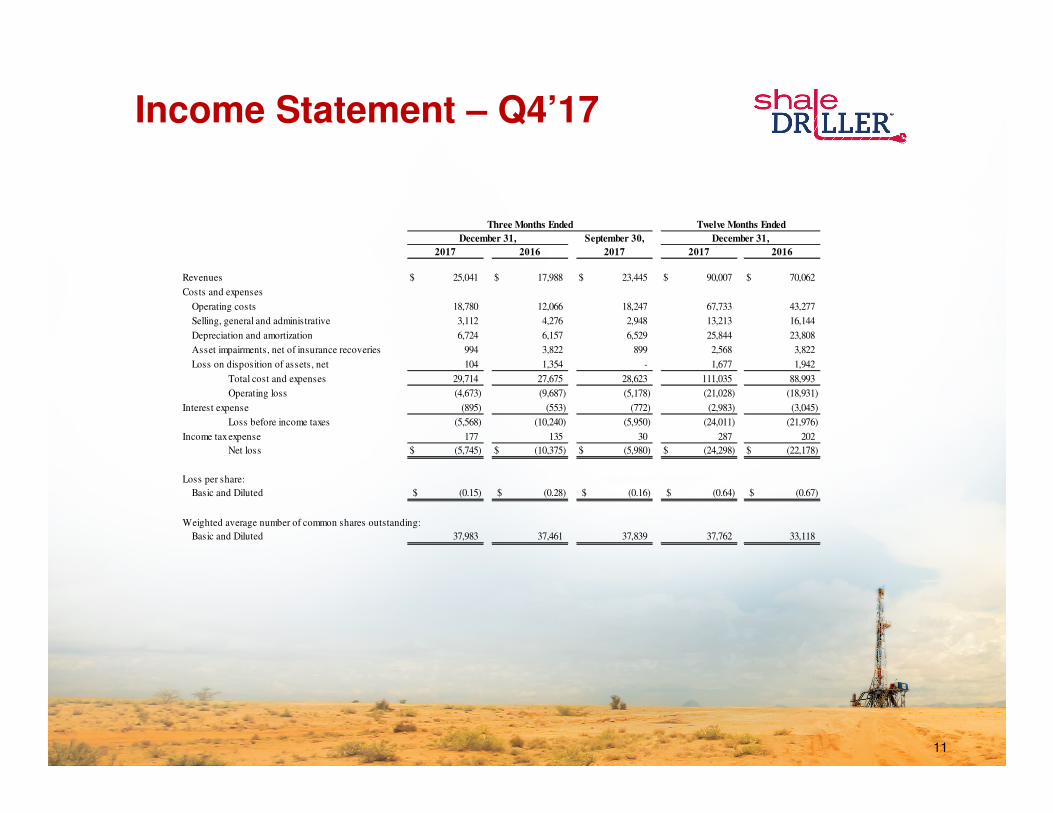
Income Statement – Q4’17
11
September 30,
2017 2016 2017 2017 2016
Revenues 25,041$ 17,988$ 23,445$ 90,007$ 70,062$
Costs and expenses
Operating costs 18,780 12,066 18,247 67,733 43,277
Selling, general and administrative 3,112 4,276 2,948 13,213 16,144
Depreciation and amortization 6,724 6,157 6,529 25,844 23,808
Asset impairments, net of insurance recoveries 994 3,822 899 2,568 3,822
Loss on disposition of assets, net 104 1,354 - 1,677 1,942
Total cost and expenses 29,714 27,675 28,623 111,035 88,993
Operating loss (4,673) (9,687) (5,178) (21,028) (18,931)
Interest expense (895) (553) (772) (2,983) (3,045)
Loss before income taxes (5,568) (10,240) (5,950) (24,011) (21,976)
Income tax expense 177 135 30 287 202
Net loss (5,745)$ (10,375)$ (5,980)$ (24,298)$ (22,178)$
Loss per share:
Basic and Diluted (0.15)$ (0.28)$ (0.16)$ (0.64)$ (0.67)$
Weighted average number of common shares outstanding:
Basic and Diluted 37,983 37,461 37,839 37,762 33,118
Twelve Months EndedThree Months Ended
December 31, December 31,
Non-GAAP Financial Measures
12
Adjusted net loss, EBITDA and adjusted EBITDA are supplemental non-GAAP financial measure that are used by management and external users of our financial statements, such as industry analysts, investors, lenders and rating agencies.In addition, adjusted EBITDA is consistent with how EBITDA is calculated under our revolving credit facility for purposes of determining our compliance with various financial covenants. We define “EBITDA” as earnings (or loss) before interest, taxes, depreciation, and amortization, and we define “adjusted EBITDA” as EBITDA before stock-based compensation, non-cash asset impairments, gains or losses on disposition of assets, and other non-recurring items added back to, or subtracted from, net income for purposes of calculating EBITDA under our revolving credit facility. Neither adjusted net loss, EBITDA or adjusted EBITDA is a measure of net income as determined by U.S. generally accepted accounting principles (“GAAP”).
Management believes adjusted net loss, EBITDA and adjusted EBITDA are useful because they allow our stockholders to more effectively evaluate our operating performance and compliance with various financial covenants under our revolving credit facility and compare the results of our operations from period to period and against our peers without regard to our financing methods or capital structure or non-recurring, non-cash transactions. We exclude the items listed above from net income (loss) in calculating adjusted net loss, EBITDA and adjusted EBITDA because these amounts can vary substantially from company to company within our industry depending upon accounting methods and book values of assets, capital structures and the method by which the assets were acquired. None of adjusted net loss, EBITDA or adjusted EBITDA should be considered an alternative to, or more meaningful than, net income (loss), the most closely comparable financial measure calculated in accordance with GAAP or as an indicator of our operating performance or liquidity. Certain items excluded from adjusted net loss, EBITDA and adjusted EBITDA are significant components in understanding and assessing a company’s financial performance, such as a company’s return of assets, cost of capital and tax structure. Our presentation of adjusted net loss, EBITDA and adjusted EBITDA should not be construed as an inference that our results will be unaffected by unusual or non-recurring items. Our computations of adjusted net loss, EBITDA and adjusted EBITDA may not be comparable to other similarly titled measures of other companies.
The table on the following page present a reconciliation of net loss to adjusted net loss, EBITDA and adjusted EBITDA.
Non-GAAP Financial Measures
13
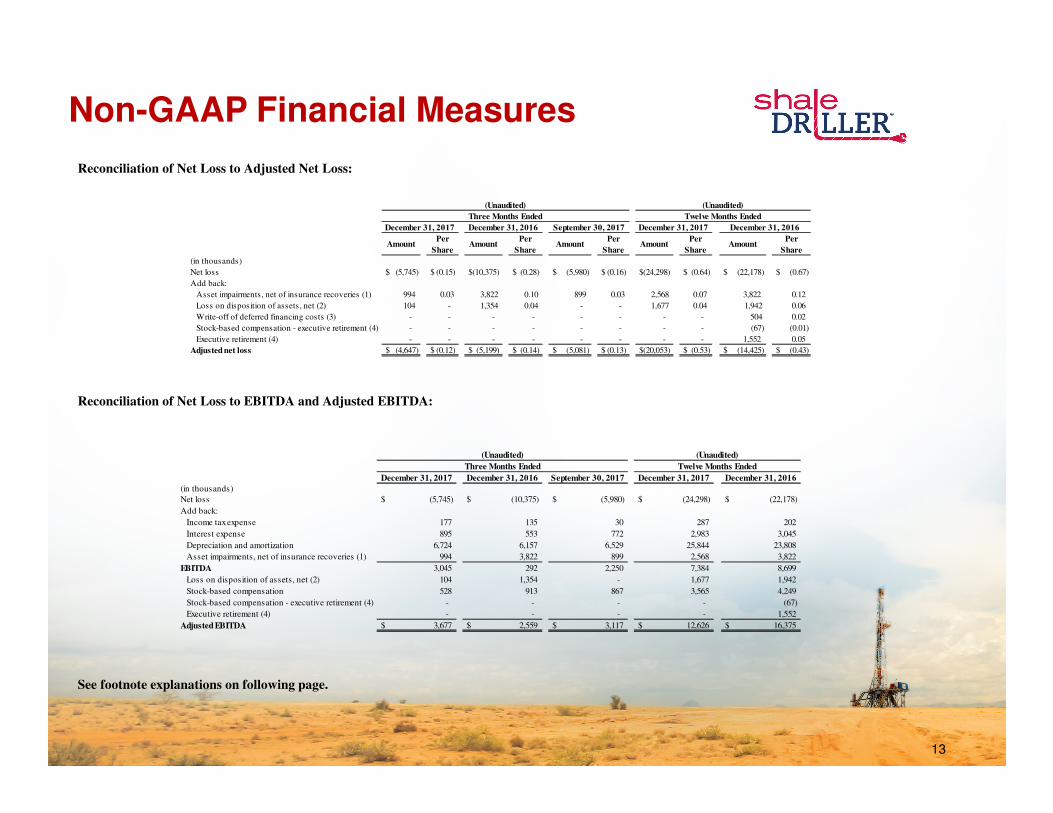
Reconciliation of Net Loss to Adjusted Net Loss:
Reconciliation of Net Loss to EBITDA and Adjusted EBITDA:
See footnote explanations on following page.
AmountPer
ShareAmount
Per
ShareAmount
Per
ShareAmount
Per
ShareAmount
Per
Share
(in thousands)
Net loss $ (5,745) $ (0.15) $(10,375) $ (0.28) $ (5,980) $ (0.16) $(24,298) $ (0.64) $ (22,178) $ (0.67)
Add back:
Asset impairments, net of insurance recoveries (1) 994 0.03 3,822 0.10 899 0.03 2,568 0.07 3,822 0.12
Loss on disposition of assets, net (2) 104 - 1,354 0.04 - - 1,677 0.04 1,942 0.06
Write-off of deferred financing costs (3) - - - - - - - - 504 0.02
Stock-based compensation - executive retirement (4) - - - - - - - - (67) (0.01)
Executive retirement (4) - - - - - - - - 1,552 0.05
Adjusted net loss $ (4,647) $ (0.12) $ (5,199) $ (0.14) $ (5,081) $ (0.13) $(20,053) $ (0.53) $ (14,425) $ (0.43)
Twelve Months Ended
(Unaudited)
Three Months Ended
(Unaudited)
December 31, 2017 December 31, 2016 September 30, 2017 December 31, 2017 December 31, 2016
December 31, 2017 December 31, 2016 September 30, 2017 December 31, 2017 December 31, 2016
(in thousands)
Net loss $ (5,745) $ (10,375) $ (5,980) $ (24,298) $ (22,178)
Add back:
Income tax expense 177 135 30 287 202
Interest expense 895 553 772 2,983 3,045
Depreciation and amortization 6,724 6,157 6,529 25,844 23,808
Asset impairments, net of insurance recoveries (1) 994 3,822 899 2,568 3,822
EBITDA 3,045 292 2,250 7,384 8,699
Loss on disposition of assets, net (2) 104 1,354 - 1,677 1,942
Stock-based compensation 528 913 867 3,565 4,249
Stock-based compensation - executive retirement (4) - - - - (67)
Executive retirement (4) - - - - 1,552
Adjusted EBITDA $ 3,677 $ 2,559 $ 3,117 $ 12,626 $ 16,375
(Unaudited)
Twelve Months EndedThree Months Ended
(Unaudited)
Non-GAAP Financial Measures
14
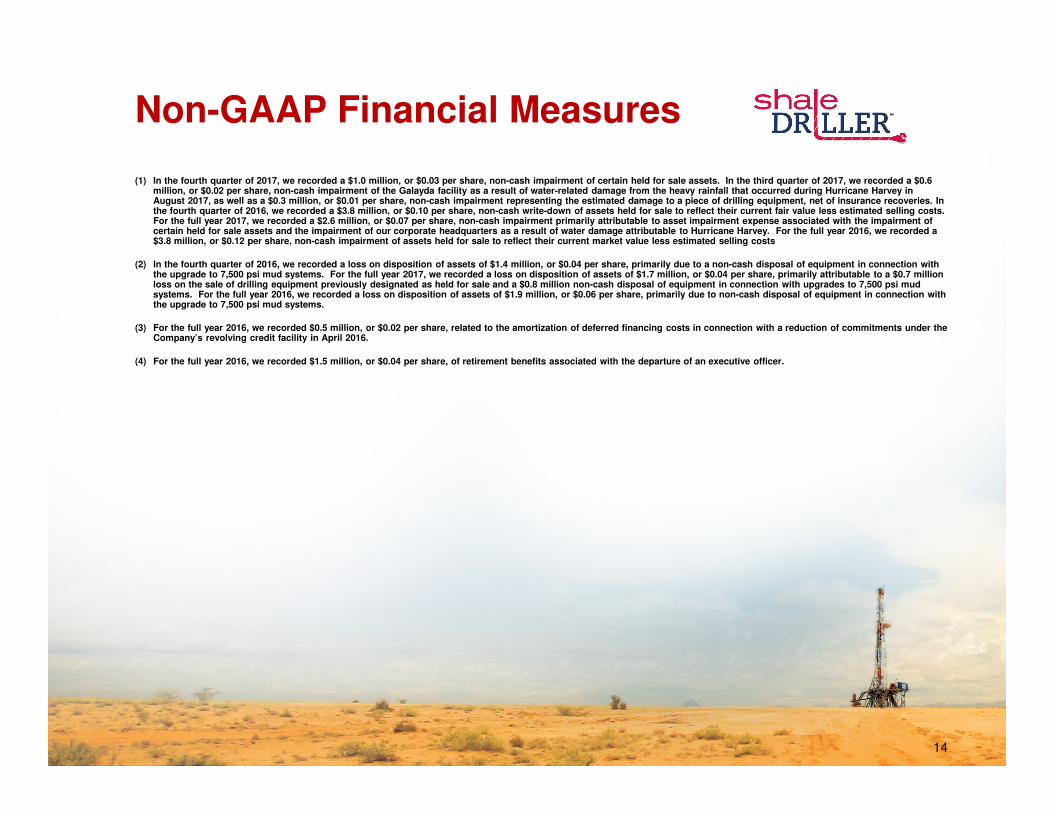
(1) In the fourth quarter of 2017, we recorded a $1.0 million, or $0.03 per share, non-cash impairment of certain held for sale assets. In the third quarter of 2017, we recorded a $0.6 million, or $0.02 per share, non-cash impairment of the Galayda facility as a result of water-related damage from the heavy rainfall that occurred during Hurricane Harvey in August 2017, as well as a $0.3 million, or $0.01 per share, non-cash impairment representing the estimated damage to a piece of drilling equipment, net of insurance recoveries. In the fourth quarter of 2016, we recorded a $3.8 million, or $0.10 per share, non-cash write-down of assets held for sale to reflect their current fair value less estimated selling costs. For the full year 2017, we recorded a $2.6 million, or $0.07 per share, non-cash impairment primarily attributable to asset impairment expense associated with the impairment of certain held for sale assets and the impairment of our corporate headquarters as a result of water damage attributable to Hurricane Harvey. For the full year 2016, we recorded a $3.8 million, or $0.12 per share, non-cash impairment of assets held for sale to reflect their current market value less estimated selling costs
(2) In the fourth quarter of 2016, we recorded a loss on disposition of assets of $1.4 million, or $0.04 per share, primarily due to a non-cash disposal of equipment in connection with the upgrade to 7,500 psi mud systems. For the full year 2017, we recorded a loss on disposition of assets of $1.7 million, or $0.04 per share, primarily attributable to a $0.7 million loss on the sale of drilling equipment previously designated as held for sale and a $0.8 million non-cash disposal of equipment in connection with upgrades to 7,500 psi mud systems. For the full year 2016, we recorded a loss on disposition of assets of $1.9 million, or $0.06 per share, primarily due to non-cash disposal of equipment in connection with the upgrade to 7,500 psi mud systems.
(3) For the full year 2016, we recorded $0.5 million, or $0.02 per share, related to the amortization of deferred financing costs in connection with a reduction of commitments under the Company’s revolving credit facility in April 2016.
(4) For the full year 2016, we recorded $1.5 million, or $0.04 per share, of retirement benefits associated with the departure of an executive officer.
Non-GAAP Financial Measures
15
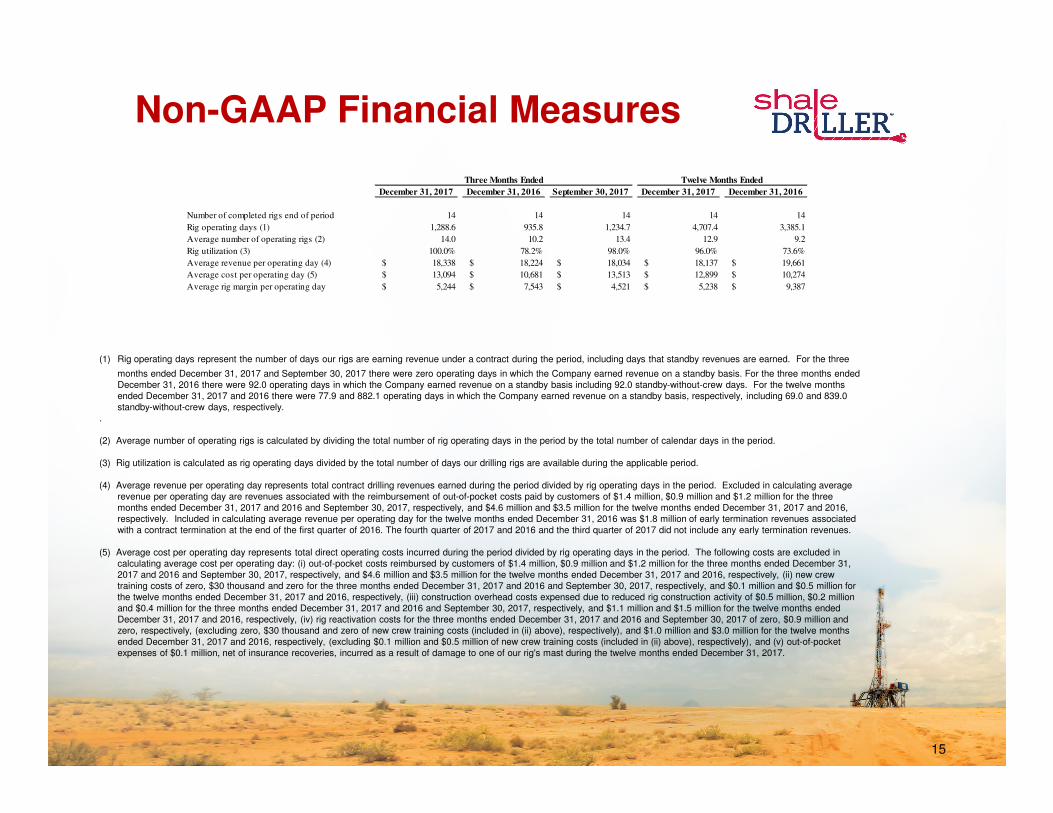
(1) Rig operating days represent the number of days our rigs are earning revenue under a contract during the period, including days that standby revenues are earned. For the three
months ended December 31, 2017 and September 30, 2017 there were zero operating days in which the Company earned revenue on a standby basis. For the three months ended December 31, 2016 there were 92.0 operating days in which the Company earned revenue on a standby basis including 92.0 standby-without-crew days. For the twelve months ended December 31, 2017 and 2016 there were 77.9 and 882.1 operating days in which the Company earned revenue on a standby basis, respectively, including 69.0 and 839.0 standby-without-crew days, respectively.
.
(2) Average number of operating rigs is calculated by dividing the total number of rig operating days in the period by the total number of calendar days in the period.
(3) Rig utilization is calculated as rig operating days divided by the total number of days our drilling rigs are available during the applicable period.
(4) Average revenue per operating day represents total contract drilling revenues earned during the period divided by rig operating days in the period. Excluded in calculating average revenue per operating day are revenues associated with the reimbursement of out-of-pocket costs paid by customers of $1.4 million, $0.9 million and $1.2 million for the three months ended December 31, 2017 and 2016 and September 30, 2017, respectively, and $4.6 million and $3.5 million for the twelve months ended December 31, 2017 and 2016, respectively. Included in calculating average revenue per operating day for the twelve months ended December 31, 2016 was $1.8 million of early termination revenues associated with a contract termination at the end of the first quarter of 2016. The fourth quarter of 2017 and 2016 and the third quarter of 2017 did not include any early termination revenues.
(5) Average cost per operating day represents total direct operating costs incurred during the period divided by rig operating days in the period. The following costs are excluded in calculating average cost per operating day: (i) out-of-pocket costs reimbursed by customers of $1.4 million, $0.9 million and $1.2 million for the three months ended December 31, 2017 and 2016 and September 30, 2017, respectively, and $4.6 million and $3.5 million for the twelve months ended December 31, 2017 and 2016, respectively, (ii) new crew training costs of zero, $30 thousand and zero for the three months ended December 31, 2017 and 2016 and September 30, 2017, respectively, and $0.1 million and $0.5 million for the twelve months ended December 31, 2017 and 2016, respectively, (iii) construction overhead costs expensed due to reduced rig construction activity of $0.5 million, $0.2 million and $0.4 million for the three months ended December 31, 2017 and 2016 and September 30, 2017, respectively, and $1.1 million and $1.5 million for the twelve months ended December 31, 2017 and 2016, respectively, (iv) rig reactivation costs for the three months ended December 31, 2017 and 2016 and September 30, 2017 of zero, $0.9 million and zero, respectively, (excluding zero, $30 thousand and zero of new crew training costs (included in (ii) above), respectively), and $1.0 million and $3.0 million for the twelve months ended December 31, 2017 and 2016, respectively, (excluding $0.1 million and $0.5 million of new crew training costs (included in (ii) above), respectively), and (v) out-of-pocket expenses of $0.1 million, net of insurance recoveries, incurred as a result of damage to one of our rig's mast during the twelve months ended December 31, 2017.
December 31, 2017 December 31, 2016 September 30, 2017 December 31, 2017 December 31, 2016
Number of completed rigs end of period 14 14 14 14 14
Rig operating days (1) 1,288.6 935.8 1,234.7 4,707.4 3,385.1
Average number of operating rigs (2) 14.0 10.2 13.4 12.9 9.2
Rig utilization (3) 100.0% 78.2% 98.0% 96.0% 73.6%
Average revenue per operating day (4) $ 18,338 $ 18,224 $ 18,034 $ 18,137 $ 19,661
Average cost per operating day (5) $ 13,094 $ 10,681 $ 13,513 $ 12,899 $ 10,274
Average rig margin per operating day $ 5,244 $ 7,543 $ 4,521 $ 5,238 $ 9,387
Twelve Months EndedThree Months Ended

16