Howard weil presentation 03.18.16 v_f1
52
O Scotia Howard Weil 2016 Energy Conference March 21, 2016
-
Upload
anteroresources -
Category
Investor Relations
-
view
709 -
download
0
Transcript of Howard weil presentation 03.18.16 v_f1
O
Scotia Howard Weil 2016 Energy ConferenceMarch 21, 2016

FORWARD-LOOKING STATEMENTS
This presentation contains forward-looking statements within the meaning of Section 27A of the Securities Act of 1933 and Section 21E of the Securities Exchange Act of 1934. All statements, other than statements of historical facts, included in this presentation that address activities, events or developments that Antero Resources Corporation and its subsidiaries (collectively, the “Company” or “Antero”) expects, believes or anticipates will or may occur in the future are forward-looking statements. The words “believe,” “expect,” “anticipate,” “plan,” “intend,” “estimate,” “project,” “foresee,” “should,” “would,” “could,” or other similar expressions are intended to identify forward-looking statements. However, the absence of these words does not mean that the statements are not forward-looking. Without limiting the generality of the foregoing, forward-looking statements contained in this presentation specifically include estimates of the Company’s reserves, expectations of plans, strategies, objectives and anticipated financial and operating results of the Company, including as to the Company’s drilling program, production, hedging activities, capital expenditure levels and other guidance included in this presentation. These statements are based on certain assumptions made by the Company based on management’s experience and perception of historical trends, current conditions, anticipated future developments and other factors believed to be appropriate. Such statements are subject to a number of assumptions, risks and uncertainties, many of which are beyond the control of the Company, which may cause actual results to differ materially from those implied or expressed by the forward-looking statements. These include the factors discussed or referenced under the heading “Item 1A. Risk Factors” in our Annual Report on Form 10-K for the year ended December 31, 2015 and in the Company’s subsequent filings with the SEC.
The Company cautions you that these forward-looking statements are subject to all of the risks and uncertainties, most of which are difficult to predict and many of which are beyond our control, incident to the exploration for and development, production, gathering and sale of natural gas and oil. These risks include, but are not limited to, commodity price volatility, inflation, lack of availability of drilling and production equipment and services, environmental risks, drilling and other operating risks, regulatory changes, the uncertainty inherent in estimating natural gas and oil reserves and in projecting future rates of production, cash flow and access to capital, the timing of development expenditures, and the other risks described under the heading “Risk Factors” in our Annual Report on Form 10-K for the year ended December 31, 2015 and in the Company’s subsequent filings with the SEC.
Any forward-looking statement speaks only as of the date on which such statement is made and the Company undertakes no obligation to correct or update any forward-looking statement, whether as a result of new information, future events or otherwise, except as required by applicable law.
1
Antero Resources Corporation is denoted as “AR” and Antero Midstream Partners LP is denoted as “AM” in the presentation, which are their respective New York Stock Exchange ticker symbols.

WHY OWN ANTERO?
2
$3.5 billion of consolidated liquidity available as of 12/31/15 Ba2/BB corporate ratings affirmed in February 2016 Stable leverage not increasing through the down cycle
Balance Sheet Strength
Production Sold Forward at
Attractive Prices
Momentum + Growth
Superior Realized Prices & Margins
Attractive & Improving Well
Economics
Largest Core Drilling Inventory
94% of forecasted production hedged through 2018 at $3.81/MMBtu $3.1 billion mark-to-market on 3.5 Tcfe hedge position as of 12/31/15 Over 33 Tcfe of unhedged 3P inventory to drill and produce as prices improve
15% production growth guidance in 2016 and 20% growth targeted in 2017 Forecasted cash flow growth in 2016 and 2017 Flexibility to adjust activity up or down – 8 rigs currently running, 70 DUCs at YE 2016
Forecast positive basis to Nymex in 2016 and beyond due to large FT portfolio with superior pricing points; low average cost of $0.46 per MMBtu
Realized prices and EBITDAX margins lead Appalachian peers
24% to 37% ROR at 12/31/15 strip prices and 52% to 85% ROR including hedges Long laterals up to 14,000 ft.; rolling off legacy drilling and completion contracts;
multiple process improvements and higher proppant loading all improving RORs
Based on geologic interpretation of core, Antero has the largest drilling inventory in the core of the two plays with over 3,700 undrilled locations
Antero continues to consolidate its acreage position
0200400600800
1,0001,2001,4001,6001,800
EQT CHK COG AR SWN RRC CNX
-
100
200
300
400
500
600
AR Peer 1 Peer 2 Peer 3 Peer 4 Peer 5 Peer 6
Core Net Acres - Dry Core Net Acres - Liquids Rich
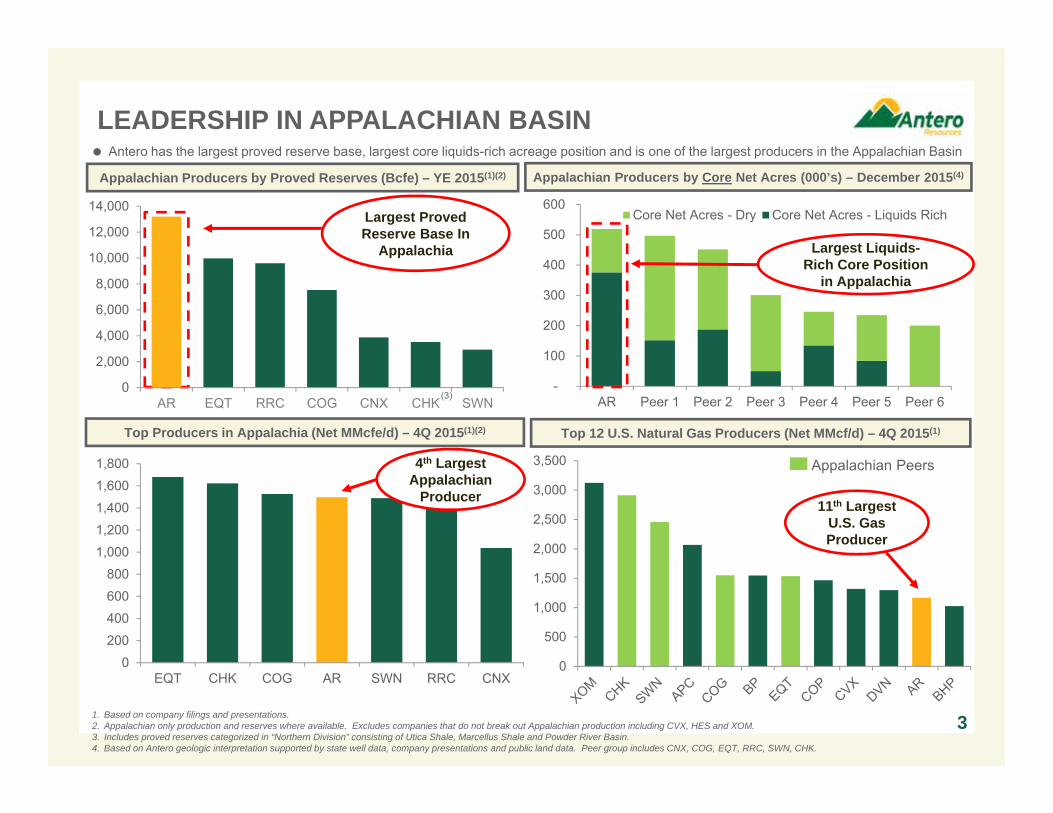
LEADERSHIP IN APPALACHIAN BASIN
Top Producers in Appalachia (Net MMcfe/d) – 4Q 2015(1)(2) Top 12 U.S. Natural Gas Producers (Net MMcf/d) – 4Q 2015(1)
Appalachian Producers by Proved Reserves (Bcfe) – YE 2015(1)(2) Appalachian Producers by Core Net Acres (000’s) – December 2015(4)
1. Based on company filings and presentations.2. Appalachian only production and reserves where available. Excludes companies that do not break out Appalachian production including CVX, HES and XOM. 3. Includes proved reserves categorized in “Northern Division” consisting of Utica Shale, Marcellus Shale and Powder River Basin.4. Based on Antero geologic interpretation supported by state well data, company presentations and public land data. Peer group includes CNX, COG, EQT, RRC, SWN, CHK.
(3)
3
4th Largest Appalachian
Producer
Antero has the largest proved reserve base, largest core liquids-rich acreage position and is one of the largest producers in the Appalachian Basin
Appalachian Peers
11th Largest U.S. Gas Producer
Largest Proved Reserve Base In
Appalachia Largest Liquids-Rich Core Position
in Appalachia
0
2,000
4,000
6,000
8,000
10,000
12,000
14,000
AR EQT RRC COG CNX CHK SWN
0
500
1,000
1,500
2,000
2,500
3,000
3,500
$198 $341
$434
$649
$1,164 $1,347
$0
$200
$400
$600
$800
$1,000
$1,200
$1,400
$1,600
2010 2011 2012 2013 2014 2015 2016E
$1,221
0
10,000
20,000
30,000
40,000
50,000
60,000
2010 2011 2012 2013 2014 2015 2016E
NGLs (C3+) Oil Ethane
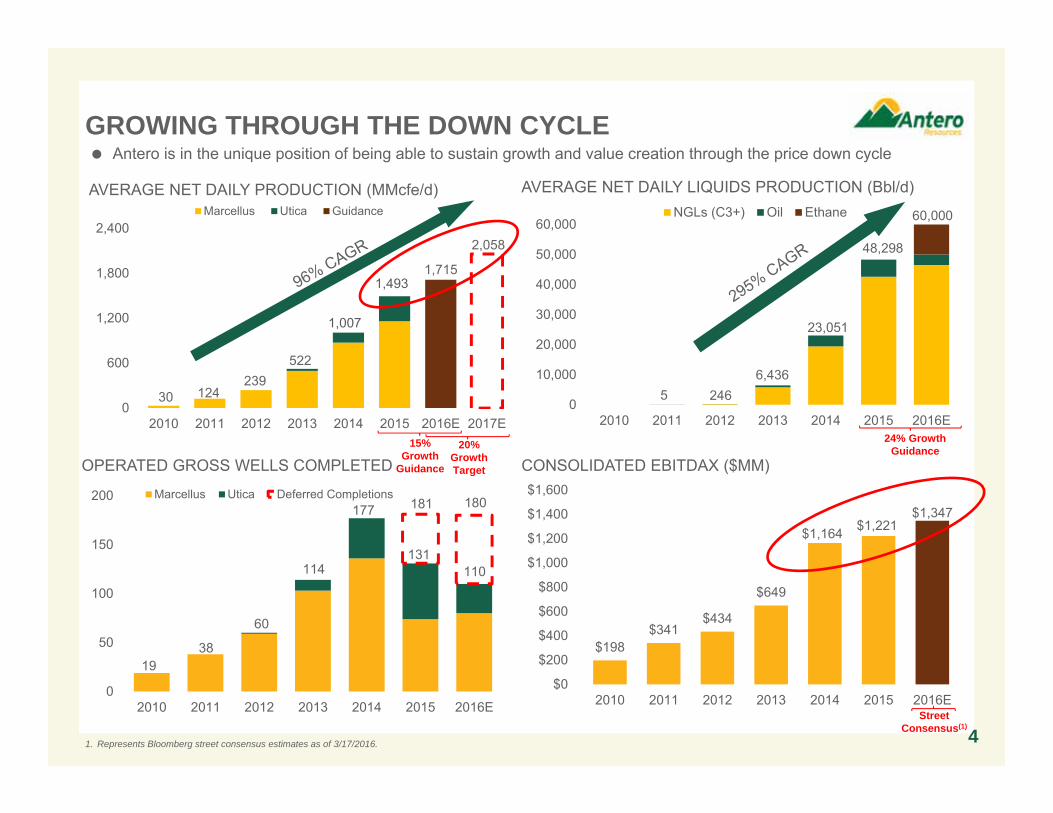
5 2466,436
23,051
48,298
60,000
24% GrowthGuidance
1. Represents Bloomberg street consensus estimates as of 3/17/2016.
1,715
2,058
0
600
1,200
1,800
2,400
2010 2011 2012 2013 2014 2015 2016E 2017E
Marcellus Utica Guidance
30 124239
522
1,007
1,493
4
AVERAGE NET DAILY PRODUCTION (MMcfe/d)
0
50
100
150
200
2010 2011 2012 2013 2014 2015 2016E
Marcellus Utica Deferred Completions
1938
60
114
177 181
131110
180
GROWING THROUGH THE DOWN CYCLE
OPERATED GROSS WELLS COMPLETED
AVERAGE NET DAILY LIQUIDS PRODUCTION (Bbl/d)
15% Growth
Guidance
20% GrowthTarget
Antero is in the unique position of being able to sustain growth and value creation through the price down cycle
CONSOLIDATED EBITDAX ($MM)
StreetConsensus(1)
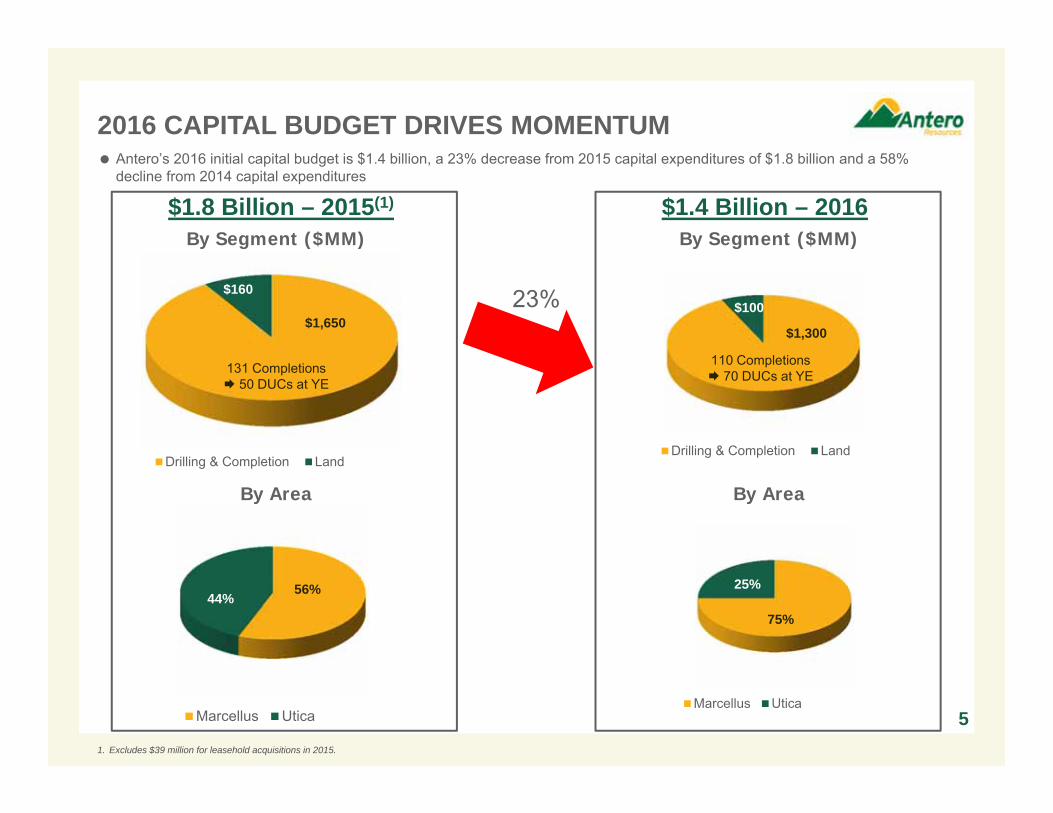
$1,300
$100
Drilling & Completion Land
2016 CAPITAL BUDGET DRIVES MOMENTUM
By Area
5
$1.8 Billion – 2015(1)
By Segment ($MM)
$1,650
$160
Drilling & Completion Land
56%44%
Marcellus Utica
By Area
$1.4 Billion – 2016By Segment ($MM)
Antero’s 2016 initial capital budget is $1.4 billion, a 23% decrease from 2015 capital expenditures of $1.8 billion and a 58%decline from 2014 capital expenditures
23%
131 Completions 50 DUCs at YE
1. Excludes $39 million for leasehold acquisitions in 2015.
110 Completions 70 DUCs at YE
75%
25%
Marcellus Utica
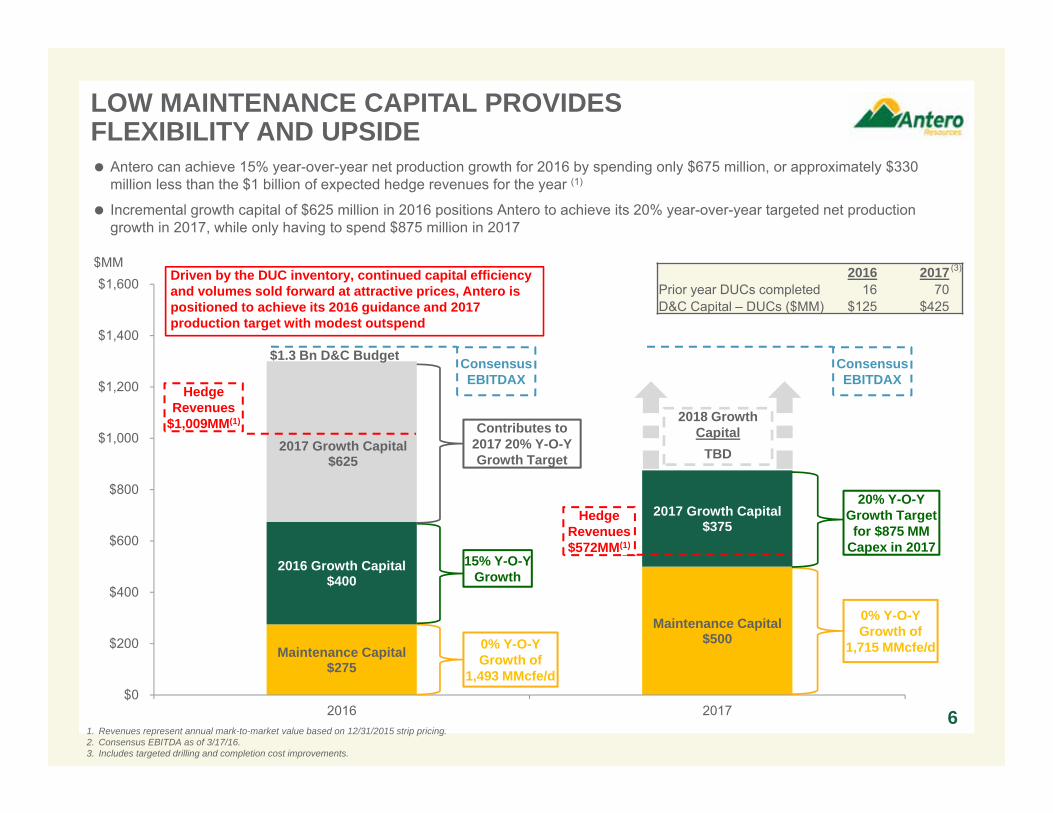
61. Revenues represent annual mark-to-market value based on 12/31/2015 strip pricing.2. Consensus EBITDA as of 3/17/16.3. Includes targeted drilling and completion cost improvements.
Antero can achieve 15% year-over-year net production growth for 2016 by spending only $675 million, or approximately $330 million less than the $1 billion of expected hedge revenues for the year (1)
Incremental growth capital of $625 million in 2016 positions Antero to achieve its 20% year-over-year targeted net production growth in 2017, while only having to spend $875 million in 2017
LOW MAINTENANCE CAPITAL PROVIDES FLEXIBILITY AND UPSIDE
Maintenance Capital$275
Maintenance Capital$500
2016 Growth Capital$400
2017 Growth Capital$375
2017 Growth Capital$625
$0
$200
$400
$600
$800
$1,000
$1,200
$1,400
$1,600
2016 2017
$1.3 Bn D&C Budget
0% Y-O-YGrowth of
1,493 MMcfe/d
15% Y-O-YGrowth
Contributes to 2017 20% Y-O-Y Growth Target
0% Y-O-YGrowth of
1,715 MMcfe/d
20% Y-O-YGrowth Target for $875 MM
Capex in 2017
Hedge Revenues
$1,009MM(1)
Hedge Revenues$572MM(1)
$MM2016 2017
Prior year DUCs completed 16 70 D&C Capital – DUCs ($MM) $125 $425
Driven by the DUC inventory, continued capital efficiency and volumes sold forward at attractive prices, Antero is positioned to achieve its 2016 guidance and 2017 production target with modest outspend
2018 Growth Capital
TBD
(3)
Consensus EBITDAX
Consensus EBITDAX
3Q 2015
$1.97
AR P3 P5 P4 P2 P1
$2.03
AR P3 P2 P1 P5 P4
$2.84
$0.00
$0.50
$1.00
$1.50
$2.00
$2.50
$3.00
$3.50
$4.00
AR P5 P2 P3 P4 P1
$2.56
P2 AR P5 P3 P4 P1
$308
AR P5 P3 P2 P4 P1
$1.90
AR P3 P4 P2 P5 P1
$291
P5 AR P3 P2 P4 P1
$269
P5 AR P2 P3 P4 P1
$330
$0
$100
$200
$300
$400
$500
$600
P5 P2 P4 AR P3 P1
$355
P5 P2 AR P4 P3 P1
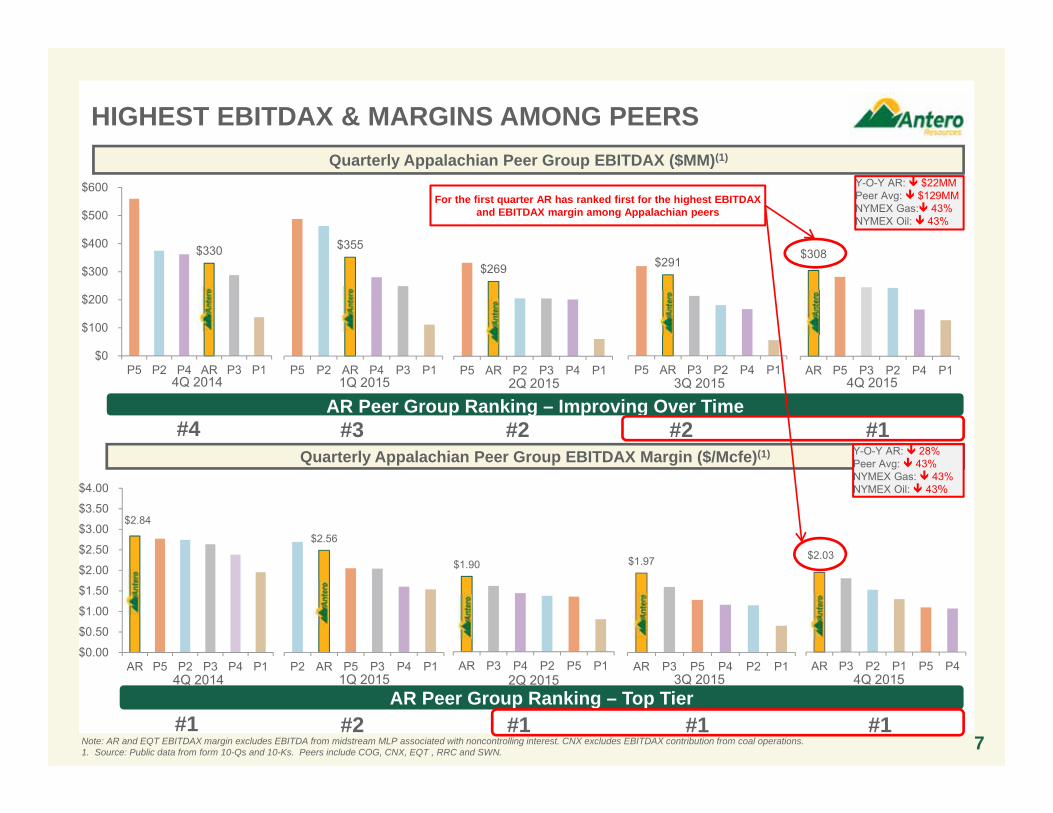
HIGHEST EBITDAX & MARGINS AMONG PEERS
Quarterly Appalachian Peer Group EBITDAX Margin ($/Mcfe)(1)
Quarterly Appalachian Peer Group EBITDAX ($MM)(1)
4Q 2014 1Q 2015 2Q 2015
Note: AR and EQT EBITDAX margin excludes EBITDA from midstream MLP associated with noncontrolling interest. CNX excludes EBITDAX contribution from coal operations. 1. Source: Public data from form 10-Qs and 10-Ks. Peers include COG, CNX, EQT , RRC and SWN.
4Q 20154Q 2014 1Q 2015 2Q 2015AR Peer Group Ranking – Top Tier
#1 #2 #1 #1 #1
AR Peer Group Ranking – Improving Over Time#4 #3 #2 #2 #1
Y-O-Y AR: $22MMPeer Avg: $129MMNYMEX Gas: 43%NYMEX Oil: 43%
Y-O-Y AR: 28%Peer Avg: 43%NYMEX Gas: 43%NYMEX Oil: 43%
7
3Q 2015
For the first quarter AR has ranked first for the highest EBITDAX and EBITDAX margin among Appalachian peers
4Q 2015
Baa3
Ba1 Ba1 Ba1
Ba3 Ba3 Ba3 Ba3
B1 B1 B1
B2 B2 B2
B3
Caa1
Caa2
Baa2
Baa3 Baa3 Baa3
Baa2 Baa2
Ba2
Baa3 Baa3
Ba1 Ba1
Baa3
Ba1 Ba1 Ba1 Ba1
Ba3 Ba3
Ba2
Ba3
-Baa3
Baa3
Baa3
Baa3
Baa3
Baa3
Baa3
Baa3
Baa3
Baa3
Baa3
Baa3
NBL XEC EQT PXD APC HES CXO AR CLR MUR NFX RRC SWN EGN QEP SM WPX UNT EPE WLL DNR
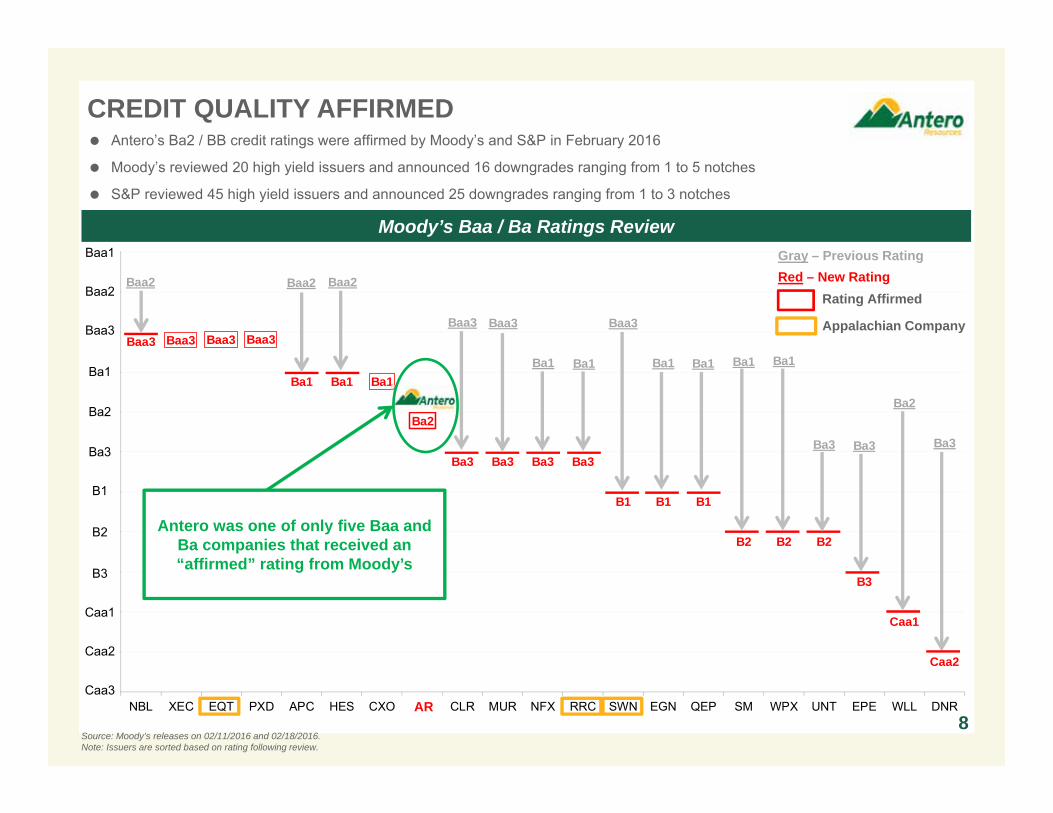
CREDIT QUALITY AFFIRMED
8
Moody’s Baa / Ba Ratings Review
Source: Moody’s releases on 02/11/2016 and 02/18/2016.Note: Issuers are sorted based on rating following review.
Antero’s Ba2 / BB credit ratings were affirmed by Moody’s and S&P in February 2016
Moody’s reviewed 20 high yield issuers and announced 16 downgrades ranging from 1 to 5 notches
S&P reviewed 45 high yield issuers and announced 25 downgrades ranging from 1 to 3 notches
Antero was one of only five Baa and Ba companies that received an “affirmed” rating from Moody’s
AR
Rating Affirmed
Baa1
Baa2
Baa3
Ba1
Ba2
Ba3
B1
B2
B3
Caa1
Caa2
Caa3
Gray – Previous RatingRed – New Rating
Appalachian Company
9
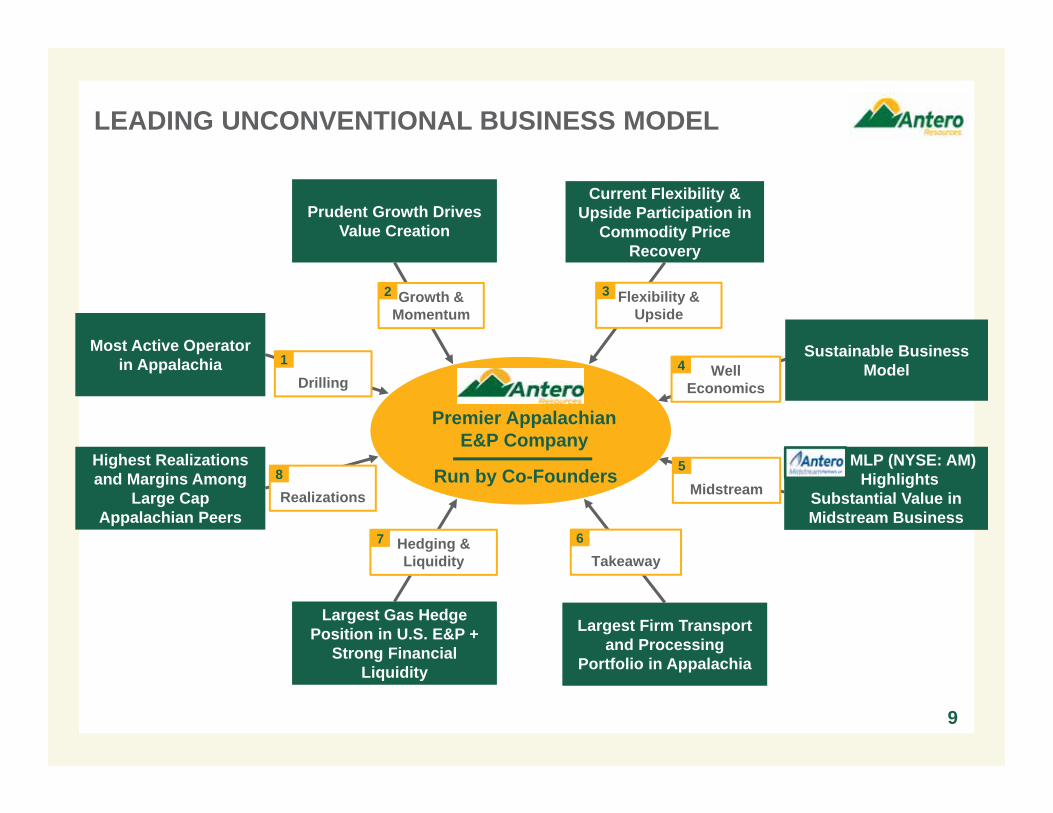
Most Active Operatorin Appalachia
Largest Firm Transport and Processing
Portfolio in Appalachia
Largest Gas Hedge Position in U.S. E&P +
Strong Financial Liquidity
Prudent Growth Drives Value Creation
Current Flexibility & Upside Participation in
Commodity Price Recovery
Highest Realizations and Margins Among
Large Cap Appalachian Peers
Growth & Momentum
Flexibility & Upside
Hedging &Liquidity
Midstream
Drilling
LEADING UNCONVENTIONAL BUSINESS MODEL
MLP (NYSE: AM)Highlights
Substantial Value in Midstream Business
Realizations
Takeaway
Well Economics
1
2 3
4
5
67
8
Premier AppalachianE&P Company
Run by Co-Founders
Sustainable Business Model
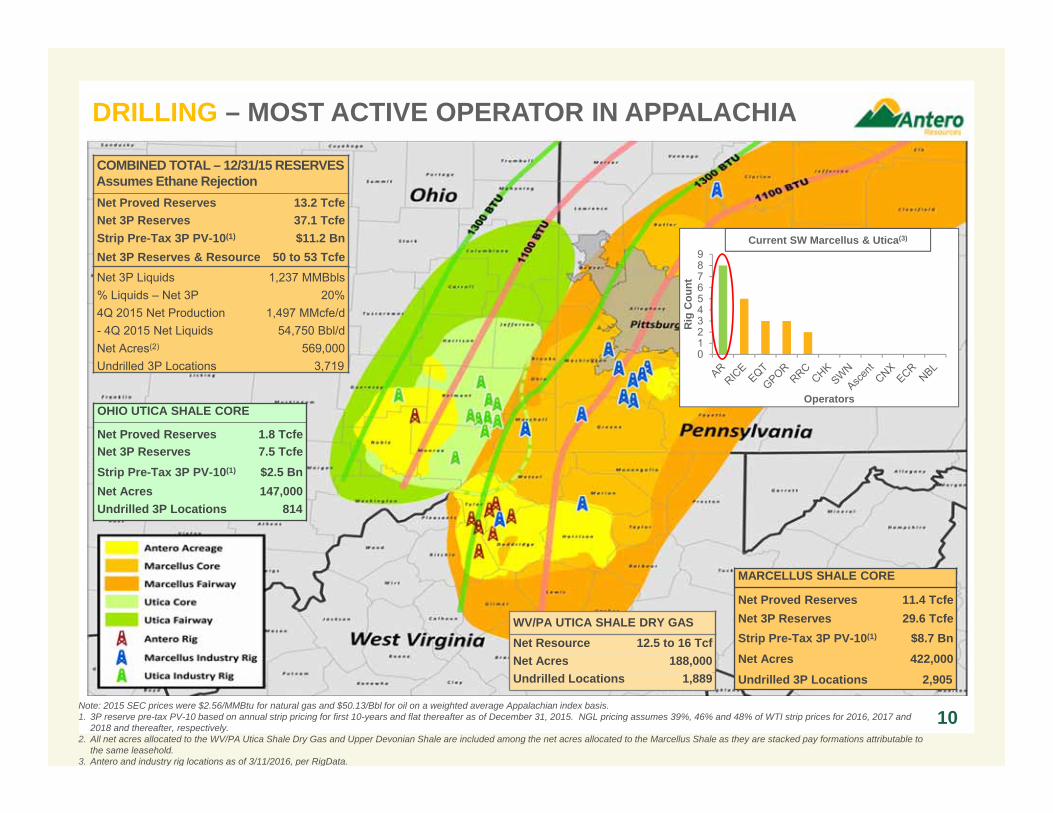
Note: 2015 SEC prices were $2.56/MMBtu for natural gas and $50.13/Bbl for oil on a weighted average Appalachian index basis. 1. 3P reserve pre-tax PV-10 based on annual strip pricing for first 10-years and flat thereafter as of December 31, 2015. NGL pricing assumes 39%, 46% and 48% of WTI strip prices for 2016, 2017 and
2018 and thereafter, respectively. 2. All net acres allocated to the WV/PA Utica Shale Dry Gas and Upper Devonian Shale are included among the net acres allocated to the Marcellus Shale as they are stacked pay formations attributable to
the same leasehold. 3. Antero and industry rig locations as of 3/11/2016, per RigData.
DRILLING – MOST ACTIVE OPERATOR IN APPALACHIA
10
COMBINED TOTAL – 12/31/15 RESERVESAssumes Ethane RejectionNet Proved Reserves 13.2 TcfeNet 3P Reserves 37.1 TcfeStrip Pre-Tax 3P PV-10(1) $11.2 BnNet 3P Reserves & Resource 50 to 53 TcfeNet 3P Liquids 1,237 MMBbls% Liquids – Net 3P 20%4Q 2015 Net Production 1,497 MMcfe/d- 4Q 2015 Net Liquids 54,750 Bbl/dNet Acres(2) 569,000Undrilled 3P Locations 3,719
OHIO UTICA SHALE CORE
Net Proved Reserves 1.8 TcfeNet 3P Reserves 7.5 TcfeStrip Pre-Tax 3P PV-10(1) $2.5 BnNet Acres 147,000Undrilled 3P Locations 814
MARCELLUS SHALE CORE
Net Proved Reserves 11.4 TcfeNet 3P Reserves 29.6 TcfeStrip Pre-Tax 3P PV-10(1) $8.7 BnNet Acres 422,000Undrilled 3P Locations 2,905
WV/PA UTICA SHALE DRY GASNet Resource 12.5 to 16 TcfNet Acres 188,000Undrilled Locations 1,889
0123456789
Rig
Cou
nt
Operators
Current SW Marcellus & Utica(3)
Utica Marcellus2014 2015 Q1 2016 Q1 2016 vs. 2014 2014 2015 Q1 2016 Q1 2016 vs. 2014
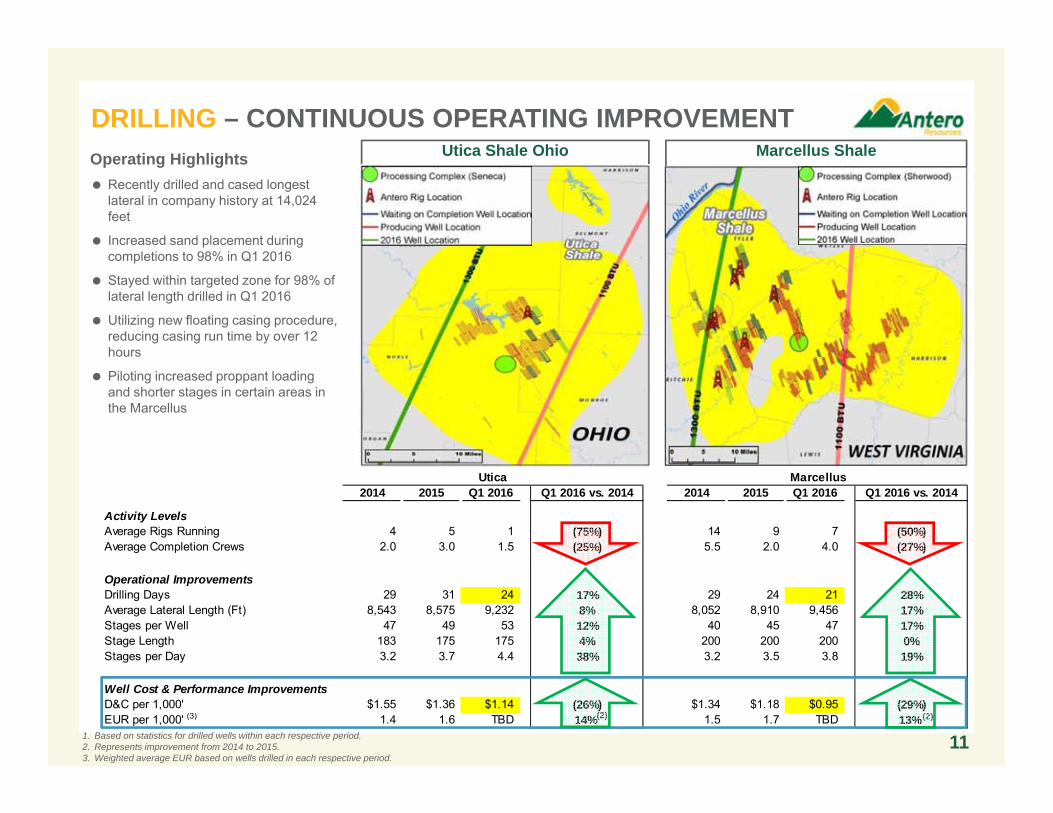
Activity LevelsAverage Rigs Running 4 5 1 (75%) 14 9 7 (50%)Average Completion Crews 2.0 3.0 1.5 (25%) 5.5 2.0 4.0 (27%)
Operational ImprovementsDrilling Days 29 31 24 17% 29 24 21 28%Average Lateral Length (Ft) 8,543 8,575 9,232 8% 8,052 8,910 9,456 17%Stages per Well 47 49 53 12% 40 45 47 17%Stage Length 183 175 175 4% 200 200 200 0%Stages per Day 3.2 3.7 4.4 38% 3.2 3.5 3.8 19%
Well Cost & Performance ImprovementsD&C per 1,000' $1.55 $1.36 $1.14 (26%) $1.34 $1.18 $0.95 (29%)EUR per 1,000' (3) 1.4 1.6 TBD 14% 1.5 1.7 TBD 13%
Marcellus ShaleUtica Shale Ohio
DRILLING – CONTINUOUS OPERATING IMPROVEMENT
11
Operating Highlights Recently drilled and cased longest
lateral in company history at 14,024 feet
Increased sand placement during completions to 98% in Q1 2016
Stayed within targeted zone for 98% of lateral length drilled in Q1 2016
Utilizing new floating casing procedure, reducing casing run time by over 12 hours
Piloting increased proppant loading and shorter stages in certain areas in the Marcellus
(2) (2)
1. Based on statistics for drilled wells within each respective period. 2. Represents improvement from 2014 to 2015.3. Weighted average EUR based on wells drilled in each respective period.
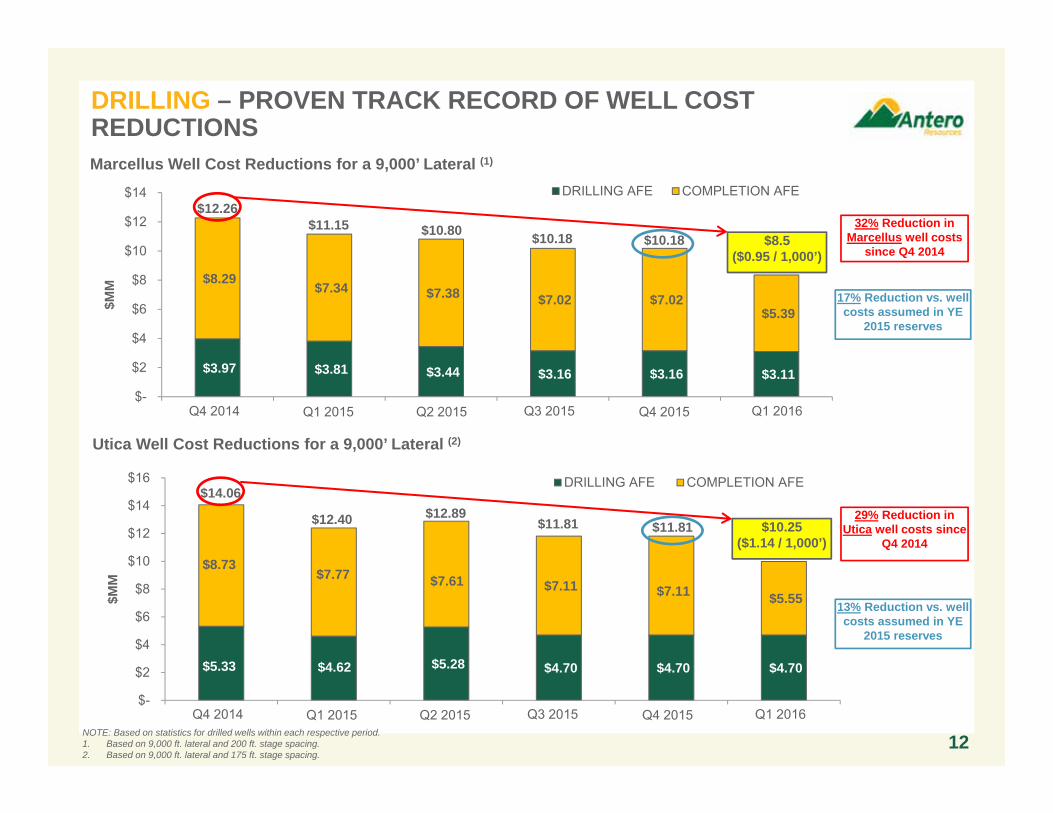
DRILLING – PROVEN TRACK RECORD OF WELL COST REDUCTIONS
12
Marcellus Well Cost Reductions for a 9,000’ Lateral (1)
NOTE: Based on statistics for drilled wells within each respective period.1. Based on 9,000 ft. lateral and 200 ft. stage spacing.2. Based on 9,000 ft. lateral and 175 ft. stage spacing.
$5.33 $4.62 $5.28 $4.70 $4.70 $4.70
$8.73 $7.77 $7.61 $7.11 $7.11 $5.55
$-
$2
$4
$6
$8
$10
$12
$14
$16
2014 Q4 2015 Q1 2015 Q2 2015 Q3 2015 Q4 2016 Q1
$MM
DRILLING AFE COMPLETION AFE$14.06
$12.40 $12.89$11.81 $11.81
29% Reduction in Utica well costs since
Q4 2014
Utica Well Cost Reductions for a 9,000’ Lateral (2)
$3.97 $3.81 $3.44 $3.16 $3.16 $3.11
$8.29 $7.34 $7.38 $7.02 $7.02 $5.39
$-
$2
$4
$6
$8
$10
$12
$14
2014 Q4 2015 Q1 2015 Q2 2015 Q3 2015 Q4 2016 Q1
$MM
DRILLING AFE COMPLETION AFE$12.26
$11.15 $10.80 $10.18 $10.18 $8.5($0.95 / 1,000’)
32% Reduction in Marcellus well costs
since Q4 2014
17% Reduction vs. well costs assumed in YE
2015 reserves
13% Reduction vs. well costs assumed in YE
2015 reserves
$10.25($1.14 / 1,000’)
Q4 2014 Q1 2015 Q2 2015 Q3 2015 Q4 2015 Q1 2016
Q4 2014 Q1 2015 Q2 2015 Q3 2015 Q4 2015 Q1 2016
3.8x
4.9x
0.6x
1.5x
3.0x3.4x
3.9x
4.8x
1.2x1.9x
4.7x
0.0x
1.0x
2.0x
3.0x
4.0x
5.0x
6.0x
AR Peer 1 Peer 2 Peer 3 Peer 4 Peer 5
2015 Leverage 2016E Leverage
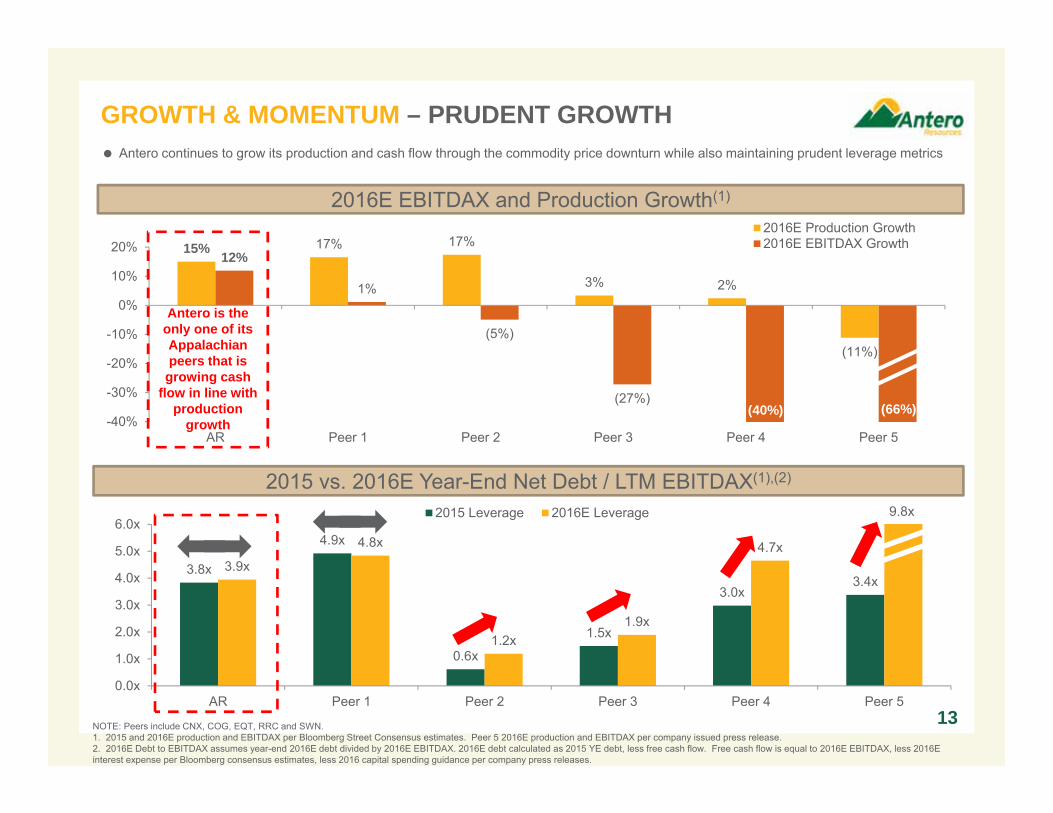
15% 17% 17%
3% 2%
(11%)
12%
1%
(5%)
(27%)
-40%
-30%
-20%
-10%
0%
10%
20%
AR Peer 1 Peer 2 Peer 3 Peer 4 Peer 5
2016E Production Growth2016E EBITDAX Growth
GROWTH & MOMENTUM – PRUDENT GROWTH
13
2015 vs. 2016E Year-End Net Debt / LTM EBITDAX(1),(2)
NOTE: Peers include CNX, COG, EQT, RRC and SWN.1. 2015 and 2016E production and EBITDAX per Bloomberg Street Consensus estimates. Peer 5 2016E production and EBITDAX per company issued press release. 2. 2016E Debt to EBITDAX assumes year-end 2016E debt divided by 2016E EBITDAX. 2016E debt calculated as 2015 YE debt, less free cash flow. Free cash flow is equal to 2016E EBITDAX, less 2016E interest expense per Bloomberg consensus estimates, less 2016 capital spending guidance per company press releases.
9.8x
Antero continues to grow its production and cash flow through the commodity price downturn while also maintaining prudent leverage metrics
2016E EBITDAX and Production Growth(1)
Antero is the only one of its Appalachian peers that is
growing cash flow in line with
production growth
(66%)(40%)
$3.7 $11.2 $13.9
$20.4 $26.7
$3.1
$2.5 $0.9
($0.3) ($1.6)
$3.0
$3.0 $3.0 $3.0
$3.0
$9.8 $16.7 $17.8
$23.0
$28.1
($5.0)$0.0$5.0
$10.0$15.0$20.0$25.0$30.0$35.0$40.0$45.0
SEC Pricing 12/31/2015 Strip $60 Oil $67.50 Oil $75 Oil
$3.50 Gas $4.00 Gas $4.50 Gas
AR Ownership in AM shares ($B)
Hedge Value Pre-Tax PV-10 ($B)
3P Reserves Pre-Tax PV-10 ($B)
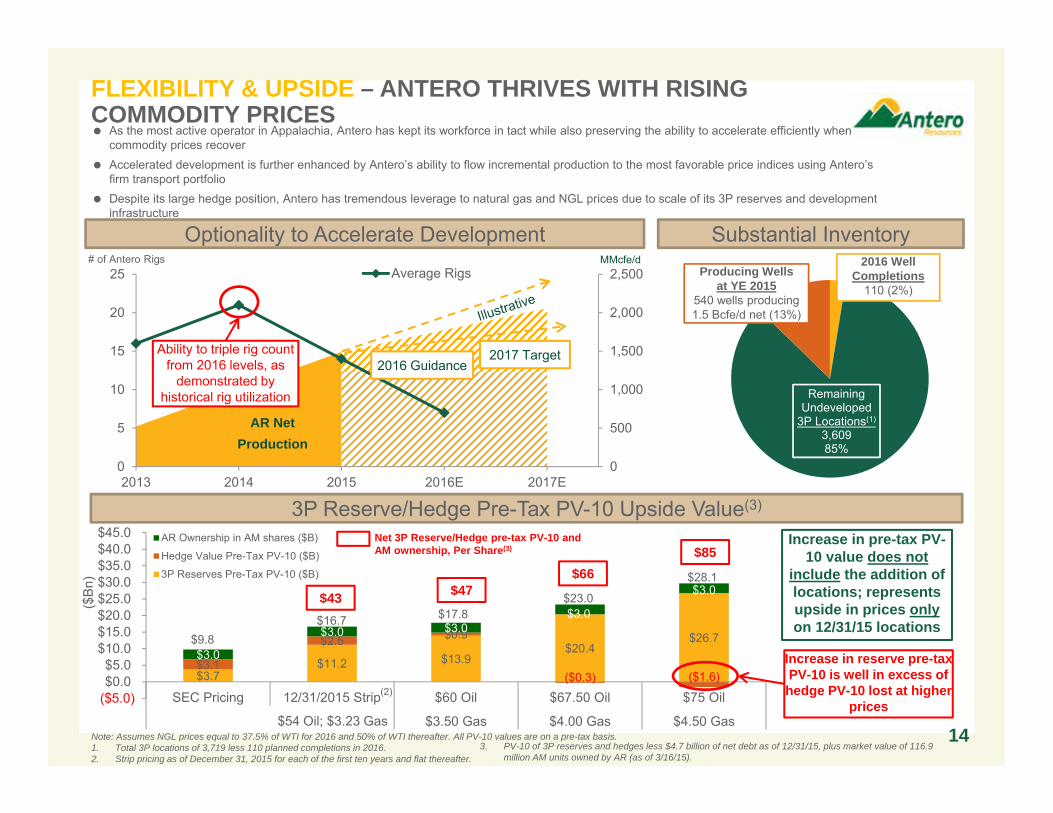
FLEXIBILITY & UPSIDE – ANTERO THRIVES WITH RISING COMMODITY PRICES
14
As the most active operator in Appalachia, Antero has kept its workforce in tact while also preserving the ability to accelerate efficiently when commodity prices recover
Accelerated development is further enhanced by Antero’s ability to flow incremental production to the most favorable price indices using Antero’s firm transport portfolio
Despite its large hedge position, Antero has tremendous leverage to natural gas and NGL prices due to scale of its 3P reserves and development infrastructure
Net 3P Reserve/Hedge pre-tax PV-10 and AM ownership, Per Share(3)
$47$66
$85Increase in pre-tax PV-
10 value does not include the addition of locations; represents upside in prices onlyon 12/31/15 locations
Note: Assumes NGL prices equal to 37.5% of WTI for 2016 and 50% of WTI thereafter. All PV-10 values are on a pre-tax basis.1. Total 3P locations of 3,719 less 110 planned completions in 2016.2. Strip pricing as of December 31, 2015 for each of the first ten years and flat thereafter.
$54 Oil; $3.23 Gas
Increase in reserve pre-tax PV-10 is well in excess of hedge PV-10 lost at higher
prices
3P Reserve/Hedge Pre-Tax PV-10 Upside Value(3)
Substantial InventoryOptionality to Accelerate Development
$43
Remaining Undeveloped
3P Locations(1)
3,60985%
Producing Wells at YE 2015
540 wells producing 1.5 Bcfe/d net (13%)
2016 Well Completions
110 (2%)
3. PV-10 of 3P reserves and hedges less $4.7 billion of net debt as of 12/31/15, plus market value of 116.9 million AM units owned by AR (as of 3/16/15).
(2)
0
500
1,000
1,500
2,000
2,500
0
5
10
15
20
25
2013 2014 2015 2016E 2017E
Average Rigs
Ability to triple rig count from 2016 levels, as
demonstrated by historical rig utilization
# of Antero Rigs MMcfe/d
AR Net Production
2016 Guidance2017 Target
($B
n)
29% 27% 24%
37%
28% 25%
13% 10% 11%
85% 82%
73% 70%
62%
52%
32% 27%
17%
0%
10%
20%
30%
40%
50%
60%
70%
80%
90%
100%
Utica Highly-Rich Gas
Utica Dry Gas - Ohio
Utica Rich Gas MarcellusHighly-Rich
Gas/Condensate
Utica Highly-Rich Gas/
Condensate
MarcellusHighly-Rich
Gas
Marcellus DryGas
Marcellus RichGas
UticaCondensate
RO
R
ROR @ 12/31/2015 Strip Pricing - Before Hedges ROR @ 12/31/2015 Strip Pricing - After Hedges
2016 and 2017 Antero Drilling Plan
ANTERO MARCELLUS & UTICA WELL ECONOMICS(1)(2)
108 263 161 626 98 971 755 553 184
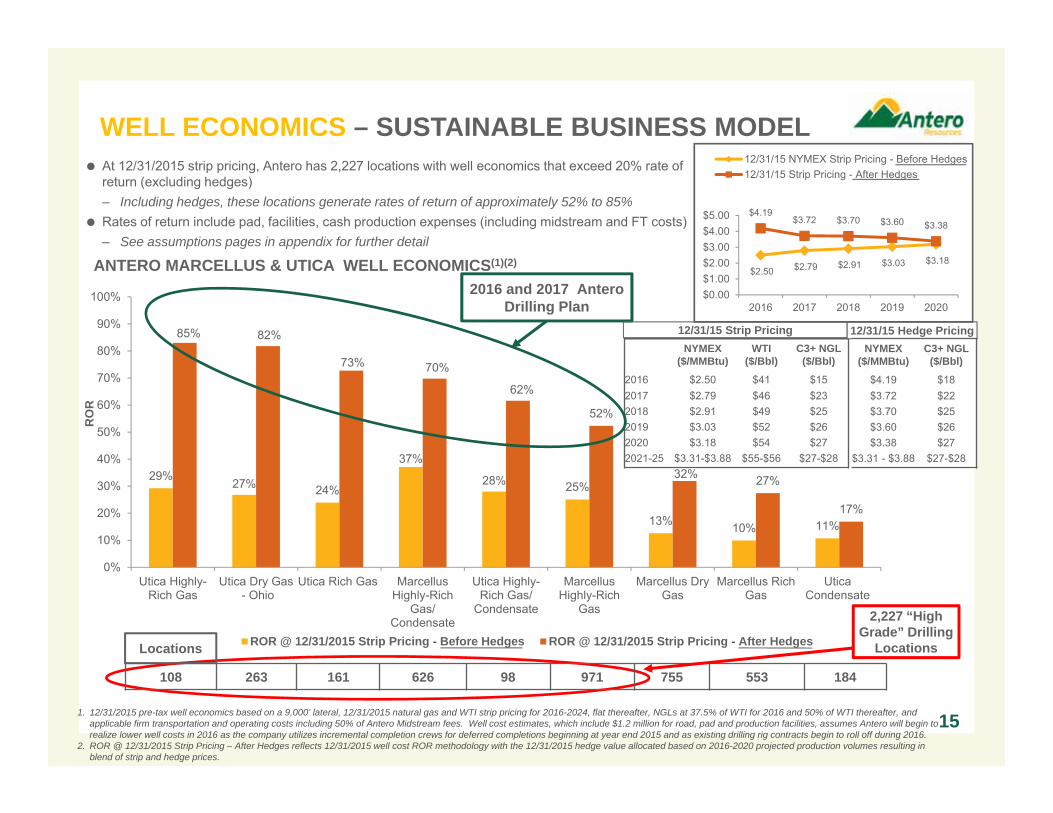
1. 12/31/2015 pre-tax well economics based on a 9,000’ lateral, 12/31/2015 natural gas and WTI strip pricing for 2016-2024, flat thereafter, NGLs at 37.5% of WTI for 2016 and 50% of WTI thereafter, and applicable firm transportation and operating costs including 50% of Antero Midstream fees. Well cost estimates, which include $1.2 million for road, pad and production facilities, assumes Antero will begin to realize lower well costs in 2016 as the company utilizes incremental completion crews for deferred completions beginning at year end 2015 and as existing drilling rig contracts begin to roll off during 2016.
2. ROR @ 12/31/2015 Strip Pricing – After Hedges reflects 12/31/2015 well cost ROR methodology with the 12/31/2015 hedge value allocated based on 2016-2020 projected production volumes resulting in blend of strip and hedge prices.
15
At 12/31/2015 strip pricing, Antero has 2,227 locations with well economics that exceed 20% rate of return (excluding hedges)– Including hedges, these locations generate rates of return of approximately 52% to 85%
Rates of return include pad, facilities, cash production expenses (including midstream and FT costs)– See assumptions pages in appendix for further detail
2,227 “High Grade” Drilling
Locations
NYMEX($/MMBtu)
WTI($/Bbl)
C3+ NGL($/Bbl)
2016 $2.50 $41 $152017 $2.79 $46 $232018 $2.91 $49 $252019 $3.03 $52 $262020 $3.18 $54 $272021-25 $3.31-$3.88 $55-$56 $27-$28
12/31/15 Strip Pricing 12/31/15 Hedge PricingNYMEX
($/MMBtu)C3+ NGL
($/Bbl)
$4.19 $18$3.72 $22$3.70 $25$3.60 $26$3.38 $27
$3.31 - $3.88 $27-$28
$2.50 $2.79 $2.91 $3.03 $3.18
$4.19$3.72 $3.70 $3.60 $3.38
$0.00$1.00$2.00$3.00$4.00$5.00
2016 2017 2018 2019 2020
12/31/15 NYMEX Strip Pricing - Before Hedges12/31/15 Strip Pricing - After Hedges
Locations
WELL ECONOMICS – SUSTAINABLE BUSINESS MODEL
0
500
1,000
1,500
2,000
2,500
3,000
3,500
4,000 Proved Developed Production (BBtu/d)
Undeveloped Production (BBtu/d)
Hedged Volume (BBtu/d)
WELL ECONOMICS – HEDGING UNDEVELOPED PRODUCTION
161. Represents illustrative Antero production forecast, adjusted for residue gas BTU content of 1100 BTU.
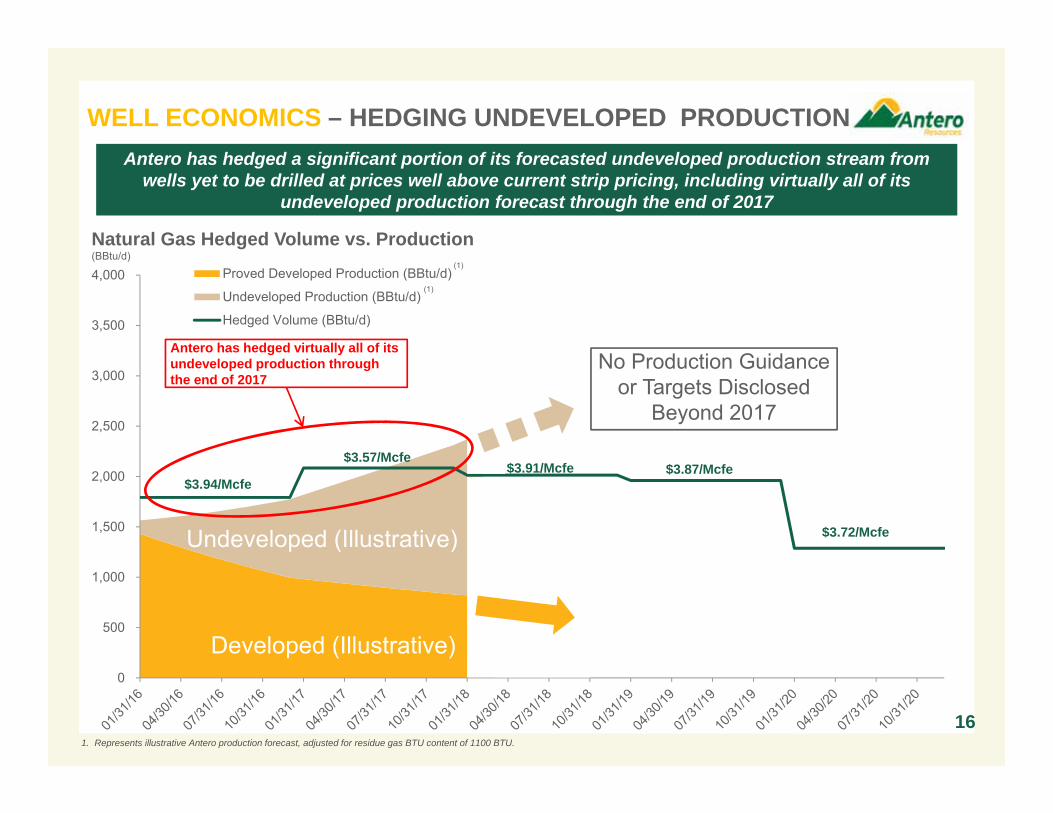
Antero has hedged a significant portion of its forecasted undeveloped production stream from wells yet to be drilled at prices well above current strip pricing, including virtually all of its
undeveloped production forecast through the end of 2017
Natural Gas Hedged Volume vs. Production(BBtu/d)
(1)
(1)
Antero has hedged virtually all of its undeveloped production through the end of 2017
Developed (Illustrative)
Undeveloped (Illustrative)
$3.94/Mcfe
$3.57/Mcfe$3.91/Mcfe $3.87/Mcfe
$3.72/Mcfe
No Production Guidance or Targets Disclosed
Beyond 2017
Antero ResourcesCorporation (NYSE: AR)
$10.9 Billion Enterprise Value(1)
Ba2/BB Corporate Rating
Antero MidstreamPartners LP (NYSE: AM)
$5.1 Billion Enterprise Value
66% LP Interest$3.0 Billion MV
$11.2 Bn 3P PV-10(3)
E&P Assets
Gathering/Compression Assets
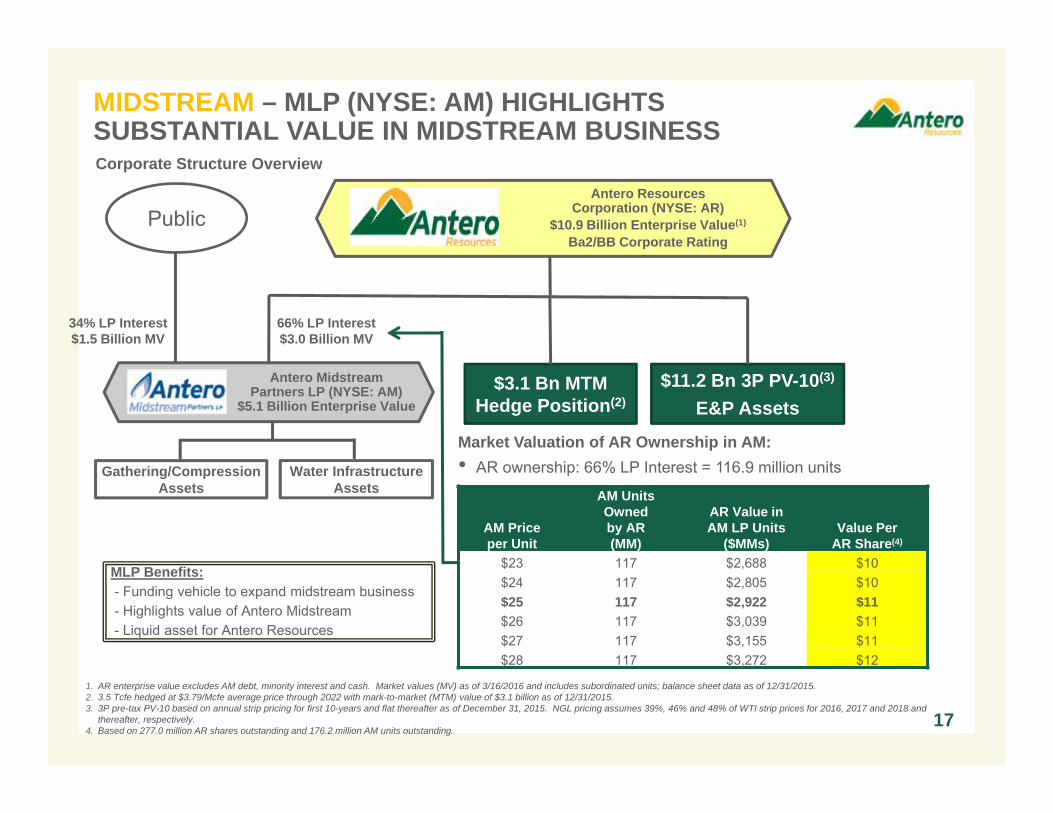
MIDSTREAM – MLP (NYSE: AM) HIGHLIGHTSSUBSTANTIAL VALUE IN MIDSTREAM BUSINESS
1. AR enterprise value excludes AM debt, minority interest and cash. Market values (MV) as of 3/16/2016 and includes subordinated units; balance sheet data as of 12/31/2015. 2. 3.5 Tcfe hedged at $3.79/Mcfe average price through 2022 with mark-to-market (MTM) value of $3.1 billion as of 12/31/2015. 3. 3P pre-tax PV-10 based on annual strip pricing for first 10-years and flat thereafter as of December 31, 2015. NGL pricing assumes 39%, 46% and 48% of WTI strip prices for 2016, 2017 and 2018 and
thereafter, respectively. 4. Based on 277.0 million AR shares outstanding and 176.2 million AM units outstanding.
17
Corporate Structure Overview
Market Valuation of AR Ownership in AM:• AR ownership: 66% LP Interest = 116.9 million units
AM Priceper Unit
AM UnitsOwnedby AR(MM)
AR Value in AM LP Units
($MMs)Value Per
AR Share(4)
$23 117 $2,688 $10$24 117 $2,805 $10$25 117 $2,922 $11$26 117 $3,039 $11$27 117 $3,155 $11$28 117 $3,272 $12
Water Infrastructure Assets
MLP Benefits:- Funding vehicle to expand midstream business- Highlights value of Antero Midstream- Liquid asset for Antero Resources
Public
34% LP Interest$1.5 Billion MV
$3.1 Bn MTM Hedge Position(2)
TAKEAWAY – LARGEST FT AND PROCESSING PORTFOLIO IN APPALACHIA
Antero Long Term Firm Processing & Takeaway Position (YE 2018) – Accessing Favorable MarketsMariner East 2
62 MBbl/d CommitmentMarcus Hook Export
Shell20 MBbl/d Commitment
Beaver County Cracker (2)
Sabine Pass (Trains 1-4)50 MMcf/d per Train
Lake Charles LNG(3)
150 MMcf/d
Freeport LNG70 MMcf/d
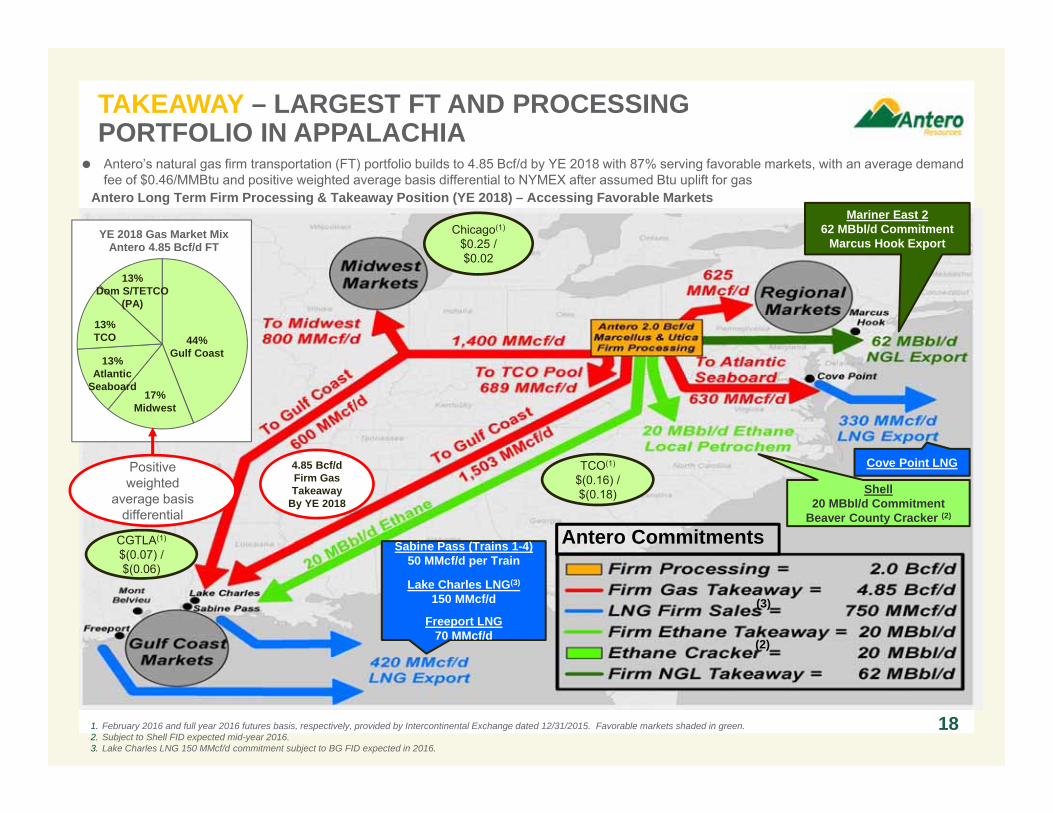
1. February 2016 and full year 2016 futures basis, respectively, provided by Intercontinental Exchange dated 12/31/2015. Favorable markets shaded in green.2. Subject to Shell FID expected mid-year 2016.3. Lake Charles LNG 150 MMcf/d commitment subject to BG FID expected in 2016.
Chicago(1)
$0.25 / $0.02
CGTLA(1)
$(0.07) / $(0.06)
TCO(1)
$(0.16) / $(0.18)
18
Cove Point LNG4.85 Bcf/dFirm GasTakeaway
By YE 2018
Antero’s natural gas firm transportation (FT) portfolio builds to 4.85 Bcf/d by YE 2018 with 87% serving favorable markets, with an average demand fee of $0.46/MMBtu and positive weighted average basis differential to NYMEX after assumed Btu uplift for gas
YE 2018 Gas Market MixAntero 4.85 Bcf/d FT
44%Gulf Coast
17%Midwest
13%Atlantic
Seaboard
13%Dom S/TETCO
(PA)
13%TCO
Positive weighted
average basis differential
Antero Commitments
(3)
(2)
-
500,000
1,000,000
1,500,000
2,000,000
2,500,000
3,000,000
3,500,000
4,000,000
4,500,000
5,000,000
5,500,000
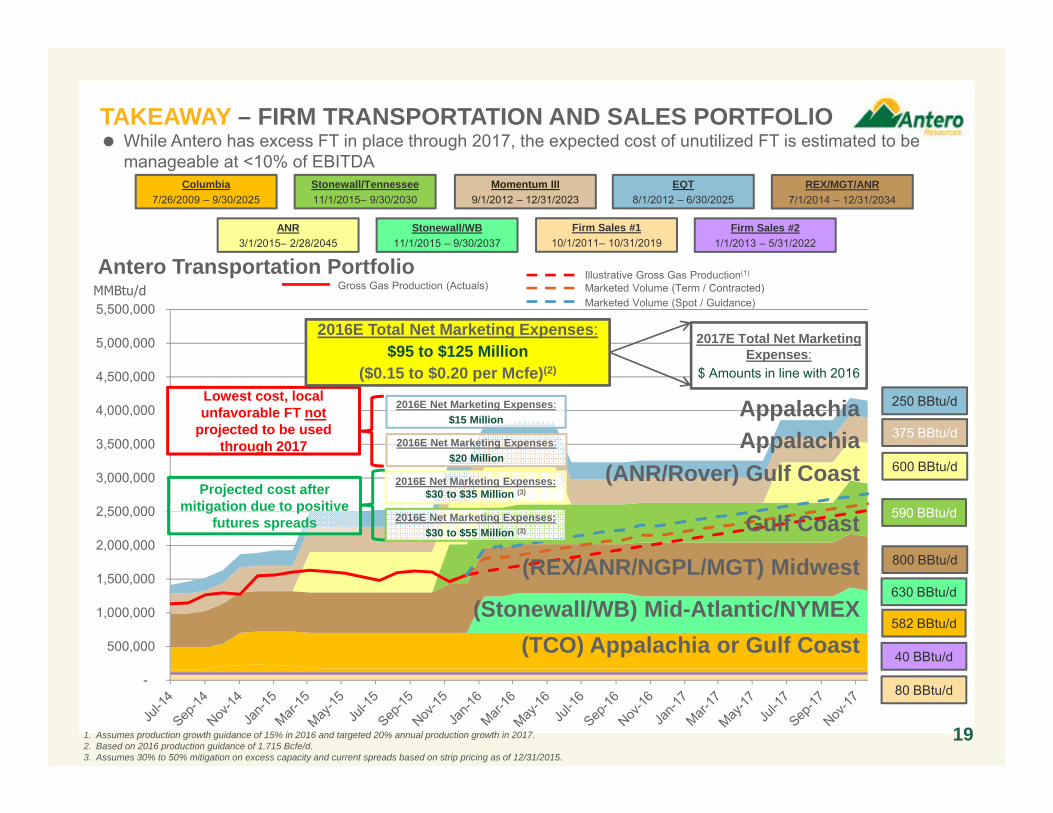
TAKEAWAY – FIRM TRANSPORTATION AND SALES PORTFOLIO
19
MMBtu/d
Columbia7/26/2009 – 9/30/2025
Momentum III9/1/2012 – 12/31/2023
EQT8/1/2012 – 6/30/2025
REX/MGT/ANR7/1/2014 – 12/31/2034
Stonewall/Tennessee11/1/2015– 9/30/2030
(Stonewall/WB) Mid-Atlantic/NYMEX
Gulf Coast
(TCO) Appalachia or Gulf Coast
AppalachiaAppalachia
(REX/ANR/NGPL/MGT) Midwest
Firm Sales #110/1/2011– 10/31/2019
Firm Sales #21/1/2013 – 5/31/2022
ANR3/1/2015– 2/28/2045
Stonewall/WB11/1/2015 – 9/30/2037
(ANR/Rover) Gulf Coast
Antero Transportation Portfolio
582 BBtu/d
590 BBtu/d
375 BBtu/d
250 BBtu/d
800 BBtu/d
600 BBtu/d
630 BBtu/d
40 BBtu/d
Gross Gas Production (Actuals)Illustrative Gross Gas Production(1)
1. Assumes production growth guidance of 15% in 2016 and targeted 20% annual production growth in 2017.2. Based on 2016 production guidance of 1.715 Bcfe/d.3. Assumes 30% to 50% mitigation on excess capacity and current spreads based on strip pricing as of 12/31/2015.
Lowest cost, local unfavorable FT not
projected to be used through 2017
2016E Net Marketing Expenses:$15 Million
2016E Net Marketing Expenses:$20 Million
2016E Net Marketing Expenses:$30 to $35 Million (3)
2016E Net Marketing Expenses:$30 to $55 Million (3)
2016E Total Net Marketing Expenses:$95 to $125 Million
($0.15 to $0.20 per Mcfe)(2)
2017E Total Net Marketing Expenses:
$ Amounts in line with 2016
While Antero has excess FT in place through 2017, the expected cost of unutilized FT is estimated to be manageable at <10% of EBITDA
Projected cost after mitigation due to positive
futures spreads
Marketed Volume (Term / Contracted)Marketed Volume (Spot / Guidance)
80 BBtu/d
$0.00
$1.00
$2.00
$3.00
$4.00
$5.00
$6.00
$0
$50
$100
$150
$200
$250
$MM
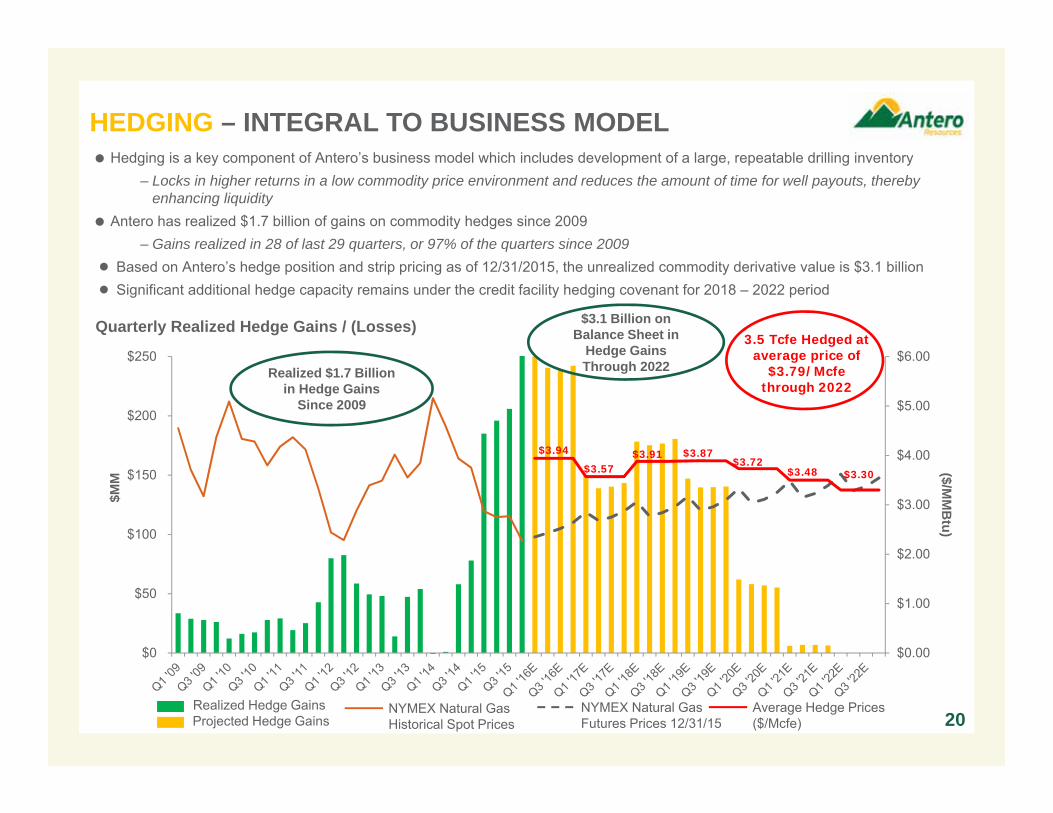
20
HEDGING – INTEGRAL TO BUSINESS MODEL Hedging is a key component of Antero’s business model which includes development of a large, repeatable drilling inventory
– Locks in higher returns in a low commodity price environment and reduces the amount of time for well payouts, thereby enhancing liquidity
Antero has realized $1.7 billion of gains on commodity hedges since 2009– Gains realized in 28 of last 29 quarters, or 97% of the quarters since 2009
● Based on Antero’s hedge position and strip pricing as of 12/31/2015, the unrealized commodity derivative value is $3.1 billion● Significant additional hedge capacity remains under the credit facility hedging covenant for 2018 – 2022 period
Quarterly Realized Hedge Gains / (Losses)
Realized Hedge GainsProjected Hedge Gains
NYMEX Natural Gas Historical Spot Prices
($/MM
Btu)
NYMEX Natural Gas Futures Prices 12/31/15
3.5 Tcfe Hedged at average price of
$3.79/Mcfethrough 2022
Average Hedge Prices ($/Mcfe)
$3.48
$3.94
$3.57$3.91 $3.87
$3.72$3.30
$3.1 Billion on Balance Sheet in
Hedge Gains Through 2022Realized $1.7 Billion
in Hedge Gains Since 2009
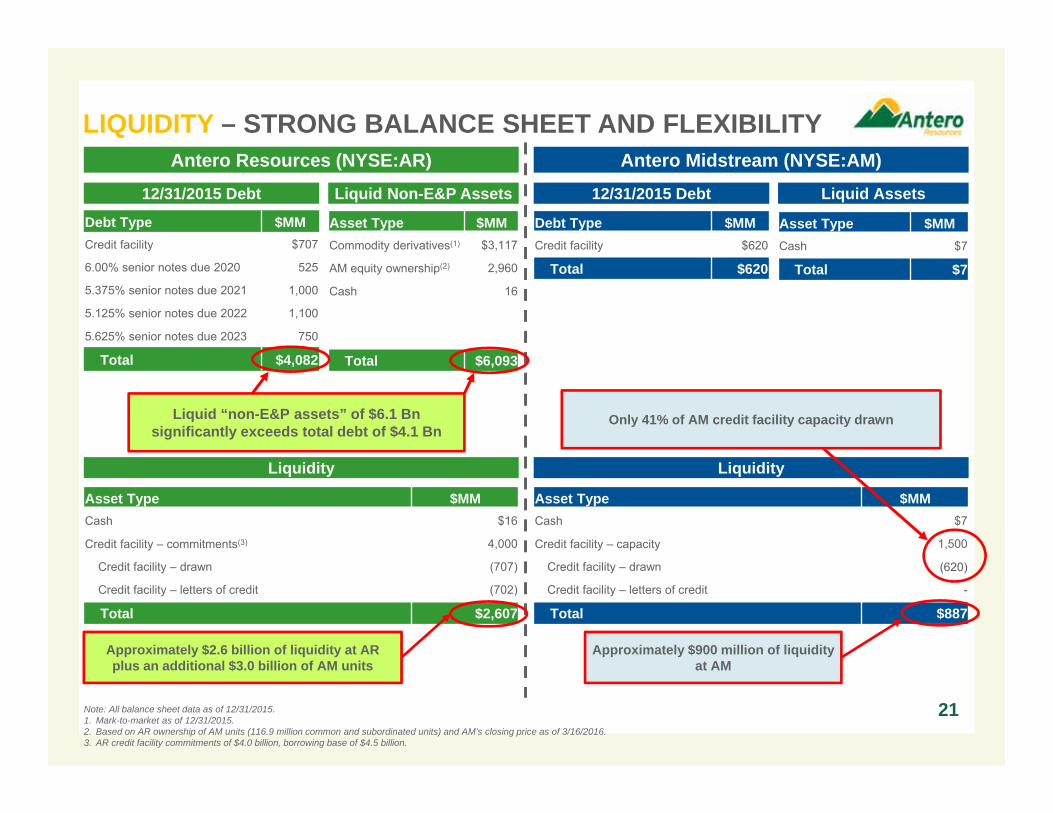
Liquid “non-E&P assets” of $6.1 Bnsignificantly exceeds total debt of $4.1 Bn
Liquidity
LIQUIDITY – STRONG BALANCE SHEET AND FLEXIBILITY Antero Resources (NYSE:AR) Antero Midstream (NYSE:AM)
12/31/2015 Debt Liquid Non-E&P Assets 12/31/2015 Debt Liquid Assets
Debt Type $MMCredit facility $707
6.00% senior notes due 2020 525
5.375% senior notes due 2021 1,000
5.125% senior notes due 2022 1,100
5.625% senior notes due 2023 750
Total $4,082
Asset Type $MMCommodity derivatives(1) $3,117
AM equity ownership(2) 2,960
Cash 16
Total $6,093
Asset Type $MMCash $16
Credit facility – commitments(3) 4,000
Credit facility – drawn (707)
Credit facility – letters of credit (702)
Total $2,607
Debt Type $MMCredit facility $620
Total $620
Asset Type $MMCash $7
Total $7
Liquidity
Asset Type $MMCash $7
Credit facility – capacity 1,500
Credit facility – drawn (620)
Credit facility – letters of credit -
Total $887
Approximately $2.6 billion of liquidity at AR plus an additional $3.0 billion of AM units
Approximately $900 million of liquidityat AM
21
Only 41% of AM credit facility capacity drawn
Note: All balance sheet data as of 12/31/2015. 1. Mark-to-market as of 12/31/2015.2. Based on AR ownership of AM units (116.9 million common and subordinated units) and AM’s closing price as of 3/16/2016.3. AR credit facility commitments of $4.0 billion, borrowing base of $4.5 billion.
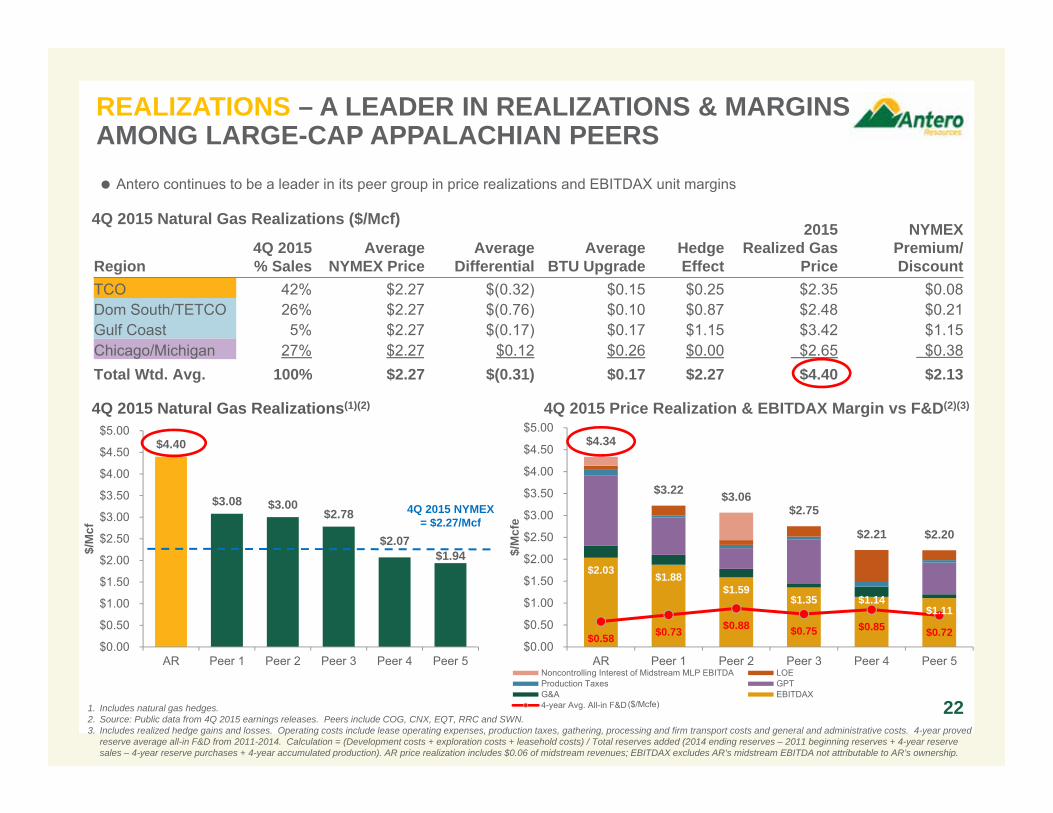
Region4Q 2015 % Sales
Average NYMEX Price
AverageDifferential
AverageBTU Upgrade
Hedge Effect
2015Realized Gas
Price
NYMEX Premium/Discount
TCO 42% $2.27 $(0.32) $0.15 $0.25 $2.35 $0.08Dom South/TETCO 26% $2.27 $(0.76) $0.10 $0.87 $2.48 $0.21Gulf Coast 5% $2.27 $(0.17) $0.17 $1.15 $3.42 $1.15Chicago/Michigan 27% $2.27 $0.12 $0.26 $0.00 $2.65 $0.38Total Wtd. Avg. 100% $2.27 $(0.31) $0.17 $2.27 $4.40 $2.13
$2.03 $1.88 $1.59
$1.35 $1.14 $1.11
$0.58 $0.73 $0.88 $0.75 $0.85 $0.72
$4.34
$3.22 $3.06 $2.75
$2.21 $2.20
$0.00
$0.50
$1.00
$1.50
$2.00
$2.50
$3.00
$3.50
$4.00
$4.50
$5.00
AR Peer 1 Peer 2 Peer 3 Peer 4 Peer 5
$/M
cfe
Noncontrolling Interest of Midstream MLP EBITDA LOEProduction Taxes GPTG&A EBITDAX4-year Avg. All-in F&D
$4.40
$3.08 $3.00 $2.78
$2.07 $1.94
$0.00
$0.50
$1.00
$1.50
$2.00
$2.50
$3.00
$3.50
$4.00
$4.50
$5.00
AR Peer 1 Peer 2 Peer 3 Peer 4 Peer 5
$/M
cf
1. Includes natural gas hedges.2. Source: Public data from 4Q 2015 earnings releases. Peers include COG, CNX, EQT, RRC and SWN. 3. Includes realized hedge gains and losses. Operating costs include lease operating expenses, production taxes, gathering, processing and firm transport costs and general and administrative costs. 4-year proved
reserve average all-in F&D from 2011-2014. Calculation = (Development costs + exploration costs + leasehold costs) / Total reserves added (2014 ending reserves – 2011 beginning reserves + 4-year reserve sales – 4-year reserve purchases + 4-year accumulated production). AR price realization includes $0.06 of midstream revenues; EBITDAX excludes AR’s midstream EBITDA not attributable to AR’s ownership.
22
REALIZATIONS – A LEADER IN REALIZATIONS & MARGINSAMONG LARGE-CAP APPALACHIAN PEERS
4Q 2015 Natural Gas Realizations(1)(2) 4Q 2015 Price Realization & EBITDAX Margin vs F&D(2)(3)
($/Mcfe)
Antero continues to be a leader in its peer group in price realizations and EBITDAX unit margins
4Q 2015 NYMEX = $2.27/Mcf
4Q 2015 Natural Gas Realizations ($/Mcf)
DOM S 23%
DOM S, 3%
TETCO M27%
TETCO M21%
TCO 40%
TCO 33% TCO, 21%
NYMEX10%
NYMEX10%
NYMEX10%
Gulf Coast2%
Gulf Coast28%
Gulf Coast49%
Chicago18%
Chicago28%
Chicago17%
0%
10%
20%
30%
40%
50%
60%
70%
80%
90%
100%
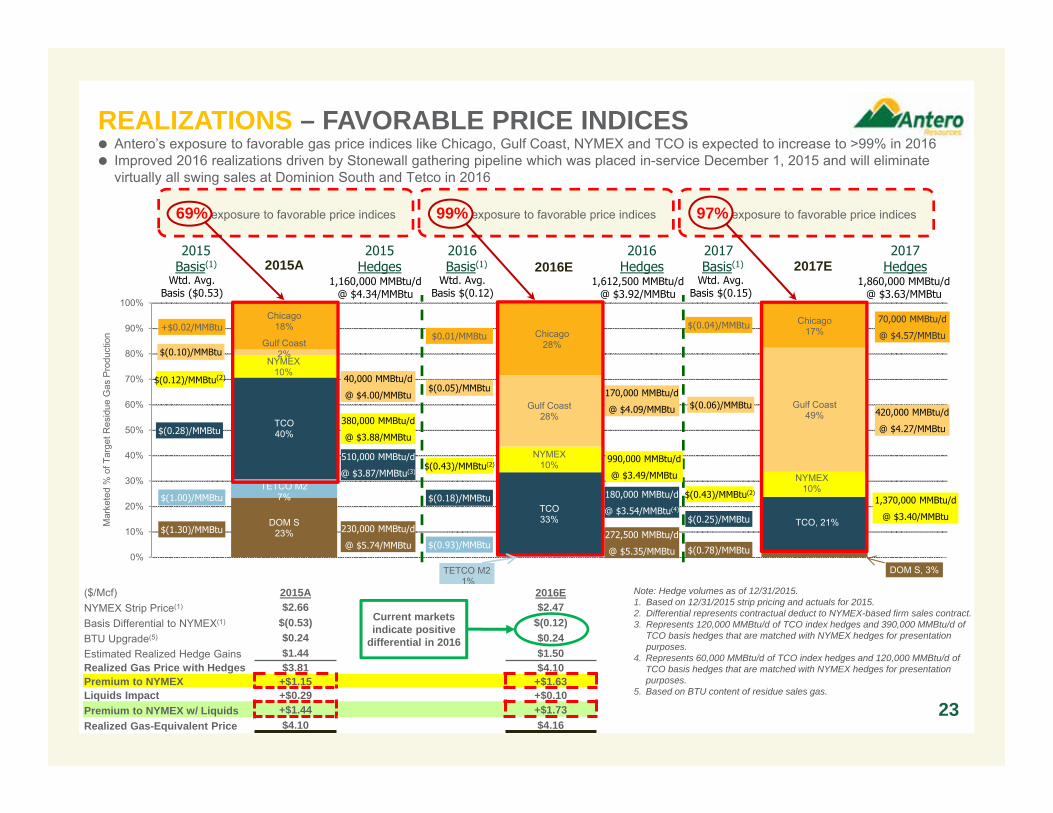
($/Mcf) 2015A 2016ENYMEX Strip Price(1) $2.66 $2.47Basis Differential to NYMEX(1) $(0.53) $(0.12)BTU Upgrade(5) $0.24 $0.24Estimated Realized Hedge Gains $1.44 $1.50 Realized Gas Price with Hedges $3.81 $4.10 Premium to NYMEX +$1.15 +$1.63Liquids Impact +$0.29 +$0.10Premium to NYMEX w/ Liquids +$1.44 +$1.73Realized Gas-Equivalent Price $4.10 $4.16
REALIZATIONS – FAVORABLE PRICE INDICES
Note: Hedge volumes as of 12/31/2015.1. Based on 12/31/2015 strip pricing and actuals for 2015. 2. Differential represents contractual deduct to NYMEX-based firm sales contract.3. Represents 120,000 MMBtu/d of TCO index hedges and 390,000 MMBtu/d of
TCO basis hedges that are matched with NYMEX hedges for presentation purposes.
4. Represents 60,000 MMBtu/d of TCO index hedges and 120,000 MMBtu/d of TCO basis hedges that are matched with NYMEX hedges for presentation purposes.
5. Based on BTU content of residue sales gas.
2015Basis(1)
2016 Basis(1)
2017 Basis(1)
2015Hedges
2016Hedges
2017Hedges
Mar
kete
d %
of T
arge
t Res
idue
Gas
Pro
duct
ion
+$0.02/MMBtu
$(0.12)/MMBtu(2)
$(1.30)/MMBtu
$(0.28)/MMBtu
$0.01/MMBtu
$(0.43)/MMBtu(2)
$(0.18)/MMBtu
$(0.04)/MMBtu
$(0.43)/MMBtu(2)
$(0.78)/MMBtu
$(0.25)/MMBtu
$(0.05)/MMBtu
$(0.06)/MMBtu
1,370,000 MMBtu/d
@ $3.40/MMBtu
40,000 MMBtu/d
@ $4.00/MMBtu
230,000 MMBtu/d
@ $5.74/MMBtu
510,000 MMBtu/d
@ $3.87/MMBtu(3)
170,000 MMBtu/d
@ $4.09/MMBtu
272,500 MMBtu/d
@ $5.35/MMBtu
180,000 MMBtu/d
@ $3.54/MMBtu(4)
99% exposure to favorable price indices69% exposure to favorable price indices 97% exposure to favorable price indices
Antero’s exposure to favorable gas price indices like Chicago, Gulf Coast, NYMEX and TCO is expected to increase to >99% in 2016 Improved 2016 realizations driven by Stonewall gathering pipeline which was placed in-service December 1, 2015 and will eliminate
virtually all swing sales at Dominion South and Tetco in 2016
$(1.00)/MMBtu
$(0.93)/MMBtu
Wtd. Avg.Basis ($0.53)
Wtd. Avg.Basis $(0.12)
1,160,000 MMBtu/d@ $4.34/MMBtu
Wtd. Avg.Basis $(0.15)
1,612,500 MMBtu/d@ $3.92/MMBtu
420,000 MMBtu/d
@ $4.27/MMBtu
2015A 2016E 2017E
23
380,000 MMBtu/d
@ $3.88/MMBtu
990,000 MMBtu/d
@ $3.49/MMBtu
70,000 MMBtu/d
@ $4.57/MMBtu
1,860,000 MMBtu/d@ $3.63/MMBtu
$(0.10)/MMBtu
Current markets indicate positive
differential in 2016
$15.17$21.89
$41.00
$0.00
$10.00
$20.00
$30.00
$40.00
$50.00
$60.00
AR NGL Pricing Mont Belvieu
Realized NGL C3+ Price WTI
$0.59
$0.43 $0.40
$0.41
$0.10
$0.20
$0.30
$0.40
$0.50
$0.60
$0.70
0
5,000
10,000
15,000
20,000
25,000
30,000
35,000
40,000
2016 2017
Hedged Volume Average Hedge Price Strip (12/31/2015)
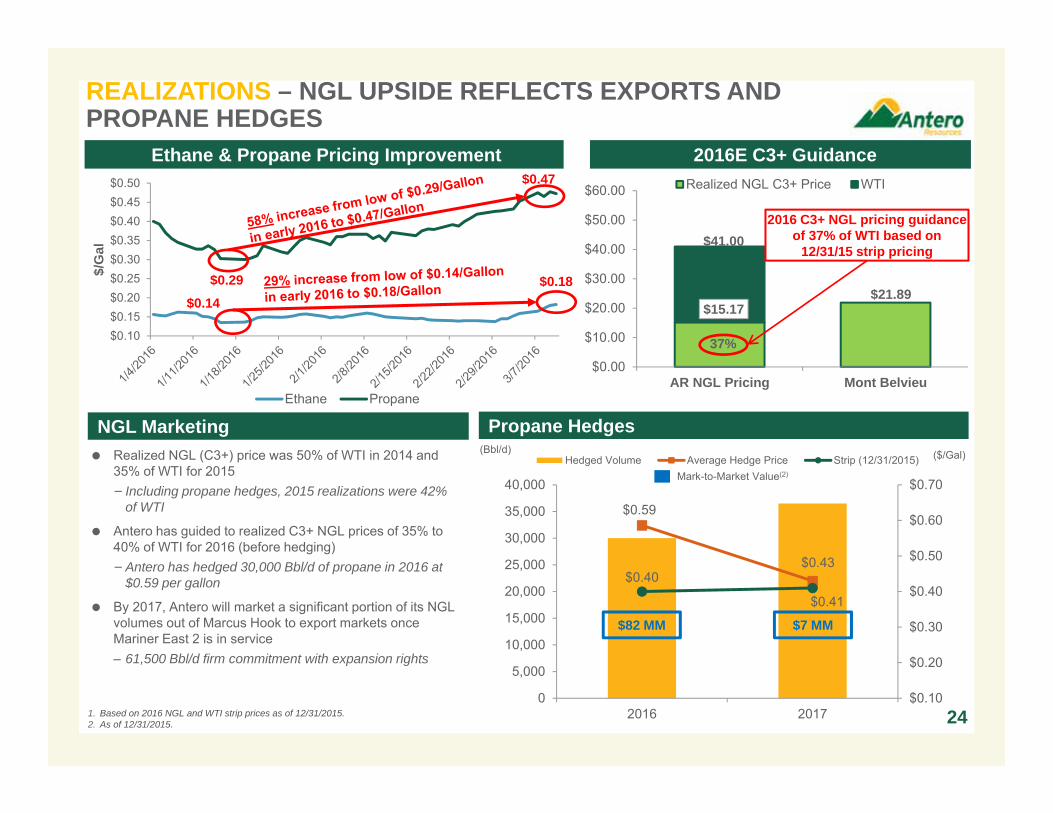
REALIZATIONS – NGL UPSIDE REFLECTS EXPORTS AND PROPANE HEDGES
241. Based on 2016 NGL and WTI strip prices as of 12/31/2015. 2. As of 12/31/2015.
Ethane & Propane Pricing Improvement
NGL Marketing Propane Hedges Realized NGL (C3+) price was 50% of WTI in 2014 and
35% of WTI for 2015− Including propane hedges, 2015 realizations were 42%
of WTI
Antero has guided to realized C3+ NGL prices of 35% to 40% of WTI for 2016 (before hedging)−Antero has hedged 30,000 Bbl/d of propane in 2016 at
$0.59 per gallon
By 2017, Antero will market a significant portion of its NGL volumes out of Marcus Hook to export markets once Mariner East 2 is in service – 61,500 Bbl/d firm commitment with expansion rights
(Bbl/d)
$82 MM $7 MM
($/Gal)
Mark-to-Market Value(2)
37%
2016 C3+ NGL pricing guidance of 37% of WTI based on
12/31/15 strip pricing
2016E C3+ Guidance
$0.10$0.15$0.20$0.25$0.30$0.35$0.40$0.45$0.50
$/G
al
Ethane Propane
$0.29
$0.47
$0.14$0.18

REALIZATIONS – POSITIVE OUTLOOK FOR LONG-TERM NGL MARKETS
Steady Global LPG Demand Growth Through 2035(1)
1. Source: PIRA NGL Study, September 2015.2. Source: IHS, Waterborne, SK Gas Analysis; Wood Mackenzie; Wood Mackenzie; PDH C3 capacity based on 25 MBbl/d = 650 Mt/y.
Multiple Factors Driving Global LPG Demand Growth Through 2020(2)
MM
Bbl
/d
0.0
0.33
0.67
Forecast global LPG demand growth of 800 MBbl/d to 1 MMBbl/d by 2020 to be driven by petrochem projects in Asia and Middle East as well as residential/commercial, alkylate and power generation demand− Naphtha cracker conversion to LPG another potential demand driver that has not yet been factored into analyst estimates ≈1 MMBbl/d
China KoreaHaiwei (2016) - 21 MBbl/d C3
SK Advanced (2016) - 27 MBbl/d C3
Ningbo Fuji (2016) - 29 MBbl/d C3
Fujian Meide (2016) - 29 MBbl/d C3
Tianjin Bohua 2 (2018) - 29 MBbl/d C3 United States
Fujian Meide 2 (2018) - 29 MBbl/d C3
Enterprise (3Q 2016)- 29 MBbl/d C3
Oriental Tangshan (2019) - 25 MBbl/d C3
Formosa (2017)- 25 MBbl/d C3
Firm and Likely PDH Underway (By 2020)
Total - 243 MBbl/d C3
Million Tons, Global PDH Capacity
1990 2000 2010 2020
20
10
0
25
14.7
13.0
11.4
9.8
8.2
6.5
4.9
3.3
1.7
U.S. Driven Global LPG Supply Through 2035(1)
MMBbl/d MMBbl/d1.3
1.0
0.7
0.3
-0.3
26
Antero Midstream (NYSE: AM)Asset Overview
1. Represents inception to date actuals as of 12/31/2015 and 2016 guidance.2. Includes both expansion capital and maintenance capital.
27
UticaShale
MarcellusShale
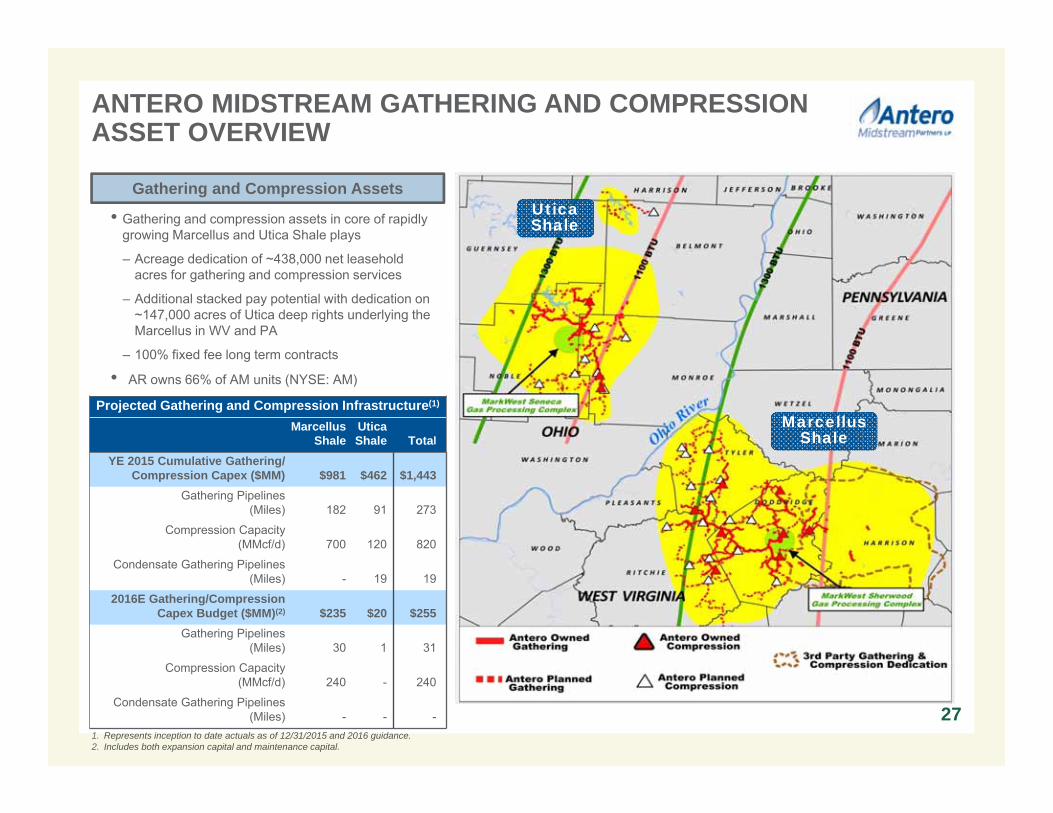
Projected Gathering and Compression Infrastructure(1)
Marcellus Shale
Utica Shale Total
YE 2015 Cumulative Gathering/ Compression Capex ($MM) $981 $462 $1,443
Gathering Pipelines(Miles) 182 91 273
Compression Capacity(MMcf/d) 700 120 820
Condensate Gathering Pipelines (Miles) - 19 19
2016E Gathering/Compression Capex Budget ($MM)(2) $235 $20 $255
Gathering Pipelines (Miles) 30 1 31
Compression Capacity(MMcf/d) 240 - 240
Condensate Gathering Pipelines (Miles) - - -
Gathering and Compression Assets
ANTERO MIDSTREAM GATHERING AND COMPRESSION ASSET OVERVIEW
• Gathering and compression assets in core of rapidly growing Marcellus and Utica Shale plays
– Acreage dedication of ~438,000 net leasehold acres for gathering and compression services
– Additional stacked pay potential with dedication on ~147,000 acres of Utica deep rights underlying the Marcellus in WV and PA
– 100% fixed fee long term contracts
• AR owns 66% of AM units (NYSE: AM)
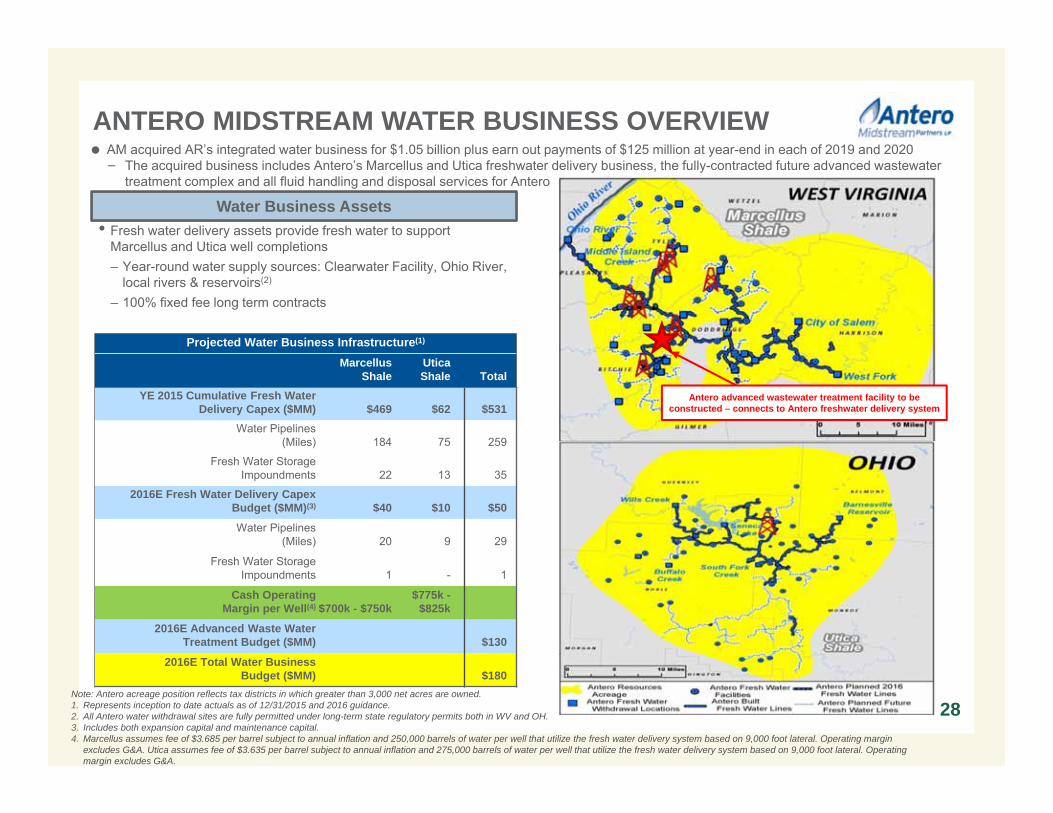
ANTERO MIDSTREAM WATER BUSINESS OVERVIEW
28Note: Antero acreage position reflects tax districts in which greater than 3,000 net acres are owned.1. Represents inception to date actuals as of 12/31/2015 and 2016 guidance.2. All Antero water withdrawal sites are fully permitted under long-term state regulatory permits both in WV and OH. 3. Includes both expansion capital and maintenance capital. 4. Marcellus assumes fee of $3.685 per barrel subject to annual inflation and 250,000 barrels of water per well that utilize the fresh water delivery system based on 9,000 foot lateral. Operating margin
excludes G&A. Utica assumes fee of $3.635 per barrel subject to annual inflation and 275,000 barrels of water per well that utilize the fresh water delivery system based on 9,000 foot lateral. Operating margin excludes G&A.
AM acquired AR’s integrated water business for $1.05 billion plus earn out payments of $125 million at year-end in each of 2019 and 2020− The acquired business includes Antero’s Marcellus and Utica freshwater delivery business, the fully-contracted future advanced wastewater
treatment complex and all fluid handling and disposal services for Antero
Antero advanced wastewater treatment facility to be constructed – connects to Antero freshwater delivery system
Projected Water Business Infrastructure(1)
Marcellus Shale
Utica Shale Total
YE 2015 Cumulative Fresh WaterDelivery Capex ($MM) $469 $62 $531
Water Pipelines(Miles) 184 75 259
Fresh Water StorageImpoundments 22 13 35
2016E Fresh Water Delivery Capex Budget ($MM)(3) $40 $10 $50
Water Pipelines(Miles) 20 9 29
Fresh Water StorageImpoundments 1 - 1
Cash Operating Margin per Well(4) $700k - $750k
$775k -$825k
2016E Advanced Waste Water Treatment Budget ($MM) $130
2016E Total Water Business Budget ($MM) $180
Water Business Assets• Fresh water delivery assets provide fresh water to support
Marcellus and Utica well completions– Year-round water supply sources: Clearwater Facility, Ohio River,
local rivers & reservoirs(2)
– 100% fixed fee long term contracts

$1 $5 $7 $8 $11$19
$28$36
$41
$55
$83
$0$10$20$30$40$50$60$70$80$90
$100
26 31 40 36 41 116
222
358
454 435478
0
100
200
300
400
500
600
700
800 Utica Marcellus
10 38 80 126 266
531
908
1,134 1,197 1,216 1,195
0200400600800
1,0001,2001,4001,6001,800 Utica Marcellus
108 216 281 331 386
531 738
935 965 1,038 1,124
0200400600800
1,0001,2001,4001,6001,800 Utica Marcellus
Low Pressure Gathering (MMcf/d)
Compression (MMcf/d)
High Pressure Gathering (MMcf/d)
EBITDA ($MM)
29
$313
HIGH GROWTH MIDSTREAM THROUGHPUT
Note: Y-O-Y growth based on 4Q’14 to 4Q’15.1. Represents midpoint of 2016 guidance .
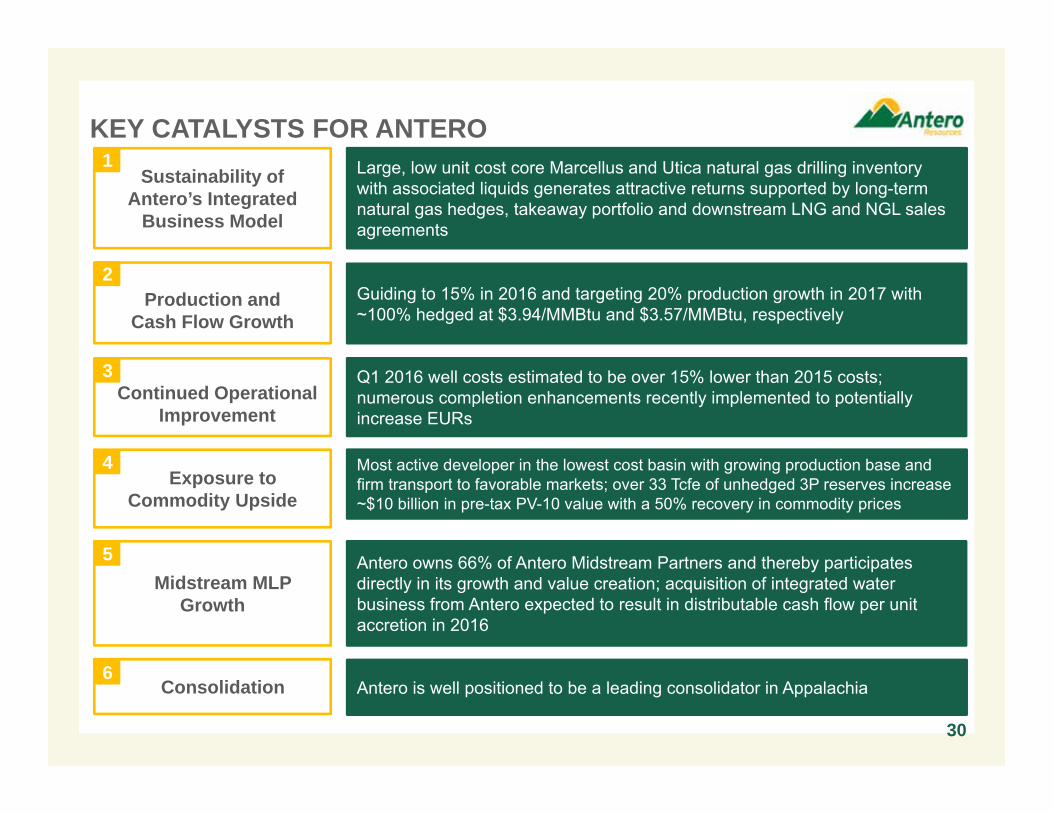
Continued OperationalImprovement
Production andCash Flow Growth
Most active developer in the lowest cost basin with growing production base and firm transport to favorable markets; over 33 Tcfe of unhedged 3P reserves increase ~$10 billion in pre-tax PV-10 value with a 50% recovery in commodity prices
KEY CATALYSTS FOR ANTERO
Guiding to 15% in 2016 and targeting 20% production growth in 2017 with ~100% hedged at $3.94/MMBtu and $3.57/MMBtu, respectively
Large, low unit cost core Marcellus and Utica natural gas drilling inventory with associated liquids generates attractive returns supported by long-term natural gas hedges, takeaway portfolio and downstream LNG and NGL sales agreements
Q1 2016 well costs estimated to be over 15% lower than 2015 costs; numerous completion enhancements recently implemented to potentially increase EURs
Antero owns 66% of Antero Midstream Partners and thereby participates directly in its growth and value creation; acquisition of integrated water business from Antero expected to result in distributable cash flow per unit accretion in 2016
Midstream MLP Growth
Sustainability of Antero’s Integrated
Business Model
1
2
3
5
4Exposure to
Commodity Upside
Antero is well positioned to be a leading consolidator in Appalachia6
Consolidation
30
31
APPENDIX
31
1.2x
0.0x1.0x2.0x3.0x4.0x5.0x6.0x
AR Peer 6 Peer 1 Peer 2 Peer 4 Peer 3 Peer 5 Peer 7
$3,117
$0$500
$1,000$1,500$2,000$2,500$3,000$3,500
AR Peer 1 Peer 2 Peer 3 Peer 4 Peer 5 Peer 6 Peer 7
Mark-to-Market Hedge Value ($MM)
$941 $0
$2,000$4,000$6,000$8,000
$10,000$12,000$14,000$16,000
AR Peer 2 Peer 1 Peer 3 Peer 6 Peer 7 Peer 5 Peer 4
E&P Debt (Net of Cash and M-T-M Hedge Value) ($MM)(1)
32
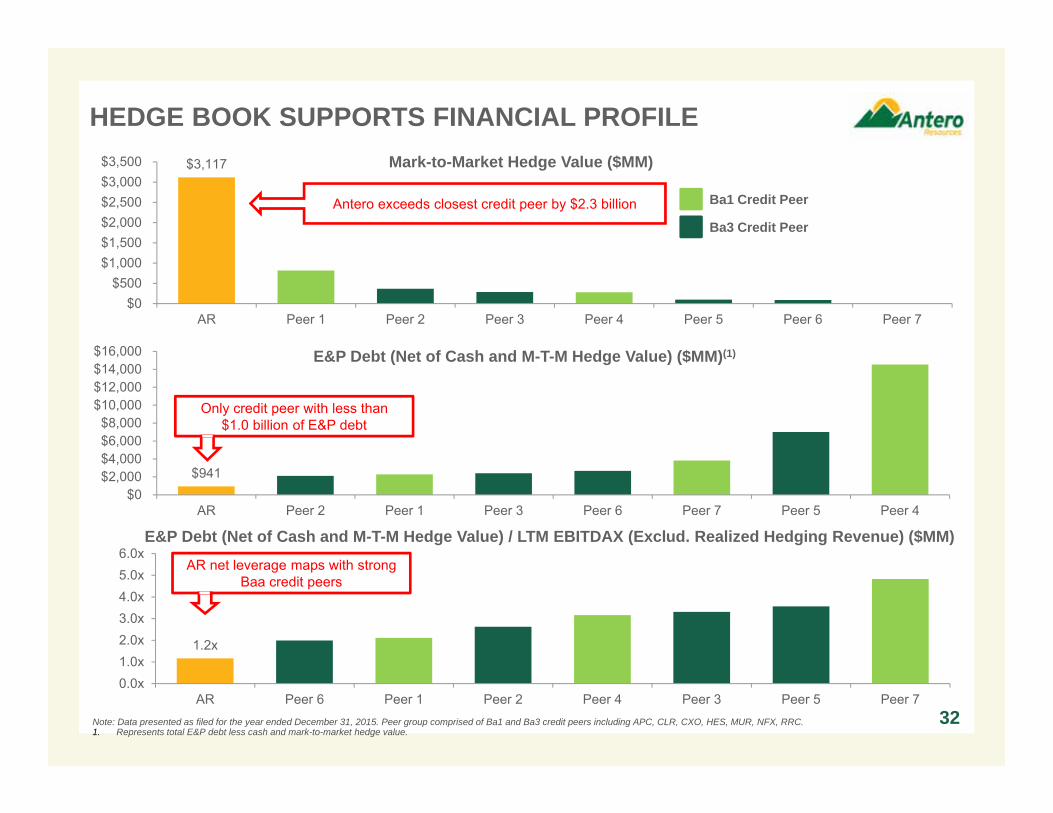
HEDGE BOOK SUPPORTS FINANCIAL PROFILE
Note: Data presented as filed for the year ended December 31, 2015. Peer group comprised of Ba1 and Ba3 credit peers including APC, CLR, CXO, HES, MUR, NFX, RRC. 1. Represents total E&P debt less cash and mark-to-market hedge value.
Antero exceeds closest credit peer by $2.3 billion
AR net leverage maps with strong Baa credit peers
Only credit peer with less than $1.0 billion of E&P debt
Ba1 Credit Peer
Ba3 Credit Peer
E&P Debt (Net of Cash and M-T-M Hedge Value) / LTM EBITDAX (Exclud. Realized Hedging Revenue) ($MM)
90%
83%80%
74%
69%
51%
46% 45%
39%
25%
15% 14%11%
39%
22%
13%
44%
53%
2%
23% 22%19%
1%
6%
80%
31%
14%
8%5%
0.0%
10.0%
20.0%
30.0%
40.0%
50.0%
60.0%
70.0%
80.0%
90.0%
100.0%
AR Peer 1 Peer2 Peer 3 Peer 4 Peer 5 Peer 6 Peer 7 Peer 8 Peer 9 Peer 10 Peer 11 Peer 12 Peer 13 Peer 14 Peer 15
2016 2017 2018
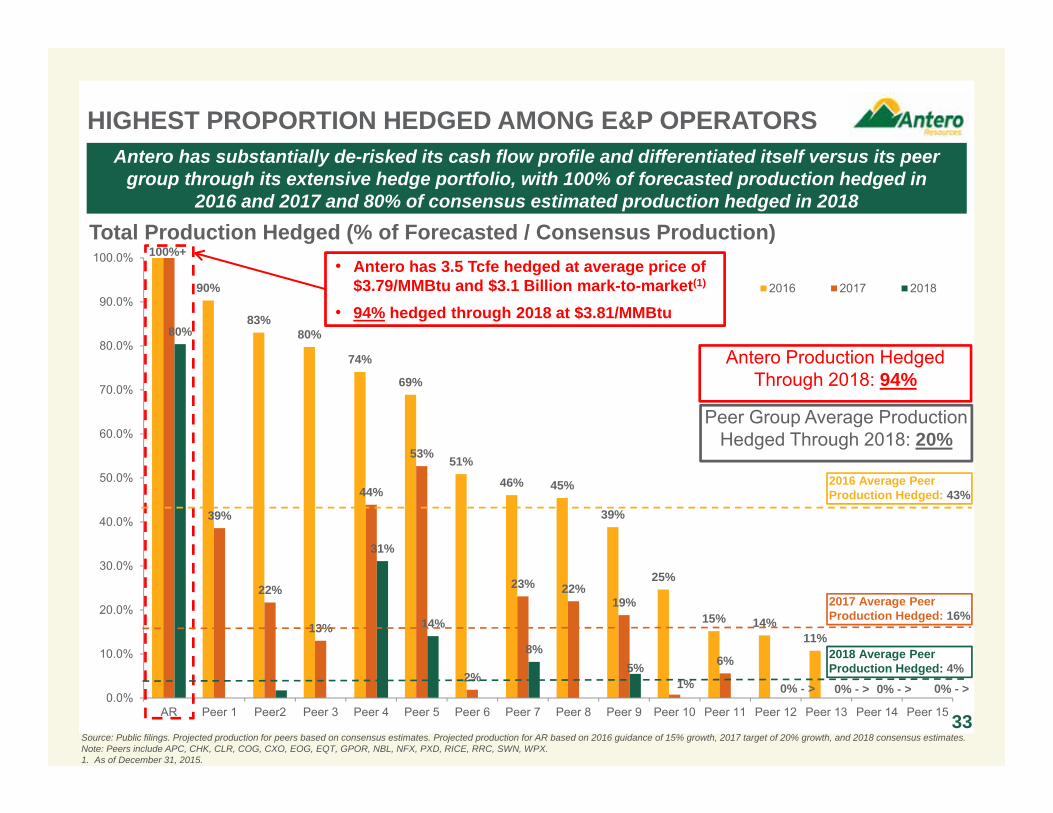
HIGHEST PROPORTION HEDGED AMONG E&P OPERATORS
33
Antero has substantially de-risked its cash flow profile and differentiated itself versus its peer group through its extensive hedge portfolio, with 100% of forecasted production hedged in
2016 and 2017 and 80% of consensus estimated production hedged in 2018
Source: Public filings. Projected production for peers based on consensus estimates. Projected production for AR based on 2016 guidance of 15% growth, 2017 target of 20% growth, and 2018 consensus estimates. Note: Peers include APC, CHK, CLR, COG, CXO, EOG, EQT, GPOR, NBL, NFX, PXD, RICE, RRC, SWN, WPX.1. As of December 31, 2015.
0% - >0% - >
100%+
2016 Average Peer Production Hedged: 43%
2017 Average Peer Production Hedged: 16%
2018 Average Peer Production Hedged: 4%
Total Production Hedged (% of Forecasted / Consensus Production)• Antero has 3.5 Tcfe hedged at average price of
$3.79/MMBtu and $3.1 Billion mark-to-market(1)
• 94% hedged through 2018 at $3.81/MMBtu
0% - >0% - >
Peer Group Average Production Hedged Through 2018: 20%
Antero Production Hedged Through 2018: 94%

0.10.4
0.9
1.8
3.5
5.6
$0.0$0.5$1.0$1.5$2.0$2.5$3.0$3.5$4.0$4.5$5.0
0.0
1.0
2.0
3.0
4.0
5.0
6.0
7.0
2010 2011 2012 2013 2014 2015
Utica Marcellus Borrowing Base
$4.5 Bn
OUTSTANDING RESERVE GROWTH
1. 2012, 2013, 2014 and 2015 reserves assuming ethane rejection. 2015 SEC prices were $2.56/MMBtu for natural gas and $50.13/Bbl for oil on a weighted average Appalachian index basis.34
3P RESERVES BY VOLUME – 2015(1)NET PDP RESERVES (Tcfe)(1)
NET PROVED RESERVES (Tcfe)(1) 2015 RESERVE ADDITIONS• Proved reserves increased 4% to 13.2 Tcfe at 12/31/2015 with a pre-tax
PV-10 of $6.7 billion at SEC pricing, including $3.1 billion of hedges− Proved PV-10 at strip pricing of $8.2 billion, including $2.5 billion of
hedges• 3P reserves were 37.1 Tcfe at 12/31/2015 with a pre-tax PV-10 of $6.8
billion at SEC pricing, including $3.1 billion of hedges− 3P PV-10 at strip pricing of $13.7 billion, including $2.5 billion of hedges
• All-in finding and development cost of $0.80/Mcfe for 2015 (includes land and all price and performance revisions)
• Drill bit only finding and development cost of $0.71/Mcfe for 2015• Only 69% of 3P Marcellus locations booked as SSL (1.7 Bcf/1,000’ type
curve) at 12/31/2015• Negligible Utica Shale WV/PA dry gas reserves booked – estimated
net resource of 12.5 – 16 Tcf0.0
2.0
4.0
6.0
8.0
10.0
12.0
14.0
2010 2011 2012 2013 2014 2015
Marcellus Utica
0.7
2.84.3
7.6
12.7
(Tcfe)
13.2
13.2 TcfeProved
21.4 TcfeProbable
2.5 TcfePossible
Proved
Probable
Possible
37.1 Tcfe 3P
93% 2P Reserves
(Tcfe) $Bn
$550 MM

ANTERO’S FIRST UTICA DRY GAS WELL
35
Antero recently drilled and completed its first dry gas Utica well in Tyler County, WV (Rymer 4HD)− 11,409 Total Vertical Depth (TVD)− 6,620’ lateral length− 100% working interest − 20 MMcf/d restricted flow rate for first 90 days
Dry gas fairway extends from the Antero Utica acreage in eastern Ohio to the Antero Marcellus play acreage in northern West Virginia
188,000 net acres in West Virginia and Pennsylvania with net resource of 12.5 to 16 Tcf as of 9/30/2015 (not included in 37.1 Tcfe of net 3P reserves as of 12/31/2015)− 1,889 locations underlying current Marcellus Shale leasehold in
West Virginia and Pennsylvania
41,000 net acres in Ohio with net 3P reserves of 2.3 Tcf as of 12/31/2015− 263 locations in Ohio
In total, Antero has 229,000 net acres and 2,152 potential locations in the Point Pleasant high pressure, high porosity dry gas fairway in OH, WV and PA− 10,000’ to 14,500’ TVD−Density log porosity values average > 8.5% − 120’ to 130’ total thickness− 25 MMcf/d to 73 MMcf/d industry 24-hr IP flow rates− 1000 to 1040 BTU expected
NOTE: Wellbore diagram for illustrative purposes only.
Targeted Pay Zone
IP / 1,000’ Lateral (MMcf/d)
5.0 – 10.0
10.0 – 15.0
15.0 – 25.0
GulfportIrons #1-4H
5,714’ LateralIP/1,000’: 5.3 MMcf/d
RangeClaysville SC #11H
5,420’ LateralIP/1,000’: 10.9 MMcf/d
CNXGaut 4IH
5,840’ LateralIP/1,000’: 10.4 MMcf/d
EQTScotts Run
3,221’ LateralIP/1,000’: 22.6 MMcf/d
GastarBlake U-7H
6,617’ LateralIP/1,000’: 5.6 MMcf/d
GastarSims U-5H
4,447’ LateralIP/1,000’: 6.6 MMcf/d
Stone EnergyPribble 6HU
3,605’ LateralIP/1,000’: 8.3 MMcf/d
Magnum HunterStalder #3UH5,050’ Lateral
IP/1,000’: 6.4 MMcf/d
Magnum HunterStewart Winland 1300U
5,280’ LateralIP/1,000’: 8.8 MMcf/d
Utica Dry Gas Fairway
AnteroRymer 4HD
6,620’ LateralIP 20.0 MMcf/d
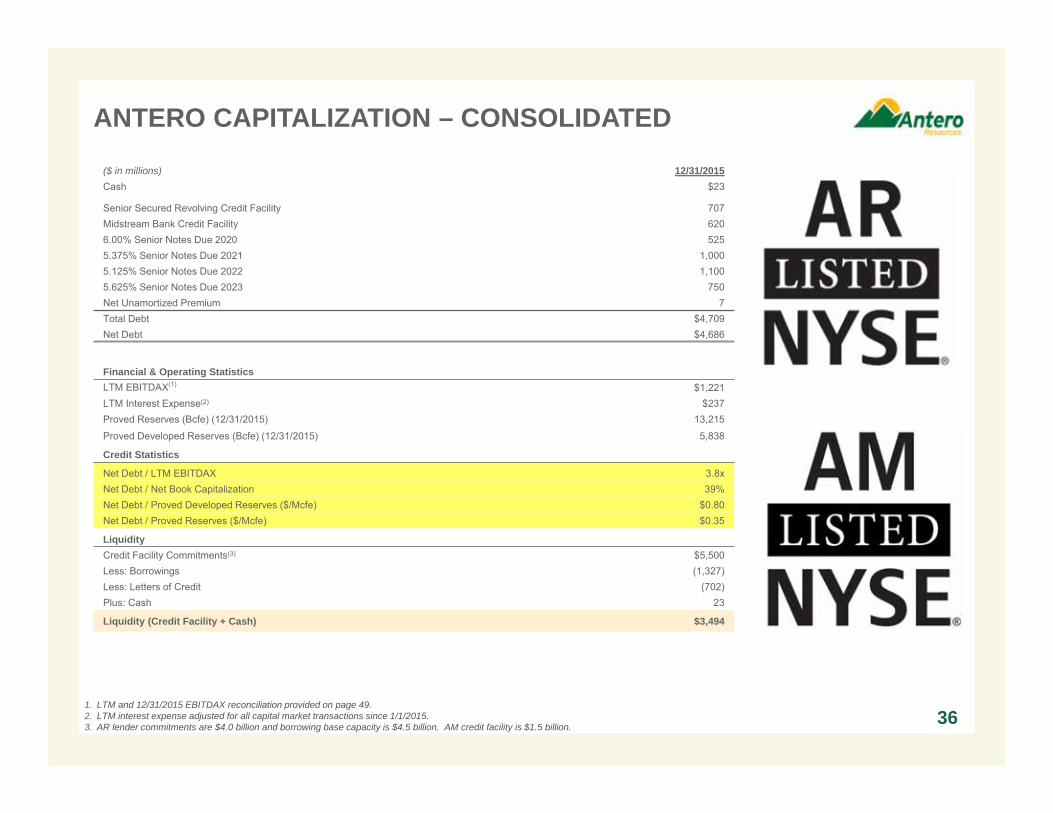
($ in millions) 12/31/2015 Cash $23
Senior Secured Revolving Credit Facility 707Midstream Bank Credit Facility 6206.00% Senior Notes Due 2020 5255.375% Senior Notes Due 2021 1,0005.125% Senior Notes Due 2022 1,1005.625% Senior Notes Due 2023 750Net Unamortized Premium 7Total Debt $4,709Net Debt $4,686
Financial & Operating StatisticsLTM EBITDAX(1) $1,221LTM Interest Expense(2) $237Proved Reserves (Bcfe) (12/31/2015) 13,215
Proved Developed Reserves (Bcfe) (12/31/2015) 5,838
Credit Statistics
Net Debt / LTM EBITDAX 3.8xNet Debt / Net Book Capitalization 39%Net Debt / Proved Developed Reserves ($/Mcfe) $0.80Net Debt / Proved Reserves ($/Mcfe) $0.35
LiquidityCredit Facility Commitments(3) $5,500Less: Borrowings (1,327)Less: Letters of Credit (702)Plus: Cash 23
Liquidity (Credit Facility + Cash) $3,494
ANTERO CAPITALIZATION – CONSOLIDATED
1. LTM and 12/31/2015 EBITDAX reconciliation provided on page 49.2. LTM interest expense adjusted for all capital market transactions since 1/1/2015.3. AR lender commitments are $4.0 billion and borrowing base capacity is $4.5 billion. AM credit facility is $1.5 billion.
36
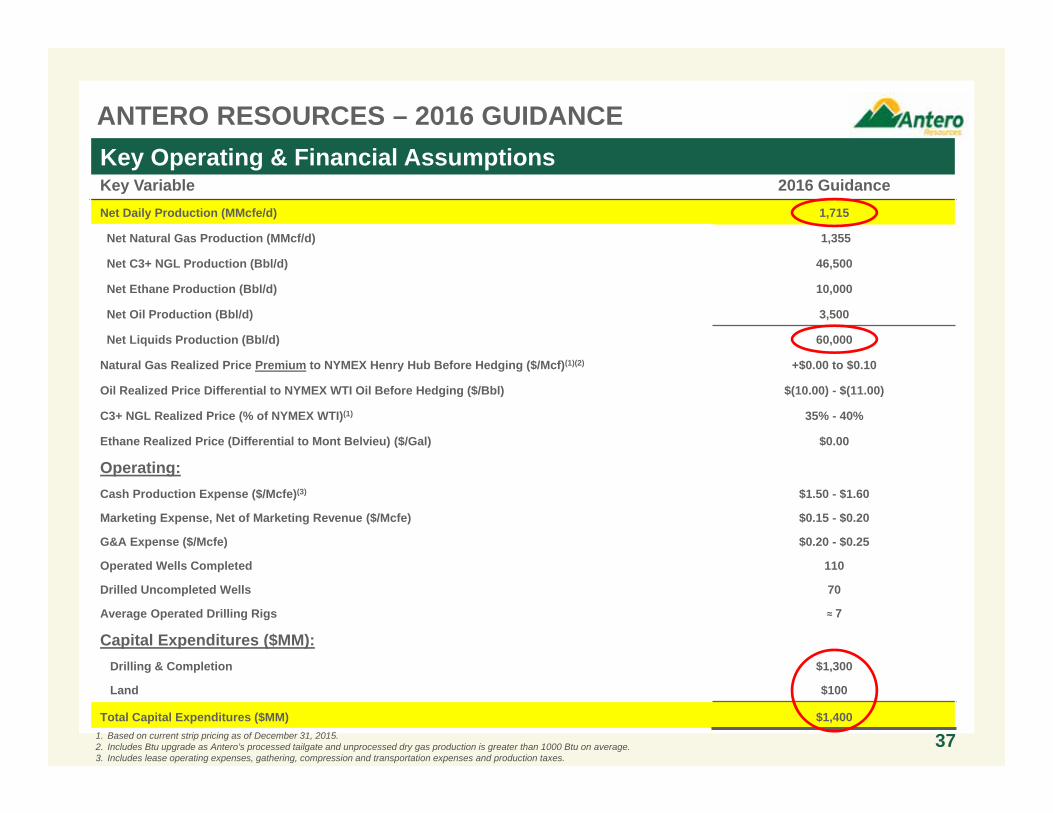
ANTERO RESOURCES – 2016 GUIDANCE
Key Variable 2016 GuidanceNet Daily Production (MMcfe/d) 1,715
Net Natural Gas Production (MMcf/d) 1,355
Net C3+ NGL Production (Bbl/d) 46,500
Net Ethane Production (Bbl/d) 10,000
Net Oil Production (Bbl/d) 3,500
Net Liquids Production (Bbl/d) 60,000
Natural Gas Realized Price Premium to NYMEX Henry Hub Before Hedging ($/Mcf)(1)(2) +$0.00 to $0.10
Oil Realized Price Differential to NYMEX WTI Oil Before Hedging ($/Bbl) $(10.00) - $(11.00)
C3+ NGL Realized Price (% of NYMEX WTI)(1) 35% - 40%
Ethane Realized Price (Differential to Mont Belvieu) ($/Gal) $0.00
Operating:Cash Production Expense ($/Mcfe)(3) $1.50 - $1.60
Marketing Expense, Net of Marketing Revenue ($/Mcfe) $0.15 - $0.20
G&A Expense ($/Mcfe) $0.20 - $0.25
Operated Wells Completed 110
Drilled Uncompleted Wells 70
Average Operated Drilling Rigs ≈ 7
Capital Expenditures ($MM):Drilling & Completion $1,300
Land $100
Total Capital Expenditures ($MM) $1,4001. Based on current strip pricing as of December 31, 2015. 2. Includes Btu upgrade as Antero’s processed tailgate and unprocessed dry gas production is greater than 1000 Btu on average. 3. Includes lease operating expenses, gathering, compression and transportation expenses and production taxes.
Key Operating & Financial Assumptions
37
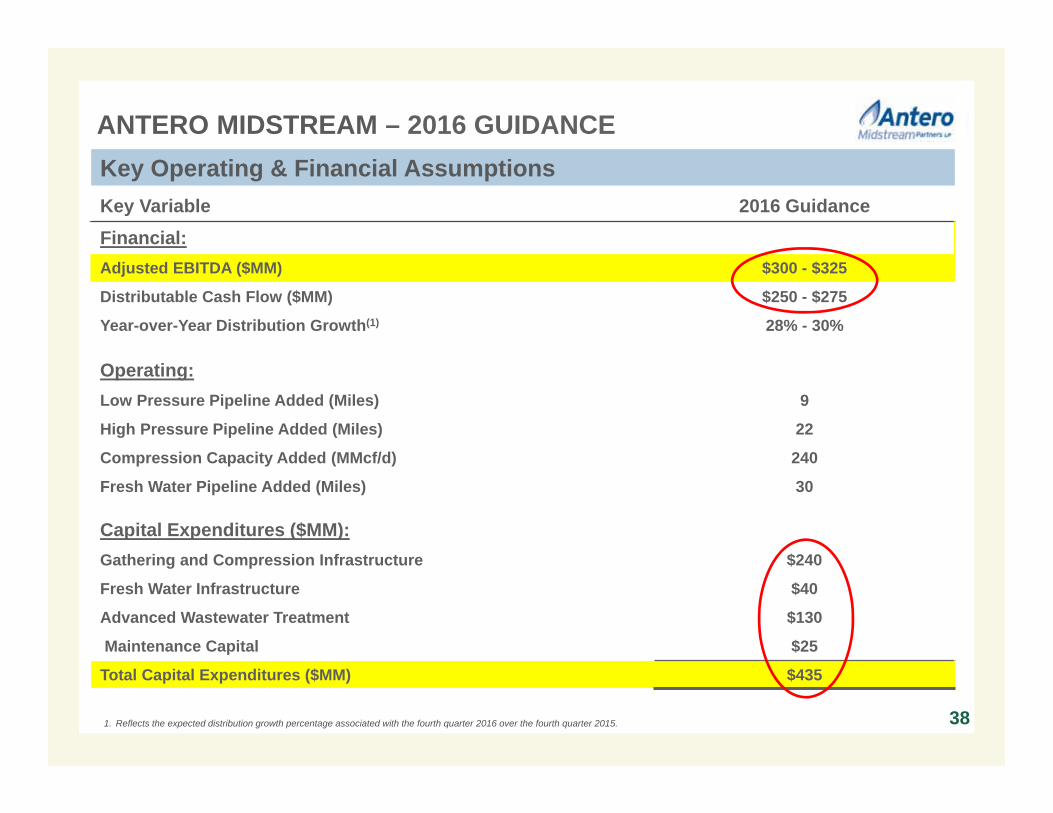
ANTERO MIDSTREAM – 2016 GUIDANCE
Key Variable 2016 GuidanceFinancial:Adjusted EBITDA ($MM) $300 - $325
Distributable Cash Flow ($MM) $250 - $275
Year-over-Year Distribution Growth(1) 28% - 30%
Operating:Low Pressure Pipeline Added (Miles) 9
High Pressure Pipeline Added (Miles) 22
Compression Capacity Added (MMcf/d) 240
Fresh Water Pipeline Added (Miles) 30
Capital Expenditures ($MM):Gathering and Compression Infrastructure $240
Fresh Water Infrastructure $40
Advanced Wastewater Treatment $130
Maintenance Capital $25
Total Capital Expenditures ($MM) $435
1. Reflects the expected distribution growth percentage associated with the fourth quarter 2016 over the fourth quarter 2015.
Key Operating & Financial Assumptions
38

0
500
1,000
1,500
2,000
2,500
3,000
3,500
4,000
2016 FT Portfolio and Projected Gas Sales
Net Production Target (MMcfe/d) (1) 1,715Net Gas Production Target (MMcf/d) (80% of Net Production) 1,372Net Revenue Interest Gross-up 80%Gross Gas Production Target (MMcf/d) 1,715BTU Upgrade (2) x1.100 Gross Gas Production Target (BBtu/d) 1,885
Firm Transportation / Firm Sales (BBtu/d) 3,525Estimated % Utilization of FT/FS 53%
Excess Firm Transportation 1,640Marketable Firm Transport (BBtu/d) (3) 1,015Unmarketable Firm Transportation 625
Estimated % Utilization of FT/FS Portfolio (Including Marketable FT) 82%
ANTERO FT PORTFOLIO APPROPRIATELY DESIGNED TO ACCOMMODATE GROWTH
391. Based on 2016 net daily production guidance.2. Assumes 1100 BTU residue sales gas.3. Represents excess firm transportation that is deemed marketable to 3rd parties based on a positive differential between the receipt and delivery points of the FT capacity, less variable transport cost.
• Antero projects firm transportation in excess of equity gas production of approximately 1,640 BBtu/d in 2016
• Expect to market or mitigate a portion of the cost of approximately 1,015 BBtu/d of the excess FT with 3rd
party gas• Expect to fully utilize FT portfolio by 2019, based on
five year development plan (excludes Appalachia based FT directed to unfavorable indices)
(BBtu/d)
2016 Targeted Gross Gas
Production(1)
1,885 BBtu/d
Unmarketable Unutilized Firm Transport
~625 BBtu/d ($0.15 / MMBtu)
Marketable Unutilized Firm Transport ~1,015 BBtu/d
($0.39 / MMBtu)
Utilized Firm Transport / Firm Sales
~1,885 BBtu/d($0.45 / MMBtu)
Total Firm Transport
3,525 BBtu/d
Excess Capacity Marketable /
FT Segment (Location) (BBtu/d) Unmarketable
Columbia / TGP (Marcellus) 550 MarketableANR North / ANR South (Utica) 465 MarketableEQT / M3 (Marcellus) 625 Unmarketable
Total Excess Firm Transport 1,640
2016 Firm Transport
Dec
reas
ing
Cos
t of F
T
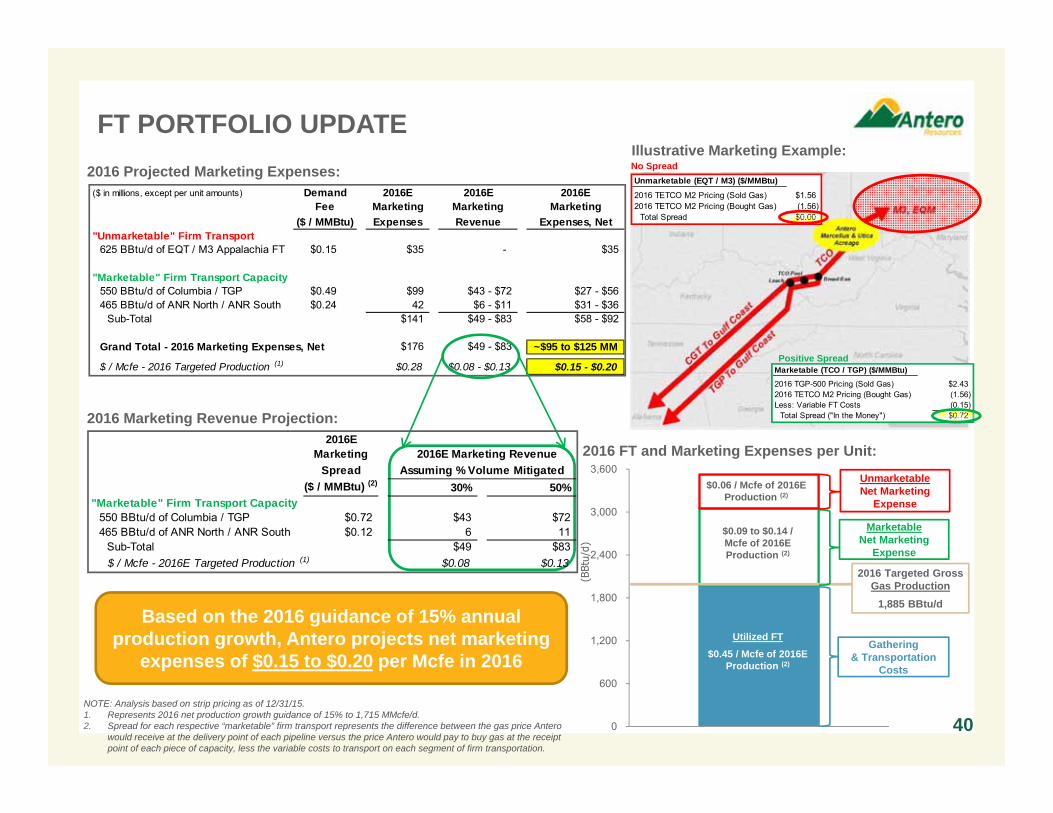
($ in millions, except per unit amounts) Demand 2016E 2016E 2016EFee Marketing Marketing Marketing
($ / MMBtu) Expenses Revenue Expenses, Net"Unmarketable" Firm Transport
625 BBtu/d of EQT / M3 Appalachia FT $0.15 $35 - $35
"Marketable" Firm Transport Capacity550 BBtu/d of Columbia / TGP $0.49 $99 $43 - $72 $27 - $56465 BBtu/d of ANR North / ANR South $0.24 42 $6 - $11 $31 - $36
Sub-Total $141 $49 - $83 $58 - $92
Grand Total - 2016 Marketing Expenses, Net $176 $49 - $83 ~$95 to $125 MM
$ / Mcfe - 2016 Targeted Production (1) $0.28 $0.08 - $0.13 $0.15 - $0.20
FT PORTFOLIO UPDATE
40NOTE: Analysis based on strip pricing as of 12/31/15. 1. Represents 2016 net production growth guidance of 15% to 1,715 MMcfe/d.2. Spread for each respective “marketable” firm transport represents the difference between the gas price Antero
would receive at the delivery point of each pipeline versus the price Antero would pay to buy gas at the receipt point of each piece of capacity, less the variable costs to transport on each segment of firm transportation.
2016 Projected Marketing Expenses:
0
600
1,200
1,800
2,400
3,000
3,600
(BBt
u/d)
2016 Targeted Gross Gas Production
1,885 BBtu/d
$0.06 / Mcfe of 2016E Production (2)
$0.09 to $0.14 / Mcfe of 2016E Production (2)
Utilized FT$0.45 / Mcfe of 2016E
Production (2)
2016 FT and Marketing Expenses per Unit:
2016 Marketing Revenue Projection:
Based on the 2016 guidance of 15% annual production growth, Antero projects net marketing
expenses of $0.15 to $0.20 per Mcfe in 2016Gathering
& Transportation Costs
MarketableNet Marketing
Expense
UnmarketableNet Marketing
Expense
Unmarketable (EQT / M3) ($/MMBtu)2016 TETCO M2 Pricing (Sold Gas) $1.562016 TETCO M2 Pricing (Bought Gas) (1.56)
Total Spread $0.00
Marketable (TCO / TGP) ($/MMBtu)2016 TGP-500 Pricing (Sold Gas) $2.432016 TETCO M2 Pricing (Bought Gas) (1.56)Less: Variable FT Costs (0.15)
Total Spread ("In the Money") $0.72
Illustrative Marketing Example:
Positive Spread
No Spread
2016EMarketing 2016E Marketing Revenue
Spread Assuming % Volume Mitigated($ / MMBtu) (2) 30% 50%
"Marketable" Firm Transport Capacity550 BBtu/d of Columbia / TGP $0.72 $43 $72465 BBtu/d of ANR North / ANR South $0.12 6 11
Sub-Total $49 $83$ / Mcfe - 2016E Targeted Production (1) $0.08 $0.13
626
971
553755
70%
52%
27% 32%37%
25%10% 13% 0
2004006008001,0001,200
0%
20%
40%
60%
80%
Highly-Rich Gas/Condensate
Highly-Rich Gas Rich Gas Dry Gas
Tota
l 3P
Loca
tions
RO
RTotal 3P LocationsROR @ 12/31/2015 Strip Pricing - After HedgesROR @ 12/31/2015 Strip Pricing - Before Hedges
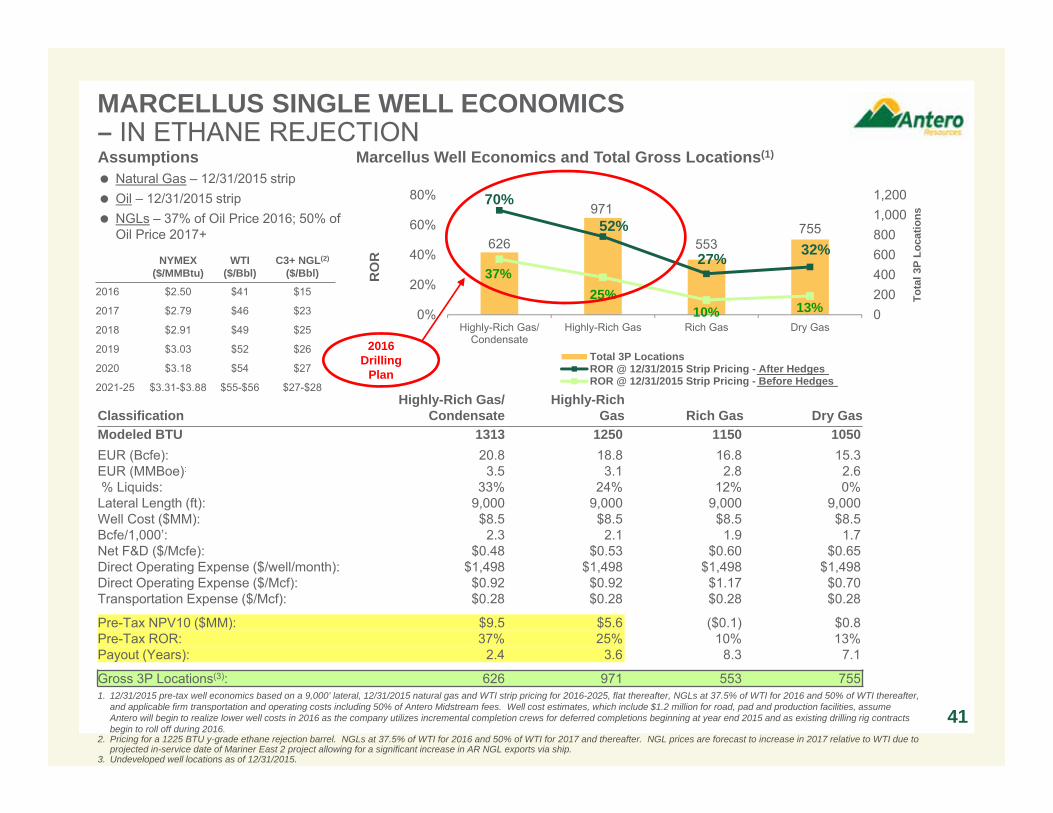
MARCELLUS SINGLE WELL ECONOMICS – IN ETHANE REJECTION
41
DRY GAS LOCATIONS RICH GAS LOCATIONS
HIGHLY RICH GAS
LOCATIONS
Assumptions Natural Gas – 12/31/2015 strip Oil – 12/31/2015 strip NGLs – 37% of Oil Price 2016; 50% of
Oil Price 2017+
NYMEX($/MMBtu)
WTI($/Bbl)
C3+ NGL(2)
($/Bbl)
2016 $2.50 $41 $15
2017 $2.79 $46 $23
2018 $2.91 $49 $25
2019 $3.03 $52 $26
2020 $3.18 $54 $27
2021-25 $3.31-$3.88 $55-$56 $27-$28
Marcellus Well Economics and Total Gross Locations(1)
ClassificationHighly-Rich Gas/
CondensateHighly-Rich
Gas Rich Gas Dry GasModeled BTU 1313 1250 1150 1050EUR (Bcfe): 20.8 18.8 16.8 15.3EUR (MMBoe): 3.5 3.1 2.8 2.6% Liquids: 33% 24% 12% 0%Lateral Length (ft): 9,000 9,000 9,000 9,000Well Cost ($MM): $8.5 $8.5 $8.5 $8.5Bcfe/1,000’: 2.3 2.1 1.9 1.7Net F&D ($/Mcfe): $0.48 $0.53 $0.60 $0.65Direct Operating Expense ($/well/month): $1,498 $1,498 $1,498 $1,498Direct Operating Expense ($/Mcf): $0.92 $0.92 $1.17 $0.70Transportation Expense ($/Mcf): $0.28 $0.28 $0.28 $0.28
Pre-Tax NPV10 ($MM): $9.5 $5.6 ($0.1) $0.8Pre-Tax ROR: 37% 25% 10% 13%Payout (Years): 2.4 3.6 8.3 7.1
Gross 3P Locations(3): 626 971 553 7551. 12/31/2015 pre-tax well economics based on a 9,000’ lateral, 12/31/2015 natural gas and WTI strip pricing for 2016-2025, flat thereafter, NGLs at 37.5% of WTI for 2016 and 50% of WTI thereafter,
and applicable firm transportation and operating costs including 50% of Antero Midstream fees. Well cost estimates, which include $1.2 million for road, pad and production facilities, assume Antero will begin to realize lower well costs in 2016 as the company utilizes incremental completion crews for deferred completions beginning at year end 2015 and as existing drilling rig contracts begin to roll off during 2016.
2. Pricing for a 1225 BTU y-grade ethane rejection barrel. NGLs at 37.5% of WTI for 2016 and 50% of WTI for 2017 and thereafter. NGL prices are forecast to increase in 2017 relative to WTI due to projected in-service date of Mariner East 2 project allowing for a significant increase in AR NGL exports via ship.
3. Undeveloped well locations as of 12/31/2015.
2016Drilling
Plan
184
98108
161 263
17%
62%
85%73%
82%
11%
28% 29%24% 27%
050100150200250300
0%
20%
40%
60%
80%
100%
Condensate Highly-Rich Gas/Condensate
Highly-Rich Gas Rich Gas Dry Gas
Tota
l 3P
Loca
tions
RO
R
Total 3P LocationsROR @ 12/31/2015 Strip Pricing - After HedgesROR @ 12/31/2015 Strip Pricing - Before Hedges
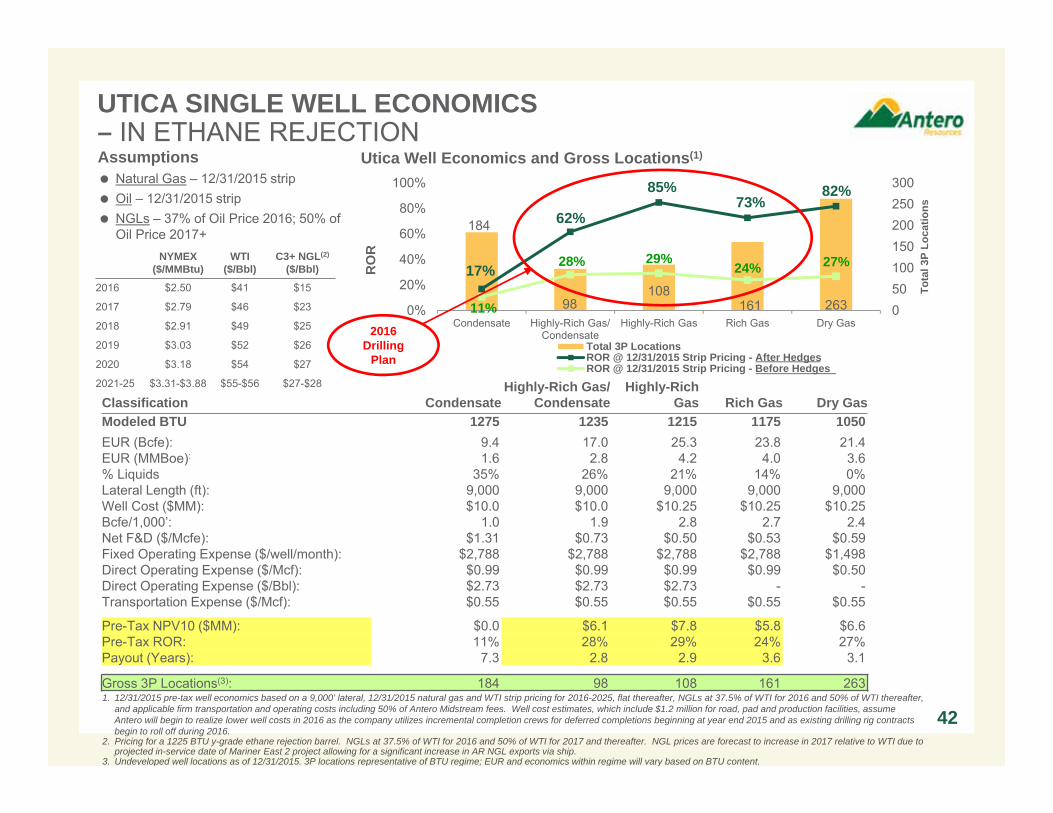
UTICA SINGLE WELL ECONOMICS – IN ETHANE REJECTION
42
DRY GAS LOCATIONS RICH GAS LOCATIONS
HIGHLY RICH GAS
LOCATIONS
Utica Well Economics and Gross Locations(1)
Classification CondensateHighly-Rich Gas/
CondensateHighly-Rich
Gas Rich Gas Dry GasModeled BTU 1275 1235 1215 1175 1050EUR (Bcfe): 9.4 17.0 25.3 23.8 21.4EUR (MMBoe): 1.6 2.8 4.2 4.0 3.6% Liquids 35% 26% 21% 14% 0%Lateral Length (ft): 9,000 9,000 9,000 9,000 9,000Well Cost ($MM): $10.0 $10.0 $10.25 $10.25 $10.25Bcfe/1,000’: 1.0 1.9 2.8 2.7 2.4Net F&D ($/Mcfe): $1.31 $0.73 $0.50 $0.53 $0.59Fixed Operating Expense ($/well/month): $2,788 $2,788 $2,788 $2,788 $1,498Direct Operating Expense ($/Mcf): $0.99 $0.99 $0.99 $0.99 $0.50Direct Operating Expense ($/Bbl): $2.73 $2.73 $2.73 - -Transportation Expense ($/Mcf): $0.55 $0.55 $0.55 $0.55 $0.55
Pre-Tax NPV10 ($MM): $0.0 $6.1 $7.8 $5.8 $6.6Pre-Tax ROR: 11% 28% 29% 24% 27%Payout (Years): 7.3 2.8 2.9 3.6 3.1
Gross 3P Locations(3): 184 98 108 161 2631. 12/31/2015 pre-tax well economics based on a 9,000’ lateral, 12/31/2015 natural gas and WTI strip pricing for 2016-2025, flat thereafter, NGLs at 37.5% of WTI for 2016 and 50% of WTI thereafter,
and applicable firm transportation and operating costs including 50% of Antero Midstream fees. Well cost estimates, which include $1.2 million for road, pad and production facilities, assume Antero will begin to realize lower well costs in 2016 as the company utilizes incremental completion crews for deferred completions beginning at year end 2015 and as existing drilling rig contracts begin to roll off during 2016.
2. Pricing for a 1225 BTU y-grade ethane rejection barrel. NGLs at 37.5% of WTI for 2016 and 50% of WTI for 2017 and thereafter. NGL prices are forecast to increase in 2017 relative to WTI due to projected in-service date of Mariner East 2 project allowing for a significant increase in AR NGL exports via ship.
3. Undeveloped well locations as of 12/31/2015. 3P locations representative of BTU regime; EUR and economics within regime will vary based on BTU content.
2016Drilling
Plan
Assumptions Natural Gas – 12/31/2015 strip Oil – 12/31/2015 strip NGLs – 37% of Oil Price 2016; 50% of
Oil Price 2017+NYMEX
($/MMBtu)WTI
($/Bbl)C3+ NGL(2)
($/Bbl)
2016 $2.50 $41 $15
2017 $2.79 $46 $23
2018 $2.91 $49 $25
2019 $3.03 $52 $26
2020 $3.18 $54 $27
2021-25 $3.31-$3.88 $55-$56 $27-$28
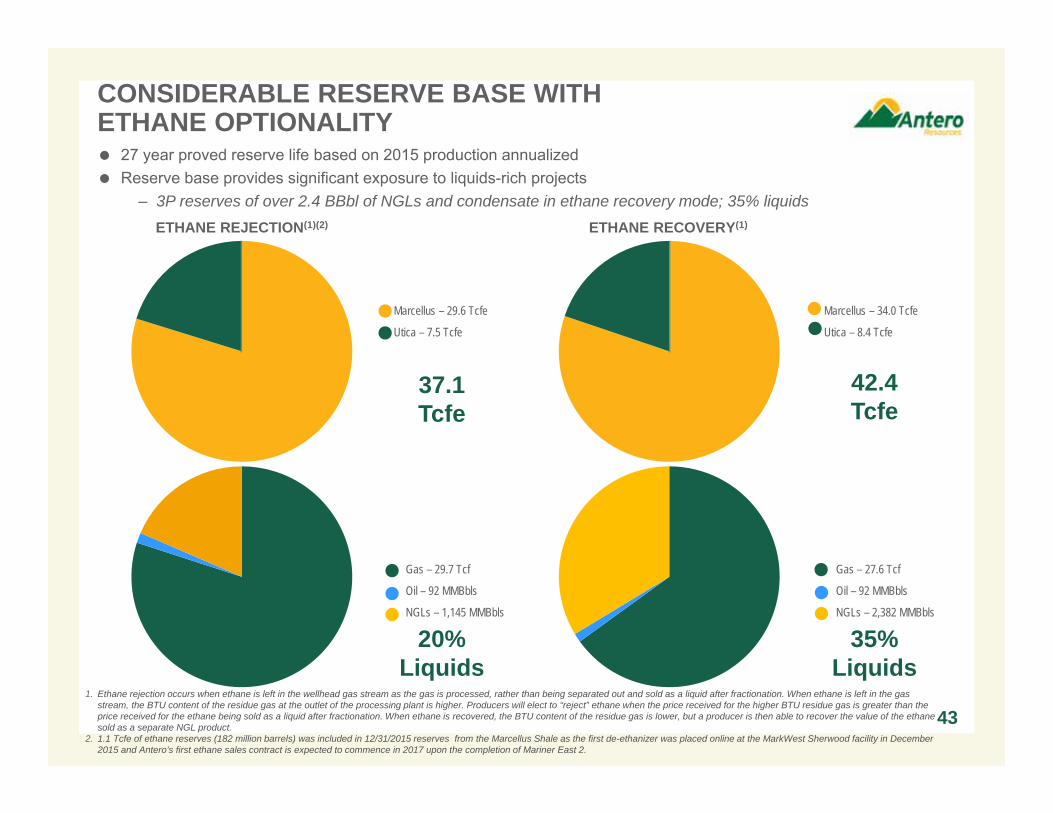
Gas – 27.6 Tcf
Oil – 92 MMBbls
NGLs – 2,382 MMBbls
Gas – 29.7 Tcf
Oil – 92 MMBbls
NGLs – 1,145 MMBbls
CONSIDERABLE RESERVE BASE WITH ETHANE OPTIONALITY 27 year proved reserve life based on 2015 production annualized Reserve base provides significant exposure to liquids-rich projects
– 3P reserves of over 2.4 BBbl of NGLs and condensate in ethane recovery mode; 35% liquids
1. Ethane rejection occurs when ethane is left in the wellhead gas stream as the gas is processed, rather than being separated out and sold as a liquid after fractionation. When ethane is left in the gas stream, the BTU content of the residue gas at the outlet of the processing plant is higher. Producers will elect to “reject” ethane when the price received for the higher BTU residue gas is greater than the price received for the ethane being sold as a liquid after fractionation. When ethane is recovered, the BTU content of the residue gas is lower, but a producer is then able to recover the value of the ethane sold as a separate NGL product.
2. 1.1 Tcfe of ethane reserves (182 million barrels) was included in 12/31/2015 reserves from the Marcellus Shale as the first de-ethanizer was placed online at the MarkWest Sherwood facility in December 2015 and Antero’s first ethane sales contract is expected to commence in 2017 upon the completion of Mariner East 2.
ETHANE REJECTION(1)(2) ETHANE RECOVERY(1)
43
Marcellus – 29.6 Tcfe
Utica – 7.5 Tcfe
37.1Tcfe
Marcellus – 34.0 Tcfe
Utica – 8.4 Tcfe
42.4Tcfe
20%Liquids
35%Liquids
Europe
Mariner East II
Shipping $0.25/Gal
NGL EXPORTS AND NETBACKS STEP-UP BY 2017
1. Source: Intercontinental exchange as of 12/31/2015.2. Source of graphic: Tudor Pickering Holt & Co. research presentation dated June 16, 2015.3. As an anchor shipper on Mariner East II, Antero has the right to expand its NGL commitment with
notice to operator.
4. Shipping rates based on benchmark Baltic shipping rate of $59.57/ton as of 12/31/15, adjusted for number of shipping days to NWE.
5. Pipeline fee equal to $0.0725/gal, per Mariner East I tariff. Terminal fee equal to $0.12/gal, per TPH report dated June 16, 2015.
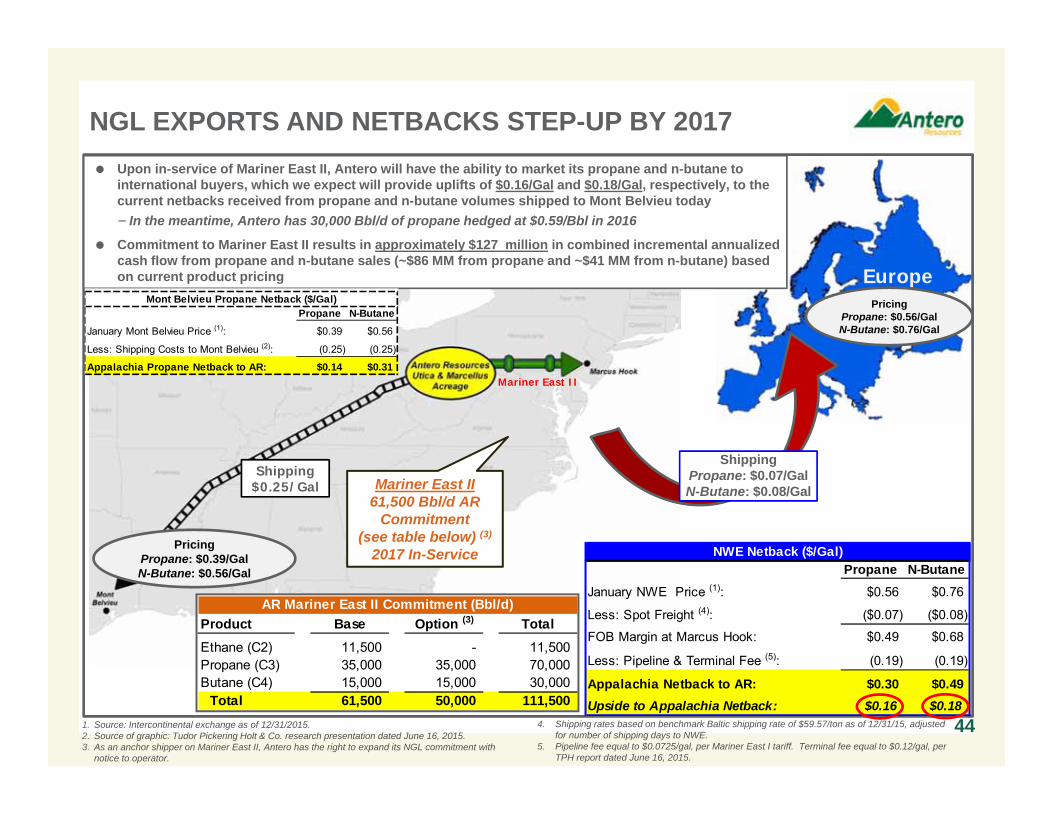
Upon in-service of Mariner East II, Antero will have the ability to market its propane and n-butane to international buyers, which we expect will provide uplifts of $0.16/Gal and $0.18/Gal, respectively, to the current netbacks received from propane and n-butane volumes shipped to Mont Belvieu today− In the meantime, Antero has 30,000 Bbl/d of propane hedged at $0.59/Bbl in 2016
Commitment to Mariner East II results in approximately $127 million in combined incremental annualized cash flow from propane and n-butane sales (~$86 MM from propane and ~$41 MM from n-butane) based on current product pricing
PricingPropane: $0.39/GalN-Butane: $0.56/Gal
PricingPropane: $0.56/GalN-Butane: $0.76/Gal
Mariner East II61,500 Bbl/d AR
Commitment (see table below) (3)
2017 In-Service
ShippingPropane: $0.07/GalN-Butane: $0.08/Gal
AR Mariner East II Commitment (Bbl/d)Product Base Option (3) TotalEthane (C2) 11,500 - 11,500 Propane (C3) 35,000 35,000 70,000 Butane (C4) 15,000 15,000 30,000
Total 61,500 50,000 111,500
44
Mont Belvieu Propane Netback ($/Gal)Propane N-Butane
January Mont Belvieu Price (1): $0.39 $0.56
Less: Shipping Costs to Mont Belvieu (2): (0.25) (0.25)
Appalachia Propane Netback to AR: $0.14 $0.31
NWE Netback ($/Gal)Propane N-Butane
January NWE Price (1): $0.56 $0.76
Less: Spot Freight (4): ($0.07) ($0.08)
FOB Margin at Marcus Hook: $0.49 $0.68
Less: Pipeline & Terminal Fee (5): (0.19) (0.19)
Appalachia Netback to AR: $0.30 $0.49Upside to Appalachia Netback: $0.16 $0.18
$4
$8
$5$25 $34 $29 $28 $26 $12 $16 $17 $28 $29 $19 $25 $43
$80 $83$59$49 $48
$14$47 $54
$1
$1$58
$78
$185$196
$206
$274
($2.00)
($1.00)
$0.00
$1.00
$2.00
$3.00
$4.00
($20.0)
$30.0
$80.0
$130.0
$180.0
$230.0
$280.0
Quarterly Realized Gains/(Losses)1Q '08 - 4Q '15
1,793 2,073 2,015 1,960 1,288 480 10
$3.94$3.57
$3.88 $3.89 $3.73 $3.50
$3.30$2.50 $2.79 $2.91 $3.03 $3.18 $3.31
$3.46
$0.00
$1.00
$2.00
$3.00
$4.00
$5.00
-
500
1,000
1,500
2,000
2,500
2016 2017 2018 2019 2020 2021 2022
45
Average Index Hedge Price(1)Hedged Volume Current NYMEX Strip(2)
COMMODITY HEDGE POSITION
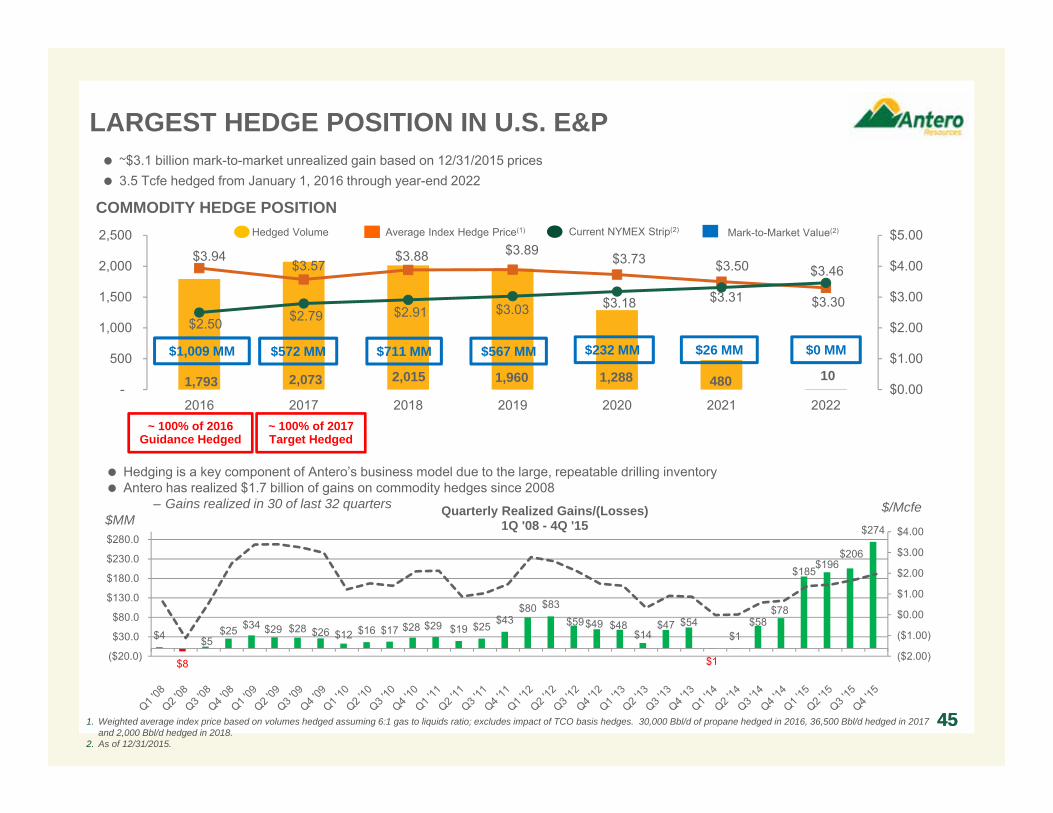
~$3.1 billion mark-to-market unrealized gain based on 12/31/2015 prices 3.5 Tcfe hedged from January 1, 2016 through year-end 2022
$1,009 MM $572 MM $711 MM $567 MM $232 MM $26 MM
Mark-to-Market Value(2)
LARGEST HEDGE POSITION IN U.S. E&P
~ 100% of 2016 Guidance Hedged
451. Weighted average index price based on volumes hedged assuming 6:1 gas to liquids ratio; excludes impact of TCO basis hedges. 30,000 Bbl/d of propane hedged in 2016, 36,500 Bbl/d hedged in 2017 and 2,000 Bbl/d hedged in 2018.
2. As of 12/31/2015.
Hedging is a key component of Antero’s business model due to the large, repeatable drilling inventory Antero has realized $1.7 billion of gains on commodity hedges since 2008
– Gains realized in 30 of last 32 quarters$MM
$/Mcfe
$0 MM
~ 100% of 2017 Target Hedged
$1,327
$525
$1,000 $1,100
$750
$0
$300
$600
$900
$1,200
$1,500
2015 2016 2017 2018 2019 2020 2021 2022 2023
($ in
Mill
ions
)
$1,500
$887
($620)
$0 $7
$0
$250
$500
$750
$1,000
$1,250
$1,500
Credit Facility12/31/2015
Bank Debt12/31/2015
L/Cs Outstanding12/31/2015
Cash12/31/2015
Liquidity 12/31/2015
46
STRONG FINANCIAL LIQUIDITY AND DEBT TERM STRUCTURE
46
$4,000
$2,607
($707)
($702) $16
$0
$1,000
$2,000
$3,000
$4,000
Credit Facility12/31/2015
Bank Debt12/31/2015
L/Cs Outstanding12/31/2015
Cash12/31/2015
Liquidity12/31/2015
AR LIQUIDITY POSITION ($MM) AM LIQUIDITY POSITION ($MM)
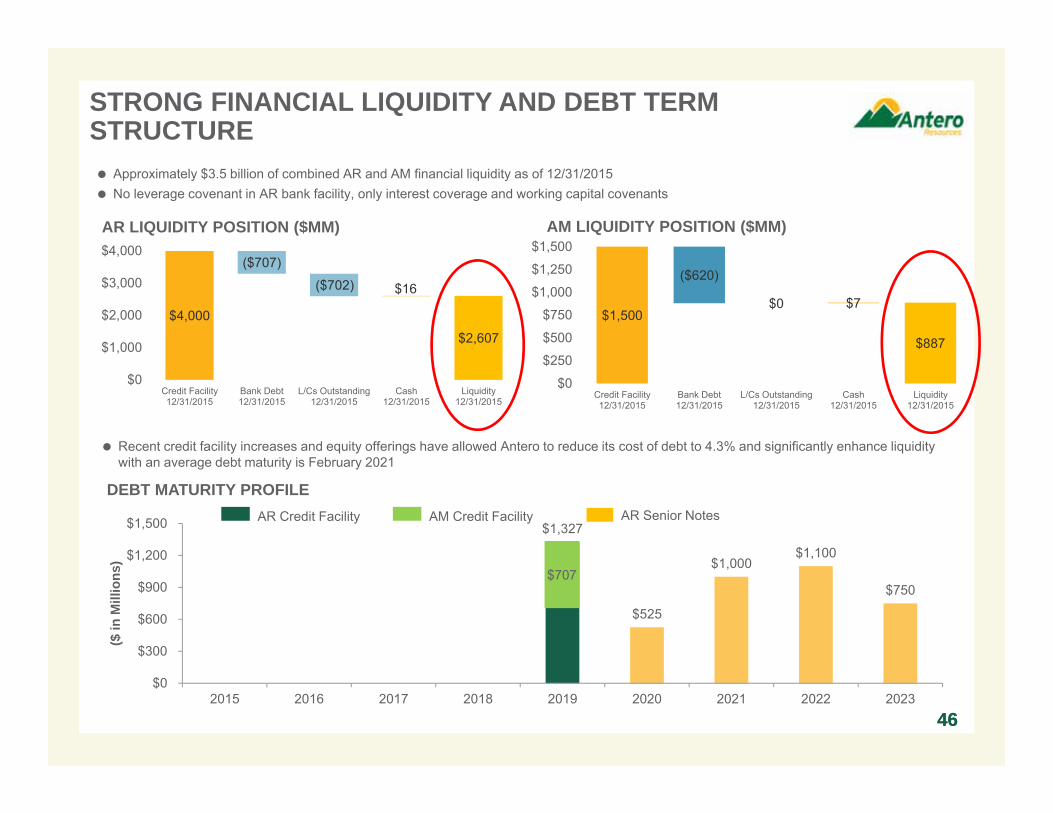
Approximately $3.5 billion of combined AR and AM financial liquidity as of 12/31/2015 No leverage covenant in AR bank facility, only interest coverage and working capital covenants
AR Credit Facility AR Senior Notes
DEBT MATURITY PROFILE
Recent credit facility increases and equity offerings have allowed Antero to reduce its cost of debt to 4.3% and significantly enhance liquidity with an average debt maturity is February 2021
AM Credit Facility
$707
Moody's S&P
POSITIVE RATINGS MOMENTUM
Moody’s / S&P Historical Corporate Credit Ratings
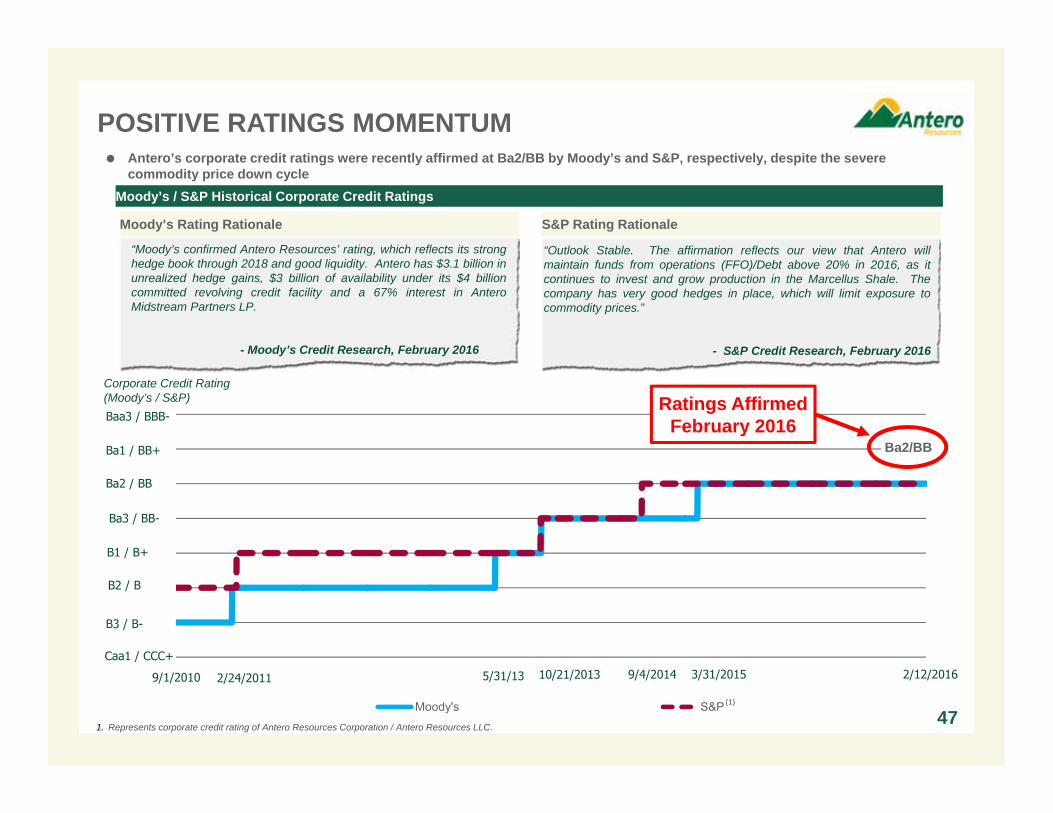
“Outlook Stable. The affirmation reflects our view that Antero willmaintain funds from operations (FFO)/Debt above 20% in 2016, as itcontinues to invest and grow production in the Marcellus Shale. Thecompany has very good hedges in place, which will limit exposure tocommodity prices.”
- S&P Credit Research, February 2016
“Moody’s confirmed Antero Resources’ rating, which reflects its stronghedge book through 2018 and good liquidity. Antero has $3.1 billion inunrealized hedge gains, $3 billion of availability under its $4 billioncommitted revolving credit facility and a 67% interest in AnteroMidstream Partners LP.
- Moody’s Credit Research, February 2016
Corporate Credit Rating (Moody’s / S&P)
Ba3 / BB-
B1 / B+
B2 / B
B3 / B-
2/24/2011 10/21/2013 9/4/20145/31/13
Ba2 / BB
Ba1 / BB+
Caa1 / CCC+
(1)
1. Represents corporate credit rating of Antero Resources Corporation / Antero Resources LLC.
Baa3 / BBB-
Moody’s Rating Rationale S&P Rating Rationale
47
3/31/2015
Ba2/BB
2/12/20169/1/2010
Ratings AffirmedFebruary 2016
Antero’s corporate credit ratings were recently affirmed at Ba2/BB by Moody’s and S&P, respectively, despite the severe commodity price down cycle
010,00020,00030,00040,00050,00060,00070,00080,000
Antero Clearwater Advanced Wastewater Treatment Capacity (Bbl/d)
Produced/Flowback Volumes (Bbl/d)
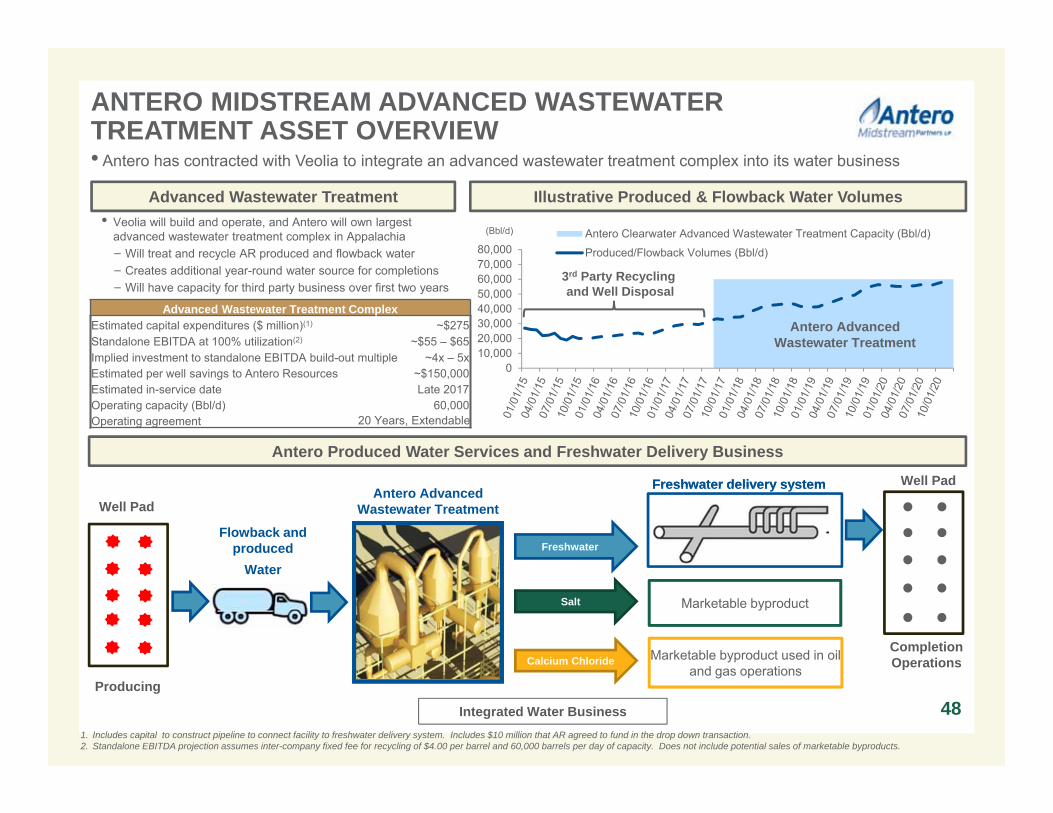
Illustrative Produced & Flowback Water VolumesAdvanced Wastewater Treatment
Antero Produced Water Services and Freshwater Delivery Business
Antero AdvancedWastewater Treatment
3rd Party Recyclingand Well Disposal
(Bbl/d)
Advanced Wastewater Treatment ComplexEstimated capital expenditures ($ million)(1) ~$275Standalone EBITDA at 100% utilization(2) ~$55 – $65Implied investment to standalone EBITDA build-out multiple ~4x – 5xEstimated per well savings to Antero Resources ~$150,000Estimated in-service date Late 2017Operating capacity (Bbl/d) 60,000Operating agreement
• Antero has contracted with Veolia to integrate an advanced wastewater treatment complex into its water business
• Veolia will build and operate, and Antero will own largest advanced wastewater treatment complex in Appalachia− Will treat and recycle AR produced and flowback water− Creates additional year-round water source for completions− Will have capacity for third party business over first two years
1. Includes capital to construct pipeline to connect facility to freshwater delivery system. Includes $10 million that AR agreed to fund in the drop down transaction. 2. Standalone EBITDA projection assumes inter-company fixed fee for recycling of $4.00 per barrel and 60,000 barrels per day of capacity. Does not include potential sales of marketable byproducts.
20 Years, Extendable
48Integrated Water Business
Antero Advanced Wastewater Treatment
Freshwater delivery system
Flowback and produced
Water
Well Pad
Well Pad
CompletionOperations
Producing
Freshwater
Salt
Calcium Chloride
Marketable byproduct
Marketable byproduct used in oil and gas operations
Freshwater delivery system
ANTERO MIDSTREAM ADVANCED WASTEWATER TREATMENT ASSET OVERVIEW
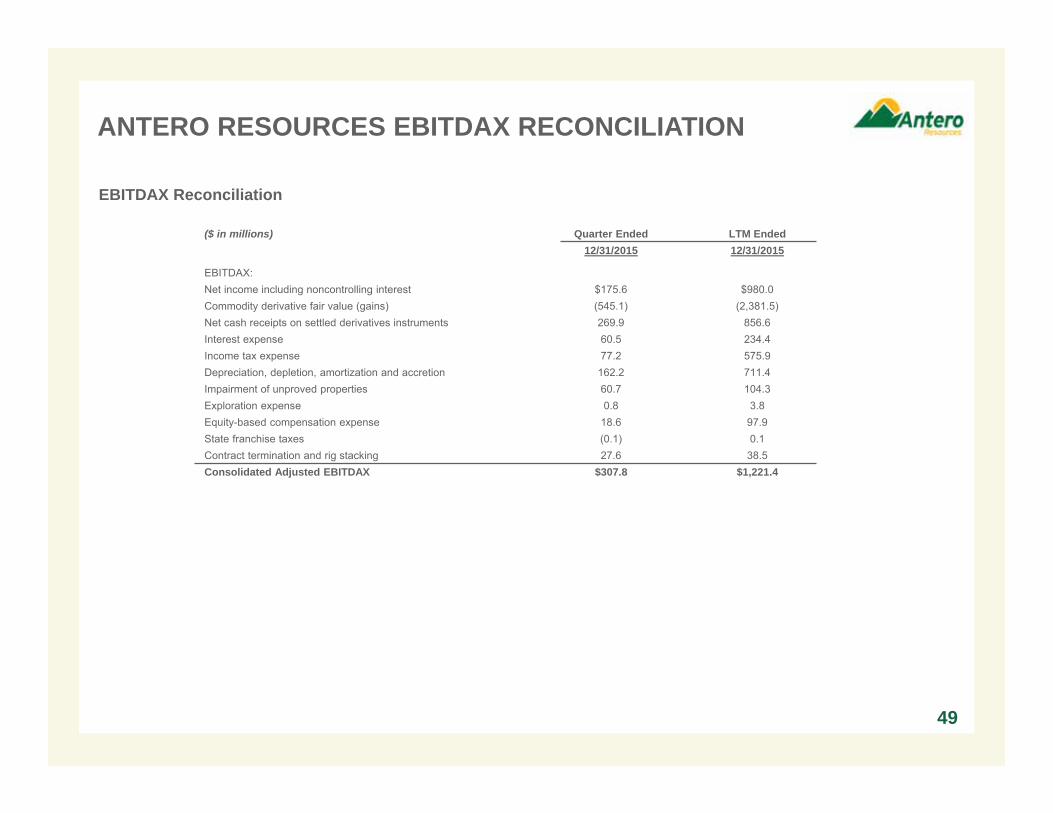
ANTERO RESOURCES EBITDAX RECONCILIATION
49
EBITDAX Reconciliation
($ in millions) Quarter Ended LTM Ended12/31/2015 12/31/2015
EBITDAX:Net income including noncontrolling interest $175.6 $980.0Commodity derivative fair value (gains) (545.1) (2,381.5)Net cash receipts on settled derivatives instruments 269.9 856.6Interest expense 60.5 234.4Income tax expense 77.2 575.9Depreciation, depletion, amortization and accretion 162.2 711.4Impairment of unproved properties 60.7 104.3Exploration expense 0.8 3.8Equity-based compensation expense 18.6 97.9State franchise taxes (0.1) 0.1Contract termination and rig stacking 27.6 38.5Consolidated Adjusted EBITDAX $307.8 $1,221.4
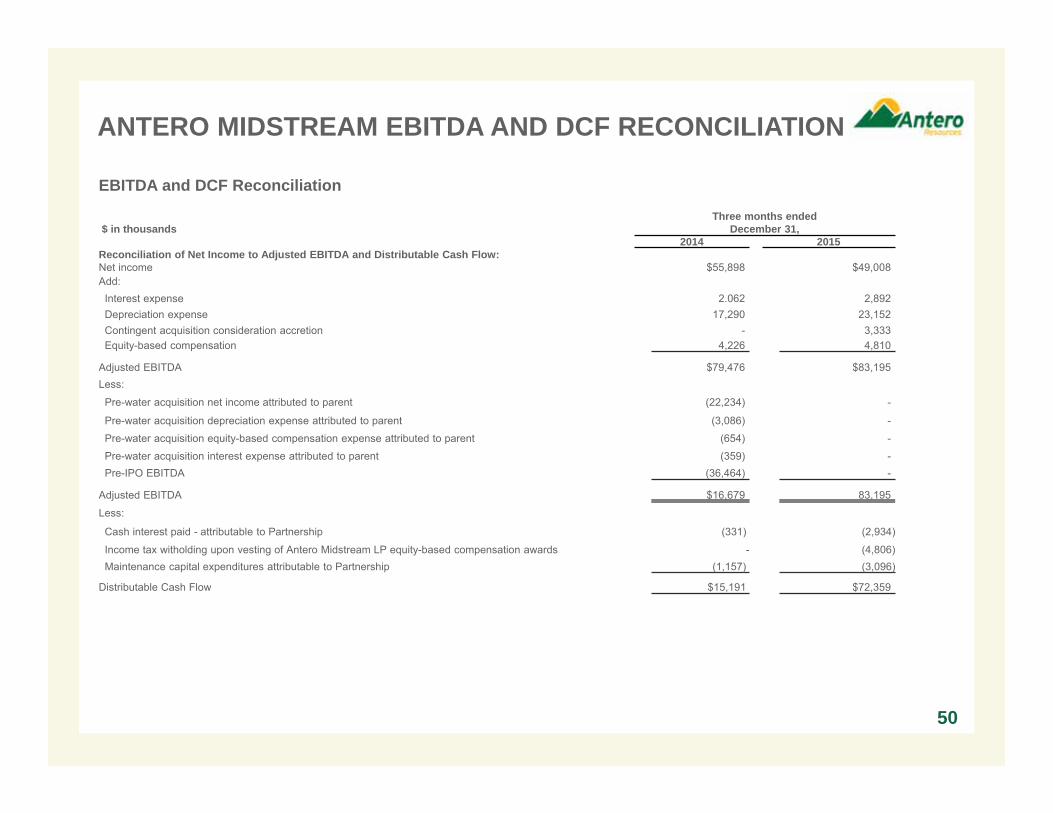
ANTERO MIDSTREAM EBITDA AND DCF RECONCILIATION
50
EBITDA and DCF Reconciliation
$ in thousandsThree months ended
December 31,2014 2015
Reconciliation of Net Income to Adjusted EBITDA and Distributable Cash Flow: Net income $55,898 $49,008Add:
Interest expense 2.062 2,892Depreciation expense 17,290 23,152Contingent acquisition consideration accretion - 3,333Equity-based compensation 4,226 4,810
Adjusted EBITDA $79,476 $83,195Less:
Pre-water acquisition net income attributed to parent (22,234) -
Pre-water acquisition depreciation expense attributed to parent (3,086) -
Pre-water acquisition equity-based compensation expense attributed to parent (654) -
Pre-water acquisition interest expense attributed to parent (359) -Pre-IPO EBITDA (36,464) -
Adjusted EBITDA $16,679 83,195
Less:
Cash interest paid - attributable to Partnership (331) (2,934)
Income tax witholding upon vesting of Antero Midstream LP equity-based compensation awards - (4,806)Maintenance capital expenditures attributable to Partnership (1,157) (3,096)
Distributable Cash Flow $15,191 $72,359
CAUTIONARY NOTE
The SEC permits oil and gas companies, in their filings with the SEC, to disclose only proved, probable and possible reserve estimates (collectively, “3P”). Antero has provided internally generated estimates for proved, probable and possible reserves in this presentation in accordance with SEC guidelines and definitions. The estimates of proved, probable and possible reserves as of December 31, 2015 included in this presentation have been audited by Antero’s third-party engineers. Unless otherwise noted, reserve estimates as of December 31, 2015 assume ethane rejection and strip pricing.
Actual quantities that may be ultimately recovered from Antero’s interests may differ substantially from the estimates in this presentation. Factors affecting ultimate recovery include the scope of Antero’s ongoing drilling program, which will be directly affected by commodity prices, the availability of capital, drilling and production costs, availability of drilling services and equipment, drilling results, lease expirations, transportation constraints, regulatory approvals and other factors; and actual drilling results, including geological and mechanical factors affecting recovery rates.
In this presentation:
“3P reserves” refer to Antero’s estimated aggregate proved, probable and possible reserves as of December 31, 2015. The SEC prohibits companies from aggregating proved, probable and possible reserves in filings with the SEC due to the different levels of certainty associated with each reserve category.
“EUR,” or “Estimated Ultimate Recovery,” refers to Antero’s internal estimates of per well hydrocarbon quantities that may be potentially recovered from a hypothetical future well completed as a producer in the area. These quantities do not necessarily constitute or represent reserves within the meaning of the Society of Petroleum Engineer’s Petroleum Resource Management System or the SEC’s oil and natural gas disclosure rules.
“Condensate” refers to gas having a heat content between 1250 BTU and 1300 BTU in the Utica Shale.
“Highly-Rich Gas/Condensate” refers to gas having a heat content between 1275 BTU and 1350 BTU in the Marcellus Shale and 1225 BTU and 1250 BTU in the Utica Shale.
“Highly-Rich Gas” refers to gas having a heat content between 1200 BTU and 1275 BTU in the Marcellus Shale and 1200 BTU and 1225 BTU in the Utica Shale.
“Rich Gas” refers to gas having a heat content of between 1100 BTU and 1200 BTU.
“Dry Gas” refers to gas containing insufficient quantities of hydrocarbons heavier than methane to allow their commercial extraction or to require their removal in order to render the gas suitable for fuel use.
Regarding Hydrocarbon Quantities
51