Science of the Total Environment - uliege.be · Science of the Total Environment 545–546 (2016)...
9
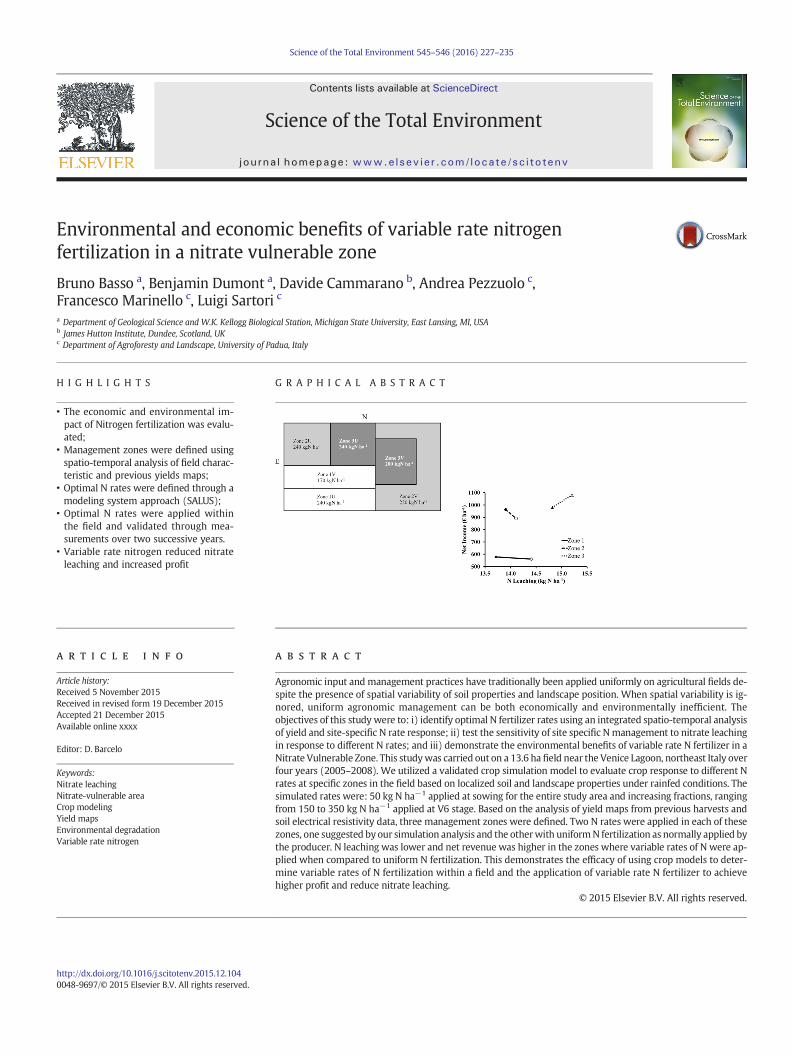
Environmental and economic benefits of variable rate nitrogen fertilization in a nitrate vulnerable zone Bruno Basso a , Benjamin Dumont a , Davide Cammarano b , Andrea Pezzuolo c , Francesco Marinello c , Luigi Sartori c a Department of Geological Science and W.K. Kellogg Biological Station, Michigan State University, East Lansing, MI, USA b James Hutton Institute, Dundee, Scotland, UK c Department of Agroforesty and Landscape, University of Padua, Italy HIGHLIGHTS • The economic and environmental im- pact of Nitrogen fertilization was evalu- ated; • Management zones were defined using spatio-temporal analysis of field charac- teristic and previous yields maps; • Optimal N rates were defined through a modeling system approach (SALUS); • Optimal N rates were applied within the field and validated through mea- surements over two successive years. • Variable rate nitrogen reduced nitrate leaching and increased profit GRAPHICAL ABSTRACT abstract article info Article history: Received 5 November 2015 Received in revised form 19 December 2015 Accepted 21 December 2015 Available online xxxx Editor: D. Barcelo Agronomic input and management practices have traditionally been applied uniformly on agricultural fields de- spite the presence of spatial variability of soil properties and landscape position. When spatial variability is ig- nored, uniform agronomic management can be both economically and environmentally inefficient. The objectives of this study were to: i) identify optimal N fertilizer rates using an integrated spatio-temporal analysis of yield and site-specific N rate response; ii) test the sensitivity of site specific N management to nitrate leaching in response to different N rates; and iii) demonstrate the environmental benefits of variable rate N fertilizer in a Nitrate Vulnerable Zone. This study was carried out on a 13.6 ha field near the Venice Lagoon, northeast Italy over four years (2005–2008). We utilized a validated crop simulation model to evaluate crop response to different N rates at specific zones in the field based on localized soil and landscape properties under rainfed conditions. The simulated rates were: 50 kg N ha −1 applied at sowing for the entire study area and increasing fractions, ranging from 150 to 350 kg N ha −1 applied at V6 stage. Based on the analysis of yield maps from previous harvests and soil electrical resistivity data, three management zones were defined. Two N rates were applied in each of these zones, one suggested by our simulation analysis and the other with uniform N fertilization as normally applied by the producer. N leaching was lower and net revenue was higher in the zones where variable rates of N were ap- plied when compared to uniform N fertilization. This demonstrates the efficacy of using crop models to deter- mine variable rates of N fertilization within a field and the application of variable rate N fertilizer to achieve higher profit and reduce nitrate leaching. © 2015 Elsevier B.V. All rights reserved. Keywords: Nitrate leaching Nitrate-vulnerable area Crop modeling Yield maps Environmental degradation Variable rate nitrogen Science of the Total Environment 545–546 (2016) 227–235 http://dx.doi.org/10.1016/j.scitotenv.2015.12.104 0048-9697/© 2015 Elsevier B.V. All rights reserved. Contents lists available at ScienceDirect Science of the Total Environment journal homepage: www.elsevier.com/locate/scitotenv
Transcript of Science of the Total Environment - uliege.be · Science of the Total Environment 545–546 (2016)...
Science of the Total Environment 545–546 (2016) 227–235
Contents lists available at ScienceDirect
Science of the Total Environment
j ourna l homepage: www.e lsev ie r .com/ locate /sc i totenv
Environmental and economic benefits of variable rate nitrogenfertilization in a nitrate vulnerable zone
Bruno Basso a, Benjamin Dumont a, Davide Cammarano b, Andrea Pezzuolo c,Francesco Marinello c, Luigi Sartori c
a Department of Geological Science and W.K. Kellogg Biological Station, Michigan State University, East Lansing, MI, USAb James Hutton Institute, Dundee, Scotland, UKc Department of Agroforesty and Landscape, University of Padua, Italy
H I G H L I G H T S G R A P H I C A L A B S T R A C T
• The economic and environmental im-pact of Nitrogen fertilization was evalu-ated;
• Management zones were defined usingspatio-temporal analysis of field charac-teristic and previous yields maps;
• Optimal N rates were defined through amodeling system approach (SALUS);
• Optimal N rates were applied withinthe field and validated through mea-surements over two successive years.
• Variable rate nitrogen reduced nitrateleaching and increased profit
http://dx.doi.org/10.1016/j.scitotenv.2015.12.1040048-9697/© 2015 Elsevier B.V. All rights reserved.
a b s t r a c t
a r t i c l e i n f oArticle history:Received 5 November 2015Received in revised form 19 December 2015Accepted 21 December 2015Available online xxxx
Editor: D. Barcelo
Agronomic input and management practices have traditionally been applied uniformly on agricultural fields de-spite the presence of spatial variability of soil properties and landscape position. When spatial variability is ig-nored, uniform agronomic management can be both economically and environmentally inefficient. Theobjectives of this study were to: i) identify optimal N fertilizer rates using an integrated spatio-temporal analysisof yield and site-specific N rate response; ii) test the sensitivity of site specific Nmanagement to nitrate leachingin response to different N rates; and iii) demonstrate the environmental benefits of variable rate N fertilizer in aNitrate Vulnerable Zone. This studywas carried out on a 13.6 ha field near the Venice Lagoon, northeast Italy overfour years (2005–2008). We utilized a validated crop simulation model to evaluate crop response to different Nrates at specific zones in the field based on localized soil and landscape properties under rainfed conditions. Thesimulated rates were: 50 kg N ha−1 applied at sowing for the entire study area and increasing fractions, rangingfrom 150 to 350 kg N ha−1 applied at V6 stage. Based on the analysis of yield maps from previous harvests andsoil electrical resistivity data, three management zones were defined. Two N rates were applied in each of thesezones, one suggested by our simulation analysis and the otherwith uniformN fertilization as normally applied bythe producer. N leaching was lower and net revenue was higher in the zones where variable rates of N were ap-plied when compared to uniform N fertilization. This demonstrates the efficacy of using crop models to deter-mine variable rates of N fertilization within a field and the application of variable rate N fertilizer to achievehigher profit and reduce nitrate leaching.
© 2015 Elsevier B.V. All rights reserved.
Keywords:Nitrate leachingNitrate-vulnerable areaCrop modelingYield mapsEnvironmental degradationVariable rate nitrogen
228 B. Basso et al. / Science of the Total Environment 545–546 (2016) 227–235
1. Introduction
Agronomic input andmanagement practices have traditionally beenapplied uniformly on agricultural fields despite the spatial heterogene-ity of soil properties and landscape position. When spatial variability isnot taken into account, uniform agronomic management can be botheconomically and environmentally inefficient (Pierce and Nowak,1999). Site-specific management (SSM) practices, proposed within thePrecision Agriculture (PA) framework, gives farmers the possibility toincrease yield, reduce inputs, and minimize environmental impact(Robert, 2002, Robertson et al., 2012; Basso et al., 2013). The potentialbenefits of SSM strategies are greatly dependent on the how accuratelysuch variability can be assessed. Many authors have proposed guide-lines for the delineation of management zones which can be definedas areas within a field that are homogeneous with regard to yield limit-ing factors (Mulla, 1991, Ferguson et al., 2004, Schepers et al., 2004,Chang et al., 2004; Basso et al., 2007; Basso et al., 2015). Pierce andNowak (1999) highlighted how temporal and spatial variability of soilN has to be taken into account for successful SSM of N fertilization.
One of the most studied components of SSM is nitrogen(N) management. In areas where N fertilizer is cheap or subsidized,farmers tend to apply it in large quantities which can result in environ-mental problems including nitrate leaching, ammonia volatilization, ni-trous oxide emissions or soil acidification (Grace et al., 2011). Thepressure that over-fertilization exerts on the environment is gettingmore awareness as climate change and deterioration of fresh water be-come more critical. The European Union (EU), through the Nitrates Di-rective, aimed to preserve the quality of groundwater through areduction of N fertilizer by promoting good farming practices (91/676/EEC).
Despite technological advances in monitoring plant N status, deter-mining the optimumNamountnecessarywithin each uniformmanage-ment zone in a field remains a daunting task due to the large spatial andtemporal variation that these variables exert at the field scale. Plant re-sponse to variable management levels is highly dependent upon theweather that occurs during a given growing season (Basso et al., 2007;Basso et al., 2013; Dumont et al., 2014, 2015a). For example, crop re-sponse to N in rainfed environments may be high when water is avail-able, or low when the soil water content is limited (Basso et al.,2011a). However farmers must make decisions about N applicationbased on developmental stages of crop growth without foreknowledgeof the kind of weather that will occur after fertilizer application. Sincefuture weather conditions are unknown, a risk management strategyneeds to be adopted to verify the impact of N fertilizer over a longenough period of time (i.e., 30 years) in order to represent the diversityof climate and soil interactions that are present. The biggest challenge ofsuch an approach is the development of a yield response function thatcan represent a crop's response to the N ratemanagement and other in-teractions (Basso et al., 2011b, Dumont et al., 2013, 2015b).
Process oriented crop simulation models integrate the effects oncrop growth of multiple stress interactions over time and under differ-ent environmental and management conditions (Batchelor et al.,2002; Basso et al., 2013). However their application in PA can be limitedbecause simulations cannot be performed everywhere in a field giventhat the availability of detailed (soil and crop data) inputs is limitedand the costs are prohibitive. Basso et al. (2007) used a more balancedapproach to study spatial and temporal variability of crop behavior ina fieldwhen they applied a crop simulationmodel for SSM. They consid-ered temporal stability and spatial variability of measured yieldmaps todelineate stable or unstable spatial patterns and identify zones of similarcrop performance. Then they performed model evaluations at selectedsites within each of the management zones. In another study Bassoet al. (2011a) presented a tactical and strategic procedure for selectionof optimal N fertilizer rates to be applied on management zones identi-fied as homogenous based on the outputs of a crop simulation modeland the simulated levels of plant available soil water at the time of the
secondN application. In this studywe simply hypothesized that variablerate nitrogen fertilizer when properly identified in terms of quantityand spatial distributions leads to higher profit and lower environmentalimpact.
The objectives of this study was to demonstrate the advantages ofvariable rate management with a field study where variable and busi-ness-as-usual nitrogen rate were compared with field measured dataof yield and farmers' revenues. To achieve the objective of the study,(i) uniform management zone were identified using an integratedspatio-temporal analysis; (ii) optimal N fertilizer rateswere determinedon the basis of simulated yield and N-leaching responses to the site-specific N rates; (iii) the so-defined optimum N rates were physicallyapplied within each zone of the field; and (iv) the economic and envi-ronmental benefits of variable rate N fertilizer in a Nitrate VulnerableZone was finally demonstrated through a comparison to the business-as-usual practice and the subsequent validation measurements.
2. Materials and methods
2.1. Site description
This studywas carried out on a 13.6 ha field near the Venice Lagoon,NE Italy (45°22′23.02″N, 12°08′24.27″E,−2 m a.s.l) for the 2005, 2006,2007, and 2008 growing seasons. The area was identified as a NitrateVulnerable Zone (NVZ) according to Nitrate Directive 91/676 (EEC,1991) because high potential nitrate leaching in ground and surfacewa-ters. Soil texture varies greatly in the study area, ranging from sandy tosilty-loam (Soil Survey Staff, 1999). Daily weather data were collectedby an automatic meteorological station located near the experimentalfield (ARPAV, Bureau of Meteorology of Veneto Region).
2.2. Agronomic management
The agronomic practices applied to the crops included in this studyare representative for the growing area. Crop rotation adopted wassugar beet in 2005 and continuous maize for the remaining threeyears. A detailed explanation of the agronomic practices applied forthe 2007 and 2008 growing seasons are shown in Table 1.
2.3. Soil sampling
An extensive characterization of soil in the study area was madein 2005. A mixed-sampling scheme of the top soil layer (0–30 cm)was followed based on a regular grid: 40 samples were collected atthe nodes of a 60-m grid and 80 additional points were collected atthe nodes of 10 transects, resulting in a total of 120 samples. Tran-sects were set in the north and east axis at 1, 5, 15, 30 m from 10 ran-domly chosen nodes of the grid. Soil texture was determined usingthe hydrometer method (Klute and Dirkens, 1986), soil bulk densitywas measured with the core method (Grossman and Reinsch, 2002)and soil pH and electric conductivity were measured with a pH/ECtester on a soil water extract. Organic carbon was measured usingthe Walkley–Black method (Walkley and Black, 1934) and the re-sults converted to organic matter by multiplying the carbon percent-age by 1.72. Total N was determined using Kjedahl method and labilephosphorus was determined with the Olsen method. In addition,spatial soil electric conductivity (ECa) was measured with an EMIsensor (Geonics EM38DD) which determined conductivity in bothhorizontal and vertical orientations. This instrument provided aweighted depth reading to approximately 0.5 m in the horizontalorientation and 1.5 m in the vertical orientation. ECa measurementswere collected in November 2005, carried out in the field with asso-ciated DGPS antenna.

Table 1Agronomic management for Maize for the growing season 2007 and 2008.
Dates Agronomic management
05–10–06 Sowing of cover crop (Horseradish — Armoracia rusticana; 25 kg ha−1)14–03–07 Chopping of cover crop29–03–07 Weed control (glyphosate 8.6 l ha−1 and thifensulfuron 10 g ha−1)12–04–07 Non-inversion tillage (30 cm depth)23–04–07 First N fertilization (50 kg N ha−1) — Liquid Ammonium Sulfate
(20–0-0)26–04–07 Planting (Dekalb DKC6040; 7.5 plants m−2)28–04–07 Weed control (Flufenacet 1.2 l ha−1)01–06–07 P fertilizing (12.5 kg ha−1)01–06–07 Second N fertilization (variable rate, see M&M) – Liquid Ammonium
Sulfate (20–0-0)17–07–07 Insecticide treatment (Deltamethrin 0.5 l ha−1)20–07–07 Irrigation (50 mm) - Sprinkler17–09–07 Harvest11–10–07 Sowing of cover crop (Horseradish - Armoracia rusticana; 25 kg ha−1)31–03–08 Chemical cover crop control31–03–08 First N fertilization (50 kg N ha−1) – Liquid Ammonium Sulfate
(20–0-0)29–04–08 Shallow tillage30–04–08 Planting (Dekalb DKC6040; 7.5 plants m−2)30–04–08 P fertilizing (12.5 kg ha−1)02–05–08 Weed control (Flufenacet 1.2 l ha−1 and Florasulam 1 l ha−1)27–05–08 Weed control (Foramsulfuron 2.5 l ha−1)11–06–08 Second N fertilization (variable rate, see M&M) — Liquid Ammonium
Sulfate (20-0-0)11–09–08 Harvest
229B. Basso et al. / Science of the Total Environment 545–546 (2016) 227–235
2.4. Yield monitoring
Yield data were recorded by a NewHollandTX64 combine harvesterequipped with a yield monitor system (grain mass flow and moisturesensors). Site coordinates for each yieldmeasurementwere determinedwith a differentially corrected (OMNISTAR signal) Trimble 132 receiver.The SMS software version 3.0TM (AgLeader Technology, Inc.) was usedto read the row yield data (expressed at 14% dry matter).
2.5. Methodology for identification of uniform management zones
The procedure to identify the management zones for this field aredescribed in Chiericati et al. (2007). Homogeneous zones were delin-eated by considering harvested yield levels measured within areas ofthe field for the first two years (sugarbeet in 2005 and maize in 2006),the degree of stability of those yield levels over time, measured soilproperties (sand, clay and organic matter) and themap of soil electricalresistivity obtained in the horizontal orientation. An overlay of all thesedata layers was performed using a Fuzzy C-means method (Chiericatiet al., 2007).
Geostatistical analyses were performed for each of the measuredvariables. Spatial structure of the data was assessed developingsemivariograms with the use of GS+ software version 9.0 (Gamma De-sign Software, 2009). The best fit model selection for experimentalsemivariogram was done by the “leaving-one-out” method of cross-validation and spatial interpolation was carried out using the krigingtechnique. Spatial dependence was determined for each soil and cropvariable and spatial maps were drawn using Surfer v 6.0 (GoldenSoftware, 1995). The Fuzziness Performance Index (FPI) was used tomeasure the degree of separation between classes (Fridgen et al.,2004). FPI is an index ranging from 0 to 1, which values approaching 0indicate distinct classes with low sharing, while values near 1 indicatenon-distinct classes with a large degree of property sharing. More de-tails about the procedure can be found in Chiericati et al. (2007) andBasso et al. (2007).
2.6. Crop growth model and simulation scenarios
Simulation runs were performed using the SALUSmodel. The SALUSmodel is a process-oriented system that simulates plant growth and de-velopment responses to environmental conditions (soil and weather),genetics and management strategies in a sequential mode (Basso andRitchie, 2015).
Weather data used by the models included daily values of incomingsolar radiation (MJ m−2 day−1), maximum and minimum air tempera-ture (°C) and rainfall (mm). Soil input data used by the model includesilt and clay content, bulk density, organic carbon, soil hydraulic proper-ties, initial soil water and nitrogen contents. Data were all measured onsite (Table 3) and soil hydraulic properties were calculated using theprocedure suggested by Ritchie et al. (1999). The SALUS model hasbeenwidely validated formaize yields and nitrogen leaching under var-iable N fertilizer rates in the study area, as reported in Basso et al. (2007,2010, 2011a, 2011b, 2012); Bertocco et al. (2008) and Pezzuolo et al.(2014).
Long-term simulation scenarios were created for each zone underrainfed conditions with 50 kg N ha−1 applied at sowing and five differ-ent N fertilization rates considered for the second application and ap-plied at V6 stage: 150, 200, 250, 300, 350 kg N ha−1. For each of thezones previously identified, the model was run with these five N ratesusing long-term weather data, and results were then averaged overyears. The optimal N rates were determined for each zone consideringthe simulated yield and N leaching expected in each of these zones, asdescribed in the Results section.
Each management zone was then divided into two sub-units andeach sub unit was fertilized according two different treatments duringtwo growing seasons (2007 and 2008). The first sub-unit of each zonewas fertilized uniformly (U) according to the business-as-usualmanage-ment practice. The second sub-unit received a variable rate (V) withineach zone, chosen from the model simulation results obtained in eacharea.
2.7. Model and field outputs analysis
The marginal value of N fertilization was calculated from the simu-lated data. Net income (NI) was calculated by considering maize yields(YM), selling prices (Mp), the costs associated to the strategy of N fertil-ization (Nfer) and N price (NP) as follows:
NI ¼ YM �Mp� �� Nfer � Np
� � ð1Þ
In this paper Mp was fixed at 0.135 € kg−1 and NP was fixed at0.93 € kg−1 (current prices for fertilizer and wheat grains).
Themarginal value (MV) is defined here as the change in net incomein terms of the change in kg N ha−1applied. It is calculated as follows:
MV ¼ ΔNIΔNfer
ð2Þ
where ΔNI is the difference between two levels of net income (€ ha−1)andΔNfer is thedifferencebetween two levelsof fertilization (kgNha−1).That way, MV is the derivative of NI, for which a value of zero corre-sponds to the optimum of the NI curve.
In the same way, differential N leaching (dNleach) was computed asthe change in the amount of N leached (ΔNleach) in terms of the changein additional units of N fertilization (ΔNfer) as follows:
dNleach ¼ ΔNleach
ΔNferð3Þ
The slope of the linear regression derived on the dNleach data offersan appreciation of the risk of N leaching. Optimal N strategies were de-termined for each zone on the basis of a concomitant analysis ofMV and
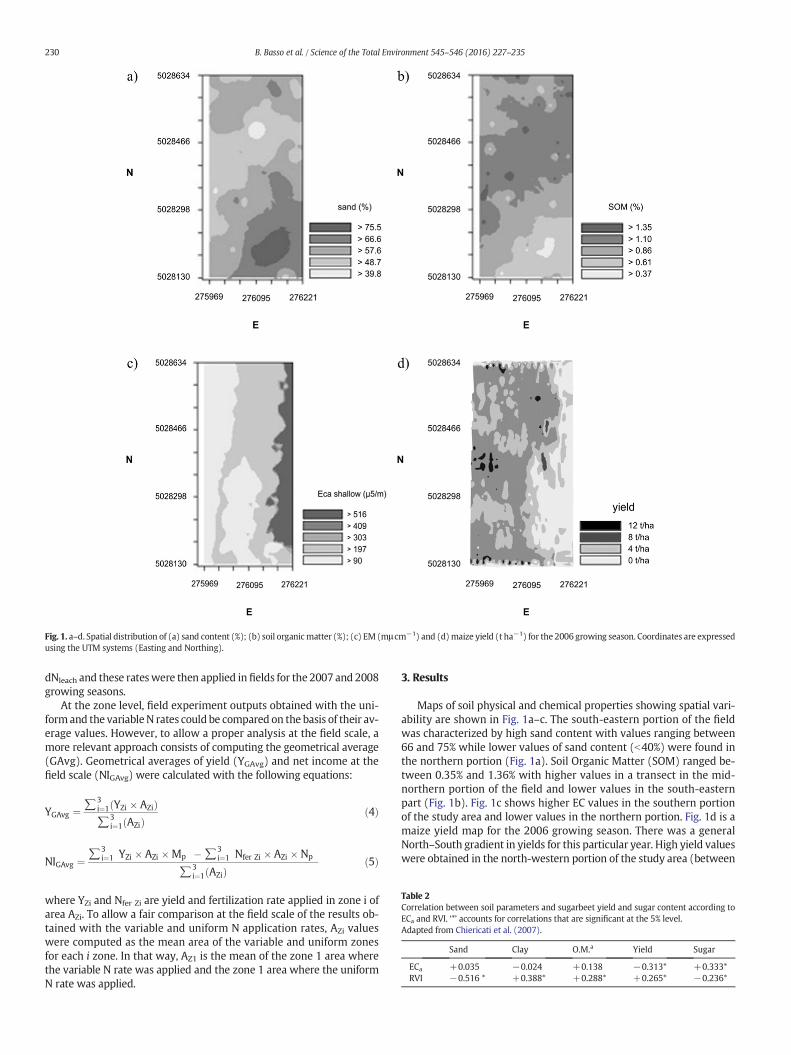
Table 2Correlation between soil parameters and sugarbeet yield and sugar content according toECa and RVI. ‘*’ accounts for correlations that are significant at the 5% level.Adapted from Chiericati et al. (2007).
Sand Clay O.M.a Yield Sugar
ECa +0.035 −0.024 +0.138 −0.313* +0.333*RVI −0.516 * +0.388* +0.288* +0.265* −0.236*
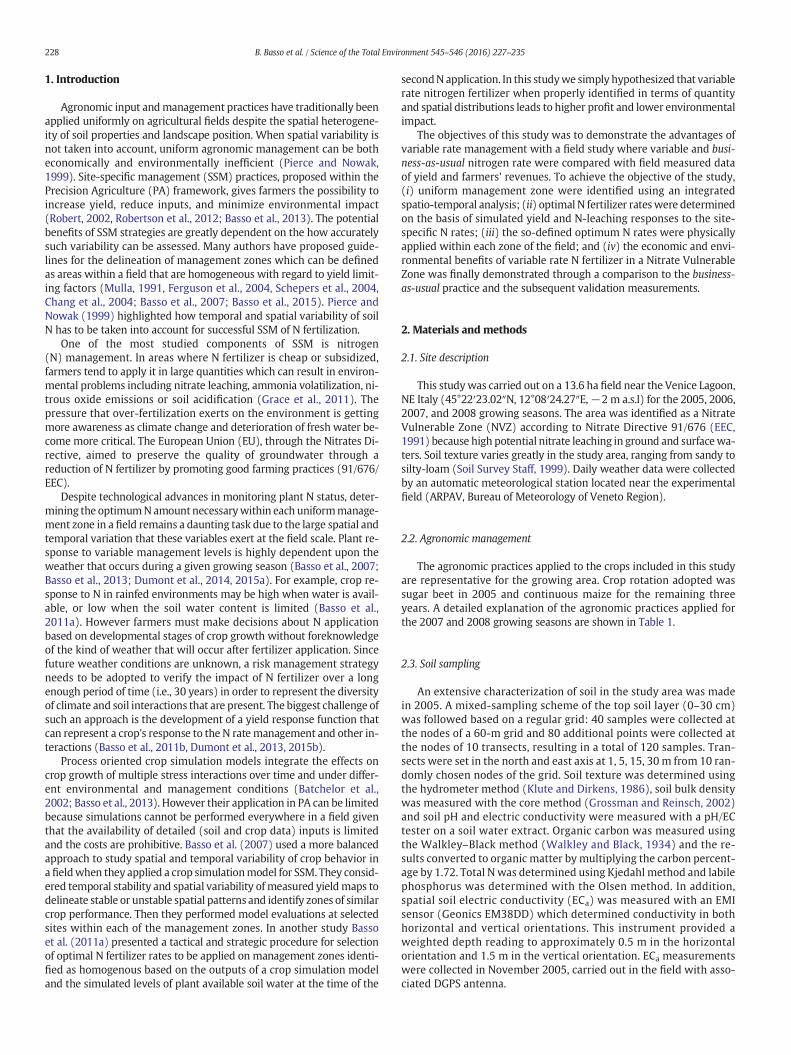
Fig. 1. a–d. Spatial distribution of (a) sand content (%); (b) soil organicmatter (%); (c) EM (mμ cm−1) and (d)maize yield (t ha−1) for the 2006 growing season. Coordinates are expressedusing the UTM systems (Easting and Northing).
230 B. Basso et al. / Science of the Total Environment 545–546 (2016) 227–235
dNleach and these rateswere then applied in fields for the 2007 and 2008growing seasons.
At the zone level, field experiment outputs obtained with the uni-formand the variableN rates could be compared on the basis of their av-erage values. However, to allow a proper analysis at the field scale, amore relevant approach consists of computing the geometrical average(GAvg). Geometrical averages of yield (YGAvg) and net income at thefield scale (NIGAvg) were calculated with the following equations:
YGAvg ¼ ∑3i¼1 YZi � AZið Þ∑3
i¼1 AZið Þð4Þ
NIGAvg ¼∑3
i¼1 YZi � AZi �Mp� ��∑3
i¼1 Nfer Zi � AZi � Np� �
∑3i¼1 AZið Þ
ð5Þ
where YZi and Nfer Zi are yield and fertilization rate applied in zone i ofarea AZi. To allow a fair comparison at the field scale of the results ob-tained with the variable and uniform N application rates, AZi valueswere computed as the mean area of the variable and uniform zonesfor each i zone. In that way, AZ1 is the mean of the zone 1 area wherethe variable N rate was applied and the zone 1 area where the uniformN rate was applied.
3. Results
Maps of soil physical and chemical properties showing spatial vari-ability are shown in Fig. 1a–c. The south-eastern portion of the fieldwas characterized by high sand content with values ranging between66 and 75% while lower values of sand content (b40%) were found inthe northern portion (Fig. 1a). Soil Organic Matter (SOM) ranged be-tween 0.35% and 1.36% with higher values in a transect in the mid-northern portion of the field and lower values in the south-easternpart (Fig. 1b). Fig. 1c shows higher EC values in the southern portionof the study area and lower values in the northern portion. Fig. 1d is amaize yield map for the 2006 growing season. There was a generalNorth–South gradient in yields for this particular year. High yield valueswere obtained in the north-western portion of the study area (between

Fig. 2.Delineation of uniformmanagement zones; Nwas applied on each zone as variableapplication (V) and as uniform application (U). Below each zone is reported the amount ofN applied.
231B. Basso et al. / Science of the Total Environment 545–546 (2016) 227–235
8 and 12 t ha−1) characterized by higher SOM; and low yield valueswere found in the south-eastern portion, where soil fertility was lower.
Table 2 reports correlations coefficient between soil parameters andsugar beet yield (dry mater and sugar content measured in 2005) ac-cording to ECa values and the Ratio Vegetation Index (RVI - ratio ofthe red and near-infrared reflectance measured) that was measuredon July 15th, 2005. RVI was used in 2005 to account for plant vigorand derive the yield map of sugar beet (Chiericati et al., 2007). Soil pa-rameters were significantly correlated with RVI but not with ECa. Yieldand sugar content were correlated with both ECa and RVI.
Three management zones were identified within the field (Fig. 2)using the spatio-temporal analysis depicted at Section 2.5. With the im-position of 3management zones, FPI values ranged between 0.125witha parameter set including only soil characteristics and ECa, and 0.325with a parameter set including soil characteristics, ECa and yield maps(2005–2006). The low FPI values characterized a confident delineationof zones, confirmed by the similarity patterns obtained under both pa-rameter sets (Chiericati et al., 2007). Zone 1 encompasses the south-eastern portion of the field and is characterized by an average clay con-tent of 6.9%, sand content of 71.7%, OM of 0.7% and average maize yieldof 5.15 t ha−1 observed for 2006 (Table 3). Zone 2 is characterized byclay, sand and OM contents of 15.1%, 52.7% and 1%, respectively and av-erage maize yields of 7.32 t ha−1. Zone 2 encompasses the south-western and northern portions of the field. The remaining portions ofthe field, designated Zone 3, are characterized by the highest clay con-tent (29.6%), the lowest sand content (33.4%), an OM content of 1.1%and an average maize yield of 9.21 t ha−1 (Table 3). On the basis of itssoil properties, Zone 1 had the lowest water holding capacity (highsand and low clay contents) and the lowest fertility (low SOM content).On contrary, Zone 3 was characterized by a high water holding capacityand a higher soil SOM.
The SALUSmodel was run for 30-years for each of the three zones atthe five different N rates. Model outputs were averaged over years andresults are shown in Fig. 3a-b. Overall maize yield is higher for Zone 3and lower for Zone 1. In Zone 1 maize yield increased from 6.15 to7.9 t ha−1 for N fertilization rates between 150 kg N ha−1 and
Table 3Zone averaged soil physical and chemical properties, and maize yield observed in 2006.
Clay(%)
Silt(%)
Sand(%)
O.M.a
(%)B.D(g c
Zone 1 6.9 21.4 71.7 0.7 1.6Zone 2 15.1 32.2 52.7 1.0 1.5Zone 3 29.6 37.1 33.4 1.1 1.7
a O.M.: Organic matter.b B.D.: Bulk density.
350 kg N ha−1. In Zone 2 maize yield increased from 6.8 to 8.1 t ha−1
for the same rates and in Zone 3 it slightly increased from 7.75 t ha−1
and reached a plateau of 8.6 t ha−1 at 300 kg N ha−1 (Fig. 3a). The rela-tionship between simulated N leaching and N fertilization rate is shownin Fig. 3b. The overall trend shows that N loss due to leaching increasedasN fertilization rate increased (Fig. 3b). Zone 2 had the lowest values ofN leaching which ranged between 13.5 to 14.8 kg N ha−1 while Nleaching in zone 3 ranged between 14.4 to 15.8 kg N ha−1 (Fig. 3b).
The marginal values of N fertilization for the three zones are shownin Fig. 3c.Marginal values for Zone 1were positive below 300 kg N ha−1
of N applied and negative after application of 300 kg N ha−1. N fertilizerrates higher than 250 kg N ha−1 in Zone 2 were all characterized by anegative marginal value. In Zone 3 all marginal values were below thezero thresholds, except for 150 kg N ha −1. The standard deviations onsimulations were not reported here to increase figure readability, butit is worth noting that they had an impact on the determination of theoptimal N rate.
With regard to the risk of N leaching (Fig. 3d), Zones 2 and 3 had thelowest dNLeach values with linear regression slopes that equaled 0.0008and 4.10−5, respectively. Zone 1 had the highest percent of nitrateleaching losses values and exhibited the highest linear regressionslope (0.0011), offering the highest risk of increasing N leaching as Nfertilization increased.
On the basis of these results, different N rates were selected for eachzone (Table 4 and Fig. 2). The integrated and in depth analysis of the rea-sons that led to the N rate selection is presented in the Discussion sec-tion. For the sub-unit of Zones 1, 2 and 3 that received variable N rate(Zones 1V, 2V and 3V on Fig. 2), the N fertilizer rates were170 kg N ha−1, 220 kg N ha−1, and 200 kg N ha−1
, respectively. Thebusiness-as-usual fertilization regimen consisted of 240 kg N ha−1. Forall zones and rates, N application was split with 50 kg N ha−1 appliedat sowing and the remaining amount applied before elongation(Table 4).
Maps of measured maize yield for the 2007 and 2008 growing sea-sons are shown in Fig. 4a–b. Table 5 shows the results of the averagedmaize yield per zone and subsequent net incomes for the 2007 and2008 growing seasons and for the two different N strategies. In Zone 1the sub-unit with 170 kg N ha−1 showed observed maize yields of4.3 t ha−1 in 2007 and 6.6 t ha−1 in 2008 compared to 4.3 and7.3 t ha−1 for the uniform N fertilization. In Zone 2 the sub-unit withvariable N rate showed a maize yield of 7.1 and 10.2 t ha−1 for the2007 and 2008 growing seasons, respectively. The Zone 2 sub-unitwith uniform N application showed a maize yield of 6.7 t ha−1 in2007 and 9.8 t ha−1 in 2008 (Table 5). Zone 3 recorded 7.4 and9.9 t ha−1 for the sub-unit with variable N for the 2007 and 2008 grow-ing seasons, respectively. The Zone 3 sub-unit with uniform Nmanage-ment showedmaize yields of 8.2 and 11.1 t ha−1 for the 2007 and 2008growing season (Table 5).
The overall arithmetic average maize yield of the two growing sea-sons and for the sub-units with variable N management was7.58 t ha−1 while the average maize yield for the uniform N manage-ment was 7.9 t ha−1 (Table 5). The relative difference equaled −4.0%,relative to uniform management areas. However, the geometrical fieldscale average where variable N rates were applied equaled 7.76 t ha−1
while it equaled 7.95 t ha−1 under uniform treatment, leading to amuch lower relative difference of −2.3%.
.b
m−3)pH ECa
(μS cm−1)Ninit
(%)Maize yield(t ha−1)
7.3 415.8 0.061 5.157.3 633.4 0.092 7.327.0 462.0 0.069 9.21
Fig. 3. a–d. Simulated results from each of three study zones at varying rates of N application. (a) Simulated maize yield; (b) N leaching; (c) Marginal Values; (d) Linear regression ondNleach values (RRMSE between linear regressions and observations equaled 2.7%, 2.9% and 1.3%, respectively for zone 1, 2 and 3).
232 B. Basso et al. / Science of the Total Environment 545–546 (2016) 227–235
Net return was higher for uniform N rates for Zone 3 with a differ-ence of 98 € ha−1 with respect to variable N management (Table 5).For the Zones 1 and 2, the variable N fertilization rate gave respectively58 and 73 € ha−1 net returnsmore than the uniformN fertilization. Thearithmetic average resulted in a −0.29% relative net revenue loss forSSM. However, when the geometrical averages were computed, theoverall net revenue at thefield scalewas only 849 €ha−1 under uniformNmanagement, while it reached 861 € ha−1 under variable N manage-ment. In otherwords, SSMoffered a+1.36% increase in net revenue perhectare.
Fig. 5 reports the measured soil N–NO3− content averaged over the
crop seasons 2007 and 2008 for each zone and each fertilizer treatment,as well as the averaged over the whole field for the two treatments. Inzone 1 and 3, the variable rate treatment systematically gave lower N–NO3
− contents in the soil solution. In particular, zone 3 showed a highN–NO3
− content during crop season 2008 under the uniform rate com-pared to the variable treatment. Zone 2 reported opposite results, andthe zone where variable management was practiced exhibited a highersoil N-NO3
− concentration compared to the business-as-usual rate. Therelative difference between the two zones decreased from 36% to 30%between 2007 and 2008. Globally, over years and zones, variable man-agement treatment showed an averaged concentration of 55 ppm,while uniform rate exhibited an averaged 64 ppm concentration (16%higher).
Fig. 6 shows the relationship between the simulated N leaching (av-eraged over 30 years) and the net return (average of observations in2007–2008) for each zone, and for variable and uniform N manage-ment. In all three zones studied, uniform Nmanagement caused higher
Table 4Variable and uniform N application by zone., The same amount of N (50 kg N ha−1) was appli
Total N(kg N ha−1)
dNleach
(slope)Op(k
Zone 1 170 (50 + 120) 0.0011 [3Zone 2 220 (50 + 170) 0.0008 [2Zone 3 200 (50 + 150) 4.10−5 [1Unif. N 240 (50 + 190) NAa NA
a NA: Not applicable.
N leaching than the variable N application. This finding is a significantfinding because it demonstrates the when N fertilizer rate is properlychosen, it minimizes nitrate leaching without affecting net revenue.The highest net revenues obtained in zone 3 under uniform manage-ment were negatively offset by higher N leaching which contributes toenvironmental degradation. The highest N leaching values were ob-tained for Zone 3 under uniform N management with 15.2 kg N ha−1;while under variable N application the same zone showed leachingvalues of 14.8 kg N ha−1 (Fig. 5). In both Zones 1 and 2, net incomeswere higher under the variable N management and N leaching waslower.
4. Discussion
Spatial variability is not usually considered by farmers at the time ofsecond N fertilization and they generally apply a uniform N rate in thestudy area of about 240 (50 + 190) kg N ha−1 across a field. Thestrength of a system approach lays in the fact that the interaction be-tween soil, weather, management and genetics can be taken into ac-count when dealing with a complex aspect such as the decision of theN fertilizer to apply and the lack of knowledge site-specific responseof a crop at various N levels over a long period of time. The long termsimulations with different weather allow to capture the ranges ofyield responses to nitrogen rates and choose the optimal rate thatmore frequently provides the best outcomes in terms of higher yieldand lower nitrate leaching. This process minimizes the farmer faceswhen it has to make this decision. Previous studies concluded that themarginal economic return in site-specific managed zones was higher if
ed at sowing and different rates were applied at elongation.
tim. MVg N ha−1)
Notes
00] High risk (dNleach) of increasing N leaching00–250] Low N leaching — High MV response to N50–200] High N leaching — Low dNleach — Low MV response to Na Farmers' uniform management
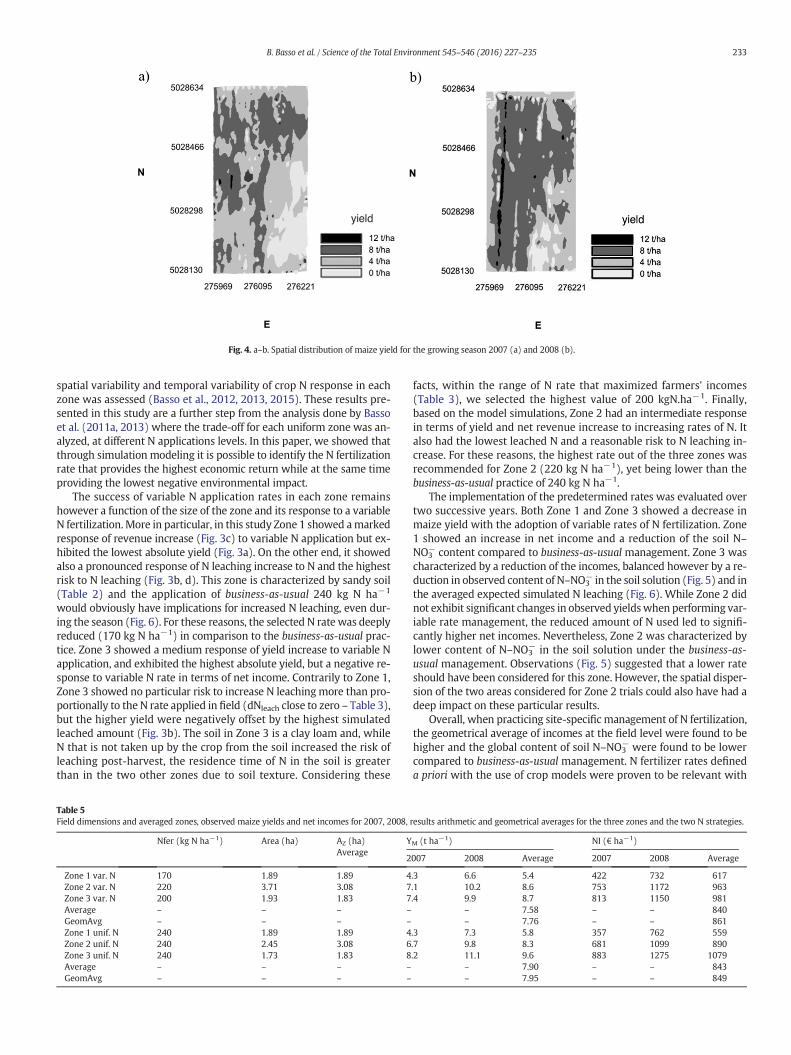
Fig. 4. a–b. Spatial distribution of maize yield for the growing season 2007 (a) and 2008 (b).
233B. Basso et al. / Science of the Total Environment 545–546 (2016) 227–235
spatial variability and temporal variability of crop N response in eachzone was assessed (Basso et al., 2012, 2013, 2015). These results pre-sented in this study are a further step from the analysis done by Bassoet al. (2011a, 2013) where the trade-off for each uniform zone was an-alyzed, at different N applications levels. In this paper, we showed thatthrough simulation modeling it is possible to identify the N fertilizationrate that provides the highest economic return while at the same timeproviding the lowest negative environmental impact.
The success of variable N application rates in each zone remainshowever a function of the size of the zone and its response to a variableN fertilization.More in particular, in this study Zone 1 showed amarkedresponse of revenue increase (Fig. 3c) to variable N application but ex-hibited the lowest absolute yield (Fig. 3a). On the other end, it showedalso a pronounced response of N leaching increase to N and the highestrisk to N leaching (Fig. 3b, d). This zone is characterized by sandy soil(Table 2) and the application of business-as-usual 240 kg N ha−1
would obviously have implications for increased N leaching, even dur-ing the season (Fig. 6). For these reasons, the selected N rate was deeplyreduced (170 kg N ha−1) in comparison to the business-as-usual prac-tice. Zone 3 showed a medium response of yield increase to variable Napplication, and exhibited the highest absolute yield, but a negative re-sponse to variable N rate in terms of net income. Contrarily to Zone 1,Zone 3 showed no particular risk to increase N leachingmore than pro-portionally to the N rate applied in field (dNleach close to zero – Table 3),but the higher yield were negatively offset by the highest simulatedleached amount (Fig. 3b). The soil in Zone 3 is a clay loam and, whileN that is not taken up by the crop from the soil increased the risk ofleaching post-harvest, the residence time of N in the soil is greaterthan in the two other zones due to soil texture. Considering these
Table 5Field dimensions and averaged zones, observed maize yields and net incomes for 2007, 2008,
Nfer (kg N ha−1) Area (ha) AZ (ha)Average
Y
2
Zone 1 var. N 170 1.89 1.89 4Zone 2 var. N 220 3.71 3.08 7Zone 3 var. N 200 1.93 1.83 7Average – – – –
GeomAvg – – – –
Zone 1 unif. N 240 1.89 1.89 4Zone 2 unif. N 240 2.45 3.08 6Zone 3 unif. N 240 1.73 1.83 8Average – – – –
GeomAvg – – – –
facts, within the range of N rate that maximized farmers' incomes(Table 3), we selected the highest value of 200 kgN.ha−1. Finally,based on the model simulations, Zone 2 had an intermediate responsein terms of yield and net revenue increase to increasing rates of N. Italso had the lowest leached N and a reasonable risk to N leaching in-crease. For these reasons, the highest rate out of the three zones wasrecommended for Zone 2 (220 kg N ha−1), yet being lower than thebusiness-as-usual practice of 240 kg N ha−1.
The implementation of the predetermined rates was evaluated overtwo successive years. Both Zone 1 and Zone 3 showed a decrease inmaize yield with the adoption of variable rates of N fertilization. Zone1 showed an increase in net income and a reduction of the soil N–NO3
− content compared to business-as-usual management. Zone 3 wascharacterized by a reduction of the incomes, balanced however by a re-duction in observed content of N–NO3
− in the soil solution (Fig. 5) and inthe averaged expected simulated N leaching (Fig. 6). While Zone 2 didnot exhibit significant changes in observed yieldswhen performing var-iable rate management, the reduced amount of N used led to signifi-cantly higher net incomes. Nevertheless, Zone 2 was characterized bylower content of N–NO3
− in the soil solution under the business-as-usual management. Observations (Fig. 5) suggested that a lower rateshould have been considered for this zone. However, the spatial disper-sion of the two areas considered for Zone 2 trials could also have had adeep impact on these particular results.
Overall, when practicing site-specific management of N fertilization,the geometrical average of incomes at the field level were found to behigher and the global content of soil N–NO3
− were found to be lowercompared to business-as-usual management. N fertilizer rates defineda priori with the use of crop models were proven to be relevant with
results arithmetic and geometrical averages for the three zones and the two N strategies.
M (t ha−1) NI (€ ha−1)
007 2008 Average 2007 2008 Average
.3 6.6 5.4 422 732 617
.1 10.2 8.6 753 1172 963
.4 9.9 8.7 813 1150 981– 7.58 – – 840– 7.76 – – 861
.3 7.3 5.8 357 762 559
.7 9.8 8.3 681 1099 890
.2 11.1 9.6 883 1275 1079– 7.90 – – 843– 7.95 – – 849

Fig. 5. Soil N–NO3− content (in ppm) measurements. Results are reported as the averages
for variable and uniform rates, and individual results obtained under the different zones,during the crop seasons 2007 and 2008.
234 B. Basso et al. / Science of the Total Environment 545–546 (2016) 227–235
measures performed a posteriori. This study showed that crop simula-tion models can help farmers to make decisions about the optimal rateof fertilizer application within management zones. The trade-off be-tween net income and N leaching clearly showed that uniform N appli-cation was not efficient, neither from the economic nor from theenvironmental point of view (Basso et al., 2011a, 2011b; Dumontet al., 2015b). Results of this study suggest that it is definitely not sus-tainable to use a fixed N rate for the entire field when considering theenvironmental constraints of the EU Nitrate directive (EEC, 1991).
Another problem with higher N fertilization rates is the associationof nitrous oxide (N2O) emissions from agricultural systems to climatechange (Robertson and Goffman, 2007). Therefore, a trade-off betweenN2O emissions, loss of nitrate through leaching, N fertilizermanagementpractices, and crop yield has to be considered for each uniform zonewhen planning to apply variable N rates. The choice of an appropriateN rate for each zone, that is the most manageable commodity helps re-duce environmental pollution from greenhouse gas emissions and Nleaching while maintaining economic viability for farmers.
5. Conclusions
This study showed with field observations that environmental andeconomic benefits can simultaneously be achieved using variable N fer-tilization. Through a sophisticated procedure that links crop modelingwith geospatial sciences, this study underlined the critical role oftradeoff between yield production and environmental outcomes anddemonstrated how nitrogen management can be optimized to increaseprofit and reduce environmental impact. Spatial soil and yield informa-tionwere successfully used for identifying uniformmanagement zones.
Fig. 6. Relationship between observed net return and simulated N leaching for Zone 1(diamonds), Zone 2 (circles), and Zone 3 (triangles) for variable (black symbols) anduniform (white symbols) N.
The use of a crop simulation model to account for the soil-plant-atmosphere system interaction over space and time, helped select theproper amount of N to apply in order to minimize N leaching in eachzone, without detrimentally impacting farmers revenues.
Research should focus on deepening the knowledge of soil-plant-atmosphere interactions at a spatial and temporal scale, and to extrapo-late those findings beyond a single farm to watershed or county levels.One the advantages of the approach developed in this paper lies pre-cisely in the use of crop models, which allow to deal with other cropand soil management techniques that impacts N balance.
In conclusion, understanding spatial and temporal interactions be-tween soil-plant-atmosphere is very important for a successful imple-mentation of site-specific N management. Through the deployment ofsuch a global approach and the subsequent validation via measure-ments, this research demonstrated that the agricultural systems of theNitrate Vulnerable Zones would be both economically profitable andenvironmentally sustainable under site-specific management of Nfertilization.
Acknowledgments
This studywas partly supported by Veneto Agricoltura Regional Pro-ject “Agricoltura di precisione e conservativa”; funding for Basso andDumont were provided by the USDA-NIFA Award no. 2015-68007-23133 and 2011-68002-30190. Any opinions, findings, and conclusionsor recommendations expressed in this publication are those of the au-thors and do not necessarily reflect the views of USDA. The fundershad no role in study design, data collection and analysis, decision topublish, or preparation of the manuscript. The authors wish to thankAnne Stanton for her technical support.
References
Basso, B., Ritchie, J.T., 2015. Simulating crop growth and biogeochemical fluxes in re-sponse to land management using the SALUS model. In: Hamilton, S.K., Doll, J.E.,Robertson, G.P. (Eds.), The Ecology of Agricultural Landscapes: Long-term Researchon the Path to Sustainability. Oxford University Press, New York, NY USA,pp. 252–274.
Basso, B., Bertocco, M., Sartori, L., Martin, E.C., 2007. Analyzing the effects of climate var-iability on spatial patterns of yield in a maize-wheat-soybean rotation. Eur. J. Agron.26, 82–91.
Basso, B., Cammarano, D., Troccoli, A., Chen, D., Ritchie, J.T., 2010. Long-term wheat re-sponse to nitrogen in a rainfed Mediterranean environment: field data and simula-tion analysis. Eur. J. Agron. 33, 132–138.
Basso, B., Ritchie, J.T., Cammarano, D., Sartori, L., 2011a. A strategic and tactical manage-ment approach to select optimal N fertilizer rates for wheat in a spatially variablefield. Eur. J. Agron. 35, 215–222.
Basso, B., Sartori, L., Bertocco, M., Cammarano, D., Grace, P.R., 2011b. Economic and envi-ronmental evaluation of site-specific tillage in a maize crop in NE Italy. Eur. J. Agron.35, 83–92.
Basso, B., Sartori, L., Cammarano, D., Fiorentino, C., Grace, P.R., Fountas, S., Sorensen, C.A.,2012. Environmental and economic evaluation of N fertilizer rates in a maize crop inItaly: a spatial and temporal analysis using crop models. Biosys. Eng. 113, 103–111.
Basso, B., Cammarano, D., Fiorentino, D., Ritchie, J.T., 2013. Wheat yield response to spa-tially variable nitrogen fertilizer in Mediterranean environment. Eur. J. Agron. 51,65–70.
Basso, B., Fiorentino, C., Cammarano, D., Schulthess, U., 2015. Variable rate nitrogen fertil-izer response in wheat using remote sensing. Precision Agric. (In press). DOI:10.1007/s11119-015-9414-9
Batchelor, W.D., Basso, B., Paz, J.O., 2002. Examples of strategies to analyze spatial andtemporal yield variability using crop models. Eur. J. Agron. 18, 141–158.
Bertocco, M., Basso, B., Sartori, L., Martin, E.C., 2008. Evaluating energy efficiency of site-specific tillage in maize in NE Italy. Bioresour. Technol. 99 (15), 6957–6965.
Chang, J., Clay, D.E., Carlson, C.G., Reese, C.L., Clay, S.A., Ellsbury, M.M., 2004. Defining yieldgoals and management zones to minimize yield and nitrogen and phosphorus fertil-izer recommendation errors. Agron. J. 96, 825–831.
Chiericati, M., Morari, F., Sartori, L., Ortiz, B., Perry, C., Vellidis, G., 2007. Delineating man-agement zones to apply site-specific irrigation in the Venice lagoon watershed. In:Stafford, J.V. (Ed.), Precision Agriculture '07. Wageningen Academic Publishers, TheNetherlands: Wageningen, pp. 599–606.
Dumont, B., Basso, B., Leemans, V., Bodson, B., Destain, J.P., Destain, M.F., 2013. Yield var-iability linked to climate uncertainty and nitrogen fertilisation. In: Stafford, J.V. (Ed.),Precision Agriculture '13. Wageningen Academic Publishers, The Netherlands:Wageningen, pp. 427–434.
235B. Basso et al. / Science of the Total Environment 545–546 (2016) 227–235
Dumont, B., Basso, B., Leemans, V., Bodson, B., Destain, J.P., Destain, M.F., 2014. Systematicanalysis of site-specific yield distributions resulting from nitrogen management andclimatic variability interactions. Precision Agric. 16, 361–384.
Dumont, B., Basso, B., Leemans, V., Bodson, B., Destain, J.P., Destain, M.F., 2015a. A compar-ison of within season yield prediction algorithms based on crop model behaviouranalysis. Agric. Forest Meteorol. 204, 10–21.
Dumont, B., Basso, B., Bodson, B., Destain, J.P., Destain, M.F., 2015b. Climatic risk assess-ment to improve nitrogen fertilisation recommendations: a strategic crop model-based approach. Eur. J. Agron. 65, 10–17.
European Economic Community, 1991. Council Directive of 12 December 1991concerning the protection of waters against pollution caused by nitrates from agricul-tural sources (available at http://eur-lex.europa.eu/legal-content/EN/TXT/?uri=CELEX:31991L0676 verified November 2015).
Ferguson, R.B., Lark, R.M., Slater, G.P., 2004. Approaches to management zone definitionfor use of nitrification inhibitors. Soil Sci. Soc. Am. J. 67, 937–947.
Fridgen, J.J., Kitchen, N.R., Sudduth, K.A., Drummond, S.T., Wiebold, W.J., Fraisse, C.W.,2004. Management zone analyst (MZA): software for subfield management zone de-lineation. Agron. J. 96, 100–108.
Golden Software, 1995. Surfer mapping system. Version 6.0 for Windows. Golden Soft-ware Inc., Golden, CO.
Grace, P.R., Robertson, G.P., Millar, N., Colunga-Garcia, M., Basso, B., Gage, S.H., Hoben, J.,2011. The contribution of maize cropping in the Midwest USA to global warming: aregional estimate. Agric. Systems 104, 292–296.
Grossman, R.B., Reinsch, T.G., 2002. Bulk density and linear extensibility. In: Dane, J.H.,Topp, C.G. (Eds.), SSSA Book Series 5.4: Methods of Soil Analysis: Part 4 PhysicalMethods. Chapter 2 — The Solid Phase. Soil Science Society of America, Inc. Madison,Wisconsin, USA.
Klute, A., Dirkens, C., 1986. Hydraulic conductivity and diffusivity: laboratory methods. In:Klute, A. (Ed.), Methods of Soil Analysis— Part 1. Physical andMineralogical Methods,second ed. SSSA/ASA Madison, WI, pp. 687–734.
Mulla, D.J., 1991. Using geostatistics and GIS to manage spatial patterns in soil fertility. In:Kranzler, G. (Ed.), Proc. of the Automated Agricultural for the 21st Century. ASAE, Chi-cago, IL (December 1991., St. Joseph, MI, 16–17).
Pezzuolo, A., Basso, B., Marinello, F., Sartori, L., 2014. Using SALUS model for medium andlong term simulations of energy efficiency in different tillage systems. Appl. Math. Sci.8 (129), 6433–6445.
Pierce, F.J., Nowak, P., 1999. Aspects of precision agriculture. Adv. Agron. 67, 1–85.Ritchie, J.T., Gerakis, A., Suleiman, A., 1999. Simple model to estimate field-measured soil
water limits. Trans. ASAE 42, 1609–1614.Robert, P.C., 2002. Precision agriculture: a challenge for crop nutrition management. Plant
Soil 247, 143–149.Robertson, G.P., Goffman, P., 2007. Nitrogen transformations. In: Paul, E.A. (Ed.), Soil Mi-
crobiology, Ecology, and Biochemistry, third ed. Academic/Elsevier, New York,pp. 341–364.
Robertson, M.J., Llewellyn, R.S., Mandel, R., Lawes, R., Bramley, R.G.V., Swift, L., Metz, N.,O'Callaghan, C., 2012. Adoption of variable rate fertiliser application in theAustralian grains industry: status, issues and prospects. Precision Agric. 13, 181–199.
Schepers, A.R., Shanahan, J.F., Liebig, M.A., Schepers, J.S., Johnson, S.H., Luchiari Jr., A., 2004.Appropriateness of management zones for characterizing spatial variability of soilproperties and irrigated corn yields across years. Agron. J. 96, 195–203.
Software, G.D., 2009. GS+: Geostatistics for Environmental Sciences. Version 9.0. GammaDesign Software, Plainwell, MI, p. 44.
Soil Survey Staff, 1999. Soil Taxonomy. second ed. USDA, National natural resources Con-servation Service, Washington, DC.
Walkley, A., Black, I.A., 1934. An examination of the Degtjareff method for determining or-ganic carbon in soils: effect of variations in digestion conditions and of inorganic soilconstituents. Soil Sci. 63, 251–263.