![Hantarex MTC9000 (14-16-20in) [Service] [English]](https://static.fdocuments.us/doc/165x107/55176ca7497959a0308b48ea/hantarex-mtc9000-14-16-20in-service-english.jpg)
Schweizer%20Tourismus%20in%20Zahlen%2008%20
48
Swiss Tourism in Figures Edition 2008
-
Upload
beatrice-herrmann -
Category
Documents
-
view
213 -
download
1
description
http://www.swisstourfed.ch/files/infothek/Vademecum/2008/Schweizer%20Tourismus%20in%20Zahlen%2008%20E.pdf
Transcript of Schweizer%20Tourismus%20in%20Zahlen%2008%20

Swiss Tourism in Figures Edition 2008

2
Swis
s To
uri
sm i
n F
igu
res
20
08 Contents
Legal bases 3Tourist regions 5Tourism – an important sector of the economy 6Jobs and employees 11Mobility in Switzerland — results on travel behaviour 13Hotel and catering industry 15Accommodation sector 16Catering 29Outgoing 33Transport 34Sports 37Formal education 38Quality label for the Swiss tourism industry 40International 41Tourism associations and institutes 43
Edited byu Swiss Tourism Federation (STF)u Swiss Federal Statistical Office (SFSO)u GastroSuisseu hotelleriesuisseu Swiss Federation of Travel Agencies (SFTA)u Switzerland Tourism (ST)u Swiss Cablewaysu Public Transport Association
The data in this publication is the latest available. The publication is also available on www.swisstourfed.ch.
Artwork: Desk Design, 3032 HinterkappelenPhotos: Boris Baldinger, www.boris-baldinger.comPrint: Länggass Druck AG, 3012 Berne
Supported by the State Secretariat for Economic Affairs SECO
Berne, July 2008

3
Legal bases
Swis
s To
uri
sm i
n F
igu
res
20
08Legal bases of the Federal Government
National Promotion of Tourism: Bundesgesetz vom 21. Dezember 1955 über die Schweizerische Verkehrszentrale, ab 1995 Schweiz Tourismus (SR 935.21)
Promotion of Innovation and Cooperation: Bundesgesetz vom 10. Oktober 1997 über die Förderung von Innovation und Zusammenarbeit im Tourismus (SR 935.22)
Promotion of the Lodging Industry: Bundesgesetz vom 20. Juni 2003 über die Förderung der Beherbergungswirtschaft (SR 935.12)
Regional Policy: Bundesgesetz vom 6. Oktober 2006 über die Regionalpolitik (Stand 1. Januar 2008); (SR 901.0)
Gambling Facilities: Bundesgesetz vom 18. Dezember 1998 über Glücksspiele und Spielbanken (Spielbankengesetz, SBG) (SR 935.52)
Exclusiv VAT Tariff for Lodgin Services: Bundesgesetz vom 2. September 1999 über die Mehrwertsteuer (Mehrwertsteuergesetz, MWSTG) (SR 641.20)
Tourism Statistics: Verordnung vom 30. Juni 1993 über die Durchführung von statistischen Erhebungen des Bundes (SR 431.012.1)
Natural Parks: Bundesgesetz über den Natur- und Heimatschutz (NHG), vom 1. Juli 1966 (SR 451)
Source: www.admin.ch

4
Legal bases
Overview of tourism laws of the Swiss Cantons
Canton Internet LawAargau www.ag.ch No tourism lawAppenzell Innerrhoden www.ai.ch Tourismusförderungsgesetz vom 25. April 1999Appenzell Ausserrhoden www.ar.ch Tourismusgesetz vom 22. September 2003Basel-Landschaft www.bl.ch Tourismusgesetz vom 19. Juni 2003Basel-Stadt www.bs.ch Standortförderungsgesetz vom 29. Juni 2006 Bern www.be.ch Tourismusentwicklungsgesetz vom 20. Juni 2005Fribourg www.fr.ch Tourismusgesetz vom 13. Oktober 2005Geneva www.ge.ch Tourismusgesetz vom 24. Juni 1993Glarus www.gl.ch Tourismusentwicklungsgesetz vom 6. Mai 2007Graubünden www.gr.ch Wirtschaftsentwicklungsgesetz vom 11. Februar 2004Jura www.ju.ch Tourismusgesetz vom 31. Mai 1990Lucerne www.lu.ch Tourismusgesetz vom 30. Januar 1996Neuchâtel www.ne.ch Tourismusgesetz vom 25. Juni 1986Nidwalden www.nw.ch Fremdenverkehrsgesetz vom 25. April 1971Obwalden www.ow.ch Tourismusgesetz vom 8. Juni 1997St. Gallen www.sg.ch Tourismusgesetz vom 26. November 1995Schaffhausen www.sh.ch Tourismusgesetz vom 2. Dezember 1996Solothurn www.so.ch Wirtschaftsgesetz vom 9. Juni 1996Schwyz www.sz.ch Gesetz über die Wirtschaftsförderung vom 27. November 1986Thurgau www.tg.ch Gastgewerbegesetz vom 26. Juni 1996Ticino www.ti.ch Tourismusgesetz vom 30. November 1998Uri www.ur.ch Verordnung vom 4. April 2004 über die Förderung des TourismusVaud www.vd.ch Tourismusgesetz vom 15. September 1999Valais www.vs.ch Tourismusgesetz vom 9. Februar 1996Zug www.zg.ch Tourismusgesetz vom 27. März 2003Zurich www.zh.ch No tourism law
Swis
s To
uri
sm i
n F
igu
res
20
08

5
1
23
5
4
6
10
7
8
13 12
11
9
0 25 50 km
Tourist regions
1 Graubünden: Canton of Graubünden 2 Eastern Switzerland: Canton of Glarus, Canton of Schaffhausen, Canton of St. Gallen, excluding parts
of the See-Gaster district, Canton of Thurgau, Canton of Appenzell-Innerrhoden and Canton of Appenzell-Auserrhoden
3 Zurich Region: Canton of Zurich, Canton of Aargau: districts of Baden, parts of the Bremgarten and Zurzach districts, Canton of Schwyz: districts Höfe and March, Canton of St. Gallen: parts of the See-Gaster
4 Basel Region: Canton of Basel-Stadt and of Basel-Land, Canton Solothurn: districts Dorneck and Thierstein, Canton Aargau: the Laufenburg and Rheinfelden districts, parts of Zurzach
5 Central Switzerland: Cantons of Lucerne, Uri, Schwyz excluding the March and Höfe district, Canton of Aargau: the Kulm and Muri districts, parts of: Lenzburg district, Cantons of Obwalden, Nidwalden and Zug
6 Schweizer Mittelland: the Bernese districts of Aarberg, Aarwangen, Berne, Biel, Büren, Burgdorf, Cerlier, Fraubrunnen, Konolfingen, Laupen, Nidau, Schwarzenburg, Seftigen, Signau, Trachselwald and Wangen; from the Canton of Solothurn the districts Gäu, Tal, Bucheggberg, Gösgen, Wasseramt, Lebern, Olten and Solothurn, from the Canton of Aargau the districts Aarau, Brugg, Zofingen, parts of the Bremgarten and Lenzburg districts
7 Neuchâtel /Jura/Jura Bernois: Cantons of Neuchâtel, Jura and the Bernese districts Courtelary, Moutier and La Neuveville
8 Lake Geneva Region (Vaud): Canton of Vaud 9 Fribourg Region: Canton of Fribourg 10 Bernese Oberland: districts of Frutigen, Interlaken, Niedersimmental, Oberhasli, Saanen and Thun 11 Ticino: Canton of Ticino 12 Valais: Canton of Valais 13 Geneva: Canton of Geneva
Swis
s To
uri
sm i
n F
igu
res
20
08
© Swiss Federal Statistical Office As of 2006

6
2003 2004 2005 2006 2007
9.6 9.7 1) 1) 1)
11.6 11.9 12.5 13.6 14.6 21.2 21.6 1) 1) 1)
5.1% 4.8% 1) 1) 1)
2003 2004 2005 2006 2007
50.9 55.2 58.3 65.0 72.5 45.2 49.6 54.8 63.0 68.8 10.2 11.2 12.4 13.7 16.0 11.6 11.9 12.5 13.6 14.6 4.2 4.2 4.2 4.4 4.6
Tourism – an important sector of the economySw
iss
Tou
rism
in
Fig
ure
s 2
00
8 Tourism generates incomeDomestic and international tourism are important factors in the Swiss economy. Of a total revenue of CHF 21.6 billion in 2004, 9.7 billion (or 44.9%) came from domes-tic tourism. Expenditure by foreign visitors in Switzerland added some CHF 11.9 billion (2.6% of the Gross Domestic Product).
Total tourism revenue in billion CHFFrom domestic touristsFrom foreign tourists (Tourism balance of payments) 2)
TotalTourism’s share of Swiss Gross Domestic Product
1) no estimate2) 2003/04/05: revised figures, 2006/07: provisional figuresSource: Swiss Federal Statistical Office
Tourism – an invisible exportThe expenditure of foreign guests in Switzerland has the same effect on the Swiss balance of payments as the export of goods. 8.3 percent of Switzerland’s export re venue come from tourism.
Export revenue by industry 1)
in billion CHF1. Metal and machine industry2. Chemical industry3. Watchmaking industry4. Tourism (Tourism balance of payments)5. Textile industry
1) excl. income from capital abroad and work abroadSource: Swiss Federal Statistical Office

7
20051) 20062) 20072) 20051) 20062) 20072)
8.2 8.9 9.9 8.3 9.0 9.9 6.3 6.9 7.8 1.9 2.0 2.1 2.8 3.0 3.1 2.7 2.5 2.4 1.5 1.6 1.7 12.5 13.6 14.6 11.0 11.6 12.3
Tourism – an important sector of the economy
Tourism, including overnight stays as the major source of incomeThe tourism balance of payments shows the revenue from foreign tourists in Swit-zerland and the expenditure of Swiss tourists abroad. Calculations are based on a mixture of statistical data including frequency, turnover and prices, additional sta-tistics from foreign and domestic authorities as well as estimates.
Tourism balance of paymentsRevenue/Expenditure Revenue from Expenditure of Swiss foreign tourists tourists abroad in billion CHF in billion CHF
Tourism, including overnight staysVisitors staying in lodging facilities and with relativesEducational & medical stays
Excursionists, transit visitors, other tourismConsumption expenditure of border-zone inhabitants including short-term residents (< 4 months)Total
1) revised figures 2) provisional figuresSource: Swiss Federal Statistical Office
Swis
s To
uri
sm i
n F
igu
res
20
08

8
143 72 86 301 24 29 26 79 13 26 22 61 20 26 20 66 28 25 11 63 33
Tourism – an important sector of the economySw
iss
Tou
rism
in
Fig
ure
s 2
00
8 Average spending per visitor and overnight stay
Overnight tourists Expenditure 2003 in million CHF for: Lodging Meals Incidentals Total In hotelsIn vacation apartmentsAt camp groundsIn group accommodationIn youth hostelsWith friends and relatives
Source: Swiss Federal Statistical Office
Distribution of incidentalsForeign guests in Switzerland spend money not only in hotels and restaurants, but also in other businesses. In 2004, for instance, they spent the following estimated amounts on:
Sector Expenditures 2004Fuel CHF 695 millionTobacco CHF 137 millionSweets CHF 288 millionSouvenirs, handicrafts CHF 67 millionTaxi fares CHF 111 million Inland water transportation CHF 20 millionSights or points of interest CHF 21 million
Source: Swiss Federal Statistical Office

9
Tourism – an important sector of the economy
Swis
s To
uri
sm i
n F
igu
res
20
08Facts and figures
In Switzerland many industries benefit directly and indirectly from tourism. It ranksfourth in the national export balance and with about 30 000 employees is one of Switzerland’s most important small-business sectors.– 6.2 percent share of gross domestic product GDP (2006) 1)
– CHF 14.6 billion export revenue generated by foreign guests 2)
– 72.5 billion overnight stays in hotel and parahotel industry (2007) 3)
– CHF 28.3 billion tourism gross value added (2006) 1)
Tourism is the leading economic sector in mountain areasTourism is the key growth sector in mountain areas and marginal regions and helps maintain the balance between periphery and centre:– Grisons: 30 percent of cantonal GDP and 30 percent of total employment (2007)4)
– Valais: 25 percent of cantonal GDP and 27 percent of total employment (2002)5)
Tourism shapes Switzerland’s image abroadStudies show that Switzerland is a well-known brand:– «Swissness» is a purchase-relevant factor abroad– The Switzerland brand is associated with positive contents around the world,
especially with nature and natural beauty
Tourism creates jobsTourism is an important employer in urban and rural areas and fulfills its responsibil-ity as a provider of apprenticeship positions. Tourism jobs are non-relocatable.– 335 000 full-time equivalents – direct and indirect employment (2007) 6)
– 10 percent of total employment in Switzerland
Quality as a competitive advantageThe Quality Label for Swiss Tourism (Q) is a joint industry program to enhance the quality of service. Currently labeled businesses per stage (per 31.12.2007):Q1: 1158, Q2: 257, Q3: 195
1) The Travel & Tourism Competitiveness Report 2007, WEF 2007, 2) Swiss Federal Statistical Office, 3) Estimate Switzerland Tourism, 4) Der Tourismus im Kanton Graubünden. Wertschöpfungsstudie, HTW Chur 2007, 5) Volkswirtschaftliche Bedeutung des Tourismus im Kanton Wallis, Berwert, A.; Rütter H.; Müller. H., 2002, 6) Employment statistic, Swiss Federal Statistical Office

10
30 610 100 14 500 47 3 120 10 11 380 37 9 790 32 4 890 16 4 900 16 1 790 6 690 2 3 840 13
20%
9%
1%
2%
10%
8%
31%
14%
5%
Added value of tourism: Many branches of the economy benefit from tourismAccounting for 31 percent of tourism’s added value, the lodging sector is the main economic branch of tourism. The lodging and food and beverage serving services together account for 45 percent of tourism’s added value. Over half of tourism’s added value comes from other economic sectors.
Contribution of economic sectors to added value in 1998
Source: Swiss Federal Statistical Office
Foreign tourists accounted for 47 percent of tourist expenditure in 1998
million CHF %Tourism consumptionInternational visitors
Same-day visitorsTourists (overnight visitors)
Domestic visitorsSame-day visitorsTourists (overnight visitors)
Domestic business tripsUse of second homes on own account or free of chargeOther components
Source: Swiss Federal Statistical Office
Tourism – an important sector of the economySw
iss
Tou
rism
in
Fig
ure
s 2
00
8
Non-specific tourism industries
Retail trade
Tourism-related industries(not including retail trade)
Recreation & other entertainment services
CultureTravel agencies, tour operators and tourist offices
Passenger transport
Accomodation
Food and beverage
11
53.9
7.6
180.7
90.8
2.4
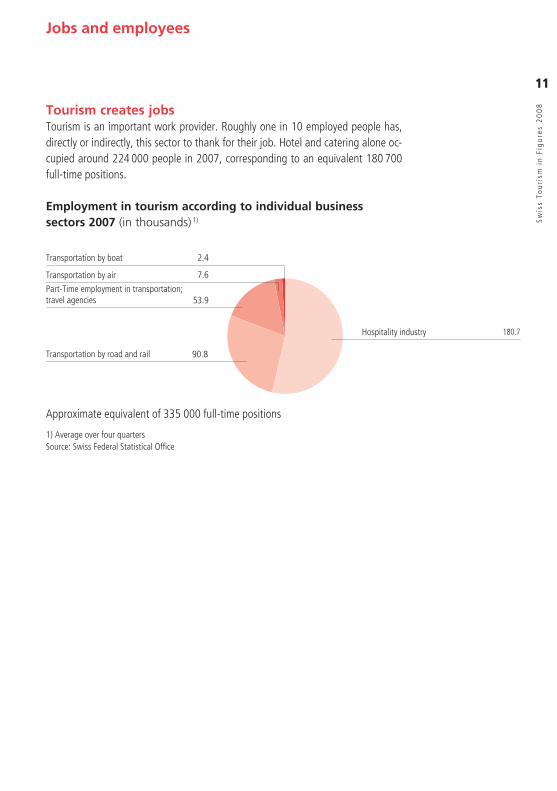
Tourism creates jobsTourism is an important work provider. Roughly one in 10 employed people has, directly or indirectly, this sector to thank for their job. Hotel and catering alone oc-cupied around 224 000 people in 2007, corresponding to an equivalent 180 700 full-time positions.
Employment in tourism according to individual business sectors 2007 (in thousands)1)
Approximate equivalent of 335 000 full-time positions
1) Average over four quartersSource: Swiss Federal Statistical Office
Swis
s To
uri
sm i
n F
igu
res
20
08
Jobs and employees
Transportation by boat
Transportation by air
Part-Time employment in transportation;travel agencies
Transportation by road and rail
Hospitality industry

12
2002 2003 2004 2005 2006 2007 2175.3 2166.2 2177.0 2180.1 2206.2 2262.7 1212.6 1201.0 1202.0 1204.6 1209.9 1233.6 962.7 965.1 974.9 975.5 996.3 1029.1
190.4 182.9 180.9 177.3 176.9 180.7 93.3 90.4 87.8 84.8 83.6 85.3 97.0 92.5 93.2 92.5 93.4 95.4 85.3 85.5 85.8 88.1 89.1 90.8 75.9 75.6 75.7 77.4 77.8 79.7 9.4 9.9 10.1 10.6 11.3 11.1 2.1 2.5 2.5 2.4 2.4 2.4 1.6 1.9 1.8 1.7 1.7 1.7 0.5 0.6 0.7 0.7 0.7 0.7 10.6 9.9 8.6 7.3 7.0 7.6 5.7 5.4 4.8 4.2 4.0 4.2 4.9 4.5 3.7 3.1 3.1 3.4 51.6 51.4 53.4 53.4 52.6 53.9 33.7 33.3 34.9 35.0 35.0 35.5 17.9 18.1 18.5 18.3 17.6 18.4
143.0 144.9 148.3 149.5 150.2 75.9 76.7 77.6 77.4 79.2 67.1 68.2 70.7 72.1 71.0 33.3 33.8 36.0 35.6 34.0 41.4 38.3 41.2 41.8 43.7 18.5 17.1 18.7 18.1 18.6 56.1 55.0 58.5 59.3 59.1 217.7 217.0 225.5 227.0 227.9 94.4 93.8 96.3 95.5 97.8 123.2 123.3 129.2 131.4 130.1
Swis
s To
uri
sm i
n F
igu
res
20
08
Jobs and employees
Full-time equivalents according to economic sectors(in thousands) 1)
Service industry Total Men Women
Hospitality industry Total Men WomenTransportation by road Totaland rail Men WomenTransportation by boat Total Men WomenTransportation by air Total Men WomenPart-time employment Totalin transportation; Mentravel agencies Women
1) Average over four quarters. Source: Employment statistic, Swiss Federal Statistical Office
Employment statistics: hotel and catering industry(in thousands)
2006 2007 2007 2007 2007 4th quarter 1th quarter 2th quarter 3th quarter 4th quarterFull-time employees (90% and over) Of which menOf which womenPart-time employees I (50-89%) Part-time employees II (<50%) Of which menOf which womenTotal number of employees (overall) Of which menOf which women
Source: Employment statistic, Swiss Federal Statistical Office

13
2.9 0.2 3775 61.2 2.6 3.6 4576 54.8 3.3 17.1 5857 60.4 2.6 13.7 4919 55.5 1.5 0.7 2475 35.3
2.8 16.2 5013 57.1 2.5 4.7 4267 52.4
1.6 3.5 2362 36.3 2.6 7.4 4097 55.7 3.6 11.9 6778 69.8 4.4 24.2 8758 73.6
2.9 11.3 4881 56.0 2.8 10.7 5389 57.1 1.4 12.3 1811 34.5 2.4 10.2 3105 49.8 2.7 10.7 4639 54.8
Mobility in Switzerland — results on travel behaviour
Swis
s To
uri
sm i
n F
igu
res
20
08Travel with overnight stays
Frequency, duration, distanceJourneys with one or more overnight stays are on average the longest trips and hence account for a significant share of annual mobility. Distance figures are based on round trips and distances at the destination. The total distance amounts to ap-proximately 4600 kilometres per person and year.55% of those surveyed have taken at least one trip with an overnight stay over the past 4 months. This corresponds to an average of 2.7 journeys per year, with ap-proximately one in nine as a business trip.Senior citizens take significantly fewer trips with overnight stays than the rest of the population. People in the 26–45 year age bracket cover the longest distances. In-come as a key factor is even stronger for journeys with overnight stays than for day trips: For example, the group with a monthly income of between 8000 and 12 000 Swiss Francs travels about twice as much and almost three times as far as those with incomes below 4000 Swiss Francs.
Number of thereof business Total distance at least one journey journeys trips (in %) per year (km) over the past per year 4 months (share in %)Age6–17 years18–25 years26–45 years45–65 years66 and overGenderMenWomenHousehold incomeUp to CHF 4000CHF 4001–8000CHF 8001–12 000Over CHF 12 000Spacial structure (residential community)Suburban core communityOther suburban communityIsolated townRural communityTotal
Source: Microcensus 2005, Swiss Federal Statistical Office
14
10.6 7.1 10.2 10.2 18.4 10.5 7.9 10.3 10.2 22.8 2.2 3.1 1.6 2.2 13.7 3.1 6.2 2.3 3.4 17.0 12.6 9.2 18.8 12.8 14.3 4.5 4.7 6.7 4.7 9.5 5.8 5.0 2.8 5.4 4.3 49.3 43.2 52.7 49.0 100.0
57.1 24.8 43.4 41.6 36.2 88.2 20.2 68.7 44.6 43.7 32.1 15.4 29.4 36.7 35.7 21.7 5.0 16.5 36.9 32.2 47.5 69.3 48.6 65.2 70.7 33.9 15.0 36.1 37.7 38.1 30.3 11.8 71.2 23.5 50.4
Mobility in Switzerland — results on travel behaviour
Swis
s To
uri
sm i
n F
igu
res
20
08 Objectives, purposes and choice of transport
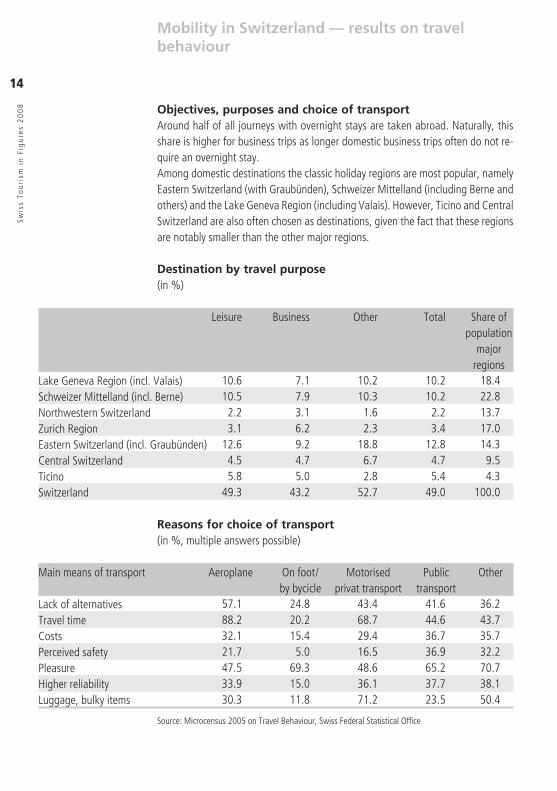
Around half of all journeys with overnight stays are taken abroad. Naturally, this share is higher for business trips as longer domestic business trips often do not re-quire an overnight stay. Among domestic destinations the classic holiday regions are most popular, namely Eastern Switzerland (with Graubünden), Schweizer Mittelland (including Berne and others) and the Lake Geneva Region (including Valais). However, Ticino and Central Switzerland are also often chosen as destinations, given the fact that these regions are notably smaller than the other major regions.
Destination by travel purpose (in %)
Leisure Business Other Total Share of population major regionsLake Geneva Region (incl. Valais)Schweizer Mittelland (incl. Berne)Northwestern SwitzerlandZurich RegionEastern Switzerland (incl. Graubünden)Central SwitzerlandTicinoSwitzerland
Reasons for choice of transport (in %, multiple answers possible)
Main means of transport Aeroplane On foot/ Motorised Public Other by bycicle privat transport transportLack of alternativesTravel timeCostsPerceived safetyPleasureHigher reliabilityLuggage, bulky items
Source: Microcensus 2005 on Travel Behaviour, Swiss Federal Statistical Office
15
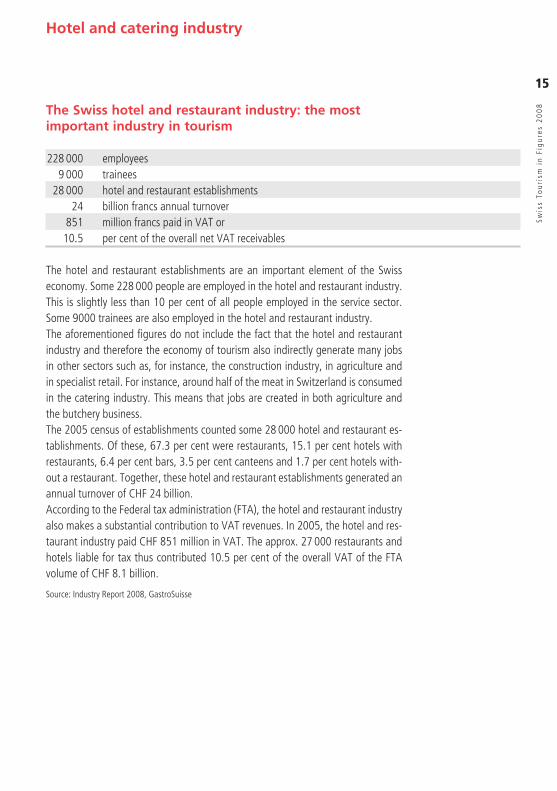
228 000 9 000 28 000 24 851 10.5
Hotel and catering industry
Swis
s To
uri
sm i
n F
igu
res
20
08The Swiss hotel and restaurant industry: the most
important industry in tourism
employees trainees hotel and restaurant establishments billion francs annual turnover million francs paid in VAT or per cent of the overall net VAT receivables
The hotel and restaurant establishments are an important element of the Swiss economy. Some 228 000 people are employed in the hotel and restaurant industry. This is slightly less than 10 per cent of all people employed in the service sector. Some 9000 trainees are also employed in the hotel and restaurant industry. The aforementioned figures do not include the fact that the hotel and restaurant industry and therefore the economy of tourism also indirectly generate many jobs in other sectors such as, for instance, the construction industry, in agriculture and in specialist retail. For instance, around half of the meat in Switzerland is consumed in the catering industry. This means that jobs are created in both agriculture and the butchery business.The 2005 census of establishments counted some 28 000 hotel and restaurant es-tablishments. Of these, 67.3 per cent were restaurants, 15.1 per cent hotels with restaurants, 6.4 per cent bars, 3.5 per cent canteens and 1.7 per cent hotels with-out a restaurant. Together, these hotel and restaurant establishments generated an annual turnover of CHF 24 billion. According to the Federal tax administration (FTA), the hotel and restaurant industry also makes a substantial contribution to VAT revenues. In 2005, the hotel and res-taurant industry paid CHF 851 million in VAT. The approx. 27 000 restaurants and hotels liable for tax thus contributed 10.5 per cent of the overall VAT of the FTA volume of CHF 8.1 billion.
Source: Industry Report 2008, GastroSuisse

16
Accommodation sectorSw
iss
Tou
rism
in
Fig
ure
s 2
00
8 Overview of the accommodation sectorSwiss tourism statistics break accommodation options down into hotel accommoda-tion, health establishments and supplementary accommodation.
Hotel accommodationHotels, boarding houses, guesthouses, motels
Health establishmentsSanatoria which are not subsidized by the Canton and convalescent homes with medical management or support, Alpine health establishments, altitude clinics, rheumatic clinics, public spas
Supplementary accommodationPrivate rooms (vacation homes and apartments):These are properties which are offered for rental to third parties. They exclude prop-erties which are solely occupied by the owners or long-term tenants, or their fam-ily members. Camp and caravan sites:Demarcated sites which are accessible to everyone for the temporary parking of caravans and motor homes in which they travel, and for the temporary erection of tents. One «parking place» is equivalent to three «sleeping places» on average (four in the Ticino). Group accommodation:Dormitories for tourists and groups, club and association houses, mountain ref-uges and huts. Youth hostels:Switzerland’s official youth hostels.
Accommodation statistics (HESTA) for hotels and health establishments replace the statistics for hotels and health establishments which date back to 1934 but which were discontinued in 2003 due to budget restrictions. In methodological terms, these figures cannot be compared to the old statistics; HESTA has been in opera-tion since 1.1.2005.

17
1.7 5.4 –2.9 2.5 4.5 0.1 3.8 5.6 1.5 4.7 7.1 1.4 2.5 4.4 0.0 6.0 9.1 1.5 4.6 7.8 0.3 4.0 5.5 1.9 2.0 3.5 0.2 5.2 6.0 4.5 10.3 12.3 8.0 8.5 9.7 6.9 4.4 6.5 1.6
Accommodation sector
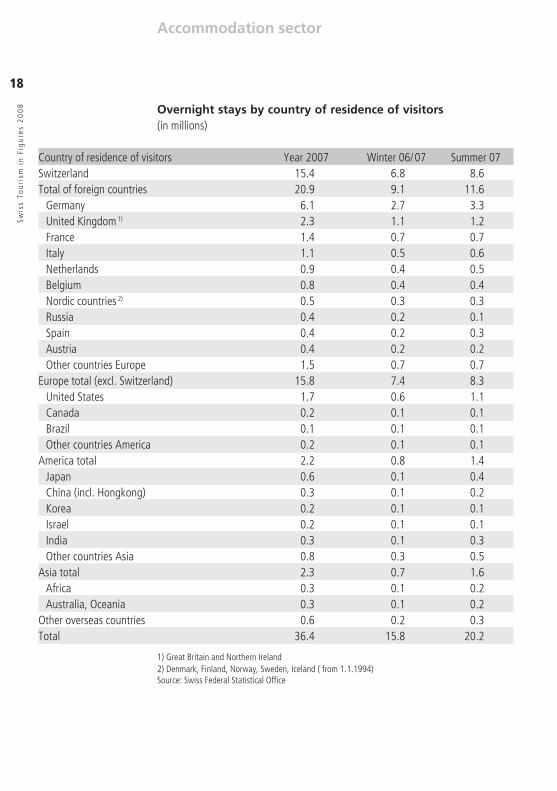
Hotels and health establishmentsOvernight stays in the Swiss hotel and wellness establishments amounted to 36.4 million (+4.4%) in the year 2007, and are associated with 15.6 million (+5.5%) arrivals. Thus the length of stay amounts to 2.3 nights (compared to 2.4 nights in the previous year). On average, with 2.5 nights, foreign guests remained longer in Swiss hotels and wellness establishments as compared to Swiss visitors with 2.1 nights. In the year 2007, 57.4 percent of overnight stays were on account of for-eign visitors. These came chiefly from Germany (16.7% of aggregate demand), the United Kingdom (6.3%), the United States (4.6%), France (3.8%) and Italy (3.1%). All named countries increased their numbers in overnight stays as compared to 2006, although to greatly varying extents. Viewed as continents, the demand from Europe and Switzerland was the most significant (85.7%, including Switzerland), followed by Asia (6.3%) and America (6.1%). Guests from Africa and Oceania made up less than 1 percent of the aggregate demand. In the year 2007 the tourism regions Graubünden, Zurich, Valaise, Bernese Oberland and Central Switzerland were the most visited, each with at least 3.7 million visitors – and united together, they account for approximately 62 percent of all overnight stays. Expressed as a percentage the regions Geneva (+8.5%) and Zurich (+7.7%) grew the most strongly.
Development of overnight stays in 2007Change in percent compared to the same period in 2006
Total Foreigners SwissJanuaryFebruaryMarchAprilMayJuneJulyAugustSeptemberOctoberNovemberDecemberEntire year
Source: Swiss Federal Statistical Office
Swis
s To
uri
sm i
n F
igu
res
20
08
18
15.4 6.8 8.6 20.9 9.1 11.6 6.1 2.7 3.3 2.3 1.1 1.2 1.4 0.7 0.7 1.1 0.5 0.6 0.9 0.4 0.5 0.8 0.4 0.4 0.5 0.3 0.3 0.4 0.2 0.1 0.4 0.2 0.3 0.4 0.2 0.2 1.5 0.7 0.7 15.8 7.4 8.3 1.7 0.6 1.1 0.2 0.1 0.1 0.1 0.1 0.1 0.2 0.1 0.1 2.2 0.8 1.4 0.6 0.1 0.4 0.3 0.1 0.2 0.2 0.1 0.1 0.2 0.1 0.1 0.3 0.1 0.3 0.8 0.3 0.5 2.3 0.7 1.6 0.3 0.1 0.2 0.3 0.1 0.2 0.6 0.2 0.3 36.4 15.8 20.2
Accommodation sectorSw
iss
Tou
rism
in
Fig
ure
s 2
00
8 Overnight stays by country of residence of visitors(in millions)
Country of residence of visitors Year 2007 Winter 06/07 Summer 07Switzerland Total of foreign countries
Germany United Kingdom 1)
France Italy Netherlands Belgium Nordic countries 2)
Russia Spain Austria Other countries Europe
Europe total (excl. Switzerland)United StatesCanada Brazil Other countries America
America totalJapanChina (incl. Hongkong)KoreaIsraelIndia Other countries Asia
Asia totalAfrica Australia, Oceania
Other overseas countriesTotal
1) Great Britain and Northern Ireland2) Denmark, Finland, Norway, Sweden, Iceland ( from 1.1.1994)Source: Swiss Federal Statistical Office

19
19 103 38 310 2.9 2.9 5.9 54.5 46.3 17 591 34 361 2.2 2.8 5.0 51.1 42.5 14 463 29 383 2.0 2.4 4.4 51.2 44.6 12 221 20 473 1.2 3.0 4.1 69.5 56.0 8 821 14 552 0.6 2.3 2.9 67.6 54.5 9 466 18 315 1.5 1.3 2.8 49.9 42.8 9 286 17 389 0.9 1.6 2.5 52.7 41.9 5 663 10 766 0.6 1.1 1.7 55.5 45.4 5 094 9 225 0.6 0.5 1.1 42.1 33.4 3 213 5 081 0.3 0.7 0.9 65.5 51.7 3 159 5 232 0.4 0.4 0.7 47.9 38.4 2 174 4 173 0.3 0.4 0.6 50.6 43.9 2 566 5 043 0.4 0.2 0.6 42.6 35.9 1 931 3 424 0.2 0.2 0.4 42.2 32.9 2 022 4 146 0.2 0.2 0.4 36.4 26.7 1 614 2 901 0.2 0.2 0.4 46.4 35.8 971 1 530 0.1 0.1 0.3 60.7 48.6 1 351 2 738 0.1 0.2 0.3 35.8 28.0 967 1 982 0.1 0.1 0.2 42.6 33.7 1 231 2 368 0.1 0.1 0.2 37.4 27.8 1 105 2 011 0.1 0.1 0.2 41.0 30.1 601 1 707 0.1 0.0 0.2 42.4 29.5 998 1 708 0.1 0.0 0.1 31.0 25.1 758 1 587 0.1 0.0 0.1 31.5 25.5 596 1 114 0.1 0.1 0.1 40.9 31.2 746 1 499 0.1 0.0 0.1 18.7 15.6 127 710 241 019 15.4 20.9 36.4 53.3 43.6
Accommodation sector
Swis
s To
uri
sm i
n F
igu
res
20
08Hotel industry: capacity, overnight stays and occupancy rate
Cantons 2007
Cantons Capacity 1) Overnight stays in millions Occupancy rate 2) in % Rooms Beds Swiss Foreigners Total Rooms BedsGraubündenBernValaisZurichGenevaTicinoVaudLucerneSt. GallenBasel-StadtAargauObwaldenSchwyzThurgauFribourgSolothurnZugUriNidwaldenNeuchâtelBasel-LandschaftAppenzell InnerrhodenAppenzell AusserrhodenGlarusSchaffhausenJuraSwitzerland
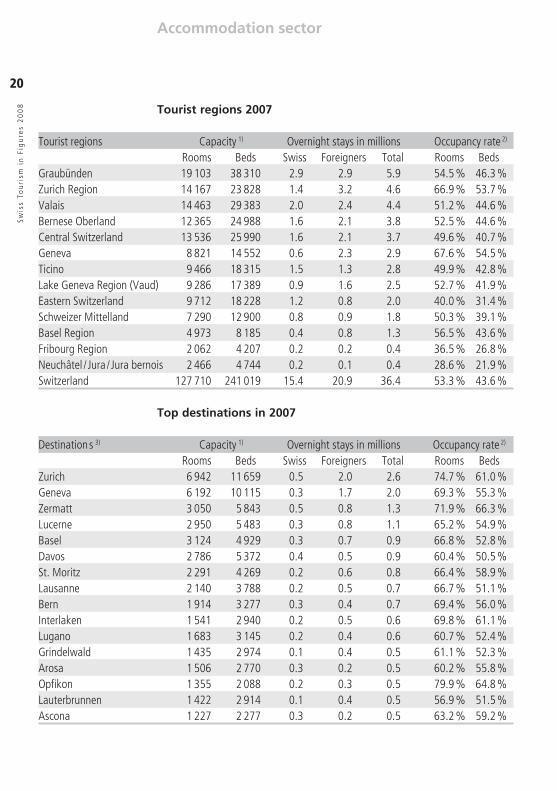
Sorted by overnight stays 2007, in decreasing order1) Monthly weighted and only open establishments (available rooms and beds)2) Number of recorded overnight stays in percent of the total monthly net capacitySource: Swiss Federal Statistical Office
20
19 103 38 310 2.9 2.9 5.9 54.5 % 46.3 % 14 167 23 828 1.4 3.2 4.6 66.9 % 53.7 % 14 463 29 383 2.0 2.4 4.4 51.2 % 44.6 % 12 365 24 988 1.6 2.1 3.8 52.5 % 44.6 % 13 536 25 990 1.6 2.1 3.7 49.6 % 40.7 % 8 821 14 552 0.6 2.3 2.9 67.6 % 54.5 % 9 466 18 315 1.5 1.3 2.8 49.9 % 42.8 % 9 286 17 389 0.9 1.6 2.5 52.7 % 41.9 % 9 712 18 228 1.2 0.8 2.0 40.0 % 31.4 % 7 290 12 900 0.8 0.9 1.8 50.3 % 39.1 % 4 973 8 185 0.4 0.8 1.3 56.5 % 43.6 % 2 062 4 207 0.2 0.2 0.4 36.5 % 26.8 % 2 466 4 744 0.2 0.1 0.4 28.6 % 21.9 % 127 710 241 019 15.4 20.9 36.4 53.3 % 43.6 %
6 942 11 659 0.5 2.0 2.6 74.7 % 61.0 % 6 192 10 115 0.3 1.7 2.0 69.3 % 55.3 % 3 050 5 843 0.5 0.8 1.3 71.9 % 66.3 % 2 950 5 483 0.3 0.8 1.1 65.2 % 54.9 % 3 124 4 929 0.3 0.7 0.9 66.8 % 52.8 % 2 786 5 372 0.4 0.5 0.9 60.4 % 50.5 % 2 291 4 269 0.2 0.6 0.8 66.4 % 58.9 % 2 140 3 788 0.2 0.5 0.7 66.7 % 51.1 % 1 914 3 277 0.3 0.4 0.7 69.4 % 56.0 % 1 541 2 940 0.2 0.5 0.6 69.8 % 61.1 % 1 683 3 145 0.2 0.4 0.6 60.7 % 52.4 % 1 435 2 974 0.1 0.4 0.5 61.1 % 52.3 % 1 506 2 770 0.3 0.2 0.5 60.2 % 55.8 % 1 355 2 088 0.2 0.3 0.5 79.9 % 64.8 % 1 422 2 914 0.1 0.4 0.5 56.9 % 51.5 % 1 227 2 277 0.3 0.2 0.5 63.2 % 59.2 %
Accommodation sector
Tourist regions 2007
Tourist regions Capacity 1) Overnight stays in millions Occupancy rate 2)
Rooms Beds Swiss Foreigners Total Rooms BedsGraubündenZurich RegionValaisBernese OberlandCentral SwitzerlandGenevaTicinoLake Geneva Region (Vaud)Eastern SwitzerlandSchweizer MittellandBasel RegionFribourg RegionNeuchâtel / Jura / Jura bernoisSwitzerland
Top destinations in 2007
Destinations 3) Capacity 1) Overnight stays in millions Occupancy rate 2)
Rooms Beds Swiss Foreigners Total Rooms BedsZurichGenevaZermattLucerneBaselDavosSt. MoritzLausanneBernInterlakenLuganoGrindelwaldArosaOpfikonLauterbrunnenAscona
Swis
s To
uri
sm i
n F
igu
res
20
08

21
2002 5 755 143 218 263 449 – – –2003 5 691 143 148 263 024 – – –2005 5 836 143 796 274 035 4 970 127 409 239 1502006 5 693 142 514 271 591 4 967 127 527 240 4292007 5 635 141 596 270 146 4 954 127 710 241 019
56 1 706 3 916 60.4 43.1 63.6 282 7 025 13 333 53.9 45.1 61.3 930 32 547 59 619 58.8 49.7 81.0 411 28 696 51 023 65.4 54.6 134.0 76 9 715 16 334 64.7 54.8 326.4 2 867 41 415 83 161 37.5 29.9 37.8 333 6 607 13 633 50.3 41.3 62.7 4 954 127 710 241 019 53.3 43.6 96.1
845 845 17.1 17.1 1 129 1 974 22.8 39.8 1 654 3 628 33.4 73.2 856 4 484 17.3 90.5 255 4 738 5.1 95.6 96 4 834 1.9 97.6 71 4 905 1.4 99.0 49 4 954 1.0 100.0
Accommodation sector
Capacity in hotels and health spas
Year Recorded Recorded Recorded Open Available Available Establishments Rooms Beds Establishments Rooms Beds
Hotels based on star rating system 2007
Year Open Available Available Occupancy Occupancy Revpar 4)
Establishments Rooms Beds rate 2) in % rate 2) in % Rooms Beds***************No informationNo categoryTotal
Hotels and health spas according to size of establishment 2007
Size of establishment Open cumulative in % cumulative Establishments0 to 10 beds11 to 20 beds21 to 50 beds51 to 100 beds101 to 150 beds151 to 200 beds201 to 300 beds301 and more beds
1) Monthly weighted and only open establishments (available rooms and beds)2) Number of recorded overnight stays in percent of the total monthly net capacity3) Top 16 destinations based on overnight stays in 2007 4) Revpar = revenue per available room * days open verified by hotelleriesuisseSource: Swiss Federal Statistical Office
Swis
s To
uri
sm i
n F
igu
res
20
08

22
* + ** *** **** ***** 69 145 61 13 % % % % 67.6 53.0 46.2 43.9 30.6 45.1 50.1 48.3 1.8 2.0 3.8 7.8 100.0 100.0 100.0 100.0 –24.6 –21.4 –18.5 –16.2 75.4 78.6 81.5 83.8 –34.6 –36.4 –40.5 –40.0 40.8 42.2 41.1 43.8 –13.7 –14.0 –14.5 –15.6 27.1 28.2 26.6 28.2 –11.1 –7.7 –5.1 –4.4 16.0 20.5 21.4 24.0 –4.3 –4.8 –5.4 –6.8 11.8 15.6 16.1 17.3 –6.5 –7.0 –6.4 –5.7 5.3 8.6 9.7 11.3 0.9 0.6 2.5 1.1 6.2 9.3 12.2 12.4 –8.2 –9.9 –15.7 –11.0 –2.1 –0.6 –3.6 1.5
69.1 63.4 68.9 69.2 62.9 63.4 58.1 73.3 64.4 59.8 66.6 69.7
Accommodation sectorSw
iss
Tou
rism
in
Fig
ure
s 2
00
8 Turnover Distribution and Operating Costs according to hotel category (2006) The Swiss Hotel Credit Association (SGH) annually publishes average figures for ho-tels and, in the year 2006, 368 hotels were assessed. The following published fig-ures are based on this assessment and reflect average values. With these figures, it must be taken into account that within the various categories between seasonal and year-round commercial enterprises, as well as between the lakeside and mountain hotel trade; in each case substantial differences are at hand.
Hotel categoryNumber of hotels
Earnings on food and beveragesEarnings on accommodationEarnings on other servicesTotal turnoverDirect operating expensesGross profit IPersonnel expensesGross profit IIOther operating expensesOperating result IManagement expensesOperating result IIMaintenance and replacements Gross operating profitFinancial and investment expensesOperating cashflowNon-recurring earnings and expensesCorporate cashflowDepreciationCorporate result
Important key figuresEarnings from food preparationEarnings from beverages Earnings from merchandise
Source: Swiss Association for Hotel Credit (Statistical year 2006)

23
* + ** *** **** *****
29.1 40.6 47.4 41.3 3.3 3.0 3.4 3.2
65 80 132 239 6 582 11 693 22 322 34 064 809 101 1 621 594 4 421 163 13 336 084
* + ** *** **** *****
110.1 134.5 115.8 137.1
40 568 49 716 84 277 119 683 84 941 95 030 159 677 220 742 41 520 50 860 84 800 132 238 88 045 97 043 159 679 240 506 1 542 659 3 257 202 9340 305 28 699 453
* + ** *** **** ***** % % % % 10.4 6.9 7 20.4 89.6 97.3 93.3 79.6 3.7 3.7 3.5 3.3
Accommodation sector
By all figures we are dealing with average values. For this reason, single results can-not be calculated through the addition or subtraction of revenue and expenses.
Important key figures by hotel category
Hotel categoryProfit and loss accountBed occupancy rate in % Average duration of stay (days) CHF CHF CHF CHFAverage accommodation rateAccommodation earnings per bed per yearAverage operating income
Source: Swiss Association for Hotel Credit (Statistical year 2006)
Key balance sheet figures by hotel category
Hotel categoryBalance sheetCurrent ratio CHF CHF CHF CHFIndebtedness per bedIndebtedness per roomInvestment per bedInvestment per roomAverage balance sheet total
Source: Swiss Association for Hotel Credit (Statistical year 2006)
Level of indebtedness of the hotel industry
Hotel category
Equity ratioDebt to equity ratioPayable interest in % of long-term debt
Source: Swiss Association for Hotel Credit (Statistical year 2006)
Swis
s To
uri
sm i
n F
igu
res
20
08

24
0
50
100
150
200
250
300
350
2003 2004 2005 2006
0
5
10
15
20
25
30
35
40
2003 2004 2005 2006
Accommodation sector
Facts and Figures from the Experience Groups [Erfa Groups] The results from the Experience Groups from hotelleriesuisse (around 160 establish-ments) cannot claim to be representative or complete, but they do provide valuable indications from the segment comprising the leading and larger businesses regard-ing the progression of the financial year and development over time.
RevparThe revenue per room and day of opening (revenue per available room) is an in-formative key figure as regards value-added per available room.
Operating result IOperating result I is one of the main key figures in the hotel and catering sector, providing a yardstick for management efficiency. It takes account of all operating costs that can be influenced directly and are mostly variable, such as expenditure on goods (incl. services), personnel costs and other direct operating expenditure.
More information is available in the publication: «Erfa-Gruppen von hotellerie-suisse, Zahlen und Fakten 2005/06» which can be obtained from hotelleriesuisse, P.O.Box, 3001 Berne.
Swis
s To
uri
sm i
n F
igu
res
20
08
Revpar in CHF
Operating result I in %
3* Holiday 4* Holiday3* City Mean value4* City 5* Holiday 5* City
3* Holiday 4* Holiday3* City Mean value4* City 5* Holiday 5* City

25
ZH 598 929 553 003 33 861 12 065 AR 25 063 20 864 2 790 1 409BE 466 025 404 054 45 623 16 348 AI 6 094 5 102 668 324LU 152 260 136 406 11 441 4 413 SG 205 840 179 011 18 965 7 864UR 15 878 12 921 1 978 979 GR 128 987 74 411 47 902 6 674SZ 55 382 48 035 5 526 1 821 AG 240 092 218 326 13 435 8 331OW 16 070 11 808 3 606 656 TG 101 446 88 801 7 983 4 662NW 16 934 14 439 2 113 382 TI 185 173 134 179 45 175 5 819GL 19 152 14 962 2 916 1 274 VD 324 566 269 992 43 481 11 093ZG 42 711 38 196 3 979 536 VS 172 705 101 870 61 614 9 221FR 105 511 91 243 10 454 3 814 NE 81 643 72 091 6 431 3 121SO 112 054 100 021 6 729 5 304 GE 205 026 177 364 22 912 4 750BS 106 838 94 155 8 395 4 288 JU 31 041 26 549 2 742 1 750BL 118 701 109 205 6 489 3 007 CH 3 569 181 3 027 829 419 819 121 533SH 35 060 30 821 2 611 1 628
44 643 2923 899 79 4588 0 22 244 138 9 413 0 0 1 0 0 1 4 58 323 131 9 525 0 4 12 10 1 27 0 6 87 61 7 161 0 5 81 77 6 169 0 2 24 3 0 29 37 326 1 557 499 46 2 465 22 130 592 186 18 948 132 710 3 524 1 411 92 5 869 239 1 906 9 368 3 415 267 15 195
Accommodation sector
Swis
s To
uri
sm i
n F
igu
res
20
08Apartments
Number of permanently and part-time occupied apartmentsas of census 2000
Canton Apartments Canton Apartments Total Occupation Total Occupation Permanently Occupied Un- Permanently Occupied Un- occupied part-time occupied occupied part-time occupied
Source: Swiss Federal Statistical Office
Classified vacation homes by regionsas of 31 December 2007
Tourist region TotalGraubündenEstern Switzerland/LichtensteinZurich RegionCentral SwitzerlandSchweizer MittellandNeuchâtel / Jura / Jura BernoisLake Geneva Region (Vaud)Fribourg RegionBernese OberlandTicinoValaisSwitzerland
Source: Swiss Tourism Federation

26
2003 2004 2005 2006 2007 2 130 2 197 2 694 2 958 3 119 4 973 4 752 5 229 4 398 4 522 1 387 1 778 1 821 2 174 2 449 2 904 3 042 2 973 3 094 2 749 7 021 6 897 7 831 8 645 8 939 4 120 4 962 4 617 4 003 4 735 3 999 3 756 3 650 3 487 3 054 1 381 1 509 1 606 1 623 1 868 2 586 2 677 2 394 2 322 2 677 2 769 2 472 2 770 3 955 3 315 1 033 700 897 843 303 488 506 643 589 681 92 203 90 211 0 34 883 35 524 37 215 38 302 38 411
221 217 215 200 194
2003 2004 2005 2006 2007 5 262 4 640 4 262 4 112 5 031 31 820 32 270 29 223 29 094 25 192 5 712 5 937 4 479 4 954 1 658 25 467 23 267 24 990 26 559 26 221 22 865 23 670 24 150 21 497 25 044 10 210 9 471 8 414 7 791 7 589 2 558 2 632 2 019 1 992 2 207 1 264 1 917 2 268 2 244 2 776 478 1 212 991 1 150 1 020 6 780 105 636 105 016 100 796 99 393 103 518
240 230 229 240 230
Accommodation sectorSw
iss
Tou
rism
in
Fig
ure
s 2
00
8 AgrotourismSleep on Straw: overnight stays and establishments
Tourist regionGraubündenEastern Switzerland Zurich RegionBasel RegionCentral SwitzerlandSchweizer MittellandNeuchâtel / Jura / Jura BernoisLake Geneva Region (Vaud)Fribourg RegionBernese OberlandTicinoValaisGenevaSwitzerland
Number of establishments
Source: association «schlaf im Stroh!»
Holidays on the Farm: overnight stays and establishments
Tourist regionGraubündenEastern Switzerland Basel RegionCentral SwitzerlandSchweizer MittellandWestschweiz 1)
Bernese OberlandTicinoValaisZurich RegionSwitzerland
Number of establishment
1) Fribourg Region, Geneva, Lake Geneva Region (Vaud), Neuchâtel/Jura/Jura Bernois combinedSource: reka

27
24 3 862 2 443 1 419 43 169 3.9 36 6 520 5 136 1 384 69 310 4.5 38 4 447 2 820 1 627 104 346 3.3 15 2 147 943 1 204 22 72 3.3 28 4 204 2 022 2 182 61 163 2.7 26 5 646 2 367 3 279 70 250 3.6 2 529 250 279 1) 1) 1)
29 4 183 1 522 2 661 46 127 2.8 13 3 071 1 611 1 460 35 84 2.4 5 435 180 255 (8) (17) 2.0 35 6 343 5 160 1 183 204 1 070 5.2 12 2 411 533 1 878 (24) (63) 2.6 16 2 978 1 774 1 204 34 101 2.9 279 46 776 26 761 20 015 720 2 772 3.8
Accommodation sector
Camp sites1)
Number of establishments and overnight stays 2007The Swiss are also among the most frequent campground guests. However, with 52 percent of overall demand their share declined somewhat, compared to the previous year (54%). Guests from Germany and the Netherlands accounted for slightly more overnight stays than last year, each with 34 percent of overall de-mand (32%), an increase of 73 000 overnight stays. The average length of stay of Swiss guests dropped to 3.8 overnight stays (compared to 4.3 in 2006). On the other hand, the numbers of German and Dutch guests increased, with an average of 4.6 overnight stays in 2007 compared to 4.3 in the previous year. The demand for campsites depends on the weather. In 2007 the month of April was unusually dry and sunny; the number of overnight stays increased by 19 percent compared to the previous month.
Tourist region Capacity Demand Establish- Campsites Arrivals Overnight Average ments in 1000 stays duration in 1000 of stay Total Overnight Permanently campsites leased campsitesGraubündenValaisBernese OberlandZurich RegionCentral SwitzerlandLake Geneva Region (Vaud)and Geneva 1
GenevaEastern SwitzerlandSchweizer Mittelland Basel RegionTicinoFribourg RegionNeuchâtel / Jura / Jura BernoisSwitzerland
Swis
s To
uri
sm i
n F
igu
res
20
08
1) Two regions combinded due to data protection (less than 3 establishments in the Geneva tourist region)() Only of limited statistical reliability (coefficient of variation >15%)Source: Swiss Federal Statistical Office
28
9 1 092 42 778 120 108 2.8 3 341 23 549 52 828 2.2 5 480 27 580 59 111 2.1 6 647 59 871 111 387 1.9 7 640 50 416 87 538 1.7 5 613 44 686 86 012 1.9 1 334 x x x 7 658 36 235 58 522 1.6 5 429 37 358 60 970 1.6 3 393 33 827 67 931 2.0 4 554 45 379 95 469 2.1 1 76 x x x 2 168 x x x 58 6 425 460 925 911 922 2.0
Swis
s To
uri
sm i
n F
igu
res
20
08
Accommodation sector
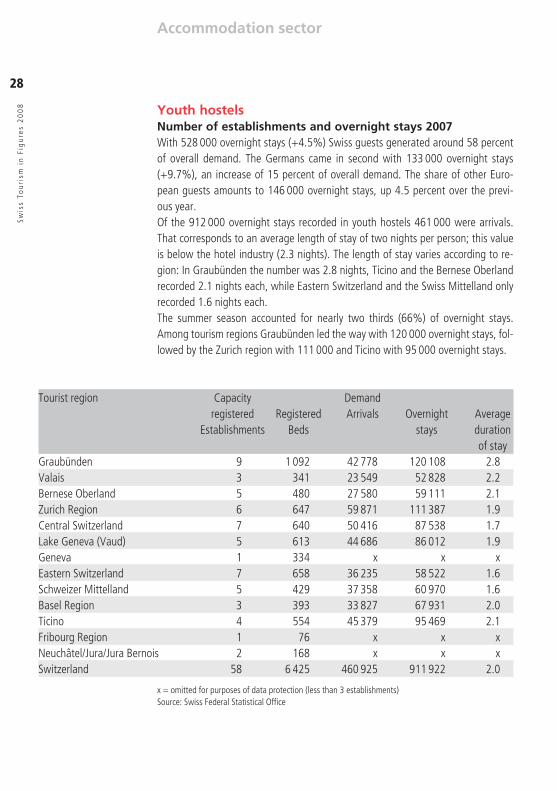
Youth hostelsNumber of establishments and overnight stays 2007With 528 000 overnight stays (+4.5%) Swiss guests generated around 58 percent of overall demand. The Germans came in second with 133 000 overnight stays (+9.7%), an increase of 15 percent of overall demand. The share of other Euro-pean guests amounts to 146 000 overnight stays, up 4.5 percent over the previ-ous year. Of the 912 000 overnight stays recorded in youth hostels 461 000 were arrivals. That corresponds to an average length of stay of two nights per person; this value is below the hotel industry (2.3 nights). The length of stay varies according to re-gion: In Graubünden the number was 2.8 nights, Ticino and the Bernese Oberland recorded 2.1 nights each, while Eastern Switzerland and the Swiss Mittelland only recorded 1.6 nights each. The summer season accounted for nearly two thirds (66%) of overnight stays. Among tourism regions Graubünden led the way with 120 000 overnight stays, fol-lowed by the Zurich region with 111 000 and Ticino with 95 000 overnight stays.
Tourist region Capacity Demand registered Registered Arrivals Overnight Average Establishments Beds stays duration of stayGraubündenValaisBernese OberlandZurich RegionCentral SwitzerlandLake Geneva (Vaud)GenevaEastern SwitzerlandSchweizer MittellandBasel RegionTicinoFribourg RegionNeuchâtel/Jura/Jura BernoisSwitzerland
x = omitted for purposes of data protection (less than 3 establishments)Source: Swiss Federal Statistical Office

29
66.5%
1.7%
13.6%
3.1%
17.1%
14.2%
3.3% 4.5%
5.3%
1.3%
8.5%
6.5%
2.0%
9.4%
4.9%3.4%
51.6%
16.4% 8.7%
6.0%
10.8%
8.0%
26.3%
21.1%
7.0%
1.8%
1.2%
2.3%
23.0%
16.0%
1.5%
2.8%
21.8%
70.1%
1.9%
00 5 10 15 20 25
Catering
Swis
s To
uri
sm i
n F
igu
res
20
08
Good plain cooking
Italian specialities
French specialities
Portug., Span., Greek, Turk. specialities
American, Mexican specialities
Ethno food
Vegetarian cuisine
Health food cuisine
Fast food
Swiss specialities
Fish specialities
Grill specialities
Asian specialities
Diet cuisine
Gastroshop for items in daily use
House deliveries
Other specialitiesTrend food
Take away sales
Business size: number of seats per restaurant
1–25 seats
26–50 seats
51–75 seats
76–100 seats
101–200 seats
more than 201 seats
Portion of businesses in %
Business type: Guaranteed variety!(Multiple choice possible)
Seminar hotel
Bar/pub/wine boutique
Hotel/restaurant
Residential hotel/motel
Inn/country inn
Guest-house/hostel
Self-service restaurant
Restaurant/brasserie/bistro
Take away
Catering/home deliveries
Pizzeria
Fast food/system catering
Dancing/discotheque/cabaret/night bar
Tearoom/café-restaurant
Local restaurant
Other/no details
Offer: Plain cooking remains No. 1(Multiple choice possible)
Source: Industry Report 2008, GastroSuisse
30
–10
–8
–6
–4
–2
0
2
4
6
8
10
2000 2001 2002 2003 2004 2005 2006 2007
CateringSw
iss
Tou
rism
in
Fig
ure
s 2
00
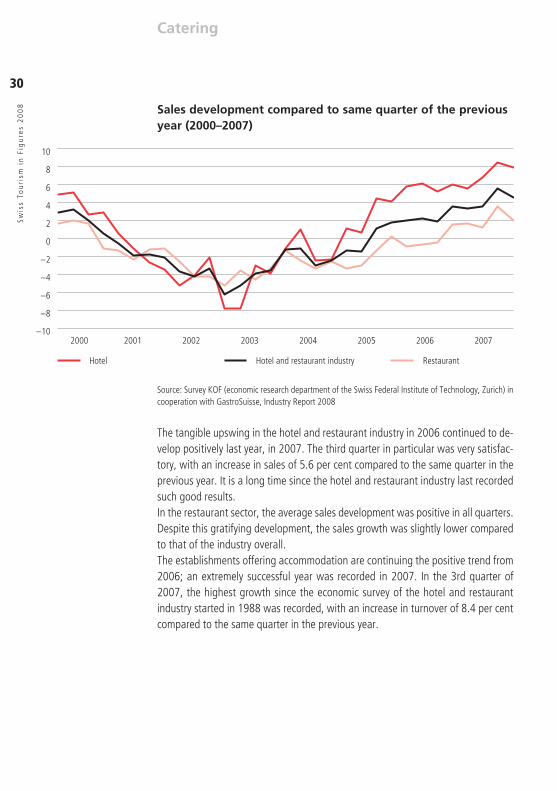
8 Sales development compared to same quarter of the previous year (2000–2007)
Source: Survey KOF (economic research department of the Swiss Federal Institute of Technology, Zurich) in cooperation with GastroSuisse, Industry Report 2008
The tangible upswing in the hotel and restaurant industry in 2006 continued to de-velop positively last year, in 2007. The third quarter in particular was very satisfac-tory, with an increase in sales of 5.6 per cent compared to the same quarter in the previous year. It is a long time since the hotel and restaurant industry last recorded such good results.In the restaurant sector, the average sales development was positive in all quarters. Despite this gratifying development, the sales growth was slightly lower compared to that of the industry overall.The establishments offering accommodation are continuing the positive trend from 2006; an extremely successful year was recorded in 2007. In the 3rd quarter of 2007, the highest growth since the economic survey of the hotel and restaurant industry started in 1988 was recorded, with an increase in turnover of 8.4 per cent compared to the same quarter in the previous year.
Hotel Hotel and restaurant industry Restaurant

31
0 5 10 15 20 25 30 35
Swis
s To
uri
sm i
n F
igu
res
20
08
Around one third (32%) of the establishments in the hotel and restaurant indus-try generate a maximum turnover of up to CHF 350 000. The turnover of four-fifths (79.2%) of the establishments is under CHF 1 100 000. This indicates that the hotel and restaurant industry consists very clearly of SME establishments, and not just re-lated to the number of employees but also based on the turnover. A comparison with the prior year shows that the proportion of establishments with an annual turnover of less than CHF 850 000 has fallen and the proportion of estab-lishments with an annual turnover of more than CHF 850 000 has increased.
1) Surveys of restaurants and hotels
Turnover per business 1) – the hotel and catering industry is clearly dominated by small and medium businesses
Annual turnover in CHF
up to 350 000
from 350 001–550 000
from 550 001–850 000
from 850 001–1 100 000
from 1 100 001–1 500 000
from 1 500 001–2 000 000
more than 2 000 000
Turnover per establishment in %
Catering
Source: GastroSuisse, Industry Report 2008

32
108 200.00 89 200.00 142 300.00 164 900.00 119 100.00 231 700.00
271 700.00 236 700.00 431 300.00 4.20 2.45 6.55 58.15 47.05 72.00 126.90 96.20 165.75 359.75 290.10 444.00
Swis
s To
uri
sm i
n F
igu
res
20
08
Catering
An overview of important key ratios for the hotel and restaurant industry
Key figure Average Minimum Maximum amount in CHF amount in CHF amount in CHFOperating income per employeeIncome from food preparationper employeeOperating income per service employeeTurnover per seat and hour of operationTurnover per working hourTurnover per service hourTurnover per employee and operating day
Source: Industry Report 2008, Gastroconsult AG/GastroSuisse
These key ratios provide valuable information for assessing the operating efficiency of a hotel establishment. However, it needs to be taken into account that one indi-vidual establishment can never be fully compared with another. That is why indivi-dual key ratios can also deviate substantially from the average figures. Nevertheless, this information from the comprehensive operating statistics of Gastroconsult AG can offer valuable indications for a comparison with competitors.Compared to the prior year, the operating turnover per person employed grew from CHF 105 400 to CHF 108 200. An increase was also discernible among the other key ratios for the hotel and restaurant industry.
Further information in the publication from GastroSuisse «Branchenspiegel 2008» («Industry Report»), available from GastroSuisse, P.O. Box, 8046 Zurich, for CHF 28.00.

33
2004 2005 2006
11.3 12.5 13
4.6 4.8 4.7 10 120 10 560 10 400 75% 75% 77%
333 100 350 200 364 700
72 000 73 700 76 000 5 057 400 5 454 000 5 559 000 1 084 700 1 116 200 1 193 000
39.4%
4.9%
5.8%
30.8%
19.1%
Key figures from Swiss travel agencies
Jobs and employeesExtrapolated turnover, Swiss travel agenciesin billions of CHFAverage number of full-time-equivalent employees per travel agencyNumber of employees, extrapolated to the entire sectorQuota of women approx. approx. approx.
Retailer figuresAnnual payroll total per travel agency in CHFAnnual payroll total per full-time-equivalent employee in CHFGross turnover per travel agency in CHFGross turnover per full-time-equivalent employee in CHF
Source: Survey by Economic Research of Credit Suisse, Swiss Federation of Travel Agencies
90 percent of travel agencies are solely active in the retail sector (leisure); the previ-ous year’s figure was only 86 percent. 74 percent of travel agencies keep their range as wide as possible while 26 percent are specialists. The total number of trainees in 152 travel agencies is 250. The most important region for travel agency activities is the Zurich region, followed by the Lake Geneva area.
Location of travel agencies in Swiss cities by number of inhabitants
Source: Survey by Economic Research of Credit Suisse, Swiss Federation of Travel Agencies
A good half of all travel agencies are based in towns with more than 25 000 inhabit-ants and one third are located in cities with a population of more than 100 000.
Swis
s To
uri
sm i
n F
igu
res
20
08
Outgoing
Less than 2000
2000 up to 5000
5000 up to 25 000
More than 100 000
25 000 up to 100 000

34
TransportSw
iss
Tou
rism
in
Fig
ure
s 2
00
8 A wide variety of means of transportationMore than half of all travel activities for vacation and buisness purposes with at least one overnight stay, made by Swiss residents within Switzerland or abroad, occur by private car. About one fifth of the tourists travel by train, 18 percent travel by plane, and 4 percent go by bus, postbus, tram or metro.
Public transportThe public transport route network on railways, roads, lakes and rivers adds up to a total of 28 300 km. 27 200 stopping points are served. A total of 486 million railway and vehicle kilometres are available. In 2007, 2.12 million passengers made use of a half fare card, 344 500 persons held a general abonnement valid throughout the country and around 962 000 persons obtained a combined season ticket in one of the 21 regional tariff networks.
One of the densest railway networks in the worldThe length of the Swiss railway network is 5062 km. This is made up of 3680 km of normal gauge lines – of which 3011 km are part of the Swiss Federal Railways network – and 1382 km of narrow gauge lines.Swiss Federal Railways runs around 7000 train services or 350 000 train kilome-tres each day. Around half of this consists of long distance services (Eurocity, Inter-city and express trains), the other half of regional and suburban railway services. In 2007, Swiss Federal Railways carried 307 million passengers. The average journey distance amounted to 49 km per day. In addition to Swiss Federal Railways, a fur-ther 46 railway companies operate in the public transport sector.
The bus, car and PostBus network as a distributor52 local transport companies carried passengers by tram, trolleybus and bus in the area around the larger cities and agglomerations on 3482 km routes. 78 bus com-panies operated on 17 210 km regional routes (figures include PostAuto/Swiss Post-Bus Ltd). In 2007, 12 936 employees of tram, trolleybus and bus are carried 1158 Millions of passengers.9 regions of PostBus take care of the nationwide local distribution using postal bus-es. They are also partners for the transport services provided to order and act as an information point for passengers.

35
57 141 4 236 519 33 970 4 270 489 3 913 88 961 4506 93 467 127 909 10 734 901 133 276 10 868 177 6 299 186 764 294 187 058 52 3 923 0 3 923 2 636 98 991 0 98 991 223 830 20 717 105 96 765 20 813 870 421 780 36 067 164 268 811 36 335 975
Swis
s To
uri
sm i
n F
igu
res
20
08
Transport
The 740 PostBus routes operate a route network of 9827 km. 1627 PostBus em-ployees with 1909 postal buses (75 000 seats) conveyed 111 million passengers. In the course of this, the vehicles covered a distance of 89 million kilometres, or the equivalent of six times the circumference of the earth each day. In addition, around 1340 drivers are employed by PostBus companies.
Bustling navigation on Swiss lakes26 shipping companies on a total of 22 lakes and rivers publish schedules in the of-ficial timetable 2007. Ships operate in the following categories:
Category Boats LakesSteamers 15 boats on 6 lakesDiesel-electric paddle boats 3 boats on one lakeMotor boats 143 boats on 22 lakes and riversSolar-electric boats 3 boats on 2 lakesFerries 9 boats on 4 lakesBarges 4 boats on 3 lakes and rivers
Source: LITRA, public transport information service
177 boats offered 50 394 seats to passengers. In 2007, 13.6 million passengers travelled on Swiss lakes and rivers. This is around 2 percent more than in 2006 (barely 13.6 million passengers).
Over 36 million air passengersIn 2007, Switzerland’s airports recorded some 421 780 flight movements (take-offs and landings, only scheduled and charter flights). Of the 36.5 million passen-gers taking off from or landing in Switzerland, about 270 000 used Switzerland as a transit destination.
Airport Movements Local and transfer Transit Total passengers passengers passengersBasel MulhouseBerne BelpGenève CointrinLugano AgnoSionSt. Gallen AltenrheinZurich KlotenTotal
Source: Federal Office of Civil Aviation, Swiss Federal Statistical Office
36
0
50 000
100 000
150 000
200 000
250 000
200520042003200220012000199919981997199619951994199319921991
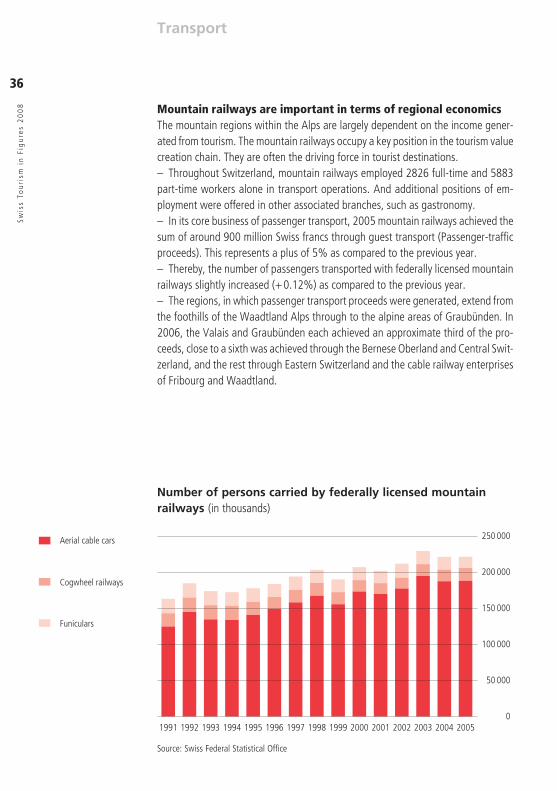
Mountain railways are important in terms of regional economicsThe mountain regions within the Alps are largely dependent on the income gener-ated from tourism. The mountain railways occupy a key position in the tourism value creation chain. They are often the driving force in tourist destinations.– Throughout Switzerland, mountain railways employed 2826 full-time and 5883 part-time workers alone in transport operations. And additional positions of em-ployment were offered in other associated branches, such as gastronomy. – In its core business of passenger transport, 2005 mountain railways achieved the sum of around 900 million Swiss francs through guest transport (Passenger-traffic proceeds). This represents a plus of 5% as compared to the previous year. – Thereby, the number of passengers transported with federally licensed mountain railways slightly increased (+0.12%) as compared to the previous year. – The regions, in which passenger transport proceeds were generated, extend from the foothills of the Waadtland Alps through to the alpine areas of Graubünden. In 2006, the Valais and Graubünden each achieved an approximate third of the pro-ceeds, close to a sixth was achieved through the Bernese Oberland and Central Swit-zerland, and the rest through Eastern Switzerland and the cable railway enterprises of Fribourg and Waadtland.
Number of persons carried by federally licensed mountain railways (in thousands)
Source: Swiss Federal Statistical Office
Swis
s To
uri
sm i
n F
igu
res
20
08
Transport
Aerial cable cars
Cogwheel railways
Funiculars

37
2004/05 2005/06 2006/07 2007/08 712 727 733 863 712 735 746 666 99 810 89 883 89 705 104 340 127 061 128 619 103 844 135 043 40 490 40 568 9 092 37 985 195 002 212 332 183 253 205 399 259 780 288 344 250 374 301 438 6 350 11 624 8 822 15 171 612 186 676 153 661 226 707 999 2 053 406 2 181 386 2 019 051 2 254 041
268 000 75 000 77 000 49 000 38 000 25 000 42 000 574 000
Swis
s To
uri
sm i
n F
igu
res
20
08
Sports
Swiss Ski and Snowboard SchoolsIn around 180 Swiss ski and snowboard schools, approximately 4000 ski, snow-board, telemark and nordic instructors are engaged. During the high season, as many as 7500 teach in these schools that offer skiing, snowboard, nordic and tele-mark lessons for both children and adults. On request, there are also a number of other sportive and comprehensive activities available to guests.
Half-day lessons1)
GraubündenEastern Switzerland Central SwitzerlandWestern SwitzerlandLake Geneva Region (Vaud)BerneTicinoValaisSwitzerland
1) A half-day lesson corresponds to two hours of 60 minutes.Source: SWISS SNOWSPORTS
Cycling in SwitzerlandOutstanding results for Cycling in Switzerland: in 2004 cyclists rode approx. 235 mil-lion kilometres on the Cycling in Switzerland route network. 170 000 travellers en route for several days generated over 570 000 overnight stays. Services and goods worth a total of CHF 130 million were consumed; travellers en route for several days spent approx. CHF 100 per day and day excursionists approx. CHF 13 per day.
Overnight stays of bicycle tourists according to lodging facility 2004
Hotel Camping Youth Farm Bed & Friends / Others Total hostel Breakfast Relations
Source: Cycling in Switzerland

38
1431 1505 2138 2144 562 641 123 6 – – 718 852 206 209 10 1 – – 327 380 221 272 15 12 30 37 48 44 – 14 9 6 – 12 – – – 3 9 17 – – 6 5
1 178 168 132 119 193 239 238 25 227 237 224 – – 27 34 18 12 12 10 – – 10 4 7 6 6 6
– – 220 257 – – 66 64 – – 25 40
Formal education
Basic vocational education and trainingFive new basic training courses were introduced in the hotel and catering industry. Catering specialists replace the existing specialised service employees and hotel spe-cialists replace the existing specialist hotel assistants. Specialist catering assistants will no longer be trained in the future. Another new feature consists of the three two-year basic training courses for kitchen employees, catering employees and ho-tel employees, which lead to the Basic federal certificate. About 10 000 trainees are being educated in the tourism sector at present.
Certificates of qualification Apprentices issued hiredAdvanced federal certificate (AFC) Total 2005 Total 2006 Total 2005 Total 2006Koch/KöchinServicefachangestellte / r neu: Restaurationsfachfrau/ -mannHotelfachassistent / in neu: Hotelfachfrau/-mannGastronomiefachassistent / in Hotel- und Gastrofachfrau/-mannKaufmann/ -frau B Hotel-Gastro-Tourismus Öffentlicher Verkehr Reisebüro TransportKaufmann/-frau E Hotel-Gastro-Tourismus Öffentlicher Verkehr Reisebüro TransportBahnbetriebsdisponent / inMatrose /Matrosin der BinnenschifffahrtZugbegleiter / in
Basic federal certificate (BFC) Total 2005 Total 2006 Total 2005 Total 2006Küchenangestellte / rRestaurationsangestellte / rHotellerieangestellte / r
Source: Swiss Federal Statistical Office
Swis
s To
uri
sm i
n F
igu
res
20
08

39
2005 2006 2007
24 23 14 29 43 49 58 62 8 70
23 16 15 5 20 13 4 4 10 14 – 8 – – – 9 – – – – 11 – 13 10 23 – 5 – – – 20 10 – 1 1 1924 8 3 – 3 22 16 16 – 16 33 32 25 – 25 – 23 – – –
– 75 – – – 390 387 202 236 438 360 371 92 278 370
– 6 – – – – 20 – – – 16 – 13 4 17 1 21 – – – 24 37 12 9 21 – 14 – – –
Swis
s To
uri
sm i
n F
igu
res
20
08Higher vocational education and training
Certificate exams of higher vocational education and training Total Total Men Women TotalFlight AttendantGastronomiekoch/-köchinKoch/Köchin der Spital-, Heim- und Gemeinschaftsgastronomie 1)
Restaurationsleiter / inHotelempfangs- und Administrationsleiter / in 2)
Carführer / in, Reiseleiter / inFachmann/-frau im Tourismus-ManagementReisefachmann/-frauTourismusassistent / in 3)
Schneesportlehrer / inSeilbahnfachmann/-frauBergführer / inFachmann/-frau im Pisten- und Rettungsdienst
Colleges of higher vocational education and training Total Total Men Women TotalHauswirtschafliche/r Betriebsleiter/inHotellerie-Restauration 4)
Tourismusfachmann/-frau
Diploma exams of higher vocational education and training Total Total Men Women TotalTourismus-Experte /ExpertinManager / in öffentlicher Verkehr 5)
Betriebsleiter / in der Gemeinschaftsgastronomie 6)
Küchenchef / in Produktionsleiter / inRestaurateur / inRestaurationsleiter / in 7)
1) former: Spital- und Heimkoch/-köchin2) former: Hoteldirektionsassistent/in3) former: Gästeberater/in für Tourismus4) former: diveded in Hotellerie-Restauration and Restauration-Hotellerie5) fromer: Experte/in öffentlicher Verkehr6) former: Betriebsleiter/in der Gemeinschaftsverpflegung7) former: Maître d‘hôtelSource: Swiss Federal Statistical Office
Formal education

40
1998 2005 2006 2007 06/07 175 366 333 411 23.4 74 63 67 70 4.5 – 41 69 79 14.5 249 470 469 560 19.4
5.31%
3.33%
1.97%
40.59%
2.96%
14.68%
8.20%
10.30%
1.67%
0.99%
1.05%
2.96%
2.84% 0.80%
0.68%
0.62%
0.49%
0.37%
0.19%
The quality program for Swiss tourism is aimed at improving quality awareness and the further development of quality services for tourists in all Switzerland’s tourist enterprises. The program is supported by twelve operational tourist partners.
Level I concentrates on quality development and is aimed especially at service qual-ity. The establishments are subject to random spot checks on site.
Level II focuses on quality assurance. All businesses holding Q II are regularly checked by independent Mystery Persons.
Level III is awarded to businesses which have implemented a comprehensive, inter-nationally-recognised Quality Management System.
Distribution of the Quality Label among sectors of the industry (31.12.2007)
A total of 4034 Quality Labels for Swiss Tourism have been awarded since 1998. Once awarded, the period of validity is three years.
Awarded Quality Labels
Change in %
Level ILevel IILevel IIITotal
Source: Swiss Tourism Federation
Quality label for the Swiss tourism industrySw
iss
Tou
rism
in
Fig
ure
s 2
00
8
Travel agencies
Education/Consulting
Public transport
Leisure /Culture
Coach companies
Railways & cable cars
Ski and snowboard schools
Restaurants
Tourist offices
Wine making associations
Real estate agencies
Marketing organizations
Taxis
Trade/ Industry
Shipping lines
Others
Public administration
Hotels
Supplementary accommodation

41
1990 2003 2004 2005 2006 20071) 05/04 06/05 07/061)
264.8 396.6 424.5 438.7 460.8 480.1 4.3 5.0 4.2 30.3 44.5 49.7 51.0 54.9 56.0 7.8 7.6 2.0 108.6 136.1 139.0 142.6 149.8 155.0 2.6 5.0 3.5
32.0 68.3 86.3 87.8 91.2 92.8 2.2 3.9 1.7
93.9 147.7 149.5 157.3 164.9 176.3 5.9 4.8 7.0 57.7 119.3 145.4 155.3 167.2 184.9 7.8 7.7 10.2 28.0 67.6 79.4 87.5 94.0 104.2 10.3 7.4 10.5 21.5 36.2 48.3 49.3 53.9 60.4 4.9 9.3 11.8 5.2 9.0 10.1 10.5 10.5 10.7 3.7 0.4 1.4 3.2 6.4 7.6 8.0 8.8 9.7 4.7 11.0 7.8 92.8 113.1 125.9 133.2 135.9 142.1 5.9 2.0 4.7 71.7 77.4 85.8 89.9 90.7 95.0 4.7 0.9 4.7 11.4 17.0 18.1 18.8 19.4 19.3 3.7 3.5 –0.9 1.9 4.9 5.7 6.3 7.0 7.7 13.2 10.8 11.1 7.7 13.7 16.2 18.2 18.8 20.2 11.9 3.0 8.1 15.2 30.8 33.4 37.3 40.7 44.2 8.8 9.2 7.9 8.4 11.1 12.8 13.9 14.9 16.4 8.9 7.4 8.5 6.8 19.7 20.7 23.3 25.8 27.8 8.8 10.4 7.5 10.0 30.0 36.3 38.3 41.8 46.4 5.9 8.9 13.4 441 690 766 803 846 898 5.5 5.4 6.1
International Tourist ArrivalsDifferent factors like volatility of aviation fuel prices, exchange rate fluctuations, economic slowdown and credit crunch, isolated terrorist incidents, isolated out-breaks of avian flu, foot and mouth disease, floods, hurricanes, landslides and for-est fires influenced international tourism. 2007 tourism performance is all the more impressive.In 2007, international tourist arrivals grew by an estimated 6.1% to reach a new record figure of nearly 898 million. This represents nearly 52 million more arrival than in 2006. In fact, world tourism enjoyed iths fourth consective year of growth in 2007 above the longterm forecast of 4.1% and, surprisingly, it even exceeded the 5.5% increases recorded in 2005 and 2006.
International Change in % arrivals in millions
EuropeNorthern EuropeWestern EuropeCentral /Eastern EuropeSouthern /Mediter. Europe
Asia and PacificNorth-East AsiaSouth-East AsiaOceaniaSouth Asia
AmericasNorth AmericaCaribbeanCentral AmericaSouth America
AfricaNorth AfricaSubsaharan Africa
Middle EastWorld
1) EstimateSource: UNWTO
Swis
s To
uri
sm i
n F
igu
res
20
08
International

42
2005 2006 05/ 04 06/ 051 75.9 79.1 1.0 4.22 55.9 58.5 6.6 4.53 49.2 51.1 6.8 3.84 46.8 49.6 12.1 6.05 36.5 41.1 –1.5 12.46 28.0 30.7 9.2 9.37 21.5 23.6 6.8 9.68 21.9 21.4 6.3 –2.69 20.0 20.3 3.0 1.510 19.9 20.2 0.2 1.311 10.5 11.4 10.5 8.8
2005 2006 05/ 04 06/ 051 81.8 85.7 9.7 4.82 48.0 51.1 6.0 5.63 42.3 46.3 3.5 0.64 35.4 38.1 –0.7 6.75 29.3 33.9 13.8 15.96 30.7 33.5 9.5 8.57 29.2 32.8 5.4 11.38 16.9 17.8 6.9 7.39 18.2 16.9 14.2 –7.210 16.0 16.7 2.7 3.111 11.0 11.8 8.2 8.0
Top destinations
Rank Country of destination International Change in % arrivals in millions
France Spain United States China Italy United Kingdom Germany Mexico Austria Russia Switzerland1)
Rank Country of destination International Change in % income tourism in billion US$
United States Spain France Italy China United Kingdom Germany Australia Turkey Austria Switzerland1)
1) Estimate Switzerland TourismSource: UNWTO
Swis
s To
uri
sm i
n F
igu
res
20
08
International

43
Swis
s To
uri
sm i
n F
igu
res
20
08
Tourism associations and institutes
Tourism Interest Groups and Professional Associations
Association of postgraduate Hoteliers – Restaurateure SHV/Hotelmanager HFNDS, Secretariat, Zürichstr. 78, 8118 Pfaffhausen, phone +41 (0)43 355 57 82, fax +41 (0)43 355 57 93, www.vdh.ch, [email protected]. Network-ing, further education and friendship care for students of the postdiploma course «Unternehmensführung resp. Nachdiplomstudium HF-NDS» of hotellerie suisse.
Association of Swiss Tourism Managers (ASTM), c/o FST, P.O.Box 8275, 3001 Berne, phone +41 (0)31 307 47 43, fax +41 (0)31 307 47 48, www.vstm.ch, [email protected]. Association suisse des managers en tourisme. To promote the professional interests of tourist office managers. Vocational training and advanced training of tourist office personnel, lobbying.
Association of the Swiss Navigation Companies, Mythenquai 333, 8038 Zurich, phone +41 (0)43 243 16 57, fax +41 (0)43 243 16 58, www.vssu.ch. Safe-guarding the interests of the 16 member shipping companies.
Automobile Club of Switzerland (ACS), Wasserwerkgasse 39, 3000 Berne 13, phone +41 (0)31 328 31 11, fax +41 (0)31 311 03 10, www.acs.ch, [email protected]. European breakdown service, to safeguard the interests of motorists, legal coun-seling and support, emergency road service, tourist service.
Bed and Breakfast Switzerland GmbH, Chemin du Verger 32, 1752 Villars-sur-Glâne, phone 079 627 95 49, fax 026 400 06 76, www.bnb.ch, [email protected]. Organisation of Swiss BnB host families. Purpose: information, promotion, publica-tion of the «Bed and Breakfast Switzerland Guide», quality standards.
Community of Interest of the Higher Schools of Tourism Management Switzerland, c/o HFT Luzern, Rösslimatte 48, Postfach 3140, 6002 Luzern, phone +41 (0)41 228 41 41, fax +41 (0)41 228 41 44, www.hft-schweiz.ch. Safeguarding common interests towards the public authorities, associations and the general pub-lic, promotion of tourism management education and training in Switzerland.
CONTACT groups.ch, Hotels and Holiday Homes for Groups in Switzerland, Spitzackerstrasse 19, P.O.Box , 4410 Liestal, phone +41 (0)61 926 60 00, fax +41 (0)61 911 88 88, www.groups.ch, [email protected]. Organisation of the Hotels and Holiday Homes for Groups in Switzerland. Services: wordwide marketing, con-sultation and settlement services, travel insurance specifically for groups, central rental agency (no commissions).
fit – Frauen im Tourismus, c/o STF, Finkenhubelweg 11, P.O.Box 8275, 3001 Berne, phone +41 (0)76 473 83 35, www.f-i-t.ch, [email protected]. The strongest women‘s network for women in the tourism industry.

44
Swis
s To
uri
sm i
n F
igu
res
20
08
Tourism associations and institutes
GastroSuisse, Blumenfeldstrasse 20, P.O.Box, 8046 Zurich, phone +41 (0)848 377 111, fax +41 (0)848 377 112, www.gastrosuisse.ch, [email protected]. GastroSuisse is the leading national association of hotels and restaurants. Around 21 000 members (hotels, bed & breakfast establishments, guest houses, restaurants and cafes) in 26 cantonal sections and four specialist groups belong to Switzerland‘s largest employer‘s association in the hotel and catering industry.
hotelleriesuisse (Swiss Hotel Association), Monbijoustrasse 130, P.O.Box, 3001 Berne, phone +41 (0)31 370 41 11, fax +41 (0)31 370 44 44, www.hotellerie suisse.ch, [email protected]. The leading association for hotels and accom-modation in Switzerland. Creator and owner of the official Swiss hotel classifica-tion system.
Hotel & Gastro Union, Adligenswilerstrasse 29/22, P.O.Box 4870, 6002 Lucerne, phone +41 (0)41 418 22 22, fax +41 (0)41 412 03 72, www.GastroLine.ch, [email protected]. Union of employees, professionals and management staff of the hotel/restaurant trade.
Public Transport Association, Dählhölzliweg 12, 3000 Berne 6, phone +41 (0)31 359 23 23, fax +41 (0)31 359 23 10, www.voev.ch, [email protected]. To safe-guard the interests of members, to encourage cooperation among members, infor-mation and consultation services, training of professionals.
Safety in adventures, Office: beco Berner Wirtschaft, Münsterplatz 3, 3011 Bern, www.safetyinadventures.ch, [email protected], Certification Body: SQS, Luigi Arigoni, phone +41 (0)81 356 00 21, fax +41 (0)81 356 00 22, [email protected]. The foundation supports the cause of safety for adventure and outdoor ac-tivities offered on a commercial basis in Switzerland. Certification procedure on the basis of a safety concept; certified undertakings are awarded a safety label.
«schlaf im Stroh!» (SIS), Brünigstrasse, 6078 Lungern, phone +41 (0)41 678 12 86, fax +41 (0)41 678 12 88, www.schlaf-im-stroh.ch, [email protected]. The objective of this Swiss Association is the promotion of agrotourist services asso-ciated with the protected trademark «schlaf im Stroh!» («Sleep on Straw») and its quality charter, as well as supporting the hosts providing these services.
Swiss Association of CoffeehouseHolders (SCV), Bleicherweg 54, 8002 Zurich, phone +41 (0)44 201 67 77, fax +41 (0)44 201 68 77, www.cafetier.ch, [email protected]. Representation of the professional interests of café owners and support of the members with comprehensive services.
Swiss Cableways, Dählhölzliweg 12, 3000 Berne 6, phone +41 (0)31 359 23 33, fax +41 (0)31 359 23 10, www.seilbahnen.org, [email protected]. To safeguard the interests of the members, information and consultation services, common poli-cies on tariffs and standardized tickets, vocational training and advanced training for personnel at all levels.

45
Swis
s To
uri
sm i
n F
igu
res
20
08
Tourism associations and institutes
swissApartments (swap), c/o STF, Finkenhubelweg 11, P.O.Box 8275, 3001 Berne, phone +41 (0)55 422 01 25, www.swissapartments.ch, info@swissapart ments.ch. Federation of classified holiday home owners. Its mission is to represent the interests of its members and offer an optimized organizational framework. swap compiles holiday home offers at national level and markets them at both national and international levels.
swisscamps, Swiss Camping Association, Bahnhofstrasse 5, 3322 Schönbühl, phone +41 (0)31 852 06 26, fax +41 (0)31 852 06 27, www.swisscamps.ch, info @swisscamps.ch. Established in 1975. Promotion of camping vacations and classifi-cation of camp sites.
Swiss Centre for mountain regions (SAB), Seilerstrasse 4, PO Box 7836, 3001 Bern, phone 031 382 10 10, www.sab.ch, [email protected]. Created in 1943. Lobbying for mountain regions and advisory services for projects in regional development.
SWISS CITIES, c/o Switzerland Tourism, Tödistrasse 7, 8027 Zurich, phone +41 (0)44 288 12 84, fax +41 (0)44 288 12 07, www.MySwitzerland.com/cities, [email protected]. Promotion of Switzerland as a meeting, congress and incentive destination.
Swiss Federation of Travel Agencies (SFTA), Etzelstrasse 42, P.O.Box, 8038 Zurich, phone +41 (0)44 487 30 50, fax +41 (0)44 480 09 45, www.srv.ch, [email protected]. Association of qualified travel agencies in Switzerland to develop profes-sional skills, protect the interests of the profession, professional assistance to SFTA members.
Swiss holiday farms, 8595 Altnau, phone +41 (0)71 695 23 72, fax +41 (0)71 695 23 67, www.agrotourismus.ch, [email protected]. Support of the members, information and consultation services, basic and advanced training of host fami-lies. Quality standards (seal of quality). Central booking office at Swiss Travel Sav-ings Fund.
SwitzerlandMobility, P.O.Box 8275, 3001 Berne, phone +41 (0)31 307 47 40, fax +41 (0)31 307 47 48, www.switzerlandmobility.ch, [email protected]. Quality assurance, information, development of national and regional offers for hiking, cycling, mountain biking, skating and canoeing.
Swiss Mountain Guides‘ Association, Hadlaubstrasse 49, 8006 Zurich, phone +41 (0)44 360 53 66, www.4000plus.ch, [email protected]. Professional association of the approximately 1500 mountain guides. Training and further education for mountain guides, hiking guides, climbing teachers and «Rope-assisted working». Trade journal: Berg&Ski.
Swiss PostBus Ltd, Belpstrasse 37, P.O.Box, 3030 Berne, phone +41 (0)848 11 12 13, fax +41 (0)58 667 32 86, www.postbus.ch, [email protected]. The lead-ing provider of regional passenger services on Swiss roads.

46
Swis
s To
uri
sm i
n F
igu
res
20
08
Tourism associations and institutes
SWISS SNOWSPORTS, Hühnerhubelstrasse 95, 3123 Belp, phone +41 (0)31 810 41 11, fax +41 (0)31 810 41 12, www.snowsports.ch, [email protected]. Alliance of tourism sector institutions interested in joint promotion of the Swiss Ski School system. Education of ski, snowboard, telemark and cross-country teachers.
Swiss Spa, Avenue des Bains 22, 1400 Yverdon-les-Bains, phone +41 (0)24 420 15 21, fax +41 (0)24 423 02 52, www.swissthermalspa.ch, [email protected]. To safeguard and promote the economic, legal, social and scientific interests of the Swiss thermal spas. In particular, the association commits itself to respect the qualitative standards imposed by the legal prescriptions relation to thermal spas.
Swiss Tourism Federation (STF), Finkenhubelweg 11, P.O.Box 8275, 3001 Berne, phone +41 (0)31 307 47 47, fax +41 (0)31 307 47 48, www.swisstourfed.ch, [email protected]. To safeguard the interests of those responsible for tour-ism in Switzerland and to participate in all tourism policy decisions; to provide infor-mation about the importance of tourism and to contribute to tourism research.
Swiss Travel Savings Fund (reka), Neuengasse 15, 3001 Berne, phone +41 (0)31 329 66 33, fax +41 (0)31 329 66 01, www.reka.ch, [email protected]. The pro-motion of social and family tourism, vacation financing by issuing Reka currency, running of REKA vacation centres, vacation apartment rentals.
Swiss Youth Hostels (SYH), Schaffhauserstrasse 14, P.O.Box, 8042 Zurich, phone +41 (0)44 360 14 14, fax +41 (0)44 360 14 60, www.youthhostel.ch, booking [email protected]. Promotion of youth travel, accommodation for young trav-ellers, youth groups, schools, families, etc.
Switzerland Convention & Incentive Bureau (SCIB), Tödistrasse 7, P.O.Box, 8027 Zurich, phone +41 (0)44 288 12 71, fax +41 (0)44 201 53 01, www.My Switzerland.com, [email protected]. Promotion of Switzerland as a meeting and congress destination.
Touring Club Switzerland (TCS), ch. de Blandonnet 4, 1214 Vernier, phone +41 (0)22 417 27 27, fax +41 (0)22 417 20 20, www.tcs.ch. Assistance to persons in case of emergency all around the world, emergency road service in Europe, tourist service, to safeguard the interests of the motorists, legal counseling and support.
Wellbeing Switzerland, Office of Swiss Health Hotels, Sonnenbühlstrasse 3, 9200 Gossau, phone +41 (0)71 350 14 14, fax +41 (0)71 350 14 18, www.wohl befinden.com, [email protected]. Representing the interests of health hotels, rehabilitation and convalscent homes.

47
Swis
s To
uri
sm i
n F
igu
res
20
08
Tourism associations and institutes
Public corporations
Swiss Association for Hotel Credit (SGH), Gartenstrasse 25, P.O.Box, 8027 Zurich, phone +41 (0)44 209 16 16, fax +41 (0)44 209 16 17, www.sgh.ch, [email protected]. Financing, appraisals, consulting.
Switzerland Tourism (ST), Tödistrasse 7, 8027 Zurich, phone +41 (0)44 288 11 11, fax +41 (0)44 288 12 05, www.MySwitzerland.com, [email protected]. Offices in 27 countries. Increase the demand for Switzerland as a travel, holiday and congress destination. Federal institutes
Federal institutes
State Secretariat for Economic Affairs (SECO), Tourism, Effingerstrasse 27, 3003 Berne, phone +41 (0)31 322 27 58, fax +41 (0)31 323 12 12, www.seco. admin.ch. Central federal authority for national and international tourism policies.
Swiss Federal Statistical Office, Tourism Subdivision, Espace de l‘Europe 10, 2010 Neuchâtel, phone +41 (0)32 713 62 80, fax +41 (0)32 713 62 15, www.statistik.admin.ch, [email protected]. To provide statistics on Swiss tourism (surveys on infrastructure, arrivals and overnight stays in hotels, camping places and youth hostels, tourism balance of payments, reports on special subjects).
Swiss Federal Transport Office, Mühlestrasse 6, 3063 Ittigen, Postadresse: 3003 Berne, phone +41 (0)31 322 57 11, fax +41 (0)31 322 58 11, www.bav.admin.ch, [email protected]. Within the tourism framework, the Federal Transport Office is responsible for issuing aerial cablecar licences.
Institutes of higher education
Institute for public services and tourism at the University of St. Gall, Dufourstrasse 40a, 9000 St. Gall, phone +41 (0)71 224 25 25, fax +41 (0)71 224 25 36, www.idt.unisg.ch, [email protected]. University lecturing, research, market research, consulting and expertising in the competence fields of tourism and trans-portation, regional economic and public management.
Institute of Tourism (ITW), Rösslimatte 48, P.O. Box 3140, 6002 Lucerne, phone +41 (0)41 228 41 45, fax +41 (0)41 228 41 44, www.hslu.ch/itw, [email protected]. An institute of the Hochschule Luzern-Wirtschaft, active in the fields of tourism and mobility, training and further education in tourist affairs, applied research and prac-tice-orientated consultation.

48
Swis
s To
uri
sm i
n F
igu
res
20
08
Tourism associations and institutes
Institute of Economy & Tourism (IET), HES-SO Valais (University of Applied Sciences Western Switzerland), TechnoArk 3, 3960 Sierre, phone +41 (0)27 606 90 01, fax +41 (0)27-606 90 00, http://iet.hevs.ch, [email protected]. The Institute of Economy & Tourism specializes in the areas of Alpine tourism, regional econo-my and development of new Internet business models through its teaching and re-search units «Tourism Management», «Public Management» and «Entrepreneurial Development».
Institute for Tourism and Leisure Research (ITF) at University of Applied Sciences HTW Chur, Comercialstrasse 22, 7000 Chur, phone +41 (0)81 286 39 34, fax +41 (0)81 286 39 49, www.itf.ch, [email protected]. BSc and MSc study pro-grams and further education (EMBA) in tourism and leisure management. Applied research and consulting in Customer Management, Product Innovation Manage-ment, Business and Destination Development and Management.
University of Berne, Research Institute for Leisure and Tourism (FIF), Schanzen-eckstrasse 1, P.O.Box 8573, 3001 Berne, phone +41 (0)31 631 37 11, fax +41 (0)31 631 34 15, www.fif.unibe.ch, [email protected]. Research in tourism-related issues, lectures on tourism at Berne University, experts in the leisure and tourism sectors.
International Tourism Organizations
European Travel Commission (ETC), Avenue Marnix 19a, Box 25, B-1000 Brussels, Belgium, phone +32 2 502 01 13, fax +32 2 514 18 43, www.etc- corporate.org, [email protected].
EUROSTAT, Joseph Bech Building, L-2920 Luxembourg, phone +35 2 4301 33444, fax +35 2 4301 35349, www.epp.eurostat.ec.europa.eu, [email protected].
HOTREC, Boulevard Anspach 111, Box 4, B-1000 Brussels, Belgium, phone +32 2 548 90 00, fax +32 2 502 41 73, www.hotrec.org, [email protected].
World Tourism Organization (UNWTO), Capitàn Haya 42, E-28020 Madrid, Spain, phone +34 915 678 166, fax +34 915 678 220, www.unwto.org, [email protected].

![Library%20in%20 Your%20 Pocket Slideshare[1]](https://static.fdocuments.us/doc/165x107/54b5d2bb4a7959231b8b472d/library20in20-your20-pocket-slideshare1.jpg)