School Improvement Plan (SIP) Form SIP-1nmiamielem.dadeschools.net/133941_1112_SIP.pdf · Adequate...
45
2011-2012 School Improvement Plan (SIP)-Form SIP-1 April 2011 1 Rule 6A-1.099811 Revised April 29, 2011 FLORIDA DEPARTMENT OF EDUCATION School Improvement Plan (SIP) Form SIP-1 Proposed for 2011-2012
Transcript of School Improvement Plan (SIP) Form SIP-1nmiamielem.dadeschools.net/133941_1112_SIP.pdf · Adequate...
2011-2012 School Improvement Plan (SIP)-Form SIP-1
April 2011 1
Rule 6A-1.099811
Revised April 29, 2011
FLORIDA DEPARTMENT OF EDUCATION
School Improvement Plan (SIP)
Form SIP-1
Proposed for 2011-2012

2011-2012 School Improvement Plan (SIP)-Form SIP-1
April 2011 2
Rule 6A-1.099811
Revised April 29, 2011
2011 – 2012 SCHOOL IMPROVEMENT PLAN
PART I: SCHOOL INFORMATION
School Name: North Miami Elementary District Name: Miami-Dade
Principal: Debra L. Dubin Superintendent: Alberto M. Carvalho
SAC Chair: Mary Sisley Date of School Board Approval: Pending
Student Achievement Data:
The following links will open in a separate browser window. .
School Grades Trend Data (Use this data to complete Sections 1-4 of the reading and mathematics goals and Sections 1 and 2 of the writing and science goals.)
Adequate Yearly Progress (AYP) Trend Data (Use this data to complete Sections 5A-5D of the reading and mathematics goals and Section 3A-3D of the writing goals.)
Florida Comprehensive Assessment Test (FCAT) Trend Data (Use this data to inform the problem-solving process when writing goals.)
Highly Qualified Administrators
List your school’s highly qualified administrators and briefly describe their certification(s), number of years at the current school, number of years as an administrator, and their
prior performance record with increasing student achievement at each school. Include history of school grades, FCAT performance (Percentage data for Proficiency, Learning Gains, Lowest 25%), and Adequate Yearly Progress (AYP).
Position Name Degree(s)/
Certification(s)
Number of
Years at
Current School
Number of Years
as an
Administrator
Prior Performance Record (include prior School Grades, FCAT
(Proficiency, Learning Gains, Lowest 25%), and AYP information
along with the associated school year)
Principal
Debra L. Dubin Leadership,
Principal Certification- State of Florida
BS/MS Education,
Florida State University;
Certification- Educational
8 16
’11 ’10 ’09 ’08 ’07 School Grade C B A C A
AYP N N N N N
High Standards Rdg. 56 61 61 59 65
High Standards Math 62 62 54 58 59
2011-2012 School Improvement Plan (SIP)-Form SIP-1
April 2011 3
Rule 6A-1.099811
Revised April 29, 2011
Leadership all levels, Emotionally
Handicapped K-
12, Specific
Learning
Disabilities K-12,
Varying
Exceptionalities
K-12,
Endorsement-
ESOL
Nova South
Eastern Certification-
Educational
Lrng Gains-Rdg. 56 64 70 68 69 Lrng Gains-Math 51 63 69 56 78
Gains-Rdg-25% 58 57 67 70 76
Gains-Math-25% 56 72 80 61 87
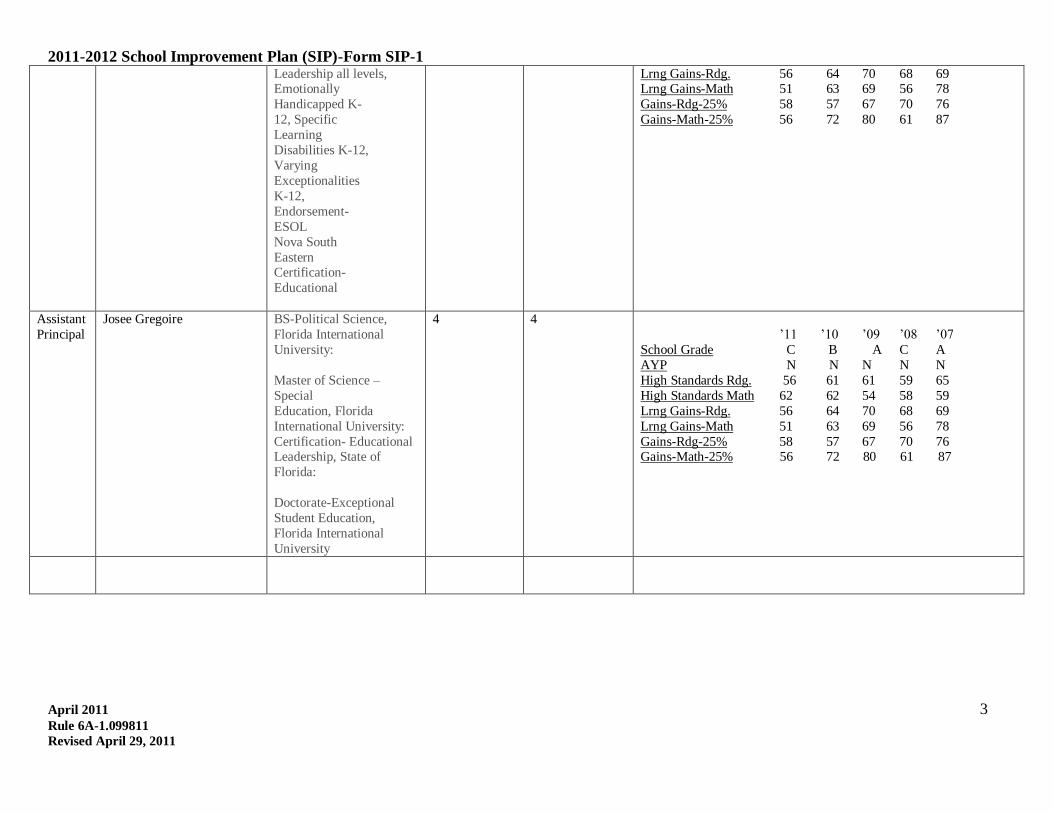
Assistant
Principal
Josee Gregoire BS-Political Science,
Florida International
University:
Master of Science –
Special
Education, Florida
International University:
Certification- Educational Leadership, State of
Florida:
Doctorate-Exceptional
Student Education,
Florida International
University
4 4
’11 ’10 ’09 ’08 ’07
School Grade C B A C A
AYP N N N N N
High Standards Rdg. 56 61 61 59 65
High Standards Math 62 62 54 58 59
Lrng Gains-Rdg. 56 64 70 68 69
Lrng Gains-Math 51 63 69 56 78
Gains-Rdg-25% 58 57 67 70 76 Gains-Math-25% 56 72 80 61 87
2011-2012 School Improvement Plan (SIP)-Form SIP-1
April 2011 4
Rule 6A-1.099811
Revised April 29, 2011
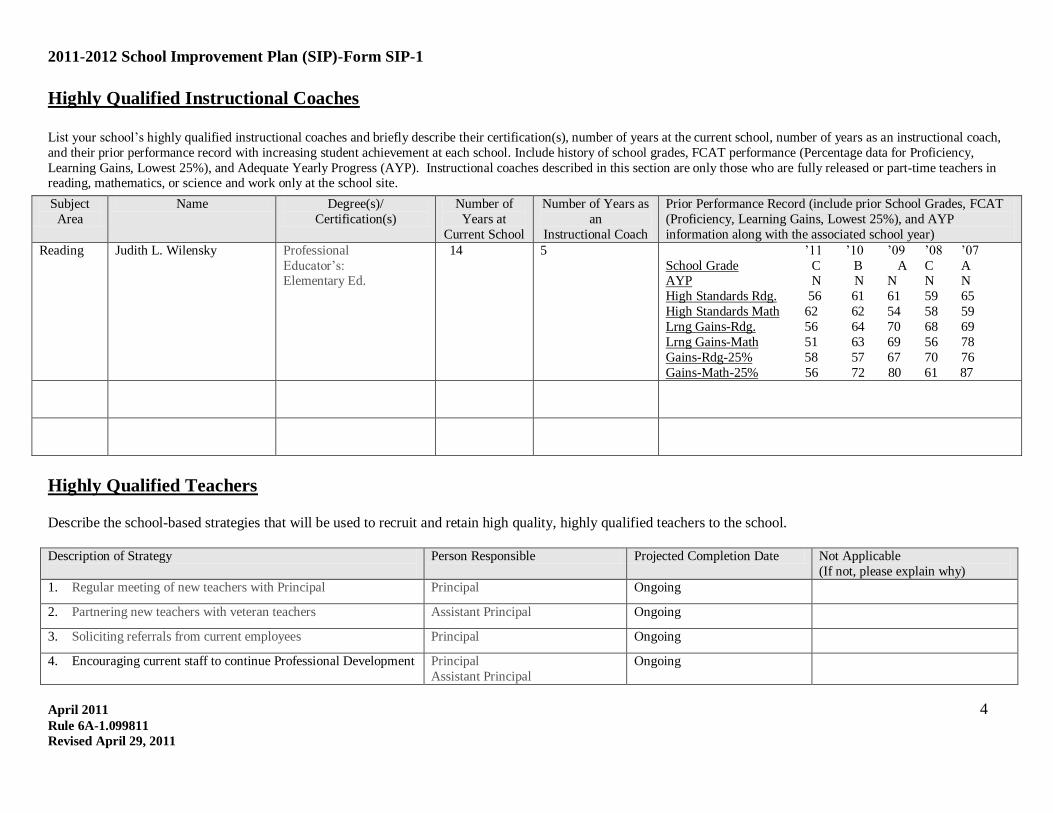
Highly Qualified Instructional Coaches
List your school’s highly qualified instructional coaches and briefly describe their certification(s), number of years at the current school, number of years as an instructional coach,
and their prior performance record with increasing student achievement at each school. Include history of school grades, FCAT performance (Percentage data for Proficiency,
Learning Gains, Lowest 25%), and Adequate Yearly Progress (AYP). Instructional coaches described in this section are only those who are fully released or part-time teachers in reading, mathematics, or science and work only at the school site.
Subject
Area
Name Degree(s)/
Certification(s)
Number of
Years at
Current School
Number of Years as
an
Instructional Coach
Prior Performance Record (include prior School Grades, FCAT
(Proficiency, Learning Gains, Lowest 25%), and AYP
information along with the associated school year)
Reading Judith L. Wilensky Professional
Educator’s: Elementary Ed.
14 5 ’11 ’10 ’09 ’08 ’07
School Grade C B A C A AYP N N N N N
High Standards Rdg. 56 61 61 59 65
High Standards Math 62 62 54 58 59
Lrng Gains-Rdg. 56 64 70 68 69
Lrng Gains-Math 51 63 69 56 78
Gains-Rdg-25% 58 57 67 70 76
Gains-Math-25% 56 72 80 61 87
Highly Qualified Teachers Describe the school-based strategies that will be used to recruit and retain high quality, highly qualified teachers to the school. Description of Strategy
Person Responsible Projected Completion Date Not Applicable
(If not, please explain why)
1. Regular meeting of new teachers with Principal Principal Ongoing
2. Partnering new teachers with veteran teachers Assistant Principal Ongoing
3. Soliciting referrals from current employees Principal Ongoing
4. Encouraging current staff to continue Professional Development Principal
Assistant Principal
Ongoing

2011-2012 School Improvement Plan (SIP)-Form SIP-1
April 2011 5
Rule 6A-1.099811
Revised April 29, 2011
Non-Highly Qualified Instructors List all instructional staff and paraprofessionals who are teaching out-of-field and/or who are NOT highly qualified. Name Certification Teaching Assignment Professional Development/Support to Become Highly Qualified
Aissatou Clesca-Cajuste Elem Ed. 2nd Grade Ms. Clesca is in the process of completing the ESOL
Endorsement classes. Ms. Clesca is partnered with Ms. Watson-
Richards, who has been teaching elementary education for over
20 years.
Chantal Lafortune PK/Primary Pre-Kindergarten Ms. Lafortune has completed two of the ESOL Endorsement
classes. She is in the process of completing the ESOL
Endorsement classes. Ms. Lafortune is partnered with Ms.
Alberto, who is the ESOL Endorsed mentor teacher.
Margaret N. McCrary Occupational
Specialist
2nd Grade Ms. McCrary has been given an out-of-field waiver and is
registered to take courses to complete elementary certification in
the spring. Ms. McCrary is partnered with Ms. Watson-Richards,
who has been teaching elementary education for over 20 years.
Staff Demographics
Please complete the following demographic information about the instructional staff in the school.
*When using percentages, include the number of teachers the percentage represents (e.g., 70% (35)). Total Number of Instructional Staff
% of First-Year Teachers
% of Teachers with 1-5 Years of Experience
% of Teachers with 6-14 Years of Experience
% of Teachers with 15+ Years of Experience
% of Teachers with Advanced Degrees
% Highly Qualified Teachers
% Reading Endorsed Teachers
% National Board Certified Teachers
% ESOL Endorsed Teachers
45
2 (4.44%)
18 (40.00%)
14 (31.11%)
11 (24.44%)
20 (44.44%)
34 (89.47%)
4 (8.89%)
1 (2.22%)
23 (51.11%)
2011-2012 School Improvement Plan (SIP)-Form SIP-1
April 2011 6
Rule 6A-1.099811
Revised April 29, 2011
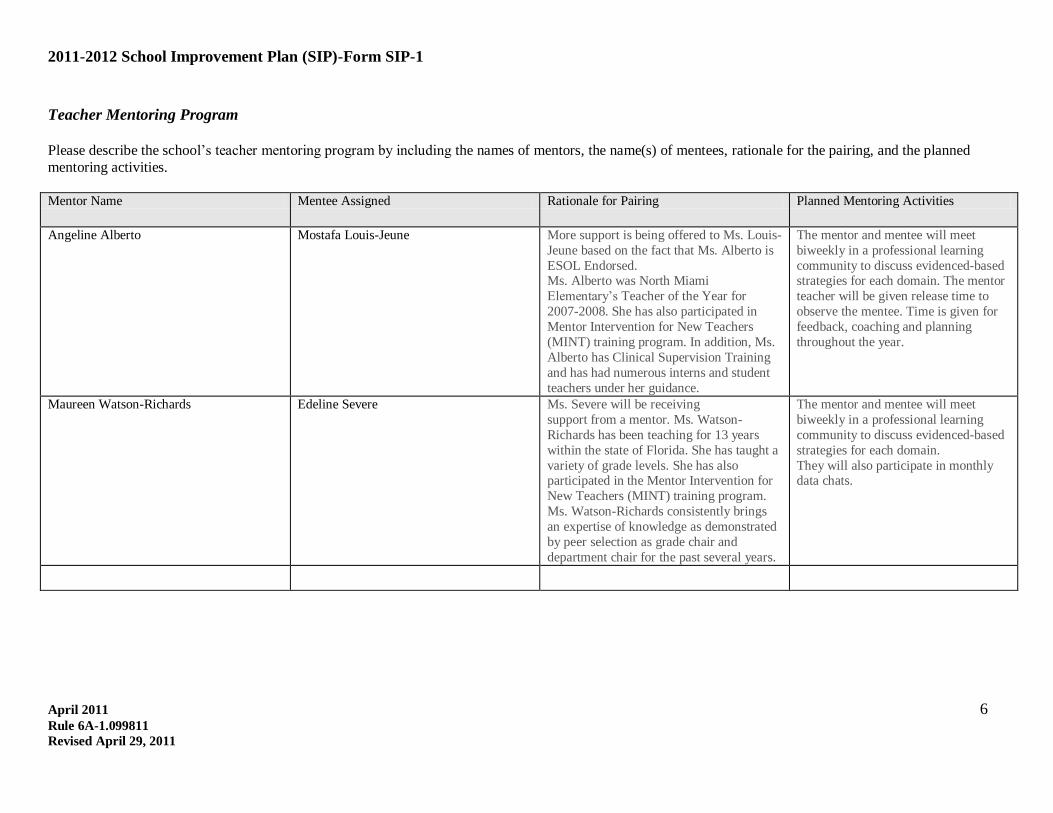
Teacher Mentoring Program
Please describe the school’s teacher mentoring program by including the names of mentors, the name(s) of mentees, rationale for the pairing, and the planned
mentoring activities. Mentor Name Mentee Assigned Rationale for Pairing Planned Mentoring Activities
Angeline Alberto Mostafa Louis-Jeune
More support is being offered to Ms. Louis-
Jeune based on the fact that Ms. Alberto is
ESOL Endorsed. Ms. Alberto was North Miami
Elementary’s Teacher of the Year for
2007-2008. She has also participated in
Mentor Intervention for New Teachers
(MINT) training program. In addition, Ms.
Alberto has Clinical Supervision Training
and has had numerous interns and student
teachers under her guidance.
The mentor and mentee will meet
biweekly in a professional learning
community to discuss evidenced-based strategies for each domain. The mentor
teacher will be given release time to
observe the mentee. Time is given for
feedback, coaching and planning
throughout the year.
Maureen Watson-Richards Edeline Severe Ms. Severe will be receiving
support from a mentor. Ms. Watson-
Richards has been teaching for 13 years
within the state of Florida. She has taught a
variety of grade levels. She has also participated in the Mentor Intervention for
New Teachers (MINT) training program.
Ms. Watson-Richards consistently brings
an expertise of knowledge as demonstrated
by peer selection as grade chair and
department chair for the past several years.
The mentor and mentee will meet
biweekly in a professional learning
community to discuss evidenced-based
strategies for each domain.
They will also participate in monthly data chats.
2011-2012 School Improvement Plan (SIP)-Form SIP-1
April 2011 7
Rule 6A-1.099811
Revised April 29, 2011
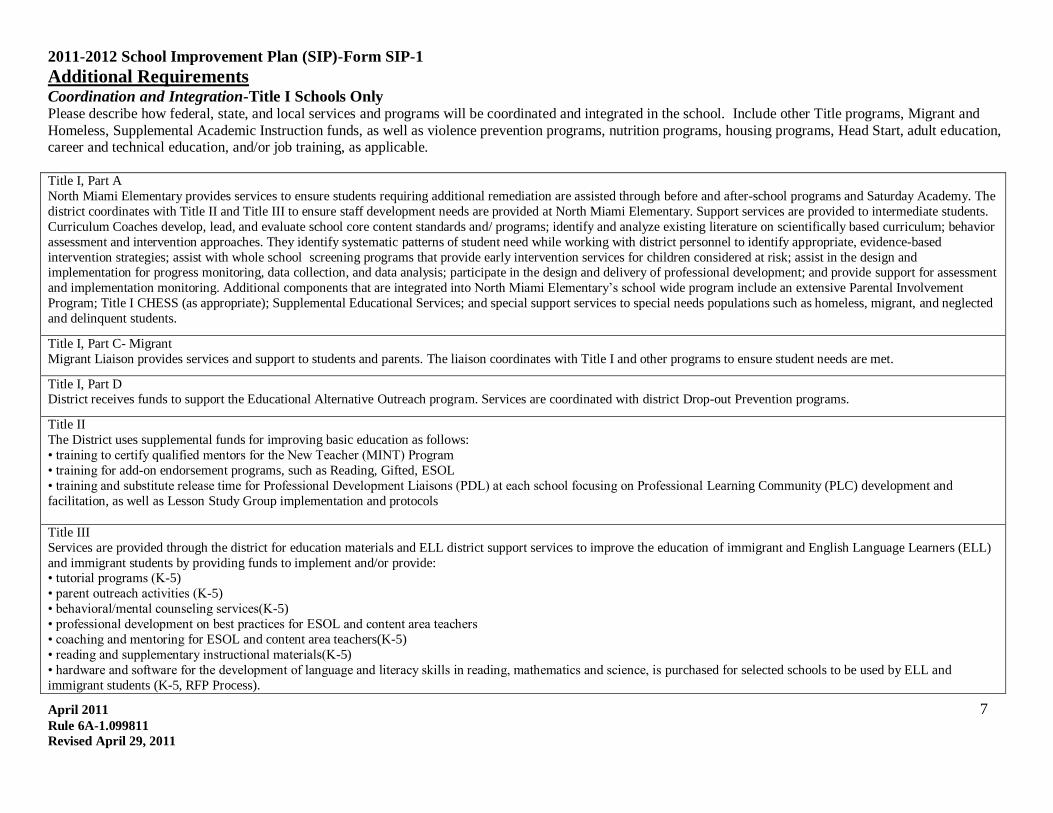
Additional Requirements Coordination and Integration-Title I Schools Only Please describe how federal, state, and local services and programs will be coordinated and integrated in the school. Include other Title programs, Migrant and
Homeless, Supplemental Academic Instruction funds, as well as violence prevention programs, nutrition programs, housing programs, Head Start, adult education, career and technical education, and/or job training, as applicable.
Title I, Part A
North Miami Elementary provides services to ensure students requiring additional remediation are assisted through before and after-school programs and Saturday Academy. The
district coordinates with Title II and Title III to ensure staff development needs are provided at North Miami Elementary. Support services are provided to intermediate students.
Curriculum Coaches develop, lead, and evaluate school core content standards and/ programs; identify and analyze existing literature on scientifically based curriculum; behavior
assessment and intervention approaches. They identify systematic patterns of student need while working with district personnel to identify appropriate, evidence-based
intervention strategies; assist with whole school screening programs that provide early intervention services for children considered at risk; assist in the design and implementation for progress monitoring, data collection, and data analysis; participate in the design and delivery of professional development; and provide support for assessment
and implementation monitoring. Additional components that are integrated into North Miami Elementary’s school wide program include an extensive Parental Involvement
Program; Title I CHESS (as appropriate); Supplemental Educational Services; and special support services to special needs populations such as homeless, migrant, and neglected
and delinquent students.
Title I, Part C- Migrant
Migrant Liaison provides services and support to students and parents. The liaison coordinates with Title I and other programs to ensure student needs are met.
Title I, Part D District receives funds to support the Educational Alternative Outreach program. Services are coordinated with district Drop-out Prevention programs.
Title II
The District uses supplemental funds for improving basic education as follows:
• training to certify qualified mentors for the New Teacher (MINT) Program
• training for add-on endorsement programs, such as Reading, Gifted, ESOL
• training and substitute release time for Professional Development Liaisons (PDL) at each school focusing on Professional Learning Community (PLC) development and
facilitation, as well as Lesson Study Group implementation and protocols
Title III
Services are provided through the district for education materials and ELL district support services to improve the education of immigrant and English Language Learners (ELL)
and immigrant students by providing funds to implement and/or provide: • tutorial programs (K-5)
• parent outreach activities (K-5)
• behavioral/mental counseling services(K-5)
• professional development on best practices for ESOL and content area teachers
• coaching and mentoring for ESOL and content area teachers(K-5)
• reading and supplementary instructional materials(K-5)
• hardware and software for the development of language and literacy skills in reading, mathematics and science, is purchased for selected schools to be used by ELL and
immigrant students (K-5, RFP Process).
2011-2012 School Improvement Plan (SIP)-Form SIP-1
April 2011 8
Rule 6A-1.099811
Revised April 29, 2011
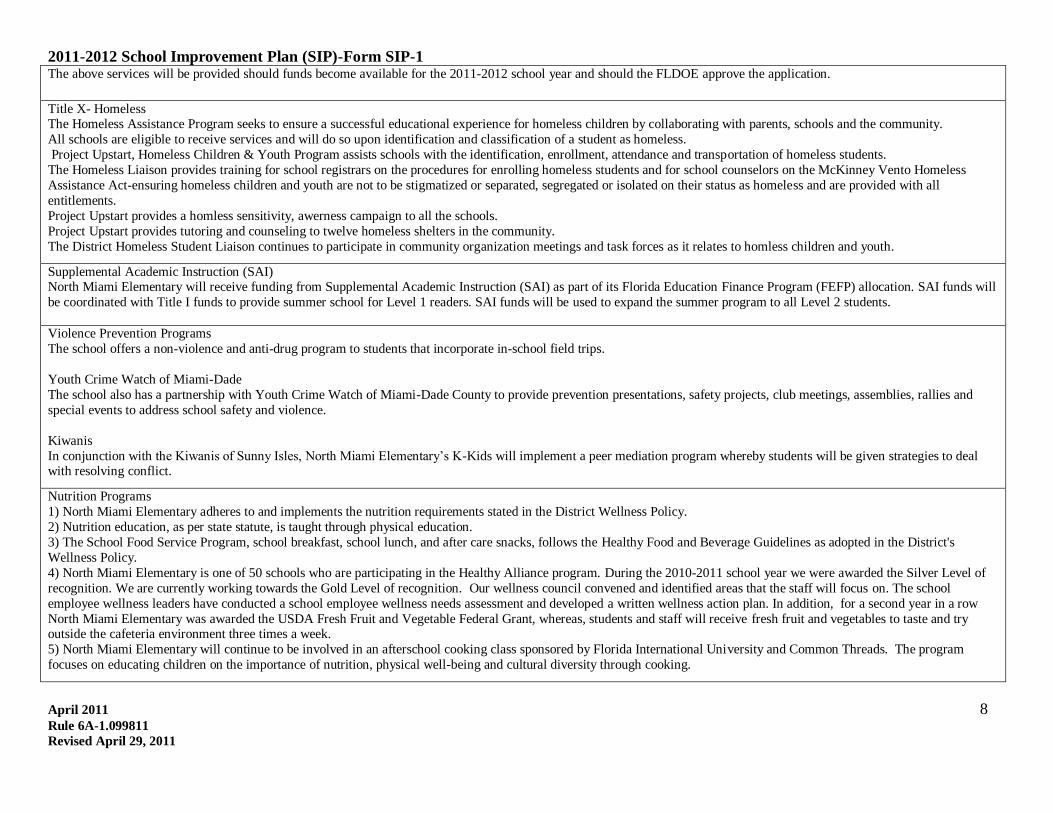
The above services will be provided should funds become available for the 2011-2012 school year and should the FLDOE approve the application.
Title X- Homeless The Homeless Assistance Program seeks to ensure a successful educational experience for homeless children by collaborating with parents, schools and the community.
All schools are eligible to receive services and will do so upon identification and classification of a student as homeless.
Project Upstart, Homeless Children & Youth Program assists schools with the identification, enrollment, attendance and transportation of homeless students.
The Homeless Liaison provides training for school registrars on the procedures for enrolling homeless students and for school counselors on the McKinney Vento Homeless
Assistance Act-ensuring homeless children and youth are not to be stigmatized or separated, segregated or isolated on their status as homeless and are provided with all
entitlements.
Project Upstart provides a homless sensitivity, awerness campaign to all the schools.
Project Upstart provides tutoring and counseling to twelve homeless shelters in the community.
The District Homeless Student Liaison continues to participate in community organization meetings and task forces as it relates to homless children and youth.
Supplemental Academic Instruction (SAI) North Miami Elementary will receive funding from Supplemental Academic Instruction (SAI) as part of its Florida Education Finance Program (FEFP) allocation. SAI funds will
be coordinated with Title I funds to provide summer school for Level 1 readers. SAI funds will be used to expand the summer program to all Level 2 students.
Violence Prevention Programs
The school offers a non-violence and anti-drug program to students that incorporate in-school field trips.
Youth Crime Watch of Miami-Dade
The school also has a partnership with Youth Crime Watch of Miami-Dade County to provide prevention presentations, safety projects, club meetings, assemblies, rallies and
special events to address school safety and violence.
Kiwanis
In conjunction with the Kiwanis of Sunny Isles, North Miami Elementary’s K-Kids will implement a peer mediation program whereby students will be given strategies to deal with resolving conflict.
Nutrition Programs
1) North Miami Elementary adheres to and implements the nutrition requirements stated in the District Wellness Policy.
2) Nutrition education, as per state statute, is taught through physical education.
3) The School Food Service Program, school breakfast, school lunch, and after care snacks, follows the Healthy Food and Beverage Guidelines as adopted in the District's
Wellness Policy.
4) North Miami Elementary is one of 50 schools who are participating in the Healthy Alliance program. During the 2010-2011 school year we were awarded the Silver Level of
recognition. We are currently working towards the Gold Level of recognition. Our wellness council convened and identified areas that the staff will focus on. The school
employee wellness leaders have conducted a school employee wellness needs assessment and developed a written wellness action plan. In addition, for a second year in a row
North Miami Elementary was awarded the USDA Fresh Fruit and Vegetable Federal Grant, whereas, students and staff will receive fresh fruit and vegetables to taste and try outside the cafeteria environment three times a week.
5) North Miami Elementary will continue to be involved in an afterschool cooking class sponsored by Florida International University and Common Threads. The program
focuses on educating children on the importance of nutrition, physical well-being and cultural diversity through cooking.
2011-2012 School Improvement Plan (SIP)-Form SIP-1
April 2011 9
Rule 6A-1.099811
Revised April 29, 2011
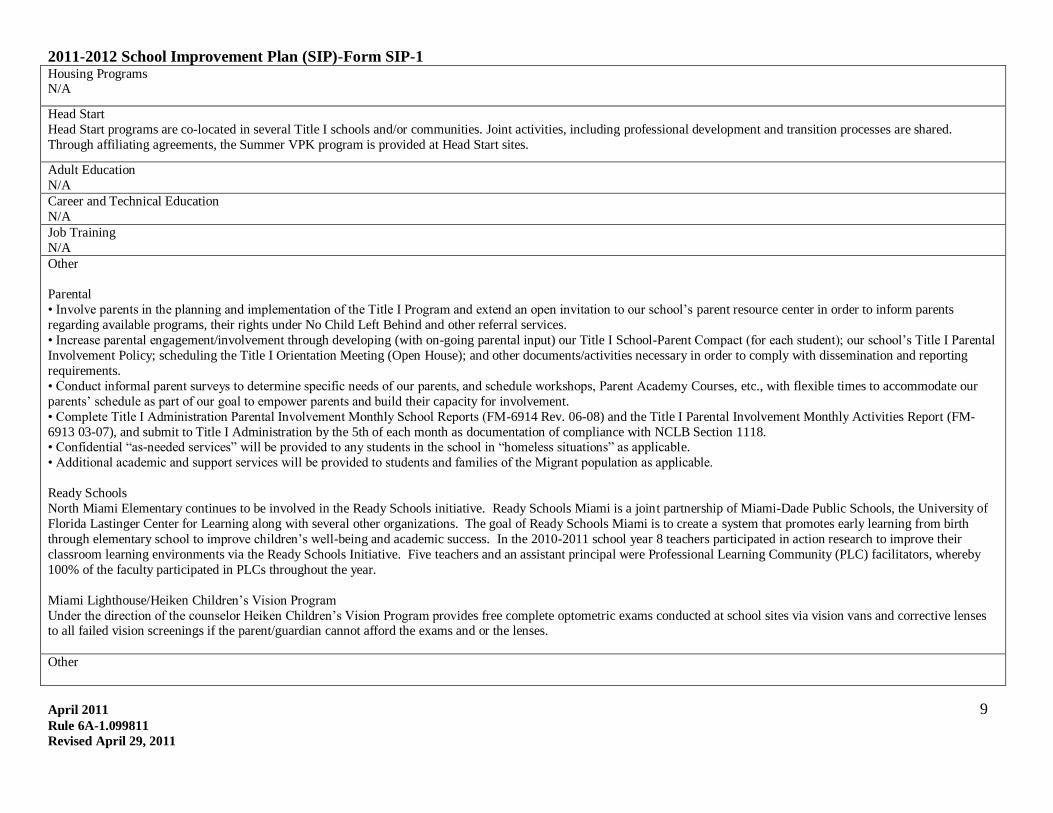
Housing Programs N/A
Head Start
Head Start programs are co-located in several Title I schools and/or communities. Joint activities, including professional development and transition processes are shared.
Through affiliating agreements, the Summer VPK program is provided at Head Start sites.
Adult Education
N/A
Career and Technical Education
N/A
Job Training
N/A
Other
Parental
• Involve parents in the planning and implementation of the Title I Program and extend an open invitation to our school’s parent resource center in order to inform parents
regarding available programs, their rights under No Child Left Behind and other referral services.
• Increase parental engagement/involvement through developing (with on-going parental input) our Title I School-Parent Compact (for each student); our school’s Title I Parental
Involvement Policy; scheduling the Title I Orientation Meeting (Open House); and other documents/activities necessary in order to comply with dissemination and reporting
requirements.
• Conduct informal parent surveys to determine specific needs of our parents, and schedule workshops, Parent Academy Courses, etc., with flexible times to accommodate our
parents’ schedule as part of our goal to empower parents and build their capacity for involvement.
• Complete Title I Administration Parental Involvement Monthly School Reports (FM-6914 Rev. 06-08) and the Title I Parental Involvement Monthly Activities Report (FM-
6913 03-07), and submit to Title I Administration by the 5th of each month as documentation of compliance with NCLB Section 1118. • Confidential “as-needed services” will be provided to any students in the school in “homeless situations” as applicable.
• Additional academic and support services will be provided to students and families of the Migrant population as applicable.
Ready Schools
North Miami Elementary continues to be involved in the Ready Schools initiative. Ready Schools Miami is a joint partnership of Miami-Dade Public Schools, the University of
Florida Lastinger Center for Learning along with several other organizations. The goal of Ready Schools Miami is to create a system that promotes early learning from birth
through elementary school to improve children’s well-being and academic success. In the 2010-2011 school year 8 teachers participated in action research to improve their
classroom learning environments via the Ready Schools Initiative. Five teachers and an assistant principal were Professional Learning Community (PLC) facilitators, whereby
100% of the faculty participated in PLCs throughout the year.
Miami Lighthouse/Heiken Children’s Vision Program
Under the direction of the counselor Heiken Children’s Vision Program provides free complete optometric exams conducted at school sites via vision vans and corrective lenses to all failed vision screenings if the parent/guardian cannot afford the exams and or the lenses.
Other

2011-2012 School Improvement Plan (SIP)-Form SIP-1
April 2011 10
Rule 6A-1.099811
Revised April 29, 2011
Response to Instruction/Intervention (RtI)
School-Based RtI Team
Identify the school-based RtI Leadership Team. RtI is an extension of the school’s Leadership Team, strategically integrated in order to support the administration through a process of problem solving as issues and concerns arise
through an ongoing, systematic examination of available data with the goal of impacting student achievement, school safety, school culture, literacy, attendance, student
social/emotional well being, and prevention of student failure through early intervention.
1. RtI leadership is vital, therefore, in building our team we have considered the following:
Administrator(s) who will ensure commitment and allocate resources;
Teacher(s) and Coaches who share the common goal of improving instruction for all students; and
Team members who will work to build staff support, internal capacity, and sustainability over time.
2. The school’s Leadership Team will include additional personnel as resources to the team, based on specific problems or concerns as warranted, such as: School reading, math, science, and behavior specialists
Special education personnel
School guidance counselor
School psychologist
School social worker
Member of advisory group
Community stakeholders
3. RtI is a general education initiative in which the levels of support (resources) are allocated in direct proportion to student needs. RtI uses increasingly more intense instruction and
interventions. The first level of support is the core instructional and behavioral methodologies, practices, and supports designed for all students in the general curriculum.
The second level of support consists of supplemental instruction and interventions that are provided in addition to and in alignment with effective core instruction and behavioral
supports to groups of targeted students who need additional instructional and/or behavioral support. The third level of support consists of intensive instructional and/or behavioral interventions provided in addition to and in alignment with effective core instruction and the
supplemental instruction and interventions with the goal of increasing an individual student’s rate of progress academically and/or behaviorally.
There will be an ongoing evaluation method established for services at each tier to monitor the effectiveness of meeting school goals and student growth as measured by benchmark
and progress monitoring data.
Describe how the school-based RtI Leadership Team functions (e.g., meeting processes and roles/functions). How does it work with other school teams to
organize/coordinate RtI efforts? The following steps will be considered by the school’s Leadership Team to address how we can utilize the RtI process to enhance data collection, data analysis, problem solving,
differentiated assistance, and progress monitoring.
2011-2012 School Improvement Plan (SIP)-Form SIP-1
April 2011 11
Rule 6A-1.099811
Revised April 29, 2011
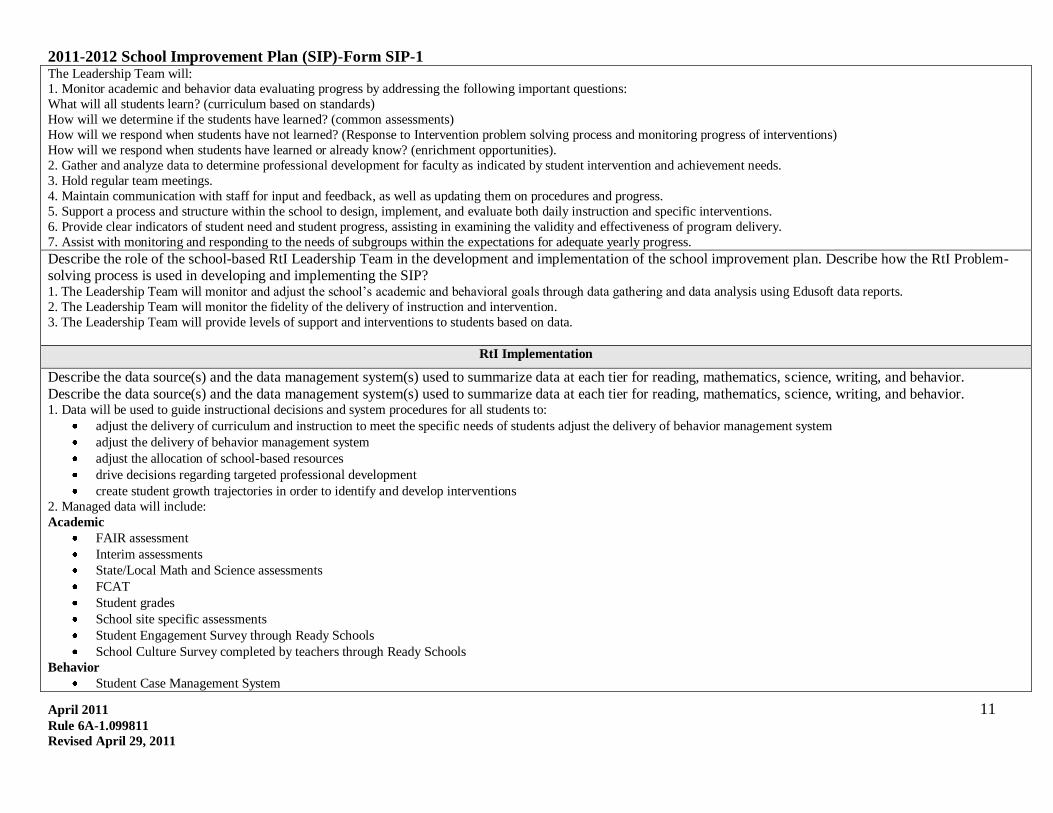
The Leadership Team will: 1. Monitor academic and behavior data evaluating progress by addressing the following important questions:
What will all students learn? (curriculum based on standards)
How will we determine if the students have learned? (common assessments)
How will we respond when students have not learned? (Response to Intervention problem solving process and monitoring progress of interventions)
How will we respond when students have learned or already know? (enrichment opportunities).
2. Gather and analyze data to determine professional development for faculty as indicated by student intervention and achievement needs.
3. Hold regular team meetings.
4. Maintain communication with staff for input and feedback, as well as updating them on procedures and progress.
5. Support a process and structure within the school to design, implement, and evaluate both daily instruction and specific interventions.
6. Provide clear indicators of student need and student progress, assisting in examining the validity and effectiveness of program delivery.
7. Assist with monitoring and responding to the needs of subgroups within the expectations for adequate yearly progress.
Describe the role of the school-based RtI Leadership Team in the development and implementation of the school improvement plan. Describe how the RtI Problem-solving process is used in developing and implementing the SIP? 1. The Leadership Team will monitor and adjust the school’s academic and behavioral goals through data gathering and data analysis using Edusoft data reports.
2. The Leadership Team will monitor the fidelity of the delivery of instruction and intervention.
3. The Leadership Team will provide levels of support and interventions to students based on data.
RtI Implementation
Describe the data source(s) and the data management system(s) used to summarize data at each tier for reading, mathematics, science, writing, and behavior.
Describe the data source(s) and the data management system(s) used to summarize data at each tier for reading, mathematics, science, writing, and behavior. 1. Data will be used to guide instructional decisions and system procedures for all students to:
adjust the delivery of curriculum and instruction to meet the specific needs of students adjust the delivery of behavior management system
adjust the delivery of behavior management system
adjust the allocation of school-based resources
drive decisions regarding targeted professional development
create student growth trajectories in order to identify and develop interventions
2. Managed data will include:
Academic
FAIR assessment
Interim assessments
State/Local Math and Science assessments
FCAT
Student grades
School site specific assessments
Student Engagement Survey through Ready Schools
School Culture Survey completed by teachers through Ready Schools
Behavior
Student Case Management System

2011-2012 School Improvement Plan (SIP)-Form SIP-1
April 2011 12
Rule 6A-1.099811
Revised April 29, 2011
Detentions
Suspensions/expulsions
Referrals by student behavior, staff behavior, and administrative context
Office referrals per day per month
Team climate surveys
Attendance Referrals to special education programs
Describe the plan to train staff on RtI. The district professional development and support will include:
1. training for all administrators in the RtI problem solving, data analysis process;
2. providing support for school staff to understand basic RtI principles and procedures; and
3. providing a network of ongoing support for RtI organized through feeder patterns.
Literacy Leadership Team (LLT)
School-Based Literacy Leadership Team
Identify the school-based Literacy Leadership Team (LLT). Debra Dubin-Principal, Josee Gregoire-Assistant Principal: Provides a common vision for the use of data-based decision-making, ensure that the school based team is implementing
RtI, conducts assessment of RtI, ensure implementation of intervention support and documentation, ensures adequate professional development to support RtI implementation, and
communicates with parents regarding school-based plans and activities.
Maureen Watson-Richards, Giovanni Clarke, Jean Makalusky-Rivero-Selected General Education Teachers: (primary and intermediate); Provides information about core instruction,
participates in school data collection, delivers Tier 1 instruction/intervention, collaborates with other staff to implement Tier 2 interventions, and integrates Tier 1 materials/instruction with Tier 2-3 activities.
Mary Sisley-Educational Excellence School Advisory Council (EESAC) Chairperson: Provides information to stakeholders; facilitates and supports data collection activities; assists in
data analysis to adhere to the School Improvement process.
Judith Wilensky-Instructional Coach Reading: Develops, monitors and evaluates school core content standards/programs; identifies and analyzes existing literature on scientifically
based curriculum/behavior assessment and intervention approaches, identifies systematic patterns of student need while working with district personnel to identify appropriate,
evidence-based intervention strategies; assists with whole school screening programs that provide early intervening services for children considered at risk, assists in the design and
implementation for progress monitoring, data collection, and data analysis; participates in the design and delivery of professional development; and provides support for assessment
and implementation monitoring.
Rebeca Valverde-Media Specialist; Participates in collection, interpretation, and analysis of data; facilitates development of intervention plans; provides support for intervention
fidelity and documentation; provides professional development and technical assistance for problem-solving activities including data collection, data analysis, intervention planning,
and program evaluation; facilitates data-based decision making activity. Jill Hyman-Student Services Personnel: Provides quality services and expertise on issues ranging from program design to assessment and intervention with individual students. In
addition to providing interventions, school social workers continue to link community and child-serving agencies to the schools and families to support the child’s academic,
emotional, behavioral, and social success.
Malisa Pierre-Community Involvement Specialist: Acts as a liaison between the school, home and community to promote educational support programs and provide an on-going
channel of communication for participants, parents and the community.

2011-2012 School Improvement Plan (SIP)-Form SIP-1
April 2011 13
Rule 6A-1.099811
Revised April 29, 2011
Describe how the school-based LLT functions (e.g., meeting processes and roles/functions). The following steps will be considered by the school’s Literacy Leadership Team to address how we can enhance the literacy at North Miami Elementary.
The Literacy Leadership Team will:
1. Monitor academic and behavior data evaluating progress by addressing the following important questions:
• What will all students learn? (curriculum based on standards)
• How will we determine if the students have learned? (common assessments)
• How will we respond when students have not learned? (Response to Intervention problem solving process and monitoring progress of interventions)
• How will we respond when students have learned or already know? (enrichment opportunities)
2. Gather and analyze data to determine professional development for faculty as indicated by student intervention and achievement needs.
3. Hold weekly team meetings. 4. Maintain communication with staff for input and feedback, as well as updating them on procedures and progress.
5. Support a process and structure within the school to design, implement, and evaluate both daily instruction and specific interventions.
6. Provide clear indicators of student need and student progress, assisting in examining the validity and effectiveness of program delivery.
7. Assist with monitoring and responding to the needs of subgroups within the expectations for adequate yearly progress.Describe how the school-based LLT functions (e.g.,
meeting processes and roles/functions).
What will be the major initiatives of the LLT this year? Monitoring the Comprehensive Reading Plan, Accelerated Reader program and other computerized technology programs used throughout the school
Provide necessary intervention groups
Review scope & sequence and provide assessments to measure ongoing student progress throughout the school year
Coaching direct support of teachers through modeling & instructional strategies
Scheduling an evening event inviting the community
Provide children with books to add to their home libraries with the participation of Reading Is Fundamental (RIF)
Give opportunities for parents to purchase books to develop home libraries through Book Fairs
NCLB Public School Choice
Notification of School in Need of Improvement (SINI) Status
Upload a copy of the Notification of SINI Status to Parents in the designated upload link on the “Upload” page.
Public School Choice with Transportation (CWT) Notification
Upload a copy of the CWT Notification to Parents in the designated upload link on the “Upload” page.
Supplemental Educational Services (SES) Notification
Upload a copy of the SES Notification to Parents in the designated upload link on the “Upload” page.
*Elementary Title I Schools Only: Pre-School Transition
2011-2012 School Improvement Plan (SIP)-Form SIP-1
April 2011 14
Rule 6A-1.099811
Revised April 29, 2011
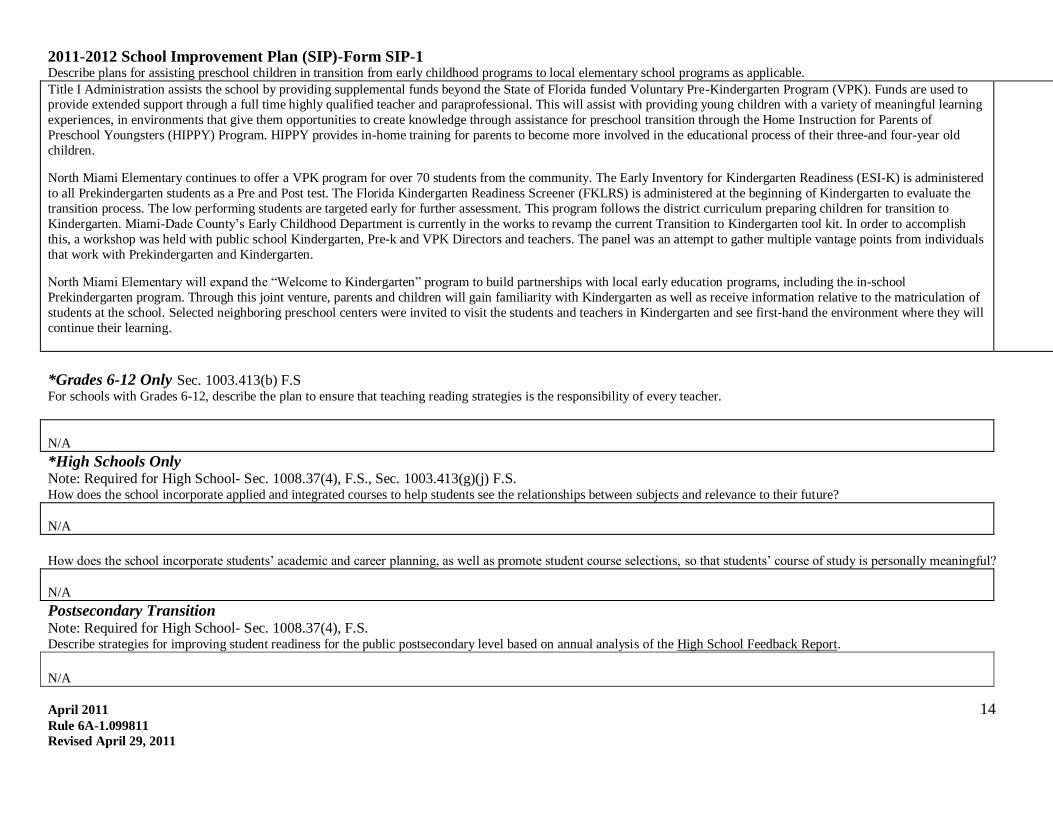
Describe plans for assisting preschool children in transition from early childhood programs to local elementary school programs as applicable.
Title I Administration assists the school by providing supplemental funds beyond the State of Florida funded Voluntary Pre-Kindergarten Program (VPK). Funds are used to provide extended support through a full time highly qualified teacher and paraprofessional. This will assist with providing young children with a variety of meaningful learning
experiences, in environments that give them opportunities to create knowledge through assistance for preschool transition through the Home Instruction for Parents of
Preschool Youngsters (HIPPY) Program. HIPPY provides in-home training for parents to become more involved in the educational process of their three-and four-year old
children.
North Miami Elementary continues to offer a VPK program for over 70 students from the community. The Early Inventory for Kindergarten Readiness (ESI-K) is administered
to all Prekindergarten students as a Pre and Post test. The Florida Kindergarten Readiness Screener (FKLRS) is administered at the beginning of Kindergarten to evaluate the
transition process. The low performing students are targeted early for further assessment. This program follows the district curriculum preparing children for transition to
Kindergarten. Miami-Dade County’s Early Childhood Department is currently in the works to revamp the current Transition to Kindergarten tool kit. In order to accomplish
this, a workshop was held with public school Kindergarten, Pre-k and VPK Directors and teachers. The panel was an attempt to gather multiple vantage points from individuals
that work with Prekindergarten and Kindergarten.
North Miami Elementary will expand the “Welcome to Kindergarten” program to build partnerships with local early education programs, including the in-school
Prekindergarten program. Through this joint venture, parents and children will gain familiarity with Kindergarten as well as receive information relative to the matriculation of
students at the school. Selected neighboring preschool centers were invited to visit the students and teachers in Kindergarten and see first-hand the environment where they will
continue their learning.
*Grades 6-12 Only Sec. 1003.413(b) F.S For schools with Grades 6-12, describe the plan to ensure that teaching reading strategies is the responsibility of every teacher.
N/A
*High Schools Only Note: Required for High School- Sec. 1008.37(4), F.S., Sec. 1003.413(g)(j) F.S. How does the school incorporate applied and integrated courses to help students see the relationships between subjects and relevance to their future?
N/A
How does the school incorporate students’ academic and career planning, as well as promote student course selections, so that students’ course of study is personally meaningful?
N/A
Postsecondary Transition Note: Required for High School- Sec. 1008.37(4), F.S. Describe strategies for improving student readiness for the public postsecondary level based on annual analysis of the High School Feedback Report.
N/A
2011-2012 School Improvement Plan (SIP)-Form SIP-1
April 2011 15
Rule 6A-1.099811
Revised April 29, 2011
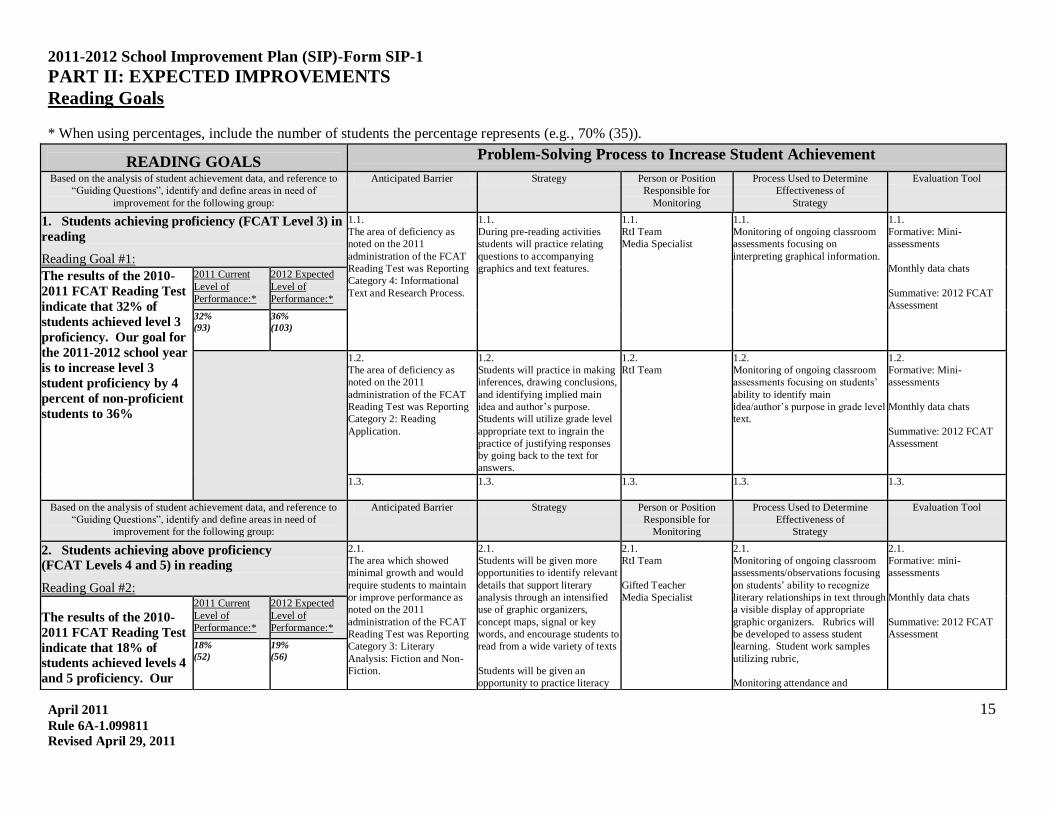
PART II: EXPECTED IMPROVEMENTS
Reading Goals * When using percentages, include the number of students the percentage represents (e.g., 70% (35)).
READING GOALS Problem-Solving Process to Increase Student Achievement
Based on the analysis of student achievement data, and reference to
“Guiding Questions”, identify and define areas in need of
improvement for the following group:
Anticipated Barrier Strategy Person or Position
Responsible for
Monitoring
Process Used to Determine
Effectiveness of
Strategy
Evaluation Tool
1. Students achieving proficiency (FCAT Level 3) in
reading
Reading Goal #1:
1.1.
The area of deficiency as
noted on the 2011
administration of the FCAT
Reading Test was Reporting
Category 4: Informational
Text and Research Process.
1.1.
During pre-reading activities
students will practice relating
questions to accompanying
graphics and text features.
1.1.
RtI Team
Media Specialist
1.1.
Monitoring of ongoing classroom
assessments focusing on
interpreting graphical information.
1.1.
Formative: Mini-
assessments
Monthly data chats
Summative: 2012 FCAT
Assessment
The results of the 2010-
2011 FCAT Reading Test
indicate that 32% of
students achieved level 3
proficiency. Our goal for
the 2011-2012 school year
is to increase level 3
student proficiency by 4
percent of non-proficient
students to 36%
2011 Current
Level of
Performance:*
2012 Expected
Level of
Performance:*
32%
(93)
36%
(103)
1.2.
The area of deficiency as
noted on the 2011
administration of the FCAT
Reading Test was Reporting
Category 2: Reading
Application.
1.2.
Students will practice in making
inferences, drawing conclusions,
and identifying implied main
idea and author’s purpose.
Students will utilize grade level
appropriate text to ingrain the
practice of justifying responses
by going back to the text for
answers.
1.2.
RtI Team
1.2.
Monitoring of ongoing classroom
assessments focusing on students’
ability to identify main
idea/author’s purpose in grade level
text.
1.2.
Formative: Mini-
assessments
Monthly data chats
Summative: 2012 FCAT
Assessment
1.3.
1.3. 1.3. 1.3. 1.3.
Based on the analysis of student achievement data, and reference to
“Guiding Questions”, identify and define areas in need of
improvement for the following group:
Anticipated Barrier Strategy Person or Position
Responsible for
Monitoring
Process Used to Determine
Effectiveness of
Strategy
Evaluation Tool
2. Students achieving above proficiency
(FCAT Levels 4 and 5) in reading
Reading Goal #2:
2.1.
The area which showed
minimal growth and would
require students to maintain
or improve performance as
noted on the 2011
administration of the FCAT
Reading Test was Reporting
Category 3: Literary
Analysis: Fiction and Non-
Fiction.
2.1.
Students will be given more
opportunities to identify relevant
details that support literary
analysis through an intensified
use of graphic organizers,
concept maps, signal or key
words, and encourage students to
read from a wide variety of texts
Students will be given an
opportunity to practice literacy
2.1.
RtI Team
Gifted Teacher
Media Specialist
2.1.
Monitoring of ongoing classroom
assessments/observations focusing
on students’ ability to recognize
literary relationships in text through
a visible display of appropriate
graphic organizers. Rubrics will
be developed to assess student
learning. Student work samples
utilizing rubric,
Monitoring attendance and
2.1.
Formative: mini-
assessments
Monthly data chats
Summative: 2012 FCAT
Assessment
The results of the 2010-
2011 FCAT Reading Test
indicate that 18% of
students achieved levels 4
and 5 proficiency. Our
2011 Current
Level of
Performance:*
2012 Expected
Level of
Performance:*
18%
(52)
19%
(56)
2011-2012 School Improvement Plan (SIP)-Form SIP-1
April 2011 16
Rule 6A-1.099811
Revised April 29, 2011
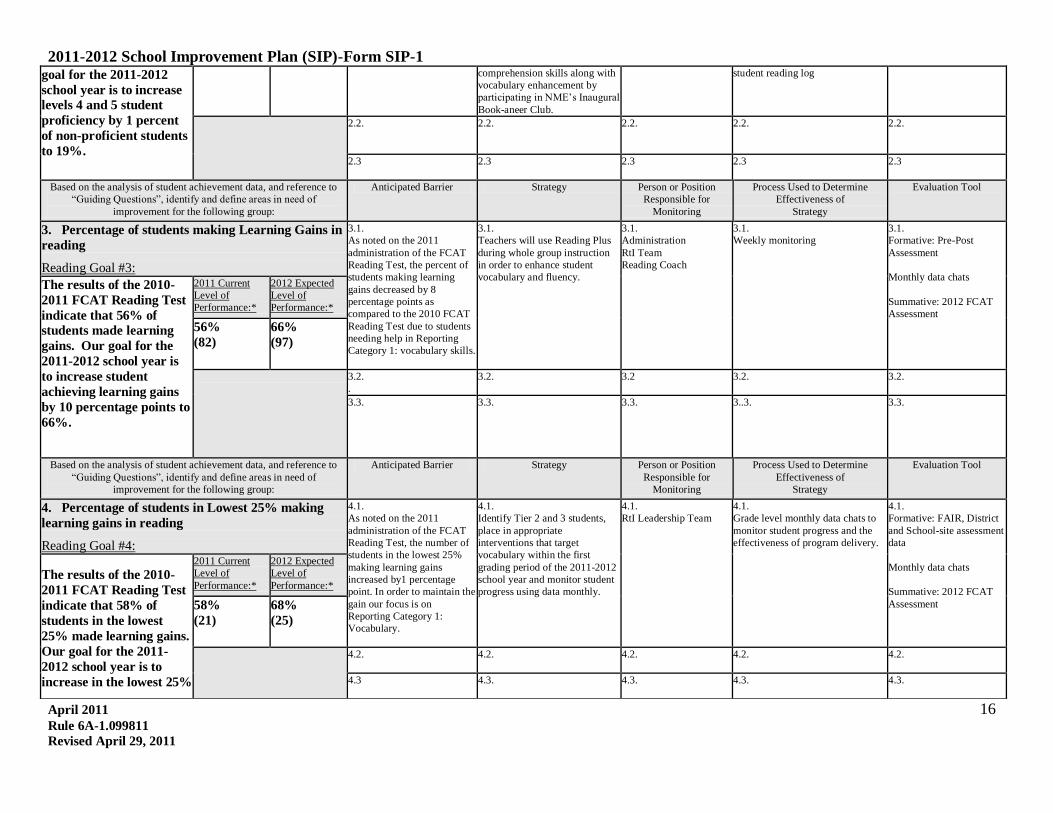
goal for the 2011-2012
school year is to increase
levels 4 and 5 student
proficiency by 1 percent
of non-proficient students
to 19%.
comprehension skills along with
vocabulary enhancement by
participating in NME’s Inaugural
Book-aneer Club.
student reading log
2.2.
2.2.
2.2.
2.2.
2.2.
2.3
2.3 2.3 2.3 2.3
Based on the analysis of student achievement data, and reference to
“Guiding Questions”, identify and define areas in need of
improvement for the following group:
Anticipated Barrier Strategy Person or Position
Responsible for
Monitoring
Process Used to Determine
Effectiveness of
Strategy
Evaluation Tool
3. Percentage of students making Learning Gains in
reading
Reading Goal #3:
3.1.
As noted on the 2011
administration of the FCAT
Reading Test, the percent of
students making learning
gains decreased by 8
percentage points as
compared to the 2010 FCAT
Reading Test due to students
needing help in Reporting
Category 1: vocabulary skills.
3.1.
Teachers will use Reading Plus
during whole group instruction
in order to enhance student
vocabulary and fluency.
3.1.
Administration
RtI Team
Reading Coach
3.1.
Weekly monitoring 3.1.
Formative: Pre-Post
Assessment
Monthly data chats
Summative: 2012 FCAT
Assessment
The results of the 2010-
2011 FCAT Reading Test
indicate that 56% of
students made learning
gains. Our goal for the
2011-2012 school year is
to increase student
achieving learning gains
by 10 percentage points to
66%.
2011 Current
Level of
Performance:*
2012 Expected
Level of
Performance:*
56%
(82)
66%
(97)
3.2.
.
3.2.
3.2
3.2. 3.2.
3.3. 3.3. 3.3. 3..3. 3.3.
Based on the analysis of student achievement data, and reference to
“Guiding Questions”, identify and define areas in need of
improvement for the following group:
Anticipated Barrier Strategy Person or Position
Responsible for
Monitoring
Process Used to Determine
Effectiveness of
Strategy
Evaluation Tool
4. Percentage of students in Lowest 25% making
learning gains in reading
Reading Goal #4:
4.1.
As noted on the 2011
administration of the FCAT
Reading Test, the number of
students in the lowest 25%
making learning gains
increased by1 percentage
point. In order to maintain the
gain our focus is on
Reporting Category 1:
Vocabulary.
4.1.
Identify Tier 2 and 3 students,
place in appropriate
interventions that target
vocabulary within the first
grading period of the 2011-2012
school year and monitor student
progress using data monthly.
4.1.
RtI Leadership Team
4.1.
Grade level monthly data chats to
monitor student progress and the
effectiveness of program delivery.
4.1.
Formative: FAIR, District
and School-site assessment
data
Monthly data chats
Summative: 2012 FCAT
Assessment
The results of the 2010-
2011 FCAT Reading Test
indicate that 58% of
students in the lowest
25% made learning gains.
Our goal for the 2011-
2012 school year is to
increase in the lowest 25%
2011 Current
Level of
Performance:*
2012 Expected
Level of
Performance:*
58%
(21)
68%
(25)
4.2.
4.2. 4.2. 4.2. 4.2.
4.3
4.3. 4.3. 4.3. 4.3.

2011-2012 School Improvement Plan (SIP)-Form SIP-1
April 2011 17
Rule 6A-1.099811
Revised April 29, 2011
achieving learning gains
by 10 percentage points to
68%.
Based on the analysis of student achievement data, and reference to
“Guiding Questions”, identify and define areas in need of
improvement for the applicable subgroup(s):
Anticipated Barrier Strategy Person or Position
Responsible for
Monitoring
Process Used to Determine
Effectiveness of
Strategy
Evaluation Tool
5A. Student subgroups
not making Adequate
Yearly Progress (AYP) in
reading
Reading Goal #5A:
Reading Goal #5A:
Ethnicity (White, Black, Hispanic, Asian,
American Indian)
5A.1.
Black: As noted on the
administration of the 2011
FCAT Reading Test, the
Black subgroup did not make
AYP due to students needing
help in prerequisite skills in
Reporting Category 4:
Informational Text.
5A.1.
Students will read Scholastic
News articles during
differentiated instruction to
reinforce informational skills.
5A.1.
Reading Coach
Administration
LLT
5A.1.
Lesson plans will reflect small
group differentiated instruction
activities along with displayed
student work samples reviewed
during classroom walkthroughs
Students will develop
comprehension questions utilizing
the FCAT task cards.
5A.1.
Formative: District and
School-site assessment
data, intervention
assessments
Monthly data chats
Summative: 2012 FCAT
Assessment The results of the 2010-
2011 FCAT Reading Test
indicates that 53% of
students in the Black
subgroup did not achieve
proficiency.
Our goal is to increase
student proficiency by 5
percent of non-proficient
students to 58%.
2011 Current
Level of
Performance:*
2012 Expected
Level of
Performance:*
Black: 53%
(128)
Black: 58%
(140)
:
5A.2.
5A.2. 5A.2.
5A.2. 5A.2.
5A.3. 5A.3. 5A.3. 5A.3. 5A.3.
Based on the analysis of student achievement data, and reference to
“Guiding Questions”, identify and define areas in need of
improvement for the following subgroup:
Anticipated Barrier Strategy Person or Position
Responsible for
Monitoring
Process Used to Determine
Effectiveness of
Strategy
Evaluation Tool
5B. Student subgroups
not making Adequate
Yearly Progress (AYP) in
reading
Reading Goal #5B:
Reading Goal #5B:
English Language
Learners (ELL)
5B.1.
As noted on the 2011
administration of the FCAT
Reading Test, the number of
students in the ELL subgroup
did not make AYP due to
students needing help in
Reporting Category 1:
Vocabulary
5B.1.
Implement tutoring utilizing
technology and additional
supplemental materials as
needed with special emphasis on
improving vocabulary and
reading comprehension skills..
5B.1.
Administration
5B.1.
Attendance logs
Review bi-weekly technology data
reports to ensure progress is being
made and adjust intervention as
needed
5B.1.
Formative bi-weekly
assessment/data reports
Monthly data chats
Summative: 2012 FCAT
Assessment The results of the 2010-
2011 FCAT Reading Test
indicates that 47% of
students in the English
Language Learners
subgroup did not achieve
2011 Current
Level of
Performance:*
2012 Expected
Level of
Performance:*
47%
(71)
52%
(79)
5B.2. 5B.2. 5B.2. 5B.2. 5B.2.
2011-2012 School Improvement Plan (SIP)-Form SIP-1
April 2011 18
Rule 6A-1.099811
Revised April 29, 2011
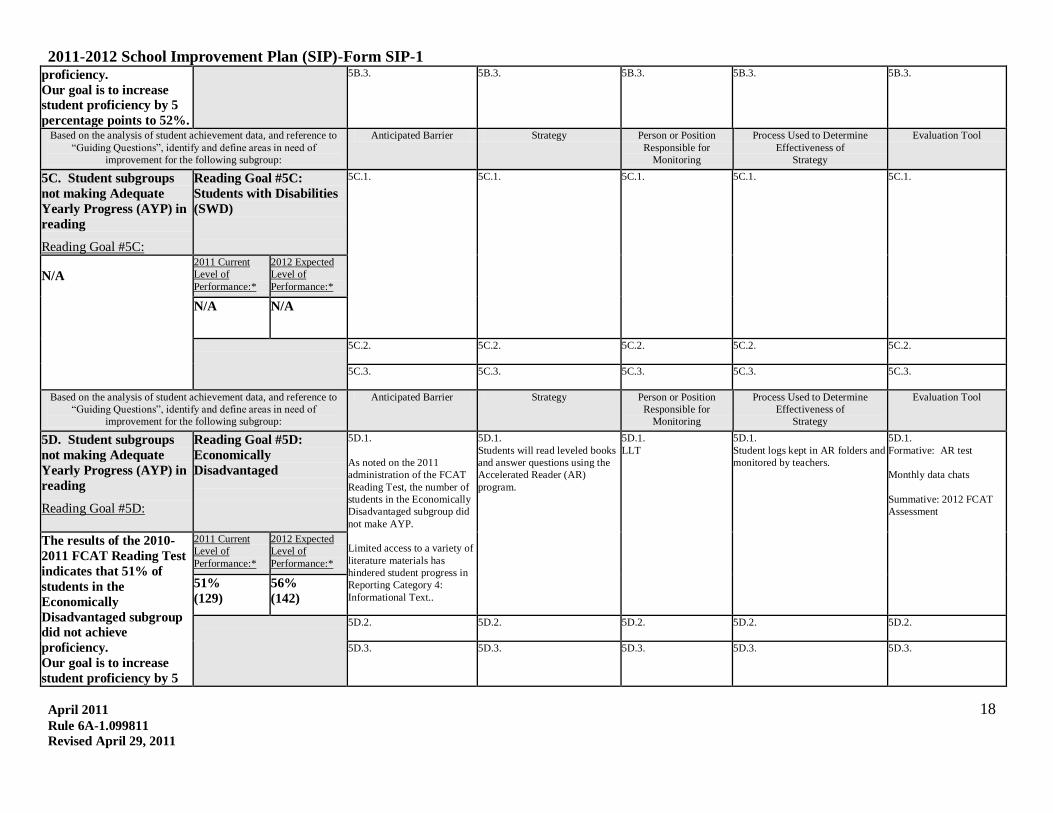
proficiency.
Our goal is to increase
student proficiency by 5
percentage points to 52%.
5B.3. 5B.3. 5B.3. 5B.3. 5B.3.
Based on the analysis of student achievement data, and reference to
“Guiding Questions”, identify and define areas in need of
improvement for the following subgroup:
Anticipated Barrier Strategy Person or Position
Responsible for
Monitoring
Process Used to Determine
Effectiveness of
Strategy
Evaluation Tool
5C. Student subgroups
not making Adequate
Yearly Progress (AYP) in
reading
Reading Goal #5C:
Reading Goal #5C:
Students with Disabilities
(SWD)
5C.1.
5C.1. 5C.1. 5C.1. 5C.1.
N/A
2011 Current
Level of
Performance:*
2012 Expected
Level of
Performance:*
N/A N/A
5C.2.
5C.2. 5C.2. 5C.2. 5C.2.
5C.3.
5C.3. 5C.3. 5C.3. 5C.3.
Based on the analysis of student achievement data, and reference to
“Guiding Questions”, identify and define areas in need of
improvement for the following subgroup:
Anticipated Barrier Strategy Person or Position
Responsible for
Monitoring
Process Used to Determine
Effectiveness of
Strategy
Evaluation Tool
5D. Student subgroups
not making Adequate
Yearly Progress (AYP) in
reading
Reading Goal #5D:
Reading Goal #5D:
Economically
Disadvantaged
5D.1.
As noted on the 2011
administration of the FCAT
Reading Test, the number of
students in the Economically
Disadvantaged subgroup did
not make AYP.
Limited access to a variety of
literature materials has
hindered student progress in
Reporting Category 4:
Informational Text..
5D.1.
Students will read leveled books
and answer questions using the
Accelerated Reader (AR)
program.
5D.1.
LLT
5D.1.
Student logs kept in AR folders and
monitored by teachers.
5D.1.
Formative: AR test
Monthly data chats
Summative: 2012 FCAT
Assessment
The results of the 2010-
2011 FCAT Reading Test
indicates that 51% of
students in the
Economically
Disadvantaged subgroup
did not achieve
proficiency.
Our goal is to increase
student proficiency by 5
2011 Current
Level of
Performance:*
2012 Expected
Level of
Performance:*
51%
(129)
56%
(142)
5D.2. 5D.2. 5D.2.
5D.2. 5D.2.
5D.3.
5D.3. 5D.3. 5D.3. 5D.3.
2011-2012 School Improvement Plan (SIP)-Form SIP-1
April 2011 19
Rule 6A-1.099811
Revised April 29, 2011
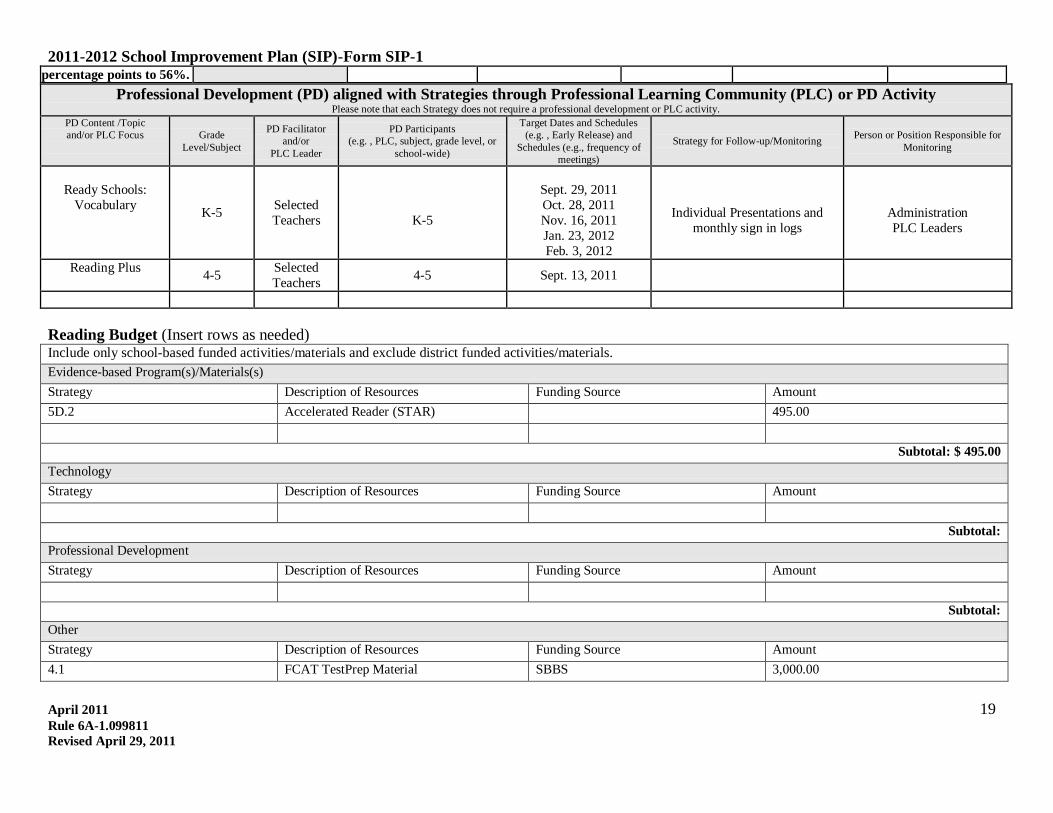
Professional Development (PD) aligned with Strategies through Professional Learning Community (PLC) or PD Activity Please note that each Strategy does not require a professional development or PLC activity.
PD Content /Topic
and/or PLC Focus
Grade
Level/Subject
PD Facilitator
and/or
PLC Leader
PD Participants
(e.g. , PLC, subject, grade level, or
school-wide)
Target Dates and Schedules
(e.g. , Early Release) and
Schedules (e.g., frequency of
meetings)
Strategy for Follow-up/Monitoring Person or Position Responsible for
Monitoring
Ready Schools:
Vocabulary K-5
Selected
Teachers
K-5
Sept. 29, 2011
Oct. 28, 2011
Nov. 16, 2011
Jan. 23, 2012
Feb. 3, 2012
Individual Presentations and
monthly sign in logs
Administration
PLC Leaders
Reading Plus 4-5
Selected
Teachers 4-5 Sept. 13, 2011
Reading Budget (Insert rows as needed) Include only school-based funded activities/materials and exclude district funded activities/materials.
Evidence-based Program(s)/Materials(s)
Strategy Description of Resources Funding Source Amount
5D.2 Accelerated Reader (STAR) 495.00
Subtotal: $ 495.00
Technology
Strategy Description of Resources Funding Source Amount
Subtotal:
Professional Development
Strategy Description of Resources Funding Source Amount
Subtotal:
Other
Strategy Description of Resources Funding Source Amount
4.1 FCAT TestPrep Material SBBS 3,000.00
percentage points to 56%.
2011-2012 School Improvement Plan (SIP)-Form SIP-1
April 2011 20
Rule 6A-1.099811
Revised April 29, 2011
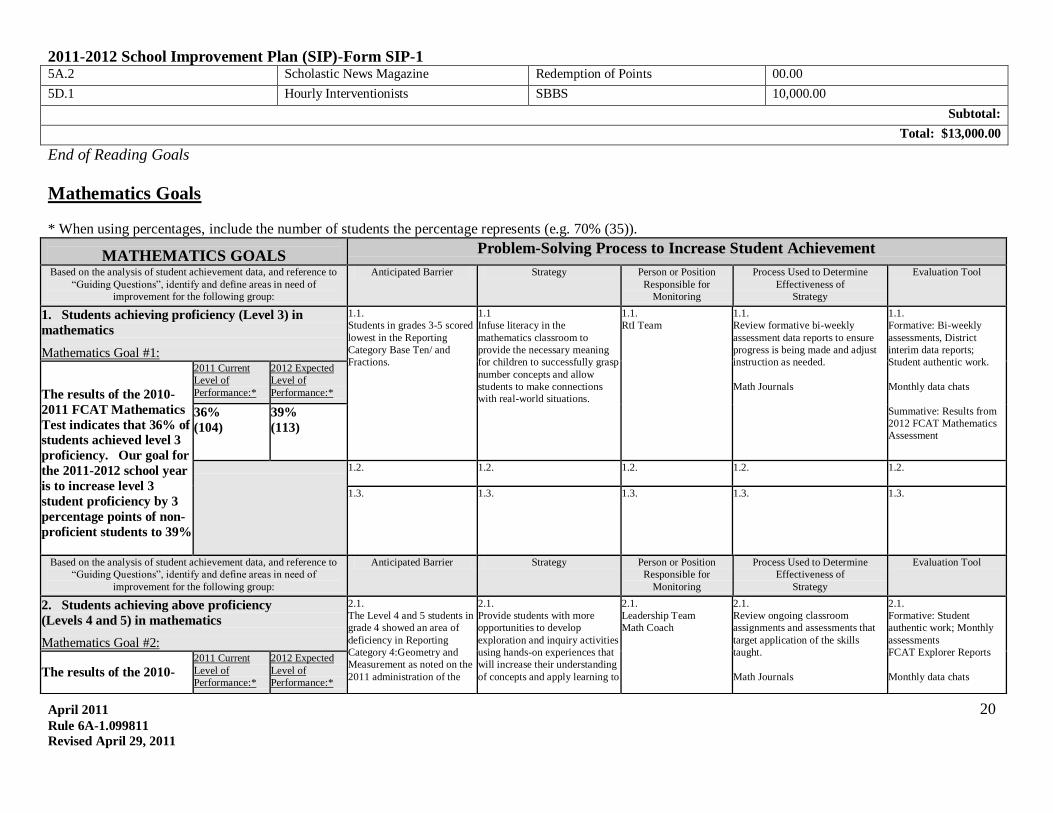
5A.2 Scholastic News Magazine Redemption of Points 00.00
5D.1 Hourly Interventionists SBBS 10,000.00
Subtotal:
Total: $13,000.00
End of Reading Goals
Mathematics Goals
* When using percentages, include the number of students the percentage represents (e.g. 70% (35)).
MATHEMATICS GOALS Problem-Solving Process to Increase Student Achievement
Based on the analysis of student achievement data, and reference to
“Guiding Questions”, identify and define areas in need of
improvement for the following group:
Anticipated Barrier Strategy Person or Position
Responsible for
Monitoring
Process Used to Determine
Effectiveness of
Strategy
Evaluation Tool
1. Students achieving proficiency (Level 3) in
mathematics
Mathematics Goal #1:
1.1.
Students in grades 3-5 scored
lowest in the Reporting
Category Base Ten/ and
Fractions.
1.1
Infuse literacy in the
mathematics classroom to
provide the necessary meaning
for children to successfully grasp
number concepts and allow
students to make connections
with real-world situations.
1.1.
RtI Team 1.1.
Review formative bi-weekly
assessment data reports to ensure
progress is being made and adjust
instruction as needed.
Math Journals
1.1.
Formative: Bi-weekly
assessments, District
interim data reports;
Student authentic work.
Monthly data chats
Summative: Results from
2012 FCAT Mathematics
Assessment
The results of the 2010-
2011 FCAT Mathematics
Test indicates that 36% of
students achieved level 3
proficiency. Our goal for
the 2011-2012 school year
is to increase level 3
student proficiency by 3
percentage points of non-
proficient students to 39%
2011 Current
Level of
Performance:*
2012 Expected
Level of
Performance:*
36%
(104)
39%
(113)
1.2.
1.2. 1.2. 1.2. 1.2.
1.3. 1.3. 1.3. 1.3. 1.3.
Based on the analysis of student achievement data, and reference to
“Guiding Questions”, identify and define areas in need of
improvement for the following group:
Anticipated Barrier Strategy Person or Position
Responsible for
Monitoring
Process Used to Determine
Effectiveness of
Strategy
Evaluation Tool
2. Students achieving above proficiency
(Levels 4 and 5) in mathematics
Mathematics Goal #2:
2.1.
The Level 4 and 5 students in
grade 4 showed an area of
deficiency in Reporting
Category 4:Geometry and
Measurement as noted on the
2011 administration of the
2.1.
Provide students with more
opportunities to develop
exploration and inquiry activities
using hands-on experiences that
will increase their understanding
of concepts and apply learning to
2.1.
Leadership Team
Math Coach
2.1.
Review ongoing classroom
assignments and assessments that
target application of the skills
taught.
Math Journals
2.1.
Formative: Student
authentic work; Monthly
assessments
FCAT Explorer Reports
Monthly data chats
The results of the 2010-
2011 Current
Level of
Performance:*
2012 Expected
Level of
Performance:*

2011-2012 School Improvement Plan (SIP)-Form SIP-1
April 2011 21
Rule 6A-1.099811
Revised April 29, 2011
2011 FCAT Mathematics
Test indicate that 21% of
students achieved levels 4
and 5 proficiency. Our
goal for the 2011-2012
school year is to increase
levels 4 and 5 student
proficiency by 1
percentage point of non-
proficient students to 22%
21%
(61)
22%
(65)
FCAT Mathematics Test.
The deficiency is due to
limited classroom
opportunities to develop
exploration and inquiry
activities.
solve real-life problems.
Utilize FCAT Explorer to expose
students to exploration and
inquiry activities.
On-going review of FCAT
Explorer data
Summative: Results from
2012 FCAT Mathematics
Assessment
2.2. 2.2. 2.2. 2.2. 2.2.
2.3
2.3 2.3 2.3 2.3
Based on the analysis of student achievement data, and reference to
“Guiding Questions”, identify and define areas in need of
improvement for the following group:
Anticipated Barrier Strategy Person or Position
Responsible for
Monitoring
Process Used to Determine
Effectiveness of
Strategy
Evaluation Tool
3. Percentage of students making learning gains in
mathematics (excluding 9th
grade; learning gains will
not be available for this grade)
Mathematics Goal #3:
3.1.
As noted on the 2011
administration of the FCAT
Mathematics Test, the percent
of students making learning
gains decreased by 12
percentage points as
compared to the 2010 FCAT
Mathematics Test due to a
deficiency in Reporting
Category 1: Number Sense.
Applying mathematical
theory to practical
applications has been an
obstacle.
3.1.
Student math journals will be
utilized to show transfer of
mathematical theory to practical
applications.
3.1
RtI Team
Math Coach
3.1.
Review formative bi-weekly
assessment data reports to adjust
instruction as needed to ensure
progress is being made and students
are making learning gains.
Conduct grade level discussions
and data chats to attain teacher
feedback and effectiveness of
strategy.
3.1.
Formative: Bi-weekly
assessments; Student
generated work in math
journals
Monthly data chats
Summative: Results from
2012 FCAT Mathematics
Assessment
The results of the 2010-
2011 FCAT Mathematics
Test indicate that 51% of
students made learning
gains. Our goal for the
2011-2012 school year is
to provide appropriate
interventions, remediation
and enrichment
opportunities in order to
increase the percentage of
students making learning
gains by 10 percentage
points to 61%.
2011 Current
Level of
Performance:*
2012Expected
Level of
Performance:*
51%
(75)
61%
(90)
3.2.
3.2. 3.2. 3.2. 3.2.
3.3.
3.3. 3.3. 3..3. 3.3.
Based on the analysis of student achievement data, and reference to
“Guiding Questions”, identify and define areas in need of
improvement for the following group:
Anticipated Barrier Strategy Person or Position
Responsible for
Monitoring
Process Used to Determine
Effectiveness of
Strategy
Evaluation Tool
4. Percentage of students in Lowest 25% making
learning gains in mathematics
Mathematics Goal #4:
4.1.
As noted on the 2010
administration of the FCAT
Mathematics Test, the
4.1.
Identify Tier 2 and 3 students,
place in appropriate
interventions (pull-out,/push-in)
4.1.
Administration
RtI Team
Math Coach
4.1.
Grade level monthly data chats to
monitor student progress and the
effectiveness of program delivery.
4.1.
Formative: Bi-weekly
assessment data reports;
Intervention assessments

2011-2012 School Improvement Plan (SIP)-Form SIP-1
April 2011 22
Rule 6A-1.099811
Revised April 29, 2011
The results of the 2010-
2011 FCAT Mathematics
Test indicate that 56% of
students in the lowest
25% made learning gains.
Our goal for the 2011-
2012 school year is to
increase the percent of
students in the lowest
25% making learning
gains by 10 percentage
points to 66%.
2011 Current
Level of
Performance:*
2012 Expected
Level of
Performance:*
number of students in the
lowest 25% making learning
gains decreased by 16
percentage points due to
deficiency in Reporting
Category 3: Geometry and
Measurement.
Appropriate and timely
placement of students in
intervention has been an
obstacle.
within the first grading period of
the 2011-2012 school year and
monitor student progress using
data monthly.
.
Monthly data chats
Summative: Results from
2012 FCAT Mathematics
Assessment 56%
(21)
66%
(24)
4.2.
4.2. 4.2. 4.2. 4.2.
4.3.
4.3. 4.3. 4.3. 4.3.
Based on the analysis of student achievement data, and reference to
“Guiding Questions”, identify and define areas in need of
improvement for the applicable subgroup(s):
Anticipated Barrier Strategy Person or Position
Responsible for
Monitoring
Process Used to Determine
Effectiveness of
Strategy
Evaluation Tool
5A. Student subgroups
not making Adequate
Yearly Progress (AYP) in
mathematics
Mathematics Goal #5A:
Mathematics Goal #5A:
Ethnicity (White, Black, Hispanic, Asian,
American Indian)
5A.1.
Black: As noted on the 2011
administration of the FCAT
Mathematics test the students
in the Black subgroup did not
achieve proficiency due to
deficiency in Reporting
Category 3: Geometry and
Measurement.
The deficiency is due to the
students’ inability to utilize
higher order thinking
strategies and the increased
cognitive complexity of the
content.
5A.1.
Through the formation of
Professional Learning
Communities, teachers will share
best practices with a focus on
increasing the use of higher
order thinking strategies and the
cognitive complexity in teaching
mathematics as evident in
instructional plans.
5A.1.
PLC Facilitators
5A.1.
Participation records
Classroom walkthroughs ,
lesson plan reviews
5A.1
Formative: Classroom
walkthroughs and lesson
plan reviews
Monthly data chats
Summative: Results from
2012 FCAT Mathematics
Assessment.
The results of the 2010-
2011 FCAT Mathematics
Test indicates that 60% of
students in the Black
subgroup did not achieve
proficiency.
Our goal is to increase
student proficiency by 4
percentage points to 64%.
2011 Current
Level of
Performance:*
2012 Expected
Level of
Performance:*
Black: 60%
(145)
Black: 64%
(154)
:
5A.2. 5A.2. 5A.2. 5A.2. 5A.2.
5A.3. 5A.3. 5A.3. 5A.3. 5A.3.
Based on the analysis of student achievement data, and reference to
“Guiding Questions”, identify and define areas in need of
improvement for the following subgroup:
Anticipated Barrier Strategy Person or Position
Responsible for
Monitoring
Process Used to Determine
Effectiveness of
Strategy
Evaluation Tool
5B. Student subgroups
not making Adequate
Yearly Progress (AYP) in
mathematics
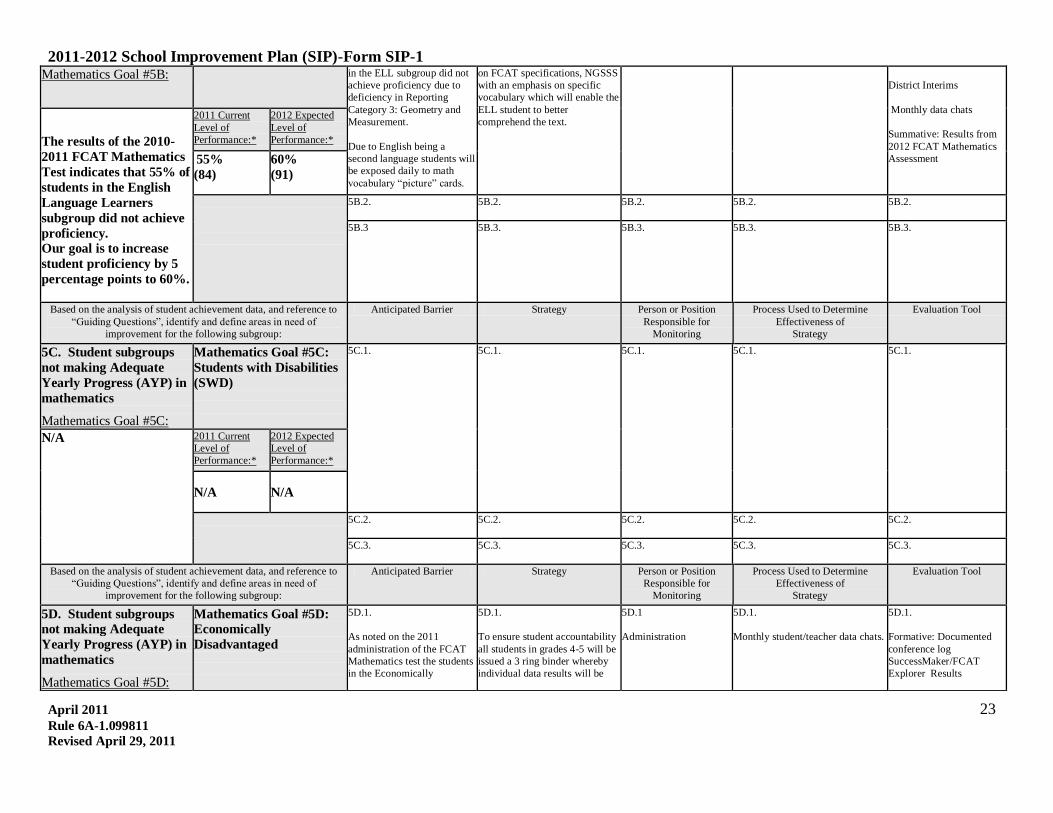
Mathematics Goal #5B:
English Language
Learners (ELL)
5B.1.
As noted on the 2011
administration of the FCAT
Mathematics test the students
5B.1.
During grade level meeting and
ongoing professional
development, teachers will focus
5B.1.
Administration
Math Coach
5B.1.
Teacher observation
Utilization of Math journals
5B.1.
Formative: Classroom
walkthroughs and lesson
plan reviews
2011-2012 School Improvement Plan (SIP)-Form SIP-1
April 2011 23
Rule 6A-1.099811
Revised April 29, 2011
Mathematics Goal #5B: in the ELL subgroup did not
achieve proficiency due to
deficiency in Reporting
Category 3: Geometry and
Measurement.
Due to English being a
second language students will
be exposed daily to math
vocabulary “picture” cards.
on FCAT specifications, NGSSS
with an emphasis on specific
vocabulary which will enable the
ELL student to better
comprehend the text.
District Interims
Monthly data chats
Summative: Results from
2012 FCAT Mathematics
Assessment
The results of the 2010-
2011 FCAT Mathematics
Test indicates that 55% of
students in the English
Language Learners
subgroup did not achieve
proficiency.
Our goal is to increase
student proficiency by 5
percentage points to 60%.
2011 Current
Level of
Performance:*
2012 Expected
Level of
Performance:*
55%
(84)
60%
(91)
5B.2.
5B.2. 5B.2. 5B.2. 5B.2.
5B.3
5B.3. 5B.3. 5B.3. 5B.3.
Based on the analysis of student achievement data, and reference to
“Guiding Questions”, identify and define areas in need of
improvement for the following subgroup:
Anticipated Barrier Strategy Person or Position
Responsible for
Monitoring
Process Used to Determine
Effectiveness of
Strategy
Evaluation Tool
5C. Student subgroups
not making Adequate
Yearly Progress (AYP) in
mathematics
Mathematics Goal #5C:
Mathematics Goal #5C:
Students with Disabilities
(SWD)
5C.1.
5C.1. 5C.1. 5C.1. 5C.1.
N/A
2011 Current
Level of
Performance:*
2012 Expected
Level of
Performance:*
N/A
N/A
5C.2.
5C.2. 5C.2. 5C.2. 5C.2.
5C.3.
5C.3. 5C.3. 5C.3. 5C.3.
Based on the analysis of student achievement data, and reference to
“Guiding Questions”, identify and define areas in need of
improvement for the following subgroup:
Anticipated Barrier Strategy Person or Position
Responsible for
Monitoring
Process Used to Determine
Effectiveness of
Strategy
Evaluation Tool
5D. Student subgroups
not making Adequate
Yearly Progress (AYP) in
mathematics
Mathematics Goal #5D:
Mathematics Goal #5D:
Economically
Disadvantaged
5D.1.
As noted on the 2011
administration of the FCAT
Mathematics test the students
in the Economically
5D.1.
To ensure student accountability
all students in grades 4-5 will be
issued a 3 ring binder whereby
individual data results will be
5D.1
Administration
5D.1.
Monthly student/teacher data chats.
5D.1.
Formative: Documented
conference log
SuccessMaker/FCAT
Explorer Results

2011-2012 School Improvement Plan (SIP)-Form SIP-1
April 2011 24
Rule 6A-1.099811
Revised April 29, 2011
Professional Development (PD) aligned with Strategies through Professional Learning Community (PLC) or PD Activity Please note that each Strategy does not require a professional development or PLC activity.
PD Content /Topic
and/or PLC Focus
Grade
Level/Subject
PD Facilitator
and/or
PLC Leader
PD Participants
(e.g. , PLC, subject, grade level, or
school-wide)
Target Dates and Schedules
(e.g. , Early Release) and
Schedules (e.g., frequency of
meetings)
Strategy for Follow-up/Monitoring Person or Position Responsible for
Monitoring
Go Math Manipulatives
3-5
Math Coach
3-5 Teachers
Early Release:
Sept. 21, 2011
Oct. 12, 2011
Nov. 9, 2011
Feb. 3, 2012
Lesson Plans
Classroom walkthroughs
Administration
Math Coach
Mathematics Budget (Insert rows as needed) Include only school-based funded activities/materials and exclude district funded activities /materials.
Evidence-based Program(s)/Materials(s)
Strategy Description of Resources Funding Source Amount
Subtotal:
Technology
Strategy Description of Resources Funding Source Amount
The results of the 2010-
2011 FCAT Mathematics
Test indicates that 58% of
students in the
Economically
Disadvantaged subgroup
did not achieve
proficiency.
Our goal is to increase
student proficiency by 4
percentage points to 62%.
2011 Current
Level of
Performance:*
2012 Expected
Level of
Performance:*
Disadvantaged subgroup did
not achieve proficiency due
to deficiency in Reporting
Category 3: Geometry and
Measurement.
.
High percentage of students
on free and reduced lunch
indicate that there is an
increase in the percent of the
economically disadvantaged
subgroup.
kept along with
SuccessMaker/FCAT Explorer
reports. Students will be able to
refer to this binder during
conferences with the reading and
math teachers.
District Interims
Monthly data chats
Summative: Results from
2012 FCAT Mathematics
Assessment
58%
(147)
62%
(157)
5D.2.
5D.2. 5D.2. 5D.2. 5D.2.
5D.3.
5D.3. 5D.3. 5D.3. 5D.3.

2011-2012 School Improvement Plan (SIP)-Form SIP-1
April 2011 25
Rule 6A-1.099811
Revised April 29, 2011
Subtotal:
Professional Development
Strategy Description of Resources Funding Source Amount
5A.1 Substitute Funding SBBS 2,000.00
Subtotal: 2,000.00
Other
Strategy Description of Resources Funding Source Amount
3.1 Mathematics Journals SBBS 300.00
4.1 Hourly Interventionists SBBS 7000.00
Subtotal:
Total: 9,300.00
End of Mathematics Goals

2011-2012 School Improvement Plan (SIP)-Form SIP-1
April 2011 26
Rule 6A-1.099811
Revised April 29, 2011
Science Goals * When using percentages, include the number of students the percentage represents next to the percentage (e.g. 70% (35)).
SCIENCE GOALS Problem-Solving Process to Increase Student Achievement
Based on the analysis of student achievement data, and reference to
“Guiding Questions”, identify and define areas in need of
improvement for the following group:
Anticipated Barrier Strategy Person or Position
Responsible for
Monitoring
Process Used to Determine
Effectiveness of
Strategy
Evaluation Tool
1. Students achieving proficiency (FCAT Level 3) in
science
Science Goal #1:
1.1.
The areas of deficiency are
Physical and Chemical
changes as well as Earth and
Space.
Students need increased
exposure to the scientific
processes in Physical and
Chemical and Earth and
Space.
1.1.
Ensure that instruction includes
teacher-demonstrated as well as
student-centered laboratory
activities that apply, analyze and
explain concepts related to
matter, energy, force and motion.
1.1.
Administration
1.1.
Students will be expected to keep
an updated Science journal to take
notes relating to their lab
experiences.
Reviewing student work
Classroom walkthroughs
Monthly peer review of journals.
1.1.
Formative: Student
journals
Mini assessments.
Summative: Results from
2012 FCAT Science
Assessment
The results of the 2010-
2011 FCAT Science Test
indicates that 24% of
students achieved level 3
proficiency. Our goal for
the 2011-2012 school year
is to increase level 3
student proficiency by 5
percentage points to 29%
2011 Current
Level of
Performance:*
2012 Expected
Level of
Performance:*
24%
(21)
29%
(25)
1.2.
1.2. 1.2. 1.2. 1.2.
1.3.
1.3. 1.3. 1.3. 1.3.
Based on the analysis of student achievement data, and reference to
“Guiding Questions”, identify and define areas in need of
improvement for the following group:
Anticipated Barrier Strategy Person or Position
Responsible for
Monitoring
Process Used to Determine
Effectiveness of
Strategy
Evaluation Tool
2. Students achieving above proficiency
(FCAT Levels 4 and 5) in science
Science Goal #2:
2.1.
Students need additional
support to develop
independent projects using
the scientific processes.
2.1.
Identify students scoring 4 or 5
on the Reading and Mathematics
portion of the FCAT and mentor
the students in the development
of independent experimental or
engineering projects.
2.1.
Administration
2.1.
Projects will be reviewed
periodically using a rubric to be
sure students are making progress
and that adjustments are being
made as necessary.
2.1.
Formative: School
developed rubric
Summative: Results from
2012 FCAT Science
Assessment
The results of the 2010-
2011 FCAT Science Test
indicates that 6% of
students achieved level 4
and 5 proficiency. Our
goal for the 2011-2012
school year is to increase
levels 4 and 5 student
proficiency by 2
percentage points to 8%
2011 Current
Level of
Performance:*
2012 Expected
Level of
Performance:*
6%
(5)
8%
(7)
2.2. 2.2. 2.2. 2.2. 2.2.
2.3 2.3 2.3 2.3 2.3

2011-2012 School Improvement Plan (SIP)-Form SIP-1
April 2011 27
Rule 6A-1.099811
Revised April 29, 2011
Professional Development (PD) aligned with Strategies through Professional Learning Community (PLC) or PD Activity Please note that each Strategy does not require a professional development or PLC activity.
PD Content /Topic
and/or PLC Focus
Grade
Level/Subject
PD Facilitator
and/or
PLC Leader
PD Participants
(e.g. , PLC, subject, grade level, or
school-wide)
Target Dates and Schedules
(e.g. , Early Release) and
Schedules (e.g., frequency of
meetings)
Strategy for Follow-up/Monitoring Person or Position Responsible for
Monitoring
Ready Schools:
Hands-on inquiry based
best practices
4-5 Teachers
Selected
Teachers
4-5 Teachers
Early Release:
Nov. 16, 2011
Dec. 7, 2011
Jan. 18, 2012
Feb. 22, 2012
March 21, 2012
April 18, 2012
Individual Presentations and
monthly sign in logs
Administration
PLC Leader
Science Budget (Insert rows as needed) Include only school-based funded activities/materials and exclude district funded activities/materials.
Evidence-based Program(s)/Materials(s)
Strategy Description of Resources Funding Source Amount
Subtotal:
Technology
Strategy Description of Resources Funding Source Amount
Subtotal:
Professional Development
Strategy Description of Resources Funding Source Amount
Subtotal:
Other
Strategy Description of Resources Funding Source Amount
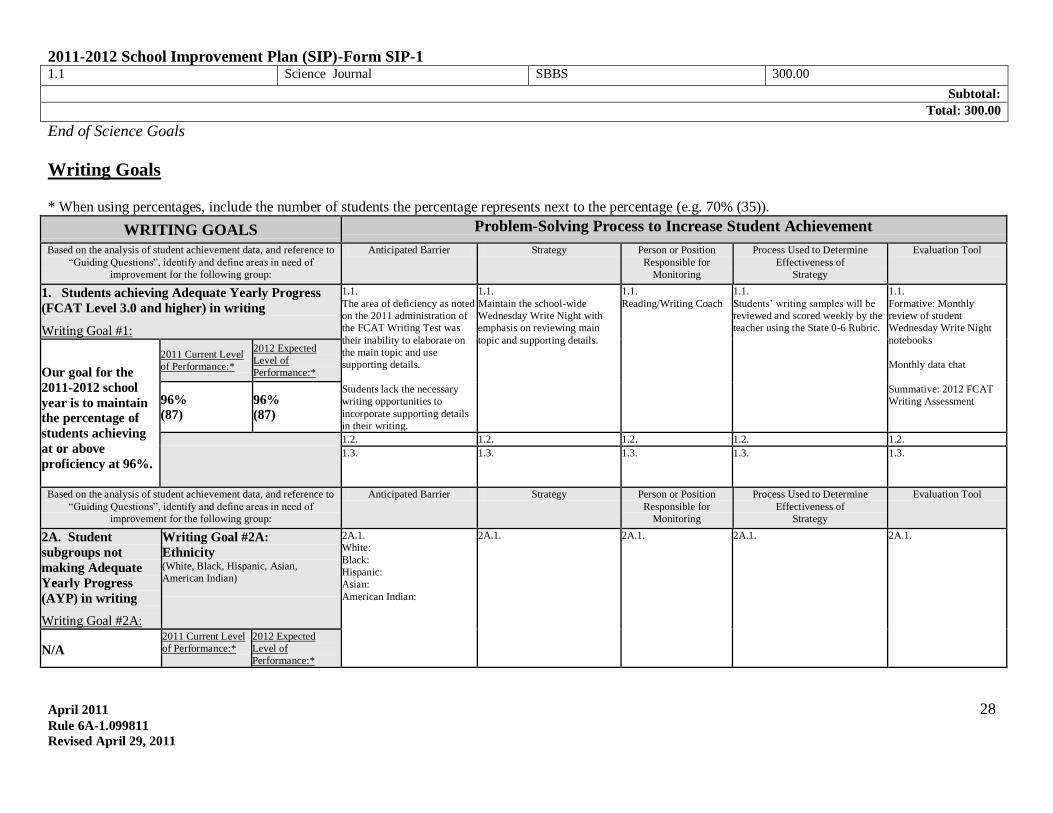
2011-2012 School Improvement Plan (SIP)-Form SIP-1
April 2011 28
Rule 6A-1.099811
Revised April 29, 2011
1.1 Science Journal SBBS 300.00
Subtotal: Total: 300.00
End of Science Goals
Writing Goals * When using percentages, include the number of students the percentage represents next to the percentage (e.g. 70% (35)).
WRITING GOALS Problem-Solving Process to Increase Student Achievement
Based on the analysis of student achievement data, and reference to
“Guiding Questions”, identify and define areas in need of
improvement for the following group:
Anticipated Barrier Strategy Person or Position
Responsible for
Monitoring
Process Used to Determine
Effectiveness of
Strategy
Evaluation Tool
1. Students achieving Adequate Yearly Progress
(FCAT Level 3.0 and higher) in writing
Writing Goal #1:
1.1.
The area of deficiency as noted
on the 2011 administration of
the FCAT Writing Test was
their inability to elaborate on
the main topic and use
supporting details.
Students lack the necessary
writing opportunities to
incorporate supporting details
in their writing.
1.1.
Maintain the school-wide
Wednesday Write Night with
emphasis on reviewing main
topic and supporting details.
1.1.
Reading/Writing Coach
1.1.
Students’ writing samples will be
reviewed and scored weekly by the
teacher using the State 0-6 Rubric.
1.1.
Formative: Monthly
review of student
Wednesday Write Night
notebooks
Monthly data chat
Summative: 2012 FCAT
Writing Assessment
Our goal for the
2011-2012 school
year is to maintain
the percentage of
students achieving
at or above
proficiency at 96%.
2011 Current Level
of Performance:*
2012 Expected
Level of
Performance:*
96%
(87)
96%
(87)
1.2. 1.2. 1.2. 1.2. 1.2.
1.3. 1.3. 1.3. 1.3. 1.3.
Based on the analysis of student achievement data, and reference to
“Guiding Questions”, identify and define areas in need of
improvement for the following group:
Anticipated Barrier Strategy Person or Position
Responsible for
Monitoring
Process Used to Determine
Effectiveness of
Strategy
Evaluation Tool
2A. Student
subgroups not
making Adequate
Yearly Progress
(AYP) in writing
Writing Goal #2A:
Writing Goal #2A:
Ethnicity (White, Black, Hispanic, Asian,
American Indian)
2A.1.
White:
Black:
Hispanic:
Asian:
American Indian:
2A.1. 2A.1. 2A.1. 2A.1.
N/A 2011 Current Level
of Performance:*
2012 Expected
Level of
Performance:*

2011-2012 School Improvement Plan (SIP)-Form SIP-1
April 2011 29
Rule 6A-1.099811
Revised April 29, 2011
White:
Black:
Hispanic:
Asian:
American
Indian:
White:
Black:
Hispanic:
Asian:
American
Indian:
2A.2. 2A.2. 2A.2. 2A.2. 2A.2.
2A.3. 2A.3. 2A.3. 2A.3. 2A.3.
Based on the analysis of student achievement data, and reference to
“Guiding Questions”, identify and define areas in need of
improvement for the following subgroup:
Anticipated Barrier Strategy Person or Position
Responsible for
Monitoring
Process Used to Determine
Effectiveness of
Strategy
Evaluation Tool
2B. Student subgroups
not making Adequate
Yearly Progress (AYP) in
writing
Writing Goal #2B:
Writing Goal #2B:
English Language
Learners (ELL)
2B.1.
3B.1. 2B.1. 2B.1. 2B.1.
N/A
2011 Current
Level of
Performance:*
2012 Expected
Level of
Performance:*
N/A
N/A
2B.2.
2B.2. 2B.2. 2B.2. 2B.2.
2B.3.
2B.3. 2B.3. 2B.3. 2B.3.
Based on the analysis of student achievement data, and reference to
“Guiding Questions”, identify and define areas in need of
improvement for the following subgroup:
Anticipated Barrier Strategy Person or Position
Responsible for
Monitoring
Process Used to Determine
Effectiveness of
Strategy
Evaluation Tool
2C. Student subgroups
not making Adequate
Yearly Progress (AYP) in
writing
Writing Goal #2C:
Writing Goal #2C:
Students with Disabilities
(SWD)
2C.1.
2C.1. 2C.1. 2C.1. 2C.1.
N/A
2011 Current
Level of
Performance:*
2012 Expected
Level of
Performance:*
N/A
N/A
2C.2.
2C.2. 2C.2. 2C.2. 2C.2.
2C.3.
2C.3. 2C.3. 2C.3. 2C.3.

2011-2012 School Improvement Plan (SIP)-Form SIP-1
April 2011 30
Rule 6A-1.099811
Revised April 29, 2011
Professional Development (PD) aligned with Strategies through Professional Learning Community (PLC) or PD Activity Please note that each Strategy does not require a professional development or PLC activity.
PD Content /Topic
and/or PLC Focus
Grade
Level/Subject
PD Facilitator
and/or
PLC Leader
PD Participants
(e.g. , PLC, subject, grade level, or
school-wide)
Target Dates and Schedules
(e.g. , Early Release) and
Schedules (e.g., frequency of
meetings)
Strategy for Follow-up/Monitoring Person or Position Responsible for
Monitoring
Writing Process
K-5
Reading Coach
K-5 teachers
August 19, 2011
Monitoring monthly prompt data
submitted by teachers
Administration
Reading Coach
Based on the analysis of student achievement data, and reference to
“Guiding Questions”, identify and define areas in need of
improvement for the following subgroup:
Anticipated Barrier Strategy Person or Position
Responsible for
Monitoring
Process Used to Determine
Effectiveness of
Strategy
Evaluation Tool
2D. Student subgroups
not making Adequate
Yearly Progress (AYP) in
writing
Writing Goal #2D:
Writing Goal #2D:
Economically
Disadvantaged
2D.1.
2D.1. 2D.1. 2D.1. 2D.1.
N/A
2011 Current
Level of
Performance:*
2012 Expected
Level of
Performance:*
N/A N/A
2D.2.
2D.2. 2D.2. 2D.2. 2D.2.
2D.3.
2D.3. 2D.3. 2D.3. 2D.3.

2011-2012 School Improvement Plan (SIP)-Form SIP-1
April 2011 31
Rule 6A-1.099811
Revised April 29, 2011
Writing Budget (Insert rows as needed) Include only school-based funded activities/materials and exclude district funded activities/materials.
Evidence-based Program(s)/Materials(s)
Strategy Description of Resources Funding Source Amount
Subtotal:
Technology
Strategy Description of Resources Funding Source Amount
Subtotal:
Professional Development
Strategy Description of Resources Funding Source Amount
Subtotal:
Other
Strategy Description of Resources Funding Source Amount
1.1 Composition Books for K-5 SBBS 250.00
Subtotal:
Total: 250.00
End of Writing Goals

2011-2012 School Improvement Plan (SIP)-Form SIP-1
April 2011 32
Rule 6A-1.099811
Revised April 29, 2011
Attendance Goal(s) * When using percentages, include the number of students the percentage represents next to the percentage (e.g. 70% (35)).
ATTENDANCE GOAL(S) Problem-solving Process to Increase Attendance
Based on the analysis of attendance data, and reference to “Guiding
Questions”, identify and define areas in need of improvement:
Anticipated Barrier Strategy Person or Position
Responsible for
Monitoring
Process Used to Determine
Effectiveness of
Strategy
Evaluation Tool
1. Attendance
Attendance Goal #1:
1.1.
Truancy-remained the same
from the previous year.
The school has experienced a
steady high rate of attendance
during the past few years due
to the welcoming positive
climate that has been
established.
Some students have excessive
absence bringing down
overall average
1.1.
Teachers will identify and refer
students who may be developing
a pattern of nonattendance to the
Truancy Child Study Team
(TCST) for intervention services
which may include partnering
with a staff member in order to
monitor their attendance..
1.1.
Assistant Principal and
Counselor
1.1. Weekly updates to Administration
by the TCST and to selected
Homeroom teachers.
1.1.
TCST logs and attendance
rosters
Our goal for this year is to
maintain attendance at
98% by minimizing
absences due to illnesses
and truancy, and to create
a climate in our school
where parents, students
and faculty feel welcomed
and appreciated.
In addition, our goal for
this year is to decrease the
number of students with
excessive absences (10 or
more), and excessive
tardiness (10 or more) by
4 students..
2011 Current
Attendance Rate:*
2012 Expected
Attendance Rate:*
97.93%
(645)
97.93%
(645)
2011 Current
Number of Students
with Excessive
Absences
(10 or more)
2012 Expected
Number of Students
with Excessive
Absences
(10 or more)
70 67
2011 Current
Number of
Students with
Excessive Tardies
(10 or more)
2012 Expected
Number of
Students with
Excessive Tardies
(10 or more)
81 77
1.2.
1.2. 1.2. 1.2. 1.2.
1.3.
1.3. 1.3. 1.3. 1.3.
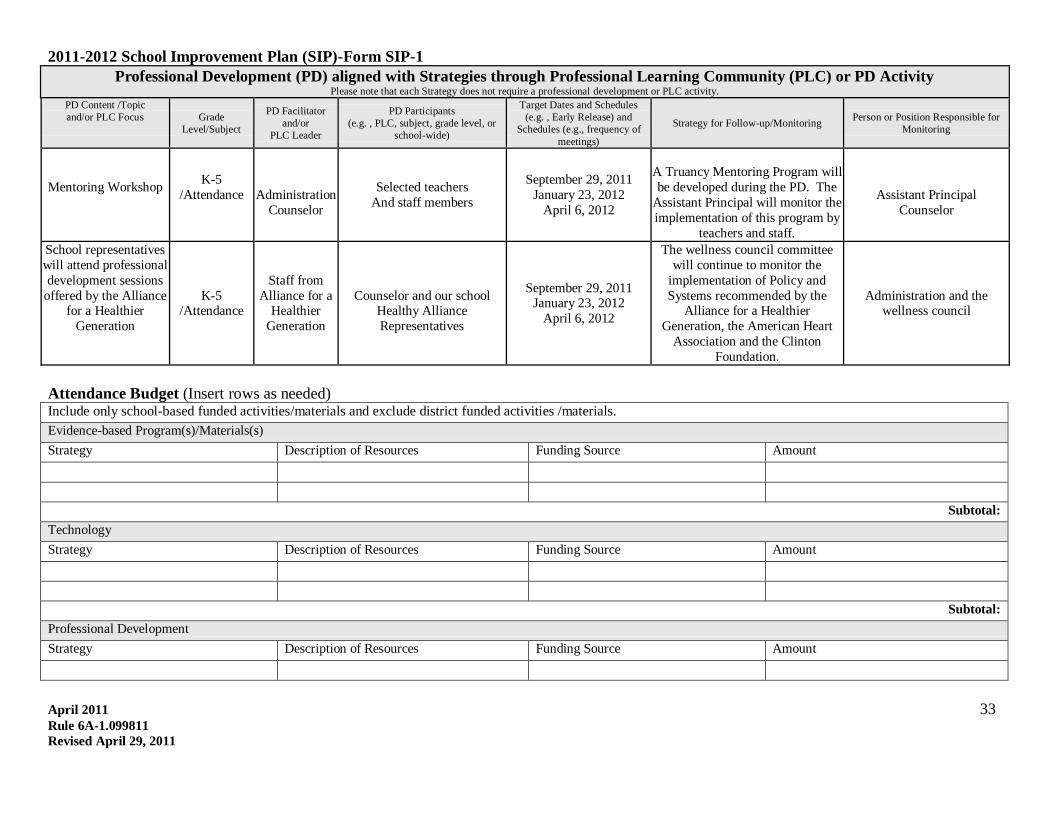
2011-2012 School Improvement Plan (SIP)-Form SIP-1
April 2011 33
Rule 6A-1.099811
Revised April 29, 2011
Professional Development (PD) aligned with Strategies through Professional Learning Community (PLC) or PD Activity Please note that each Strategy does not require a professional development or PLC activity.
PD Content /Topic
and/or PLC Focus
Grade
Level/Subject
PD Facilitator
and/or
PLC Leader
PD Participants
(e.g. , PLC, subject, grade level, or
school-wide)
Target Dates and Schedules
(e.g. , Early Release) and
Schedules (e.g., frequency of
meetings)
Strategy for Follow-up/Monitoring Person or Position Responsible for
Monitoring
Mentoring Workshop
K-5
/Attendance
Administration
Counselor
Selected teachers
And staff members
September 29, 2011
January 23, 2012
April 6, 2012
A Truancy Mentoring Program will
be developed during the PD. The
Assistant Principal will monitor the
implementation of this program by
teachers and staff.
Assistant Principal
Counselor
School representatives
will attend professional
development sessions
offered by the Alliance for a Healthier
Generation
K-5 /Attendance
Staff from
Alliance for a Healthier
Generation
Counselor and our school Healthy Alliance
Representatives
September 29, 2011 January 23, 2012
April 6, 2012
The wellness council committee
will continue to monitor the
implementation of Policy and
Systems recommended by the Alliance for a Healthier
Generation, the American Heart
Association and the Clinton
Foundation.
Administration and the wellness council
Attendance Budget (Insert rows as needed) Include only school-based funded activities/materials and exclude district funded activities /materials.
Evidence-based Program(s)/Materials(s)
Strategy Description of Resources Funding Source Amount
Subtotal:
Technology
Strategy Description of Resources Funding Source Amount
Subtotal:
Professional Development
Strategy Description of Resources Funding Source Amount

2011-2012 School Improvement Plan (SIP)-Form SIP-1
April 2011 34
Rule 6A-1.099811
Revised April 29, 2011
Subtotal:
Other
Strategy Description of Resources Funding Source Amount
1.1 Perfect Attendance Certificates and
Trophies
EESAC 100.00
Subtotal:
Total: 100.00
End of Attendance Goals
Suspension Goal(s)
* When using percentages, include the number of students the percentage represents next to the percentage (e.g. 70% (35)).
SUSPENSION GOAL(S) Problem-solving Process to Decrease Suspension
Based on the analysis of suspension data, and reference to “Guiding
Questions”, identify and define areas in need of improvement:
Anticipated Barrier Strategy Person or Position
Responsible for
Monitoring
Process Used to Determine
Effectiveness of
Strategy
Evaluation Tool
1. Suspension
Suspension Goal #1:
1.1.
There are not enough
opportunities to recognize
students for positive behavior.
1.1.
Utilize the Student Code of
Conduct by providing incentives
for compliance through the use
of Elementary SPOT Success
Recognition program.
1.1.
Administrative Team 1.1.
Monitor Spot Success report by
grade level and monitor COGNOS
report on student outdoor
suspension rate.
1.1.
Participation Log for
students who are
recognized for complying
with the Student Code of
conduct along with the
monthly COGNOS
suspension report.
Our goal for the 2011 -
2012 school year is to
decrease the total number
of suspensions by 10%.
2011 Total Number
of
In –School
Suspensions
2012 Expected
Number of
In- School
Suspensions
0 0
2011 Total Number
of Students
Suspended
In-School
2012 Expected
Number of Students
Suspended
In -School
0 0
2011 Number of Out-
of-School
Suspensions
2012 Expected
Number of
Out-of-School
Suspensions
35 32
2011 Total Number
of Students
Suspended
Out- of- School
2012 Expected
Number of Students
Suspended
Out- of-School
21 19
1.2. 1.2. 1.2. 1.2. 1.2.

2011-2012 School Improvement Plan (SIP)-Form SIP-1
April 2011 35
Rule 6A-1.099811
Revised April 29, 2011
Professional Development (PD) aligned with Strategies through Professional Learning Community (PLC) or PD Activity Please note that each Strategy does not require a professional development or PLC activity.
PD Content /Topic
and/or PLC Focus
Grade
Level/Subject
PD Facilitator
and/or
PLC Leader
PD Participants
(e.g. , PLC, subject, grade level, or
school-wide)
Target Dates and Schedules
(e.g. , Early Release) and
Schedules (e.g., frequency of
meetings)
Strategy for Follow-up/Monitoring Person or Position Responsible for
Monitoring
The Student Code of
Conduct
Part I
PreK - 5
Administration
School-wide August 19, 2011
Classroom walk-through to monitor teachers’ enforcement of the
Student Code of Conduct. Monitor
Spot Success monthly Report.
Leadership Team
The Student Code of
Conduct
Part II
PreK - 5
Administration
School-wide
September 29, 2011
Review communication sheets/logs
to determine the number of
students who have been placed on
indoor/outdoor suspension.
Review parent participation log for
the Student Code of Conduct
workshop during the Title I
Orientation.
Leadership Team
Due to a language barrier,
parents are unfamiliar with
the components of the
Student Code of Conduct
addressing suspensions.
The school’s Guidance
Counselor and the Community
Involvement Specialist will
contact parents of students who
have been placed on outdoor
suspension. Parents will be
provided with training on
building an understanding of the
Student Code of Conduct.
Guidance Counselor,
Community Involvement
Specialist
Monitor Parents Contact Log for
evidences of communication with
parents of students who have been
placed on outdoor suspension.
Parent Communication
Log. Parent sign-in
Log/Parental Involvement
Monthly School Report.
1.3.
Students coming into
situations with
bullying/conflicts do not have
the strategies to resolve issues
without resorting to physical
and verbal abuse.
1.3.
In an effort to change the school
culture the school has taken on
the motto “This is R.O.C.K.S.!”
(Respect, On track, Citizenship,
Kindness and Safety).
1.3.
Administration,
Discipline Committee
1.3.
Monitor number of student referrals
1.3.
Review Number of student
referrals
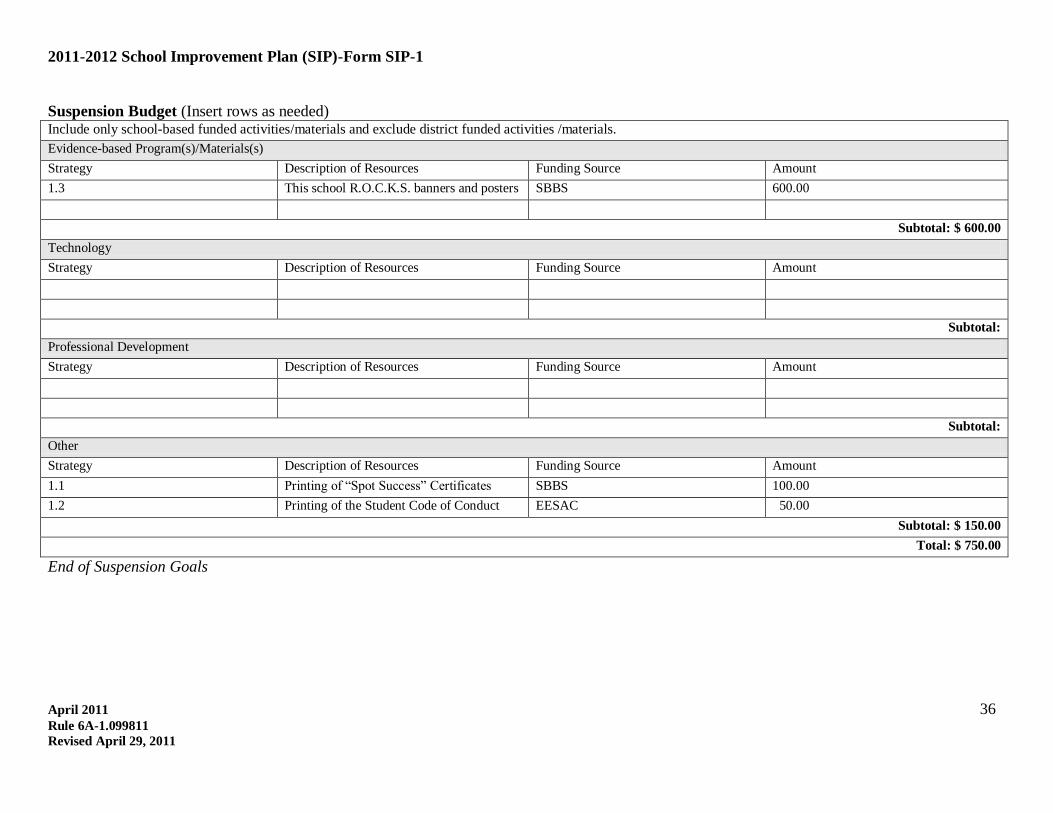
2011-2012 School Improvement Plan (SIP)-Form SIP-1
April 2011 36
Rule 6A-1.099811
Revised April 29, 2011
Suspension Budget (Insert rows as needed) Include only school-based funded activities/materials and exclude district funded activities /materials.
Evidence-based Program(s)/Materials(s)
Strategy Description of Resources Funding Source Amount
1.3 This school R.O.C.K.S. banners and posters SBBS 600.00
Subtotal: $ 600.00
Technology
Strategy Description of Resources Funding Source Amount
Subtotal:
Professional Development
Strategy Description of Resources Funding Source Amount
Subtotal:
Other
Strategy Description of Resources Funding Source Amount
1.1 Printing of “Spot Success” Certificates SBBS 100.00
1.2 Printing of the Student Code of Conduct EESAC 50.00
Subtotal: $ 150.00
Total: $ 750.00
End of Suspension Goals

2011-2012 School Improvement Plan (SIP)-Form SIP-1
April 2011 37
Rule 6A-1.099811
Revised April 29, 2011
Dropout Prevention Goal(s) Note: Required for High School- F.S., Sec. 1003.53 * When using percentages, include the number of students the percentage represents next to the percentage (e.g. 70% (35)).
Professional Development (PD) aligned with Strategies through Professional Learning Community (PLC) or PD Activity Please note that each Strategy does not require a professional development or PLC activity.
PD Content /Topic
and/or PLC Focus
Grade
Level/Subject
PD Facilitator
and/or
PLC Leader
PD Participants
(e.g. , PLC, subject, grade level, or
school-wide)
Target Dates and Schedules
(e.g. , Early Release) and
Schedules (e.g., frequency of
meetings)
Strategy for Follow-up/Monitoring Person or Position Responsible for
Monitoring
N/A
DROPOUT PREVENTION GOAL(S) Problem-solving Process to Dropout Prevention
Based on the analysis of parent involvement data, and reference to
“Guiding Questions”, identify and define areas in need of
improvement:
Anticipated Barrier Strategy Person or Position
Responsible for
Monitoring
Process Used to Determine
Effectiveness of
Strategy
Evaluation Tool
1. Dropout Prevention
Dropout Prevention Goal #1:
*Please refer to the percentage of students who dropped
out during the 2010-2011 school year.
1.1.
1.1. 1.1. 1.1. 1.1.
N/A
2011 Current
Dropout Rate:*
2012 Expected
Dropout Rate:*
N/A
N/A
2011 Current
Graduation Rate:*
2012 Expected
Graduation Rate:*
Enter numerical
data for
graduation rate in
this box.
Enter numerical data
for expected
graduation rate in
this box.
1.2. 1.2. 1.2. 1.2. 1.2.
1.3. 1.3. 1.3. 1.3. 1.3.
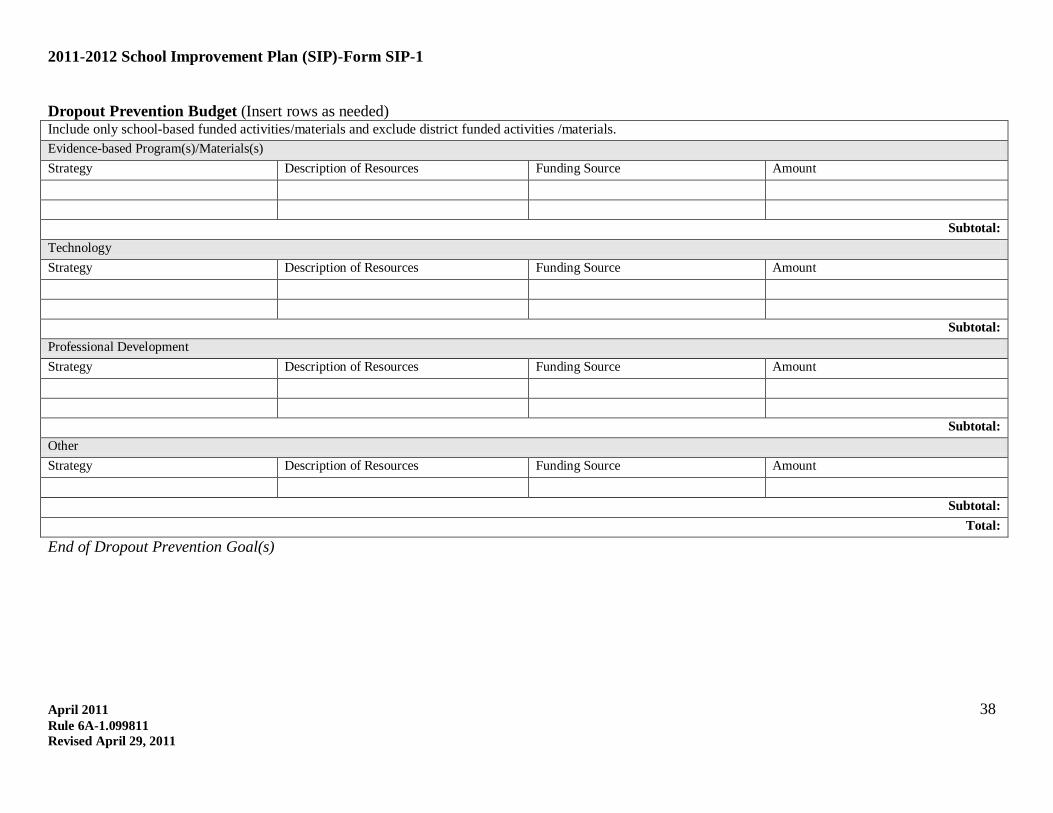
2011-2012 School Improvement Plan (SIP)-Form SIP-1
April 2011 38
Rule 6A-1.099811
Revised April 29, 2011
Dropout Prevention Budget (Insert rows as needed) Include only school-based funded activities/materials and exclude district funded activities /materials.
Evidence-based Program(s)/Materials(s)
Strategy Description of Resources Funding Source Amount
Subtotal:
Technology
Strategy Description of Resources Funding Source Amount
Subtotal:
Professional Development
Strategy Description of Resources Funding Source Amount
Subtotal:
Other
Strategy Description of Resources Funding Source Amount
Subtotal:
Total:
End of Dropout Prevention Goal(s)

2011-2012 School Improvement Plan (SIP)-Form SIP-1
April 2011 39
Rule 6A-1.099811
Revised April 29, 2011
Parent Involvement Goal(s) * When using percentages, include the number of students the percentage represents next to the percentage (e.g. 70% (35)).
Professional Development (PD) aligned with Strategies through Professional Learning Community (PLC) or PD Activity Please note that each Strategy does not require a professional development or PLC activity.
PD Content /Topic
and/or PLC Focus
Grade
Level/Subject
PD Facilitator
and/or
PLC Leader
PD Participants
(e.g. , PLC, subject, grade level, or
school-wide)
Target Dates and Schedules
(e.g. , Early Release) and
Schedules (e.g., frequency of
meetings)
Strategy for Follow-up/Monitoring Person or Position Responsible for
Monitoring
PARENT INVOLVEMENT GOAL(S) Problem-solving Process to Parent Involvement
Based on the analysis of parent involvement data, and reference to
“Guiding Questions”, identify and define areas in need of
improvement:
Anticipated Barrier Strategy Person or Position
Responsible for
Monitoring
Process Used to Determine
Effectiveness of
Strategy
Evaluation Tool
1. Parent Involvement
Parent Involvement Goal #1:
*Please refer to the percentage of parents who
participated in school activities, duplicated or
unduplicated.
1.1.
1.1.
1.1.
1.1.
1.1.
See Parent Involvement Plan
2011 Current
level of Parent
Involvement:*
2012 Expected
level of Parent
Involvement:*
1.2.
1.2.
1.2.
1.2.
1.2.
1.3. 1.3.
1.3.
1.3.
1.3.

2011-2012 School Improvement Plan (SIP)-Form SIP-1
April 2011 40
Rule 6A-1.099811
Revised April 29, 2011
Parent Involvement Budget
* Please ensure that items included in the Parental Involvement Policy/Plan (PIP) are outlined in the following budget section. Include only school-based funded activities/materials and exclude district funded activities /materials.
Evidence-based Program(s)/Materials(s)
Strategy Description of Resources Funding Source Amount
Subtotal:
Technology
Strategy Description of Resources Funding Source Amount
Subtotal:
Professional Development
Strategy Description of Resources Funding Source Amount
Subtotal:
Other
Strategy Description of Resources Funding Source Amount
Promote Communication Red Folders SBBS 997.00
Community Involvement Specialist Personnel Title I 28,000.00
Subtotal:
Total: 28,997.00
End of Parent Involvement Goal(s)
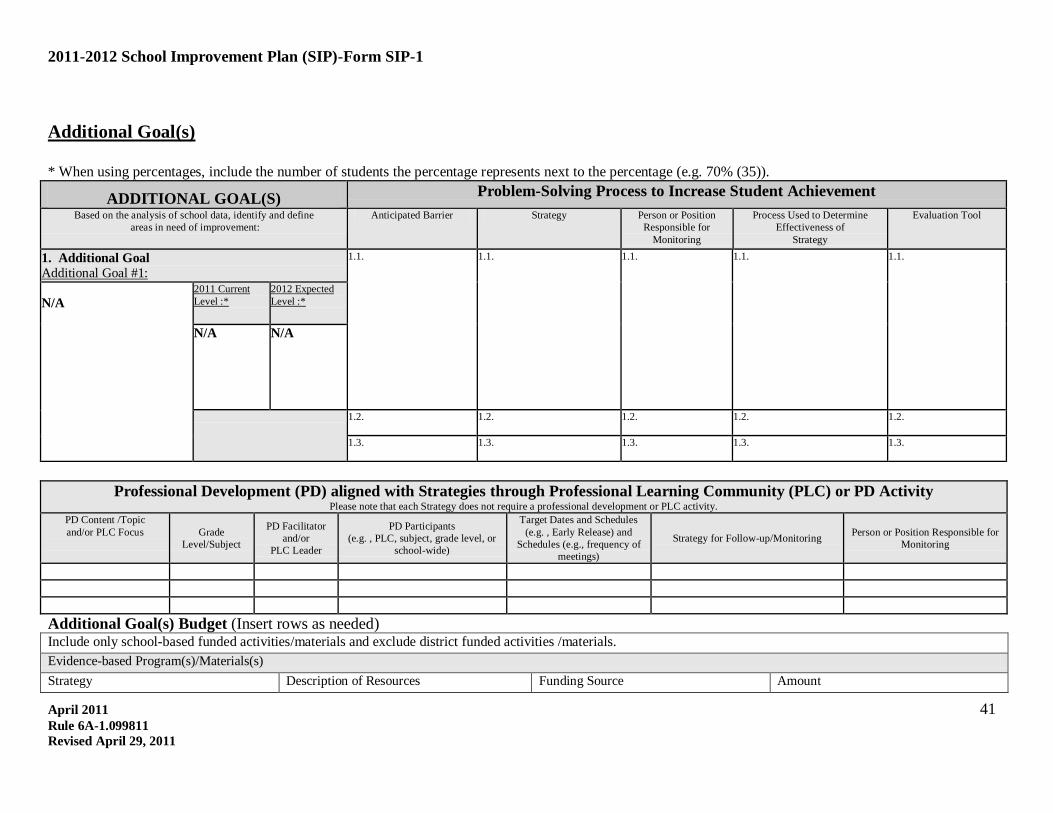
2011-2012 School Improvement Plan (SIP)-Form SIP-1
April 2011 41
Rule 6A-1.099811
Revised April 29, 2011
Additional Goal(s)
* When using percentages, include the number of students the percentage represents next to the percentage (e.g. 70% (35)).
Professional Development (PD) aligned with Strategies through Professional Learning Community (PLC) or PD Activity Please note that each Strategy does not require a professional development or PLC activity.
PD Content /Topic
and/or PLC Focus
Grade
Level/Subject
PD Facilitator
and/or
PLC Leader
PD Participants
(e.g. , PLC, subject, grade level, or
school-wide)
Target Dates and Schedules
(e.g. , Early Release) and
Schedules (e.g., frequency of
meetings)
Strategy for Follow-up/Monitoring Person or Position Responsible for
Monitoring
Additional Goal(s) Budget (Insert rows as needed) Include only school-based funded activities/materials and exclude district funded activities /materials.
Evidence-based Program(s)/Materials(s)
Strategy Description of Resources Funding Source Amount
ADDITIONAL GOAL(S) Problem-Solving Process to Increase Student Achievement
Based on the analysis of school data, identify and define
areas in need of improvement:
Anticipated Barrier Strategy Person or Position
Responsible for
Monitoring
Process Used to Determine
Effectiveness of
Strategy
Evaluation Tool
1. Additional Goal
Additional Goal #1:
1.1.
1.1. 1.1. 1.1. 1.1.
N/A
2011 Current
Level :*
2012 Expected
Level :*
N/A N/A
1.2.
1.2. 1.2. 1.2. 1.2.
1.3.
1.3. 1.3. 1.3. 1.3.
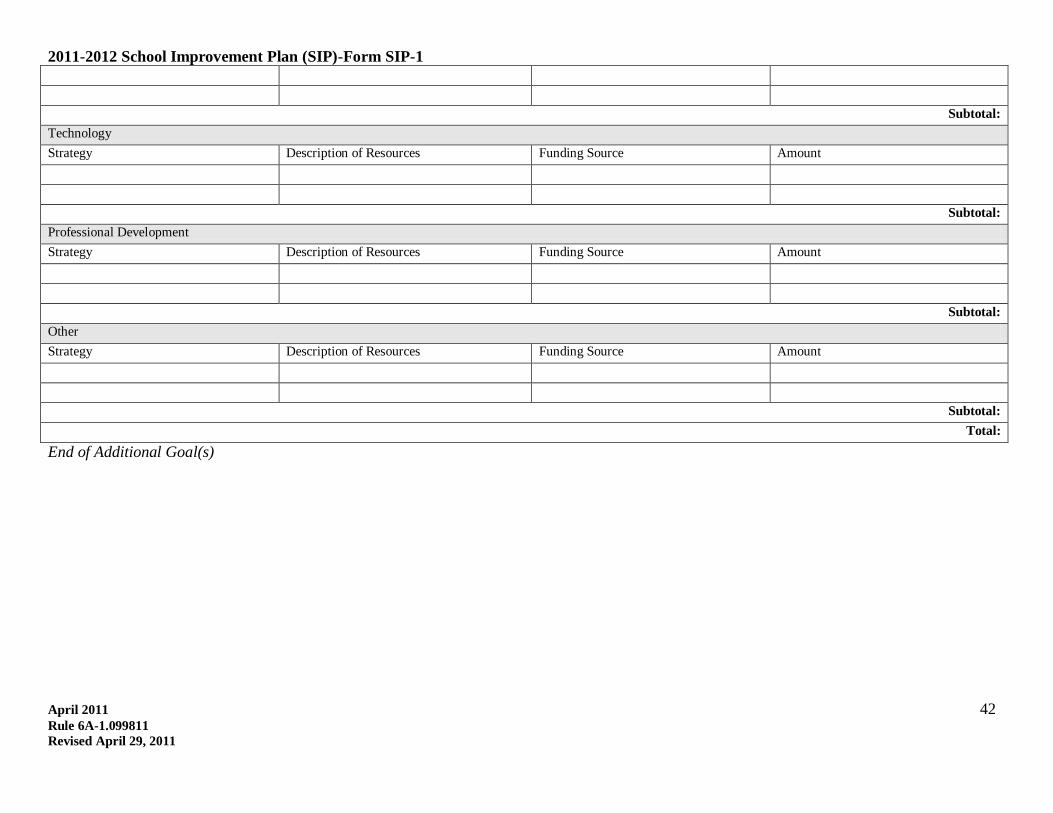
2011-2012 School Improvement Plan (SIP)-Form SIP-1
April 2011 42
Rule 6A-1.099811
Revised April 29, 2011
Subtotal:
Technology
Strategy Description of Resources Funding Source Amount
Subtotal:
Professional Development
Strategy Description of Resources Funding Source Amount
Subtotal:
Other
Strategy Description of Resources Funding Source Amount
Subtotal:
Total:
End of Additional Goal(s)
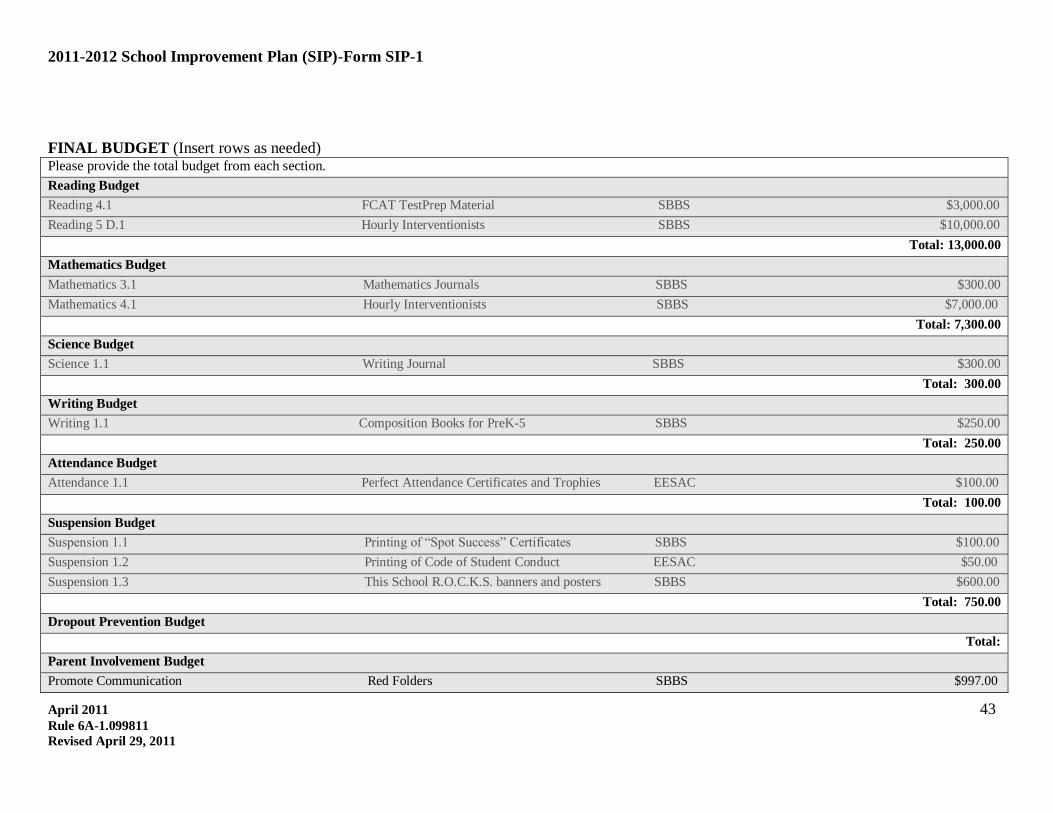
2011-2012 School Improvement Plan (SIP)-Form SIP-1
April 2011 43
Rule 6A-1.099811
Revised April 29, 2011
FINAL BUDGET (Insert rows as needed) Please provide the total budget from each section.
Reading Budget
Reading 4.1 FCAT TestPrep Material SBBS $3,000.00
Reading 5 D.1 Hourly Interventionists SBBS $10,000.00
Total: 13,000.00
Mathematics Budget
Mathematics 3.1 Mathematics Journals SBBS $300.00
Mathematics 4.1 Hourly Interventionists SBBS $7,000.00
Total: 7,300.00
Science Budget
Science 1.1 Writing Journal SBBS $300.00
Total: 300.00
Writing Budget
Writing 1.1 Composition Books for PreK-5 SBBS $250.00
Total: 250.00
Attendance Budget
Attendance 1.1 Perfect Attendance Certificates and Trophies EESAC $100.00
Total: 100.00
Suspension Budget
Suspension 1.1 Printing of “Spot Success” Certificates SBBS $100.00
Suspension 1.2 Printing of Code of Student Conduct EESAC $50.00
Suspension 1.3 This School R.O.C.K.S. banners and posters SBBS $600.00
Total: 750.00
Dropout Prevention Budget
Total:
Parent Involvement Budget
Promote Communication Red Folders SBBS $997.00

2011-2012 School Improvement Plan (SIP)-Form SIP-1
April 2011 44
Rule 6A-1.099811
Revised April 29, 2011
Community Involvement Specialist Personnel Title I $28,000.00
Total: 28,997.00
Additional Goals
Total:
Grand Total: 50, 847.00
Differentiated Accountability
School-level Differentiated Accountability (DA) Compliance Please choose the school’s DA Status. (To activate the checkbox: 1. double click the desired box; 2.when the menu pops up, select “checked” under “Default
Value” header; 3. Select “OK”, this will place an “x” in the box.)
School Differentiated Accountability Status
Intervene Correct II Prevent II Correct I Prevent I N/A
Upload a copy of the Differentiated Accountability Checklist in the designated upload link on the “Upload” page
School Advisory Council School Advisory Council (SAC) Membership Compliance
The majority of the SAC members are not employed by the school district. The SAC is composed of the principal and an appropriately balanced number of teachers, education support employees, students (for middle and high school only), parents, and other business and community citizens who are representative of
the ethnic, racial, and economic community served by the school. Please verify the statement above by selecting “Yes” or “No” below.
Yes No
If No, describe measures being taken to comply with SAC requirement.
Describe projected use of SAC funds. Amount
Ongoing initiatives which support the school improvement plan 1,000.00
FCAT resources to strengthen proficiency levels of all subgroups 500.00
Acknowledge student achievement through trophies 550.00
Hourly employment for tutoring 500.00
Describe the activities of the School Advisory Council for the upcoming year. The purpose of the SAC will be to support :

2011-2012 School Improvement Plan (SIP)-Form SIP-1
April 2011 45
Rule 6A-1.099811
Revised April 29, 2011
Develop and monitor the implementation of the School Improvement Plan
Ongoing initiatives which support the school improvement plan
FCAT resources to strengthen proficiency levels of all subgroups
Acknowledge student achievement through trophies
Hourly employment for tutoring