School environment: Policies and current status
82
i EUROPEAN ENVIRONMENT AND HEALTH PROCESS Policies and current status School environment:
Transcript of School environment: Policies and current status

i
EUROPEAN ENVIRONMENTAND HEALTH PROCESS
Policies and current status
School environment:

Citation advice:School environment: policies and current status. Copenhagen: WHO Regional Office for Europe, 2015.
© World Health Organization 2015All rights reserved. The Regional Office for Europe of the World Health Organization welcomes requests for permission to reproduce or translate its publications, in part or in full.
The designations employed and the presentation of the material in this publication do not imply the expres-sion of any opinion whatsoever on the part of the World Health Organization concerning the legal status of any country, territory, city or area or of its authorities, or concerning the delimitation of its frontiers or boundaries. Dotted lines on maps represent approximate border lines for which there may not yet be full agreement.
The mention of specific companies or of certain manufacturers’ products does not imply that they are en-dorsed or recommended by the World Health Organization in preference to others of a similar nature that are not mentioned. Errors and omissions excepted, the names of proprietary products are distinguished by initial capital letters.
All reasonable precautions have been taken by the World Health Organization to verify the information contained in this publication. However, the published material is being distributed without warranty of any kind, either express or implied. The responsibility for the interpretation and use of the material lies with the reader. In no event shall the World Health Organization be liable for damages arising from its use. The views expressed by authors, editors, or expert groups do not necessarily represent the decisions or the stated policy of the World Health Organization.
Design: Christophe Lanoux, Paris, FranceLayout: Marta Pasqualato, Treviso, ItalyCover photo: © Christian Gapp
Abstract
This report includes a summary of existing policies on providing healthy environments in schools and kindergartens, an overview of environmental risk factors in schools, information on design, methods and results of selected recently conducted exposure assessment surveys and a summary of pupils’ exposures to major environmental factors, such as selected indoor air pollutants, mould and dampness and poor ventilation in classrooms, sanitation and hygiene problems, smoking and the use of various modes of transportation to school. While most Member States have comprehensive policies aiming at providing healthy environment for pupils, implementing and enforcing some of these policies is a common challenge. Further efforts are needed to improve school sanitation, provide adequate ventilation, prevent dampness and mould growth, reduce emission of indoor air pollutants, improve enforcement of existing smoking bans, facilitate the use of active transportation modes in some countries. Facilitating the use of harmonized monitoring method is essential for closing existing data gaps, identifying and addressing environmental risk factors in schools.
KeyWOrdS
AIR POLLUTION, INDOORCHILDRENENvIRONMENTAL ExPOSUREEUROPE HEALTH POLICySCHOOL HEALTH
Address requests about publications of the WHO Regional Office for Europe to:
PublicationsWHO Regional Office for EuropeUN CityMarmorvej 51DK-2100 Copenhagen Ø, Denmark
Alternatively, complete an online request form for documentation, health information, or for permission to quote or translate, on the Regional Office web site (http://www.euro.who.int/pubrequest).

iii
Contents
List of tables ................................................................................................................... iv
List of figures ...................................................................................................................v
Contributors ................................................................................................................... vi
List of abbreviations ..................................................................................................... vii
Executive summary ....................................................................................................... ix
1. Introduction .................................................................................................................1
2. Policies aiming at improving the school environment .................................................2
2.1 Sources of data .......................................................................................................2
2.2 Policies to prevent exposure to chemical indoor air pollutants, mould and physical factors in schools and kindergartens .......................................................3
2.3 Policies to improve access to sanitation and hygiene practices in schools and kindergartens .........................................................................................................9
2.4 Policies to promote walking and cycling to schools, and other forms of physical activity in schools .................................................................................................12
3. Information on the indoor environment in schools and kindergartens ......................14
3.1 Overview of monitoring methods and their applications to assess exposures in schools in the WHO European Region .................................................................14
3.2 Examples of recent and ongoing exposure assessment surveys in the WHO European Region ..................................................................................................27
4. Summary of exposure to EH risk factors in schools .................................................57
4.1 Exposure to chemical indoor air pollutants...........................................................57
4.2 Exposure to dampness/mould in schools .............................................................57
4.3 CO2 levels and ventilation in classrooms ..............................................................59
4.4 Sanitation and hygiene in schools ........................................................................59
4.5 Smoking in schools ...............................................................................................60
4.6 Walking and cycling to schools.............................................................................61
4.7 General conclusions..............................................................................................62
5. References ................................................................................................................63

iv
List of tables
Table 1. Summary of results of WHO policy questionnaire, IAQ policies section: analysis by GNI per capita based groupings ..................................................................4
Table 2. Summary of results of WHO policy questionnaire, hygiene and sanitation policies section: analysis by GNI per capita based groupings .....................................10
Table 3. Summary of answers to the WHO policy questionnaire, sections related to promoting safe physical activities in schools and kindergartens ..............................13
Table 4. Standards/methods for indoor air monitoring..................................................15
Table 5. Summary of WHO IAQ guideline limits for selected pollutants .......................17
Table 6. Selected projects involving monitoring of priority pollutants in indoor air. ...................................................................................................................18
Table 7. Indoor environment in schools: physical factors, measurement methods and reference values .....................................................................................................28
Table 8. Summary of exposure assessment surveys in schools presented in the report ...................................................................................................................29
Table 9. Average levels of indoor air pollutants in schools............................................30
Table 10. Results of a non-systematic internet search for school building monitoring programmes in municipalities in Germany .................................................38
Table 11. Elevated pollutant concentrations in public buildings: data from the “Classical Pollutants” monitoring programme in Cologne, Germany (1989–2003) .......40
Table 12. Parameters, measurements, and assessment criteria of the school monitoring programme, “Active Health Care”, in Cologne, Germany ...........................41
Table 13. Results of the “Active Health Care” programme, Cologne, Germany ...........42
Table 14. Summary of data collection ...........................................................................44
Table 15. Summary of monitoring results for NO2 (µg/m3) .............................................45
Table 16. Summary of monitoring results for benzene (µg/m3) .....................................46
Table 17. Summary of monitoring results for formaldehyde (µg/m3) .............................46
Table 18. Overview of air exchange and ventilation rates from the WHO Schools Survey pilot studies (2011–2013) ..................................................................................48
Table 19. Country-level estimates of the percent of time that pupils are exposed to mould and dampness in schools ..............................................................................49

v
List of figures
Fig. 1. Member States that responded to the WHO policy questionnaire ......................3
Fig. 2. The effect of reverberation on noise and speech understandability – the Lombard effect ..............................................................................................................28
Fig. 3. Average ratios of indoor and outdoor concentrations of pollutants in schools ......................................................................................................................31
Fig. 4. Percent of children with specific symptoms by classroom occupation density ...........................................................................................................................31
Fig. 5. Countries that participated in the SINPHONIE project ......................................33
Fig. 6. Percent of pupils’ person-time in classrooms spent at specific CO2 concentrations (ppm) ....................................................................................................47
Fig. 7. Example of CO2 accumulation in a classroom with poor ventilation ..................47
Fig. 8. Example of temperature and relative humidity patterns during two school days in a non-heated classroom ...................................................................................50
Fig. 9. Percent of pupils who answered positively to selected questions about sanitation facilities in schools ........................................................................................51
Fig. 10. Selected results of inspections of sanitation facilities in schools ....................52
Fig. 11. Percent of pupils who reported smoking in general and smoking in the school or on the school ground, by age .......................................................................53
Fig. 12. Percent of school employees who answered positively to questions about school smoking bans ....................................................................................................54
Fig. 13. Percent of pupils using different modes of transportation (cycling, private car, public transport or walking) ........................................................................54

vi
Contributors
The report was compiled and edited by Andrey Egorov (WHO European Centre for Environment and Health, Bonn, Germany).
Marco Martuzzi, Oliver Schmoll and Marie-Eve Heroux (WHO European Centre for Environment and Health), and Michal Krzyzanowski (King’s College, London, the United Kingdom) reviewed the report and made valuable comments and edits.
The following experts contributed to drafting specific sections of the report:• Otto Hänninen, Ulla Haverinen-Shaughnessy and Martin Täubel (THL, Kuopio, Finland)• Otmar Geiss, Stylianos Kephalopoulos and Josefa Barrero (Joint Research Centre of
the European Commission, Ispra, Italy)• Claudia Wendland and Irina Kozban (Women in Europe for a Common Future,
Hamburg, Germany)• Gerhard Wiesmüller and Christof Kaesler (Stadt Köln Gesundheitsamt, Cologne,
Germany)• Eva Csobod (Regional Environmental Centre, Budapest, Hungary)• Peter Rudnai (National Institute of Environmental Health, Budapest, Hungary)• Nana Gabriadze (National Center for Disease Control and Public Health, Tbilisi, Georgia)• Corinne Mandin (Centre Scientifique et Technique du Bâtiment, Marne-la-vallée,
France)• Andrey Egorov, Enkhtsetseg Shinee and Marie-Eve Heroux (WHO European Centre
for Environment and Health)• Francesca Racioppi and Kristina Mauer-Stender (WHO Regional Office for Europe,
Copenhagen, Denmark).
The following national institutions and experts coordinated national data collection programmes for the WHO Schools Survey (Section 3.2.6): • Albania: National Public Health Institute, Tirana (national survey coordinator Elida Mataj)• Croatia: National Institute of Public Health, Zagreb (coordinator Andreja Barišin) and
Osijek-Baranya County Institute of Public Health, Osijek (coordinator Dario Brdaric)• Estonia: National Health Board, Tallinn (coordinators Marje Muusikus and Kristina
Aidla-Bauvald)• Latvia: Public Health Division, Health Inspectorate, Riga (coordinators Ilze Burtniece
and Madara vegnere)• Lithuania: Centre for Health Education and Disease Prevention, vilnius (coordinators
Ingrida Zurlyté, Olita Rusickaité and Daiva Žeromskiené).
Andrey Egorov (WHO European Centre for Environment and Health) coordinated the development of the WHO Schools Survey protocol and technical support to national surveys. Alexandra Kulinkina and Michael Sellitto (interns, WHO European Centre for Environment and Health), Otto Hänninen (THL, Finland), Elena Naumova and Alexander Liss (Tufts University, Medford, Massachusetts, United States of America) contributed to processing and analysis of the WHO Schools Survey data.
Stephanie Sangalang (University of Cologne, Cologne, Germany) contributed to language editing.
Bianca Bortot (WHO European Centre for Environment and Health) contributed to copy-editing and report production.

vii
ALSPAC Avon Longitudinal Study of Parents and ChildrenASHRAE American Society of Heating, Refrigerating, and Air-Conditioning Engineers BaP benzo[α]pyrene BRE Building Research EstablishmentBUMA Prioritization of BUilding MAterials Emissions as indoor pollution sourcesCAS Chemical Abstracts ServiceCEHAPE Children’s Environment and Health Action Plan for EuropeCEN European Committee for StandardizationCSTB “Centre Scientifique et Technique du Bâtiment” (Scientific and Technical
Centre for Building)dB(A) decibel A filter DG SANCO Directorate-General for Health and Consumers (European Commission)DIN “Deutsches Institut für Normung” (German Institute for Standardization)DvGW Deutsche vereinigung des Gas- und Wasserfaches (German Technical
and Scientific Association for Gas and Water)EECCA eastern Europe, Caucasus and central AsiaEN Euro NormEPA United States Environmental Protection AgencyEU European Union FLIES Flanders Indoor Exposure SurveyGC/MS gas chromatography/mass spectrometryGC-MS/FID gas chromatography – mass spectrometer/flame ionization detectorGerES Iv German Environmental Survey for ChildrenGNI gross national incomeGyTS Global youth Tobacco SurveyHESE Health Effects of School Environment studyHITEA Health Effects of Indoor Pollutants: Integrating microbial, toxicological
and epidemiological approaches studyHPLC High-performance liquid chromatographyHvAC heating, ventilation, and air conditioningIAQ indoor air quality IDMEC-FEUP Instituto de Engenharia Mecânica, Faculdade de Engenharia da
Universidade do Porto (Portugal) [Institute of Mechanical Engineering, Faculty of Engineering, University of Porto (Portugal)]
IEC International Electrotechnical Commission IEQ Indoor environmental quality IMELS Italian Ministry for the Environment, Land and Sea ISO International Standards Organisation JRC European Commission Joint Research Centre JRC IES JRC Institute for Environment and SustainabilityJRC IHCP JRC Institute for Health and Consumer ProtectionKTL Kansanterveyslaitos (National Public Health Institute of Finland)
List of abbreviations

viii
lps pp litre per second per personlux or lx illuminance and luminous emittanceMACBETH Monitoring of Atmospheric Concentration of Benzene in European Towns
and Homes projectMvOCs microbial volatile organic compoundsNDIR non-dispersive infrared NIEH National Institute of Environmental Health (Hungary)NOx mono-nitrogen oxides (e.g. NO [nitric oxide] and NO2 [nitrogen dioxide])OFFICAIR On the reduction of health effects from combined exposure to indoor air
pollutants in modern offices projectOQAI Observatoire de la qualité de l’air intérieur (French: Observatory of Indoor
Air Quality)PAH polycyclic aromatic hydrocarbonPCB polychlorinated biphenylPCDDs polychlorinated dibenzo-p-dioxinPCDF polychlorinated dibenzofuranPCP pentachlorophenolPDMS polydimethylsiloxanePEOPLE Exposição da População a Poluentes Atmosféricos na Europa
(Portuguese: Population Exposure to Air Pollutants in Europe) PM particulate matterppm parts per millionPUF polyurethane foamQA/QC quality assurance/quality controlREC Regional Environmental Center, HungaryREHvA Federation of European Heating, ventilation and Air Conditioning
Associations (formerly known as “Representatives of European Heating and ventilating Associations”)
RH relative humidity RPG Regional Priority GoalSEARCH School Environment And Respiratory health of CHildren project SINPHONIE Schools INdoor Pollution and Health – Observatory Network In EuropeSOPs standard operating proceduresSvOC semi-volatile organic compoundsT temperatureTHL Terveyden ja hyvinvoinnin laitos (Finnish Institute for Health and Welfare)UBA Umweltbundesamt (German Federal Environment Agency)UNICEF United Nations Children’s FundvDI verein Deutscher Ingenieure (Association of German Engineers)vITO vlaamse Instelling voor Technologisch Onderzoek (Flemish Institute for
Technological Research)vOC volatile organic compoundWASH water, sanitation and hygieneWECF Women in Europe for a Common Future

ix
executive summary
This report presents the results of analysis of questionnaire data on policies aiming at improving environment and health (EH) conditions in schools and kindergartens, summarizes environmental monitoring methods applicable to schools, and describes design and findings of recent international surveys in schools in the WHO European Region as well as selected national surveys. The report focuses on the status of implementation of Parma Declaration commitments related to the school environment: providing access to water and sanitation in children’s facilities, ensuring that the indoor air quality (IAQ) is in compliance with WHO guidelines, eliminating smoking in schools and ensuring that children can safely walk and cycle to schools.
In this report, the main source of data on EH policies related to schools and kindergartens is a policy questionnaire developed by the WHO Regional Office for Europe. The questionnaire, which was sent to national EH focal points in the Member States in early 2014, contains sections on policies to provide access to sanitation and hygiene, to ensure adequate IAQ, and to prevent injuries and facilitate physical activities in schools and kindergartens including questions on policies aimed at enabling children to walk and cycle to schools. Another source of information on IAQ policies and recommendations on targeted interventions aimed at improving IAQ in schools was the recently completed Schools Indoor Pollution and Health: Observatory Network in Europe (SINPHONIE) project.
Exposure assessment surveys presented in this report include three recently conducted international surveys of IAQ in schools and kindergartens in the European Region, a national IAQ monitoring survey in France, a municipal monitoring programme in the city of Cologne (as an example of municipal school surveys in Germany), a set of pilot
surveys in volunteering Member States using a standardized WHO methodology to assess IAQ, sanitation, hygiene, smoking and mode of transportation to schools (WHO Schools Survey), and a survey sponsored by the United Nations Children’s Fund (UNICEF) in Georgia, which focused on sanitation and hygiene.
The first international survey described in the report is the School Environment and Respiratory Health of Children (SEARCH) project, which involved IAQ monitoring and respiratory health examinations in ten countries including European Union (EU) Member States, and non-EU countries in eastern Europe and central Asia.
The second international survey, SINPHONIE is the most extensive survey on IAQ and health in European schools conducted to date. Twenty three EU countries monitored exposures to an extensive set of chemical and biological pollutants, and conducted assessments of health status of pupils. The project involved a small sample of schools in each country (three to six schools) to provide a snapshot of conditions in different geographic subregions of Europe.
The third international survey, Health Effects of Indoor Pollutants: Integrating Microbial, Toxicological and Epidemiological Approaches (HITEA) was conducted in three EU Member States (Finland, the Netherlands and Spain). Its primary goal was to assess exposures to indoor dampness and biological air pollutants and characterize their associations with respiratory health effects.
The national school environment moni-toring programme in France includes a recently completed national pilot survey, ongoing large national survey in a random sample of schools across the country and recently initiated compulsory IAQ monitoring in all schools and kindergartens

x
in the country. While the national survey involves extensive measurements of many chemical pollutants and assessment of ventilation and exposure to physical factors in schools, the compulsory monitoring programme covers only a short list of environmental hazards: formaldehyde, benzene, and CO2 as a marker of exposure to stuffy air. This is the only comprehensive national programme in the WHO European Region involving IAQ monitoring in all schools.
While Germany does not have a national monitoring programme in schools, many large German cities developed comprehensive municipal monitoring programmes. One such programme in the city of Cologne is described in details as an example of a local initiative aimed at thoroughly assessing environmental conditions in schools, and providing information for corrective actions and exposure prevention policies at the city level.
The WHO European Centre for Environ-ment and Health (ECEH) has developed, in collaboration with partner institutions, a standardized methodology for exposure assessment surveys in schools aiming at providing a comprehensive assessment of exposures in relation to time-bound Parma Declaration commitments to improve sanitation/hygiene, bring IAQ in compliance with WHO guidelines, prevent smoking and facilitate walking and cycling to schools. The WHO Schools Survey protocol involves measurements of selected IAQ pollutants, detailed inspection of school premises for mould and dampness, CO2 monitoring and assessment of ventilation rates in classrooms, detailed interviews with school administration, and questionnaires for teachers and pupils. So far, national surveys have been completed in five countries. Several more national surveys are ongoing or in preparation.
The last survey described in this report, the national survey of sanitation and hygiene in public schools in Georgia was conducted in 2013 using a standardized methodology developed by UNICEF. It involved interviews and extensive inspections conducted in a random
sample of approximately 300 schools across the country.
The following conclusions are based on the analysis of data from these policy questionnaires and exposure assessment surveys:
1. Access to adequate sanitation facilities and hygiene practices.
a. Most countries have comprehensive policies aimed at improving sanitation and hygiene in schools and kindergartens. The analysis of data by income grouping using the World Bank’s classification of countries demonstrates that poli-cies in low-income and middle-income countries tend to be even more comprehensive than in high-income countries (with the exception of policies aimed at ensuring privacy in toilets).
b. Improving sanitation and hygiene in schools remains a challenge in countries with limited resources despite the existence of standards and regulations. Surveys conducted by WHO and UNICEF in two middle-income countries demonstrated substantial deficiencies in school sanitation and hygiene. The challenges include poor infrastruc-ture and inadequate operation and maintenance of facilities. As a result, pupils have low satisfaction with toilets and hygiene facilities and, in some cases, avoid using them. Improving inspections taking into account pupils’ perceptions and needs, and strengthening enforcement of compliance with the existing standards would be an essential step towards addressing these problems.
c. At the policy level, setting firm targets for improving sanitation and hygiene in schools under the Protocol of Water and Health supports necessary resource allocation and ensures progress towards the goals set in the Parma Declaration.

xi
2. Indoor air quality in schools.
a. There is an important gap in data on exposures to indoor air pollutants and mould/dampness in the eastern part of the Region, especially in the Newly Independent States. The application of standardized monitoring methods would facilitate closing this data gap, identifying existing problems, and raising awareness of IAQ issues among school administrators and policy-makers.
b. Policies aiming at improving IAQ in schools and kindergartens exist in most Member States. IAQ stan-dards specifying maximum allowable levels of indoor air pollutants in schools/kindergartens are more common in high-income countries. Many countries have IAQ standards for non-occupational settings that are not fully in compliance with WHO guidelines.
c. Member States have a variety of guidelines or standards on ventilation, which are applicable to classrooms. Recommended minimum air exchange rates or ventilation rates are defined using different units and assessment methods. Recommended maximum levels of CO2 in classrooms (used as a proxy for ventilation rate) vary from 1000 ppm to 1500 ppm.
d. Based on the available surveillance data, poor ventilation and stuffy air in classrooms is a common problem in some countries during the cold season. Survey in an upper-middle-income country in southeast Europe demonstrated that lack of heating in school buildings is associated with especially poor ventilation and stuffy air in classrooms during the cold season. Detrimental effects of poor ventilation are likely to be substantial and include not only respiratory infections and absenteeism, but also reduced academic performance and well-being of pupils. Assessing the situation across the Region is
hampered by the lack of standard approaches to data collection, analysis and interpretation. Another serious limitation is a lack of data from most low-income and lower-middle-income Member States in the eastern part of the Region.
e. Exposures to mould and dampness are rather common in some countries. Adverse effects of such exposure on respiratory health are well estab-lished. A substantial school-to-school variability in exposure to mould and dampness within specific countries suggests that targeted interventions focused on problematic schools would be an efficient approach.
f. Recently conducted surveys did not detect levels of formaldehyde in excess of the WHO IAQ guideline. Classrooms with high levels of other chemical air pollutants originating from indoor sources, such as benzene, vOCs and PAHs, were detected in some countries. The lack of data for many low-income and lower-middle-income countries does not allow generalization of findings to the entire Region. Substantial experience with pre-venting exposure to chemical pollutants in some EU countries demonstrates the effectiveness of policy interventions. Actions aiming at improving awareness of health effects of indoor air pollution and approaches to reducing emissions from indoor sources should be further promoted.
3. Exposure to physical factors in the school environment.
a. Most countries have standards on minimum and/or maximum indoor air temperature in schools.
b. Despite the existence of indoor temperature standard, a lack of centralized heating in many schools in an upper-middle-income country in south-eastern Europe was associated with uncomfortably low
xii
air temperature, poor ventilation and high relative humidity in classrooms during the cold season. The lack on monitoring data on other countries with similar conditions does not allow further generalization of this finding.
c. Monitoring data on classrooms acoustics, noise level, lighting and other physical factors is rather limited. Assessing exposure to phys-ical factors should be promoted as a step towards creating comfortable school environment and facilitating learning.
4. Health-related behavioural factors.
a. The results of WHO Schools Survey in five volunteering Member States demonstrate that the prevalence of smoking increases with age at different rates in different countries. Overall, almost one half of children who reported smoking during the
past month also reported that they smoke in the school. In one high income country in southeast Europe, prevalence rates of self-reported smoking in general and smoking in schools among 16 years old pupils were 42% and 29% respectively. The lowest rates of smoking among 16 years old pupils were reported in another high-income country located in northeast Europe: 19% for smoking in general and 10% for smoking in the school. Adult individuals are still permitted to smoke inside some schools.
b. Data from WHO surveys in five countries in Europe demonstrate that walking tends to be the most common mode of transportation to school, while using bicycles is rather uncommon. Analysis of responses to policy questionnaire also suggests the need to improve the infrastructure supporting the safe use of bicycles as a mode of transport.

1
IntroductionIn 2010, the Fifth Ministerial Conference on Environment and Health, held in Italy, adopted the Parma Declaration on Environment and Health. Section A of the Declaration, “Protecting children’s health”, specifies four Regional Priority Goals (RPGs). Three of these RPGs include time-bound commitments to protect health and prevent diseases through improving the environment in children’s facilities, including schools and kindergartens:
Regional Priority Goal 1. Ensuring public health by improving access to safe water and sanitation
[Commitment] ii We will strive to provide each child with access to safe water and sanitation in homes, child care centres, kindergartens, schools, health care institutions and public recreational water settings by 2020, and to revitalize hygiene practices.
Regional Priority Goal 2. Addressing obesity and injuries through safe environments, physical activity and healthy diet
[Commitment] iv We aim to provide each child by 2020 with access to healthy and safe environments and settings of daily life in which they can walk and cycle to kindergartens and schools…
Regional Priority Goal 3. Preventing disease through improved outdoor and indoor air quality
[Commitment] iii We aim to provide each child with a healthy indoor environment in child care facilities, kindergartens, schools and public recreational settings, implementing WHO’s indoor air quality
guidelines and, as guided by the Framework Convention on Tobacco Control, ensuring that these environments are tobacco smoke-free by 2015.
This report summarizes recently collected data on policies aimed at improving the environment in schools and kindergartens, as well as results of recently conducted international and selected national surveys which assessed exposures to environmental hazards in schools and kindergartens. The report is not intended as a comprehensive evaluation of all available data on environmental quality in schools, as that would require analysis of literature in multiple languages and access to so-called “grey literature” which has not been formally published. Instead, the report provides a snapshot of conditions and points at commonly detected problems, based on published and yet unpublished results of recently conducted surveys. It also identifies data gaps and suggests further efforts to quantify exposures to harmful factors in schools across the Region and to assess their adverse impacts on health.
While a majority of Members States responded to the WHO policy questionnaire, the response rate was below average among countries in the eastern part of the Region. Similarly, the available data from recent EU-funded international exposure assessment sur-veys include mainly EU Member States. Therefore, the available information on the eastern part of the Region is not sufficient for characterizing spatial patterns. Further efforts are necessary in order to close the existing data gap and support targeted interventions in countries with limited internal resources.
1.

2
Policies aiming at improving the school environment
2.1 Sources of data2.1.1 WHO policy questionnaire
In order to assess the situation at national and subnational levels, WHO developed and administered an environment and health policy questionnaire to National Environment and Health Focal Points in the WHO European Region. The question-naire included six sections covering: (A) sanitation and hygiene in schools and kindergartens, (B) physical activity and injury prevention, (C) indoor air quality (IAQ) in schools and kindergartens, (D) prevention of asbestos-related disease, (E) youth’s participation in the envi-ronment and health process, and (F) suggestions regarding EH chal-lenges to be addressed at the 6th Ministerial Conference.
Sections A and C of the questionnaire, and some questions in section B, aimed at assessing policies related to the environment in schools and kinder-gartens. Thirty-two Member States (Fig. 1) submitted responses by the deadline in April 2014. Four more Member States (Bosnia and Herzegovina, Kyrgyzstan, the Republic of Moldova, the United Kingdom), submitted responses during the rest of 2014; these additional data were used in the analysis of policies on sanitation and hygiene only. The responding Member States are grouped according to the World Bank’s classification based on gross national income (GNI) per capita for 2012 (World Bank, 2015) (Fig. 1).
2.1.2 Policy component of the SINPHONIE project
The European Commission adopted the European Union (EU) Environment and Health Action Plan 2004–2010 in June
2004 as the first cycle in the implemen-tation of the European Environment and Health Strategy (EU, 2004b). The action plan was an operational document that specified 13 key actions to be carried out until 2010. Among them, Action 12 concerned the “improvement of indoor air quality”. In this context, the SINPHONIE project (Schools INdoor Pollution and Health – Observatory Network In Europe) (Csobod et al., 2014), was funded by the European Parliament and supported by the European Commission Directorate General for Health and Consumers (DG SANCO).
SINPHONIE was the first Europe-wide pilot project (involving 23 countries, including EU Member States and accession countries) to monitor IAQ and other factors related to the school environment and children’s health. This two-year project (2010–2012) brought together the multi-disciplinary expertise of almost 40 partner institutions. SINPHONIE supported the implementation of the WHO Regional Priority Goal 3 Preventing disease through improved outdoor and indoor air quality, and followed up on the objectives and targets outlined in the Parma Declaration (WHO Regional Office for Europe, 2010a).
The SINPHONIE project established a network of actors at European level, who would work with a long-term perspective of improving air quality in schools and kindergartens in order to reduce the burden of respiratory diseases and improve children’s well-being and learning success. The project provided an evidence base to support future policy actions and produced recommendations and risk management options for improving air quality and reducing adverse health effects of environmental factors in schools.
2.
3
2.2 Policies to prevent exposure to chemical indoor air pollutants, mould and physical factors in schools and kindergartens
2.2.1 Results of the WHO policy questionnaire
Indoor Air Quality (IAQ) policies and standards
The results of WHO policy questionnaire data (Table 1) show that 14 out of 31 responding countries (45%) have health-based standards for IAQ for non-occupational settings applicable to schools and kindergartens. The main pollutants covered by these standards are formaldehyde (12 countries, 39%), carbon monoxide (9 countries, 29%), nitrogen dioxide (NO2) (8 countries, 26%) and benzene (7 countries, 23%). Twelve countries (39%) have standards for at least one or more indoor air pollutants which are not listed above (e.g. volatile
organic compounds (vOCs), particulate matter (PM), asbestos or radon). Standard sampling duration for the same pollutant tends to differ in various countries limiting the comparability of national standards. When comparison is made with WHO IAQ guidelines for selected chemicals, the following patterns emerge.
•For formaldehyde, a total of nine countries ― Austria, Belgium, Finland, Germany, Italy, Lithuania, Norway, Portugal and Slovakia (29%) ― have standard values equal to or below the WHO guideline of 0.1 mg/m3 for 30-min average (WHO Regional Office for Europe, 2010b).
•For carbon monoxide, WHO recommends four different limits
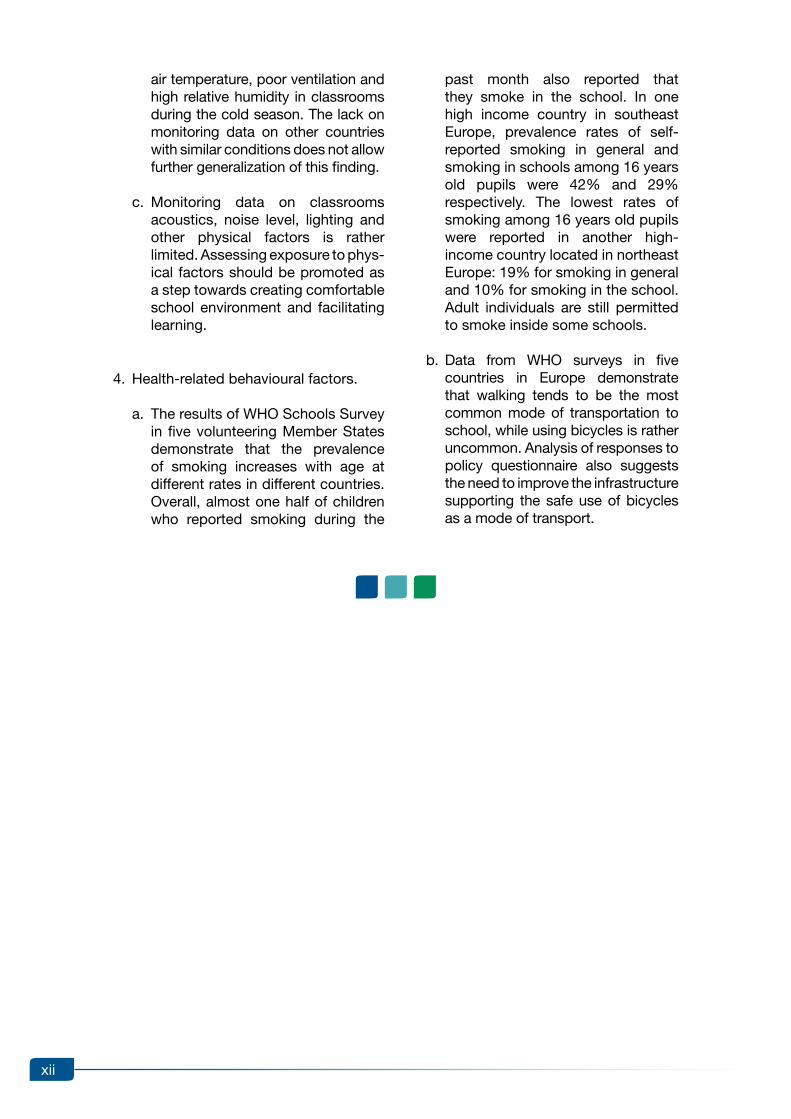
Fig. 1. Member States that responded to the WHO policy questionnaire
The designations employed and the presentation of this material do not imply theexpression of any opinion whatsoever on the part of the Secretariat of the World Health Organization concerning the legal status of any country, territory, city or area or of its authorities, or concerning the delimitation of its frontiers and boundaries.Dotted and dashed lines on maps represent approximate borders for which there may be not full agreement.
Cartography by Pierpaolo Mudu (WHO)© WHO Regional Office for Europe 2015All rights reserved
Not responded by deadline
Low income
Lower-middle income
Upper-middle income
High income
Note: Andorra, Monaco and San Marino did not submit responses by the deadline; Malta, which belongs to the high-income group, submitted a completed questionnaire.

4
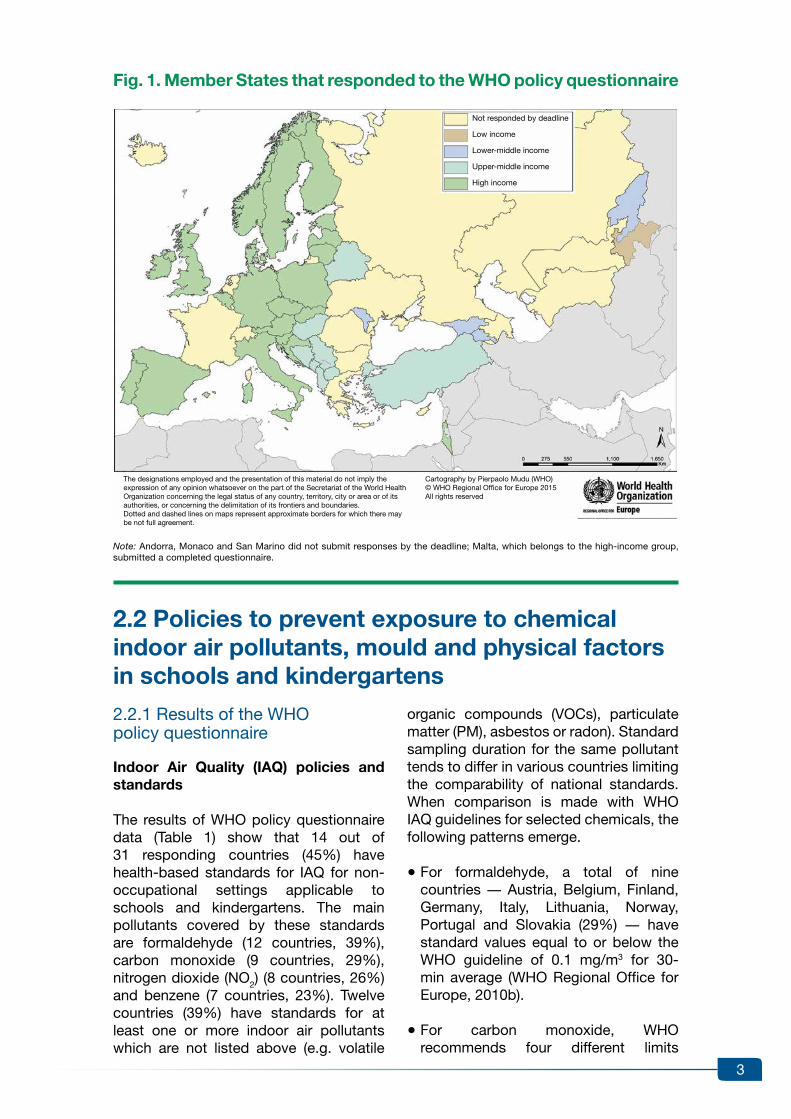
Table 1. Summary of results of WHO policy questionnaire, IAQ policies section: analysis by GNI per capita based groupings
Policy GNI per capita based grouping of Member States
High Upper-middle
Low and lower-middle
All
1. Authority responsible for IAQ in kindergartens and schools
15/21 (71%) 3/7 (43%) 3/3 (100%)
21/31 (68%)
2. Health-based IAQ standards for non-occupational settings
12/21 (57%) 1/7 (14%) 1/3 (33%) 14/31 (45%)
Formaldehyde 11/21 (52%) 1/7 (14%) 0/3 (0%) 12/31 (39%)
NO2 7/21 (33%) 1/7 (14%) 0/3 (0%) 8/31 (26%)
Benzene 6/21 (29%) 1/7 (14%) 0/3 (0%) 7/31 (23%)
Carbon monoxide 8/21 (38%) 1/7 (14%) 0/3 (0%) 9/31 (29%)
Other chemical pollutants 11/21 (52%) 1/7 (14%) 0/3 (0%) 12/31 (39%)
3. regular IAQ surveillance 5/20 (25%) 0/7 (0%) 1/3 (33%) 6/30 (2%)
Measurements are conducted in response to IAQ complaints
5/20 (25%) 0/7 (0%) 0/3 (0%) 5/30 (17%)
regular monitoring of IAQ in randomly selected facilities
1/20 (5%) 0/7 (0%) 1/3 (33%) 2/30 (7%)
Formaldehyde 5/20 (25%) 0/7 (0%) 1/3 (33%) 6/30 (20%)
NO2 5/20 (25%) 0/7 (0%) 1/3 (33%) 6/30 (20%)
Benzene 4/20 (20%) 0/7 (0%) 1/3 (33%) 5/30 (17%)
Carbon monoxide 3/20 (15%) 0/7 (0%) 1/3 (33%) 4/30 (13%)
Other chemical pollutants 5/20 (25%) 0/7 (0%) 0/3 (0%) 5/30 (17%)
4. research projects focusing on IAQ since 2009
16/21 (76%) 4/7 (57%) 0/3 (0%) 20/31 (65%)
Formaldehyde 11/21 (52%) 4/7 (57%) 0/3 (0%) 15/31 (48%)
NO2 9/21 (43%) 4/7 (57%) 0/3 (0%) 13/31 (42%)
Benzene 7/21 (33%) 4/7 (57%) 0/3 (0%) 11/31 (35%)
Carbon monoxide 8/21 (38%) 3/7 (43%) 0/3 (0%) 11/31 (35%)
Other chemical pollutants 13/21 (62%) 3/7 (43%) 0/3 (0%) 16/31 (52%)
Moulds 9/21 (43%) 2/7 (29%) 0/3 (0%) 11/31 (35%)
5. Policy to control indoor levels of formaldehyde and VOCs
12/20 (60%) 1/7 (14%) 0/3 (0%) 13/30 (43%)
Procedures for addressing complaints about chemical smell
5/20 (25%) 1/7 (14%) 0/3 (0%) 6/30 (20%)
requirements to use low emissions construction materials
5/20 (25%) 1/7 (14%) 0/3 (0%) 6/30 (20%)
6. Policy to prevent exposure to mould
15/21 (71%) 3/7 (43%) 0/3 (0%) 18/31 (58%)
Provisions for regular inspections of buildings
4/21 (19%) 1/7 (14%) 0/3 (0%) 5/31 (16%)
5
associated with four exposure durations (15 minutes, 1 hour, 8 hours, and 24 hours average concentrations) in order to ensure that the public is protected from the harmful acute effects of short-term high level carbon monoxide exposure (i.e. acute intoxication) as well as from effects of longer-term, lower level exposure (WHO Regional Office for Europe, 2010b). While nine countries (29%) have standards for one of these exposure durations, only one responding country (Portugal) has standards for all four exposure durations as recommended by WHO.
•For NO2, a total of seven countries ― Belgium, Czech Republic, Germany, Hungary, Italy, Norway, Slovakia (23%) ― have standard values equal to or below the WHO guidelines for short-term exposure (200 µg/m3 1-hour average); however, only one country (Italy) has a long-term exposure standard for NO2 as recommended by WHO (40 µg/m3 annual average).
•For benzene, WHO guidelines state that no safe level of exposure can be recommended, as it is a carcinogen. various levels of acceptable risk and exposure times have been adopted at
Policy GNI per capita based grouping of Member States
High Upper-middle
Low and lower-middle
All
Inspection of buildings in response to complaints
9/21 (43%) 1/7 (14%) 0/3 (0%) 10/31 (32%)
Prompt actions to eliminate the source of exposure
8/21 (38%) 0/7 (0%) 0/3 (0%) 8/31 (26%)
7. requirements for indoor air temperature
19/21 (90%) 6/7 (86%) 3/3 (100%)
28/31 (90%)
8. Ventilation requirements 18/20 (90%) 5/7 (71%) 2/3 (67%) 25/30 (83%)
The policy sets the minimum ventilation rate
11/20 (55%) 4/7 (57%) 1/3 (33%) 16/30 (53%)
The policy sets the maximum allowable CO2 level
10/20 (50%) 1/7 (14%) 0/3 (0%) 11/30 (37%)
The policy includes monitoring requirements
2/20 (10%) 0/7 (0%) 0/3 (0%) 2/30 (7%)
9. Policy to prevent exposure from indoor combustion sources
5/19 (26%) 3/7 (43%) 0/3 (0%) 8/29 (28%)
Facilities with indoor combustion have to have carbon monoxide detectors
2/19 (11%) 1/7 (14%) 0/3 (0%) 3/29 (10%)
10. Policy to prevent chemical contamination
8/20 (40%) 4/7 (57%) 3/3 (100%)
15/30 (50%)
Minimum distance to major roads, refuelling stations, etc.
5/20 (25%) 3/7 (43%) 3/3 (100%)
11/30 (37%)
Minimum distance to factories emitting toxic chemicals
5/20 (25%) 2/7 (29%) 1/3 (33%) 8/30 (27%)
11. New policies introduced after Parma
8/19 (42%) 3/7 (43%) 0/3 (0%) 11/29 (38%)
Note: Data are presented as number of positive responses / total number of responses (percent of positive responses).
Table 1 (concluded)

6
the national level in seven countries (23%). Two countries (Slovakia and Norway) have policies in place to reduce exposure as low as possible.
Policies to control indoor levels of formaldehyde and other VOCs
Thirteen countries (43%) have policies to control indoor levels of formaldehyde and vOCs, including procedures for investigating and addressing complaints about the smell of chemical pollutants (6 countries, 20%) or requiring the use of low emissions construction materials (6 countries, 20%).
Policies on mould and dampness, indoor temperature and ventilation
A total of 18 countries (58%) have policies to prevent exposure to mould, including five countries (16%) with provisions for regularly inspecting school buildings.
Twenty-eight countries (90%) have policies for minimum indoor temperature. The minimum temperature requirements vary by country, and also by season. Three countries ― Israel, Malta, Turkey (10%) ― located in the warm climate region do not have such policies.
Twenty-three countries (74%) reported specific values for minimum and maximum allowable indoor air temperature in schools and kindergartens. The lowest value for minimum temperature is 15°C for hallways and corridors. Requirements for minimum classroom temperature vary from 17°C to 20°C. Some countries, such as Estonia, Hungary, Slovenia and Montenegro, have higher minimum temperature standards for kindergartens (21°C or 22°C). Fifteen countries (48%) also have standards for maximum indoor air temperature, which vary from 22°C to 29°C, partly depending on the season (with a higher maximum limit for the warm season).
A total of 25 countries (83%) have a policy on ventilation. Among the responding countries, 19 (61%) have either ventilation rate or carbon dioxide (CO2) level requirements for schools. The minimum ventilation rate was defined for schools
in 16 countries (53%). Different units of measurement were used in different countries, such as air flow per unit of floor area, per volume (air exchange rate) and per person (ventilation rate in litres per second per person). It should be noted that because occupant density also varies from country to country, numerical comparisons of the national standards may not be appropriate. Some standards also combined ventilation rates per occupant with additional requirements specifying minimum rate of fresh air inflow per square meter of classroom area. Eleven countries (36.7%) set requirements for maximum CO2 concentration in the classrooms. Numerical values varied substantially, ranging from less than 1000 parts per million (ppm) to 5000 ppm (it should be noted that the ambient background level of CO2 is approximately 400 ppm).
Policies on indoor combustion sources
Eight countries (28%) have policies aiming at preventing exposure originating from indoor combustion sources. Six countries (21%) reported that they neither had any indoor combustion sources in schools and kindergartens nor a policy to prevent such exposure. Only three countries (10%) have policies requiring facilities with indoor combustion sources to have carbon monoxide detectors.
Policies to prevent chemical contamination from external sources
Fifteen countries (50%) have policies to prevent chemical contamination or to have physical separation or certain minimum distance between kindergartens and/or schools and major roads, refuelling stations, garages and other facilities for motor vehicles. Eleven countries (37%) have policies that require either a physical separation or specify a minimum distance to such sources; eight countries (27%) require a minimum distance to factories with emission sources of toxic chemicals.
New policies introduced after the Parma conference
Since the Parma Declaration in 2009,

7
11 countries (36%) have reported the introduction of new policies to address several aspects of IAQ. It should be noted that there are important data gaps, as the situation in many countries was not reported through this survey, especially in the eastern part of the Region. There is a need to continue introducing and enforcing suitable policies, such as IAQ standards, requirements for the use of low emission materials, good ventilation practices, proper maintenance of buildings to prevent water leaks and accumulation of moisture, and control of indoor combustion sources in order to address this environmental risk and reduce exposures in indoor environments where children spend a sizeable portion of their time.
Analysis of policies by income-based groupings
High-income countries were more likely to have IAQ standards for non-occupational settings for specific pollutants, and policies to control indoor levels of formaldehyde and vOCs, compared to upper-middle-income countries (Table 1). None of the three low-income and lower-middle-income countries, which responded to this questionnaire, had such standards. In contrast, all three low- and lower-middle-income countries had policies aimed at preventing chemical contamination or requiring minimum distance between schools/kindergartens and sources of pollution, such as busy roads.
2.2.2 Policy component of the SINPHONIE project
The EU-funded SINPHONIE project involved IAQ monitoring in schools, collection of information on health-related policies in schools and in-depth analysis of data and information in order to pro-duce recommendations for healthy school environments (Kephalopoulos et al., 2014). This section summarizes results of policy evaluation and recommendations. The IAQ monitoring results are discussed in section 3.2.
An overview of information on policy initiatives (regulations, laws, guidelines,
programmes) in European countries on healthy school environments (Kephalopoulos et al., 2014) demonstrated that although existing policies vary among countries there are some commonalities in objectives. Many countries have adopted guidelines and recommendations on how to create a healthy indoor environment in schools. These include the design of school buildings, the use of mechanical ventilation, and the use of remediation measures following the detection of problems, such as the presence of mould. For instance, many countries have requirements which are aimed at maintaining basic hygiene and sanitation standards in school buildings, food safety, lighting and ventilation in classrooms. Some of the policies are mandatory, while others are only recommendations.
The SINPHONIE review of national initiatives in EU Member States, accession and candidate countries noted that France and Germany have adopted comprehensive guidelines and recommendations on hygiene and IAQ requirements in schools, measures to control specific indoor air pollutants, indoor climate requirements, and procedures for remediating indoor-environment–related problems.
The German Guidelines for Indoor Air Hygiene in School Buildings were issued in 2008 (UBA, 2008). In France, in the context of the French environmental programme, “Grenelle Environnement” (Ministry of Ecology, Sustainable Development, Transport and Housing, 2010), mandatory requirements were developed for the regular monitoring and auditing of IAQ in schools and for establishing a labelling system for construction and decorating materials.
The SINPHONIE recommendations on improving IAQ in schools include the following components:
•key drivers for a healthy indoor school environment
•health symptoms and problems, and relevant risk factors

8
•tips for establishing/maintaining a healthy school environment
•prevention, control, remediation and communication strategies
•policy implementation criteria.
The recommendations are intended to be generally applicable in most school environments in Europe after adapting them to the local context (e.g. specific environmental, social and economic conditions). The recommendations are primarily directed to relevant policy-makers at European and national levels, and local authorities. The second target group includes individuals who are responsible for the design, construction and renovation of school buildings. A third target group comprises school pupils and their parents, teachers and other school staff. The goal is not to replace but to supplement existing national and local guidance documents, which should remain the first point of reference for specialists and policy-makers in specific countries.
The SINPHONIE recommendations are based on a proactive approach that promotes problem prevention, as compared to a reactive approach aiming at solving problems after they appear. In this sense, the establishment of sustain-able environmental health programmes targeting schools is encouraged as a holistic, comprehensive, cost-effective and implementable strategy. Such programmes should promote a school environment that is conducive to learning and protective of the health of pupils and staff. The expected benefits include: lower rates of absenteeism among children and teachers; stronger academic performance among pupils and greater participation in the classroom; greater teacher retention and job satisfaction; and cost savings through energy and water conservation and efficiency; and improved facility maintenance.
An important prerequisite of a sustainable school environmental health programme is the design of sustainable school buildings. This is achieved though
combining advances in architecture and engineering with traditional climate-specific approaches and regional/local cultural values. The latest advances in decoupling heating and cooling functions from ventilation should be promoted. It is important not only to build schools in non-polluted areas and control outdoor sources of air pollution near schools, but also to control indoor sources of air pollution through the use of low-emitting materials.
Maintaining proper ventilation is important for keeping exposures to indoor pollut- ants at an acceptable level. The authors of the SINPHONIE policy report (Kephalopoulos et al., 2014) do not consider natural ventilation as the default approach. There is a paradigm shift towards favoring the practical implementation of health-based ventilation guidance, recently developed in the context of the EU-funded HEALTHvENT project (Carrer et al., in press). A health-oriented ventilation strategy should be based on two fundamental principles:
1. the indoor air must fulfill the requirements of WHO air quality guidelines (WHO Regional Office for Europe, 2010b); and
2. “source control” is the priority strategy for controlling IAQ and preventing health risks associated with indoor exposures (i.e. eradicating individual sources of pollution or limiting their emissions); while ventilation is only used as a supplementary means to control exposure.
The SINPHONIE recommendations include the following specific approaches:
Location-specific approaches:
•managing urban pollution, including ambient air quality and major sources of air pollution (e.g. transportation, traffic);
•selecting “pollution-free” sites for new schools, promoting compliance with the WHO guidelines for ambient air quality near existing schools, and introducing stricter measures to improve traffic

9
conditions in the vicinity of schools (e.g. within a radius of 1 km); and
•implementing adequate radon exposure prevention and mitigation strategies.
Building design, construction (including retrofitting) and maintenance:
•holistic approach to school building design, construction, and maintenance; this involves the proper selection of clean (low- or no-emitting) materials for new and retrofitted schools and the integration of features related to energy conservation, IAQ maintenance, and comfort requirements;
•elimination of moisture/mould and allergen sources in the school building;
•developing a strategy for heating and, where necessary, cooling, to ensure satisfactory temperature, relative humidity and ventilation in classrooms;
•the decoupling, as far as possible, of heating/cooling functions from the ventilation function; and
•developing a strategy for ventilation in classrooms and the establishment of minimum ventilation levels expressed in litres per second per person based on health criteria.
Management and use:
•setting and enforcing maximum permitted occupation densities in classrooms;
•periodical monitoring of IAQ in schools and of pertinent health parameters in school pupils;
•the establishment of a manual for the proper management of the school indoor environment, in particular IAQ;
•using low emission cleaning materials;
•using low-emission building materials and materials for activities and teaching;
•informing students, their parents and teachers about the importance of maintaining good IAQ in schools;
•identifying school employees who are personally accountable for the management, maintenance and cleaning of school buildings;
•development and implementation of harmonized methodologies and protocols for IAQ assessments; and
•complete smoking ban in all indoor school spaces.
2.3 Policies to improve access to sanitation and hygiene practices in schools and kindergartensIn the Parma Declaration and Commitment to Act, the Member States made commitments to provide access to safe drinking-water and sanitation to each child in homes, child care centres, kindergartens, schools and other settings by 2020. This section summarizes the findings from the WHO policy question-naire section on sanitation and hygiene policies in schools and kindergartens. Responses to this section were received from 34 out of 53 Member States (64%). Table 2 provides a summary of responses.
Assessment of the current status of policies
All 34 responding countries have established policies and programmes to ensure children’s access to adequate sanitation and hygiene. Also all responding countries have policies specifying minimum parameters, quantity and conditions of sanitation facilities (toilets and washrooms) in schools and pre-schools. A majority of responding countries (23 countries, 68%) have policies setting requirements for a maximum

10
number of pupils per toilet seat, while 25 countries (74%) have policies to ensure privacy in school toilets. Other commonly reported policies were requirements for having adequate light (26 countries, 76%) and comfortable temperature in toilets and washrooms (also 76%).
Policies on operation and maintenance of sanitation facilities are present in 28 (82%) of responding countries, with 17 countries (50%) having requirements to provide an
adequate amount of toilet paper and 20 countries (59%) having requirements for providing soap in hand washing facilities.
Most countries (28 countries, 82%) have policies on hygiene education but only 11 countries (32%) address gender-specific issues in hygiene education. Also a majority of countries (29 countries, 85%) have policies setting requirements for regular surveillance and more than two-thirds (68%) of countries have polices for
Table 2. Summary of results of WHO policy questionnaire, hygiene and sanitation policies section: analysis by GNI per capita based groupings
Policy GNI per capita based grouping of Member States
High Upper-middle
Low and lower-middle
All
1. Policy specifying minimum parameters
21/21 (100%)
8/8 (100%)
5/5 (100%)
34/34 (100%)
Maximum number of pupils per toilet place
15/21 (71%) 5/8 (63%) 3/5 (60%) 23/34 (68%)
Maximum number of pupils per hand wash basin
9/21 (43%) 6/8 (75%) 5/5 (100%)
20/34 (59%)
Adequate light in toilets and washrooms
16/21 (76%) 6/8 (75%) 4/5 (80%) 26/34 (76%)
Comfortable temperature in toilets and washrooms
15/21 (71%) 6/8 (75%) 5/5 (100%)
26/34 (76%)
Privacy standards for toilet cabins 17/21 (81%) 4/8 (50%) 4/5 (80%) 25/34 (74%)
Accessibility for children with disabilities
16/21 (76%) 5/8 (63%) 1/5 (20%) 22/34 (65%)
2. Policy specifying operation and maintenance
18/21 (86%) 5/8 (63%) 5/5 (100%)
28/34 (82%)
Provision of adequate amount of toilet paper
11/21 (52%) 4/8 (50%) 2/5 (40%) 17/34 (50%)
Provision of soap in hand washing facilities
13/21 (62%) 4/8 (50%) 3/5 (60%) 20/34 (59%)
Provision of adequate amount of water for hand washing
13/21 (62%) 6/8 (75%) 4/5 (80%) 23/34 (68%)
Provision of towels/driers 13/21 (62%) 4/8 (50%) 4/5 (80%) 21/34 (62%)
Minimum cleaning requirements for sanitation facilities
14/21 (67%) 4/8 (50%) 5/5 (100%)
23/34 (68%)
regular inspection and maintenance of sanitation facilities
10/21 (48%) 3/8 (38%) 4/5 (80%) 17/34 (50%)
3. Policy on hygiene education 16/21 (76%) 7/8 (88%) 5/5 (100%)
28/34 (82%)

11
identifying officers who are responsible for ensuring compliance with sanitation and hygiene requirements.
Only eight out of 34 responding countries (24%) have introduced new policies on water, sanitation and hygiene (WASH) in schools and kindergartens after the Parma Conference: Denmark, former yugoslav Republic of Macedonia, Hungary, Latvia, Lithuania, Kyrgyzstan, Montenegro and Tajikistan.
Five countries that responded to the WHO policy questionnaire also participated in the WHO survey in schools (Albania, Croatia, Estonia, Latvia and Lithuania) and one country (Georgia) participated in a UNICEF survey of water and sanitation in schools, which are described in this report. Albania is an upper-middle-income country while Georgia is a lower-middle-income country; the other four countries belong to the group of high-income countries. The WHO and UNICEF surveys in schools demonstrated substantial problems with sanitation and hygiene
facilities in schools in the two lower- and upper-middle-income countries (Georgia and Albania), while conditions in the high-income countries were generally satisfactory. At the same time, analysis of policies demonstrated that Albania and Georgia had comprehensive policies comparable to policies in the high-income countries.
Potential areas for further improve-ments and way forward
•The existing policies appear to be rather strong and comprehensive, especially in the group of low-income and lower-middle-income countries. However, the situation on the ground may differ, as suggested by the results of recently conducted standardized surveys facilitated by WHO and UNICEF (see sections below). Therefore, the existence of a legal framework does not necessarily ensure adequate sanitation in schools and kindergartens. Analysis of available data on policies and on sanitation and hygiene in schools
Policy GNI per capita based grouping of Member States
High Upper-middle
Low and lower-middle
All
requires hygiene education to be part of curriculum
10/21 (48%) 6/8 (75%) 3/5 (60%) 19/34 (56%)
Specifies educational minimum requirements
7/21 (33%) 6/8 (75%) 3/5 (60%) 16/34 (47%)
Hygiene education addresses gender-specific aspects
6/21 (29%) 2/8 (25%) 3/5 (60%) 11/34 (32%)
4. Officer responsible for compliance
14/21 (67%) 4/8 (50%) 5/5 (100%)
23/34 (68%)
5. regular surveillance 16/21 (76%) 8/8 (100%)
5/5 (100%)
29/34 (85%)
Minimum requirements for inspections
7/21 (33%) 6/8 (75%) 2/5 (40%) 15/34 (44%)
If deficiencies are found, follow-up inspections
14/21 (67%) 7/8 (88%) 5/5 (100%)
26/34 (76%)
6. New policies introduced after Parma
3/21 (14%) 3/8 (38%) 2/5 (40%) 8/34 (24%)
Note: Data are presented as number of positive responses / total number of responses (percent of positive responses).
Table 2 (concluded)

12
suggests that the situation is strongly affected by economic factors, which affect the quality of infrastructure and maintenance, as well as adequate monitoring of compliance with existing standards and enforcement mechanisms.
•Not all standards adopted by the responding countries are in accordance with WHO guidelines (Adams et al., 2009). In some countries the required number of available sanitation facilities in schools and kindergartens is lower than what is specified in the WHO guidelines. Almost one third of the countries lacks requirements for hand washing facilities and does not address the issue of accessibility of sanitation facilities for disabled children. Further strengthening of national policies and standards taking into account WHO guidelines is encouraged.
•Subsequently, more meaningful and efficient monitoring, and more transparent and rigorous mechanisms for correcting deficiencies are recommended. This also includes the need to better address pupils’ perceptions and needs.
•Water, sanitation and hygiene education should be incorporated in preschool
and school curricula. More attention is required to bring gender-specific aspects like menstrual hygiene into the respective educational programmes.
•After the Parma Conference, some countries introduced new policies aimed at implementing the Parma commitments. To a large extent these newly introduced policies focused on setting or improving sanitation and hygiene standards in preschools and primary and secondary schools. Further efforts aimed at implementing and enforcing such policies are encouraged.
Most Member States of the WHO Euro-pean Region are parties to the Protocol on Water and Health (hereinafter “the Protocol”) (UN, 2000). WASH in schools and other child care settings is one of the priority thematic areas under the Protocol 2014–2016 programme of work. The target setting and reporting process under the Protocol is an effective policy instrument to implement the Parma Commitments at a national level. Country-specific targets for WASH in schools and kindergartens help mobilizing necessary internal resources, support incremental improvements and strengthen governmental commitment to achieve sanitation and hygiene-related goals set in the Parma Declaration.
2.4 Policies to promote walking and cycling to schools, and other forms of physical activity in schoolsSection B of the WHO policy questionnaire, “Policies to encourage physical activity and prevent injuries,” included a question about policies aimed at promoting walking and cycling to schools. All 31 Member States which completed the section B answered this question (Table 3). Eighteen countries (58%) had such policies. These included seven countries (23%) with legally binding standards, nine (29%) with legally non-binding recommendations or guidelines and 12 (39%) with action plans or programmes. Because some countries had more than one
type of policy, the total is greater than 18. In 16 countries (52%), policies existed at the national level, while in nine countries (29%), policies existed at the regional or local level (seven of them had policies at national and sub-national levels).
The most common type of policy, found in 14 countries (45%) and aimed at promoting safe walking and cycling to schools, was a requirement to have reduced speed limits near schools. Ten countries (32%) had policies on bicycle

13
parking facilities at schools and only eight countries (26%) had policies on bicycle lanes leading to schools.
Policies to encourage walking and cycling to schools were most common in the group of high-income countries where 15 out of 21 responders (71%) had such policies. The proportion was lower (3 out of 7 responders, 43%) in the group of upper-middle-income countries; none of the three low- to lower-middle-income countries which responded to this section had such policies.
Two other school and kindergarten-related questions were about policies on required
minimum number of physical education in schools (question #2) and policies to equip these facilities with exercise rooms and playgrounds (question #3). Almost all countries (29 out of 30, 97%) had requirements on physical education in schools. These included 25 countries (83%) with legally binding standards on physical education hours (now shown in Table 3). Also a large majority of countries (26 out of 29 responders, 90%) had policies to equip schools and kindergartens with exercise rooms and/or playgrounds. In 23 countries (79%) such policies were legally binding.
Table 3. Summary of answers to the WHO policy questionnaire, sections related to promoting safe physical activities in schools and kindergartens
Question GNI per capita based grouping of Member States
High Upper-middle
Low and lower-middle
All
2. required minimum number of physical education hours in schools
19/20 (95%) 7/7 (100%) 3/3 (100%) 29/30 (97%)
3. Policy to equip kindergartens and schools with exercise rooms or playgrounds
16/19 (84%) 7/7 (100%) 3/3 (100%) 26/29 (90%)
6. Policy to encourage walking and cycling to schools
15/21 (71%) 3/7 (43%) 0/3 (0%) 18/31 (58%)
Specific policy measures:
requirements to have bicycle lanes leading to schools
7/21 (33%) 1/7 (14%) 0/3 (0%) 8/31 (26%)
requirements to have bicycle parking facilities at schools
9/21 (43%) 1/7 (14%) 0/3 (0%) 10/31 (32%)
Measures to facilitate walking to schools, such as organized walking of groups of children and supervised street crossings
11/21 (52%) 0/7 (0%) 0/3 (0%) 11/31 (35%)
reduced speed limits or other traffic calming measures near schools
11/21 (52%) 3/7 (43%) 0/3 (0%) 14/31 (45%)
Note: Data are presented as number of positive responses / total number of responses (percent of positive responses).

14
Information on the indoor environment in schools and kindergartens
3.1 Overview of monitoring methods and their applications to assess exposures in schools in the WHO european region
3.1.1 Indoor air quality monitoring – chemical air pollutants
Background
A number of chemical compounds, which are commonly found in the indoor environment, are known health hazards. These include benzene, carbon monoxide, formaldehyde, naphthalene, nitrogen dioxide, polycyclic aromatic hydrocarbons (PAHs) (in particular, benzo[α]pyrene), radon, trichloroethylene and tetrachloroethylene. These compounds are included in the WHO Guidelines for Indoor Air Quality: Selected Pollutants (WHO Regional Office for Europe, 2010b). For each of these compounds, various sampling and laboratory analysis techniques are available. The use of harmonized sampling and analysis protocols is necessary for producing comparable results in the international context.
Currently, there are no EU directives explicitly prescribing a monitoring and control programme for IAQ. Consequently, there is no operational systematic indoor air monitoring programme in the EU. For most of the above pollutants, International Standards Organisation (ISO) specifications for indoor monitoring are available; there are also national standard monitoring methods (for example, in the United States of America) and standards issued by the European Committee for Standardization (CEN) (Table 4).
Selection of appropriate measurement technique
Proper source control and adequate ventilation are preferable means to prevent the accumulation of chemical pollutants in indoor spaces. Monitoring of chemical pollutants in schools and kindergartens should only be conducted under specific circumstances, such as special surveillance programmes aiming at characterizing a distribution of exposure levels and assessing compliance with guidelines or standards, or addressing complaints about IAQ (following inspections of indoor premises to identify and remove potential sources of pollution).
An appropriate measurement technique often depends on the purpose of measurements, e.g. testing for guideline compliance, addressing complaints, or assessing exposure to certain substances, and on the need for short-term or long-term measurements. For substances with acute health effects, short-term measurements are preferred. For substances with chronic effects (i.e. carcinogenic compounds) a monitoring program should aim at assessing long-term exposure. Ideally, multiple short-term measurements should be conducted in longitudinal survey settings in order to allow for the assessment of temporal changes in concentrations over time. However, in terms of cost–effectiveness and practical implementation this approach is rarely feasible. WHO IAQ
3.

15
guideline values for selected priority indoor pollutants are listed in Table 5. It should be noted that “excess cancer risk” is defined by assuming that people are exposed continuously (24 hours per day) to the specific concentration of a pollutant during a lifetime. The WHO IAQ guidelines do not specify recommended limits for carcinogenic compounds which do not have thresholds for harmful effects.
Instead, the guidelines include a unit risk for cancer effects, and propose examples of indoor concentrations corresponding to specific life-time excessive cancer risks. Member States or international organizations can set up their own limit values based on acceptable risk levels. An example of such limit value is the EU limit for indoor concentration of benzene, which is set at 5 µg/m3 (EU, 2004a).
Table 4. Standards/methods for indoor air monitoring
Standard Title Applicable to the following main pollutants
ISO 16000-1 Indoor Air – Part 1: General Aspects of Sampling Strategy
All
ISO 16000-2 Indoor Air – Part 2: Sampling Strategy for Formaldehyde
Formaldehyde
ISO 16000-3 Indoor Air – Part 3: Determination of Formaldehyde and Other Carbonyl Compounds in indoor air and test chamber air – Active Sampling Method
Formaldehyde
ISO 16000-4 Indoor Air – Part 4: Determination of Formaldehyde – Diffusive Sampling Method
Formaldehyde
ISO 16000-5 Indoor Air – Part 5: Measurement Strategy for volatile Organic Compounds (vOCs)
vOCs
ISO 16000-6 Indoor Air – Part 6: Determination of volatile Organic Compounds in indoor and test chamber air by Active Sampling on Tenax TA Sorbent, Thermal Desorption and Gas Chromatography using MS/FIDa
vOCs
ISO 16000-12 Indoor air – Part 12: Sampling strategy for polychlorinated biphenyls (PCBs), polychlorinated dibenzo-p-dioxins (PCDDs), polychlorinated dibenzofurans (PCDFs) and polycyclic aromatic hydrocarbons (PAHs)
Benzo[α]pyrene
ISO 16000-13 Indoor air – Part 13: Determination of total (gas and particle-phase) polychlorinated dioxin-like biphenyls (PCBs) and polychlorinated dibenzo-p-dioxins/dibenzofurans (PCDDs/PCDFs) – Collection on sorbent-backed filters
Benzo[α]pyrene
ISO 16000-14 Indoor air – Part 14: Determination of total (gas and particle-phase) polychlorinated dioxin-like biphenyls (PCBs) and polychlorinated dibenzo-p-dioxins/dibenzofurans (PCDDs/PCDFs) – Extraction, clean-up and analysis by high-resolution gas chromatography and mass spectrometry
Benzo[α]pyrene
ISO 16000-15 Sampling strategy for nitrogen dioxide (NO2) NO2
ISO 16017-1 Indoor, Ambient, and Workplace Air – Sampling and Analysis of volatile Organic Compounds by Sorbent Tube/Thermal Desorption/capillary Gas Chromatograph – Part 1: Pumped Sampling
vOCs

16
Standard Title Applicable to the following main pollutants
ISO 16017-2 Indoor, Ambient, and Workplace Air – Sampling and Analysis of volatile Organic Compounds by Sorbent Tube/Thermal Desorption/capillary Gas Chromatograph – Part 2: Diffusive Sampling
vOCs
ISO 16200-2 Workplace air quality – Sampling and analysis of volatile organic compounds by solvent desorption/gas chromatography. Part 2: Diffusive sampling method
vOCs
CeN eNb 14412
Indoor air quality – Diffusive samplers for the determination of concentrations of gases and vapours – Guide for selection, use and maintenance
CeN eN 14662-5 (method for ambient air)
Ambient air quality – Standard method for measurement of benzene concentrations Part 5: Diffusive sampling followed by solvent desorption and gas chromatography
Benzene (and other vOCs)
United States ePAc. Method TO-13A (method for ambient air)
EPA (1999). Compendium method TO-13A. Determination of polycyclic aromatic hydrocarbons (PAHs) in ambient air using gas chromatography/mass spectrometry (GC/MS). EPA/625/R-96/010b.
Benzo[α]pyrene
a GC-MS/FID gas chromatography - mass spectrometer/flame ionization detector b EN = Euro Norm c EPA = United States Environmental Protection Agency
Table 4 (concluded)
Short-term (from less than one hour to a few hours) measurements are commonly conducted using an active sampling approach in which the air is drawn through the sorbent by a suction pump. Trapped substances are hereafter desorbed either chemically or thermally, and analysed using gas chromatography, high-performance liquid chromatography (HPLC) or other techniques. Compared to passive diffusion-based sampling, active sampling tends to be more expensive, more resource-intensive (as it requires a pump and specific skills from survey personnel), more difficult to use for the evaluation of individual exposure (i.e. personal exposure monitoring) and less suitable for monitoring air quality in classrooms due to noise produced by suction pumps. However, active sampling is generally more sensitive and accurate (Uhde, 2009), compared to passive sampling.
Long-term (several days) sampling is usually conducted using passive
diffusion samplers, which rely on gaseous diffusion into a reactive adsorbent. As concentrations can only be measured over a relatively long time period, passive samplers are not useful for measuring peak concentrations. Compounds trapped in samplers are thermally or solvent desorbed, and analysed using gas chromatography, HPLC or other techniques. Unlike active (pumped) sampling, passive samplers require no electricity, have no moving parts, produce no noise, and are simple to use (no pump operation or calibration required).
Examples of causes of variations in air pollutant concentration over time include: changing ventilation during day/night or weekdays/weekends, varying emission from products present in indoor environments and/or seasonal variations in ventilation, temperature and other conditions. The occurrence of short-term peak concentrations of compounds, which are emitted from building materials, such as vOCs, naphthalene or formaldehyde,

17
in classrooms is rather unlikely. However, short-term peaks of vOCs can occur due to the use of cleaning reagents and other chemicals indoor. In general, the use of passive diffusion samplers is appropriate for monitoring these pollutants. Compounds which are generated by combustion sources, such as gas or kerosene heaters, include benzene, carbon monoxide and NO2. If combustion sources are present, concentrations of these pollutants can fluctuate widely during a short period of time. Cumulative exposure over a long period of time is important to assess for benzene, a known carcinogen while assessing peak levels is especially important for carbon monoxide which has acute health effects.
Seasonal variations in indoor pollutant concentration are caused by decreased ventilation rates in winter in naturally ventilated buildings or increased emission rates of formaldehyde in the summer due to increased temperature and relative humidity-related factors. Thus, for assessing average exposure levels in schools during the entire school year, it is
advisable to conduct IAQ surveys during both the cold and warm periods. If the purpose of the survey is to assess high level exposures (worst case scenario), monitoring during the cold period is more suitable as concentrations of pollutants from indoor sources, especially combustion sources, tend to be higher in the winter.
The selection of sampling and data analysis methods is based on factors such as available resources, data requirements and time availability for the study. A comparison of information needs vs. costs is essential at the survey design phase for identifying appropriate sampling and data collection techniques, and the number of samples to be collected. An overview of IAQ monitoring projects carried out in Europe in the last 15 years (Table 6) shows that diffusive sampling has been selected in almost all surveys.
Selection of passive sampling devices
In passive diffusion samplers, the sorption rate (the amount of pollutant deposited
Table 5. Summary of WHO IAQ guideline limits for selected pollutants
Pollutant Guideline limit
excess cancer risk
Averaging time
Comment
Benzene No safe level 6x10⁻⁶ per µg m-3 Lifetime Carcinogen
Carbon monoxide 7 mg m-3 24 h
10 mg m-3 8 h
35 mg m-3 60 min
100 mg m-3 15 min
Formaldehyde 100 µg m-3 30 min
Naphthalene 10 µg m-3 1 year
Nitrogen dioxide 40 µg m-3 1 year
200 µg m-3 1 hour
PAH with Benzo[α]pyrene as marker
No safe level 8.7x10⁻⁵ per ng m-3 Lifetime Carcinogen
Tetrachloroethylene 250 µg m-3 1 year
Trichloroethylene No safe level 4.3x10⁻⁷ per µg m-3 Lifetime Carcinogen
Source: WHO Regional Office for Europe (2010b)

18
Table 6. Selected projects involving monitoring of priority pollutants in indoor air.
Project title Information sources Coordinator(s) Time period
Measurement location
Compounds Sampling technique
Measurement duration
Measurement frequency
Sampling location
Avon Longitudinal Study of Parents and Children (ALSPAC)
ALSPAC (2015) Building Research Establishment (BRE), United Kingdom
1991–1992
Avon area (West England)
vOCs, NO2, HCHO
Diffusive 3 days – 4 weeks 12 times per year Private houses
AIrMeX Geiss et al. (2011), Kotzias et al. (2009), Bruinen de Bruin et al. (2008)
JRC IHCPa 2003–2008
11 cities in EU vOCs, aldehydes Diffusive Fixed: 7 days Personal: 3 days
2 times per year (summer/winter)
Offices, schools, private houses, personal
Prioritization of BUilding MAterials emissions as indoor pollution sources (BUMA)
Missia et al. (2010), Bartzis et al. (2008), BUMA (2006)
2006–2009
5 cities in EU vOCs, aldehydes Diffusive Fixed: 7 days Personal: 3 days
2 times per year (summer/winter)
Public offices
eXPOLIS Jantunen et al. (1998), Jurvelin et al. (2000, 2001), Lai et al. (2007), Rotko et al. (2000), Edwards et al. (2001), Hanninen et al. (2004), Expolis (2007)
National Public Health Institute of Finland (KTL) Finland
1996–1997
6 cities in EU vOCs, CO/NOx, PM2.5
Active Personal: 2 days 1 time Private houses, workplaces, personal
Flanders Indoor exposure Survey (FLIeS)
FLIES (2012) Flemish Institute for Technological Research (vITO), Belgium
2006 East Flanders vOCs, NO2, aldehydes, PM
Diffusive 7 days 1 time Private houses
German environmental Survey for Children (GereS IV)
Becker et al. (2008) Federal Environment Agency (UBA)Germany
2003–2005
All over Germany
vOCs, aldehydes Diffusive 7 days 1 time Private houses
Health effects of School environment (HeSe)
HESE (2015) University of Siena, Italy
2004–2005
6 cities in EU vOCs, O3, NOx Diffusive 7 days 1 time Schools
Indoor air quality in homes in england in england
Coward et al. (2001) BRE, United Kingdom
1997–1999
All over England
vOCs, aldehydes, NO2, CO
Diffusive 3 days – 4 weeks 1 time Private houses
Monitoring of Atmospheric Concentration of Benzene in european Towns and Homes project (MACBeTH)
Cocheo et al. (2000) JRC IESb; Fondazione Maugeri
1996–1998
5 cities in EU Benzene Diffusive 5 days 6 times per year Private houses, personal
On the reduction of health effects from combined exposure to indoor air pollutants in modern offices project (OFFICAIr)
Bluyssen et al. (2012); OFFICAIR (2013
University of Western Macedonia
2010–2013
8 cities in EU Health relevant pollutants (including vOCs, aldehydes)
Diffusive and active
5 days 2 times Modern office buildings
l'Observatoire de la qualité de l'air intérieur (OQAI)French 1st plan
OQAI (2014) IAQ Observatory 2003–2005
All over France
vOCs, aldehydes Private houses
Population exposure to Air Pollutants in europe (PeOPLe)
Field et al. (2005), Ballesta et al. (2006); Project PEOPLE (2005)
JRC IES 2002–2003
Selected cities in EU
Benzene Diffusive Fixed: 24 hours Personal: 12 hours
1 time Private houses, shops, schools, restaurants

19
Table 6. Selected projects involving monitoring of priority pollutants in indoor air.
Project title Information sources Coordinator(s) Time period
Measurement location
Compounds Sampling technique
Measurement duration
Measurement frequency
Sampling location
Avon Longitudinal Study of Parents and Children (ALSPAC)
ALSPAC (2015) Building Research Establishment (BRE), United Kingdom
1991–1992
Avon area (West England)
vOCs, NO2, HCHO
Diffusive 3 days – 4 weeks 12 times per year Private houses
AIrMeX Geiss et al. (2011), Kotzias et al. (2009), Bruinen de Bruin et al. (2008)
JRC IHCPa 2003–2008
11 cities in EU vOCs, aldehydes Diffusive Fixed: 7 days Personal: 3 days
2 times per year (summer/winter)
Offices, schools, private houses, personal
Prioritization of BUilding MAterials emissions as indoor pollution sources (BUMA)
Missia et al. (2010), Bartzis et al. (2008), BUMA (2006)
2006–2009
5 cities in EU vOCs, aldehydes Diffusive Fixed: 7 days Personal: 3 days
2 times per year (summer/winter)
Public offices
eXPOLIS Jantunen et al. (1998), Jurvelin et al. (2000, 2001), Lai et al. (2007), Rotko et al. (2000), Edwards et al. (2001), Hanninen et al. (2004), Expolis (2007)
National Public Health Institute of Finland (KTL) Finland
1996–1997
6 cities in EU vOCs, CO/NOx, PM2.5
Active Personal: 2 days 1 time Private houses, workplaces, personal
Flanders Indoor exposure Survey (FLIeS)
FLIES (2012) Flemish Institute for Technological Research (vITO), Belgium
2006 East Flanders vOCs, NO2, aldehydes, PM
Diffusive 7 days 1 time Private houses
German environmental Survey for Children (GereS IV)
Becker et al. (2008) Federal Environment Agency (UBA)Germany
2003–2005
All over Germany
vOCs, aldehydes Diffusive 7 days 1 time Private houses
Health effects of School environment (HeSe)
HESE (2015) University of Siena, Italy
2004–2005
6 cities in EU vOCs, O3, NOx Diffusive 7 days 1 time Schools
Indoor air quality in homes in england in england
Coward et al. (2001) BRE, United Kingdom
1997–1999
All over England
vOCs, aldehydes, NO2, CO
Diffusive 3 days – 4 weeks 1 time Private houses
Monitoring of Atmospheric Concentration of Benzene in european Towns and Homes project (MACBeTH)
Cocheo et al. (2000) JRC IESb; Fondazione Maugeri
1996–1998
5 cities in EU Benzene Diffusive 5 days 6 times per year Private houses, personal
On the reduction of health effects from combined exposure to indoor air pollutants in modern offices project (OFFICAIr)
Bluyssen et al. (2012); OFFICAIR (2013
University of Western Macedonia
2010–2013
8 cities in EU Health relevant pollutants (including vOCs, aldehydes)
Diffusive and active
5 days 2 times Modern office buildings
l'Observatoire de la qualité de l'air intérieur (OQAI)French 1st plan
OQAI (2014) IAQ Observatory 2003–2005
All over France
vOCs, aldehydes Private houses
Population exposure to Air Pollutants in europe (PeOPLe)
Field et al. (2005), Ballesta et al. (2006); Project PEOPLE (2005)
JRC IES 2002–2003
Selected cities in EU
Benzene Diffusive Fixed: 24 hours Personal: 12 hours
1 time Private houses, shops, schools, restaurants

20
Project title Information sources Coordinator(s) Time period
Measurement location
Compounds Sampling technique
Measurement duration
Measurement frequency
Sampling location
SeArCH Csobod et al. (2010) Regional Environmental Center (REC)
2006–2009 and 2010–2013
100 schools in selected cities in 10 countries
vOCs, formaldehyde, NO2, PM10, CO2
Diffusive (except PM10 and CO2)
5 days 1 time Schools
SINPHONIe Csobod et al. (2014) REC, IDMEC-FEUPc, JRC-IHCP, NIEHd
2010–2012
114 schools in 23 countries in Europe
vOCs, HCHO, CO, CO2, NO2, ozone, PM, naphthalene
Diffusive (except CO, CO2, PM)
5 days 1–2 times Schools
French pilot IAQ monitoring project
Michelot et al. (2013) IAQ Observatory 2009–2011
310 schools and day care centres in France (pilot project)
Benzene, formaldehyde, CO2
Diffusive (except CO2)
5 days 2 times (cold and warm seasons)
Schools
WHO Schools Survey WHO Regional Office for Europe (2011)
WHO 2011–2013
volunteering countries in WHO European Region
Benzene, formaldehyde, CO, CO2, NO2
Diffusive (except CO, CO2)
5 days 1 time Schools
CO = Carbon monoxide HCHO = formaldehyde NOx = mono-nitrogen oxides (e.g. NO [nitric oxide] and NO2 [nitrogen dioxide]) O3 = trioxygen (also known as ozone) a JRC IHCP = Joint Research Centre Institute for Health and Consumer Protection b JRC IES = Joint Research Centre Institute for Envirnment and Sustainability c IDMEC-FEUP = Institute of Mechanical Engineering – Faculty of Engineering, University of Porto (Portugal) d National Institute of Environmental Health, Hungary
Table 6 (concluded)

21
Project title Information sources Coordinator(s) Time period
Measurement location
Compounds Sampling technique
Measurement duration
Measurement frequency
Sampling location
SeArCH Csobod et al. (2010) Regional Environmental Center (REC)
2006–2009 and 2010–2013
100 schools in selected cities in 10 countries
vOCs, formaldehyde, NO2, PM10, CO2
Diffusive (except PM10 and CO2)
5 days 1 time Schools
SINPHONIe Csobod et al. (2014) REC, IDMEC-FEUPc, JRC-IHCP, NIEHd
2010–2012
114 schools in 23 countries in Europe
vOCs, HCHO, CO, CO2, NO2, ozone, PM, naphthalene
Diffusive (except CO, CO2, PM)
5 days 1–2 times Schools
French pilot IAQ monitoring project
Michelot et al. (2013) IAQ Observatory 2009–2011
310 schools and day care centres in France (pilot project)
Benzene, formaldehyde, CO2
Diffusive (except CO2)
5 days 2 times (cold and warm seasons)
Schools
WHO Schools Survey WHO Regional Office for Europe (2011)
WHO 2011–2013
volunteering countries in WHO European Region
Benzene, formaldehyde, CO, CO2, NO2
Diffusive (except CO, CO2)
5 days 1 time Schools
CO = Carbon monoxide HCHO = formaldehyde NOx = mono-nitrogen oxides (e.g. NO [nitric oxide] and NO2 [nitrogen dioxide]) O3 = trioxygen (also known as ozone) a JRC IHCP = Joint Research Centre Institute for Health and Consumer Protection b JRC IES = Joint Research Centre Institute for Envirnment and Sustainability c IDMEC-FEUP = Institute of Mechanical Engineering – Faculty of Engineering, University of Porto (Portugal) d National Institute of Environmental Health, Hungary
© Christian Gapp

22
on the cartridge in a given period of time) depends on the diffusion coefficient of a specific analyte, and ratio of the diffusive surface area and the distance between the diffusive and absorbing surface. In general, diffusion samplers with a higher sorption rate require a shorter sampling period to quantify a specific level of pollutant.
Many models of passive diffusion samplers are available commercially. Many of them are designed for monitoring exposures in occupational settings where levels of pollutants tend to be relatively high. In school settings, concentrations of pollutants tend to be lower. At the same time, it is desirable to complete sampling within one school week. Therefore, it is important to select samplers with high sorption rates to be able to quantify relatively low levels of pollutants (below the WHO guidelines) during this time interval.
The choice of appropriate diffusive sampling devices should be based on the following criteria:
a. high sorption rate; using devices with an insufficient sorption rate may lead to an insufficient amount of pollutant in the cartridge and the inability to quantify its air concentration;
b. samplers referenced in ISO or other equivalent norms;
c. user friendliness;
d. sufficiently validated samplers with a history of successful applications in previous similar projects; and
e. availability of external analytical service; some manufacturers offer an analytical service for the diffusive samplers they sell. This allows for samplers to be sent to an external laboratory in case analytical capabilities are not available at the research centre.
Quality assurance / quality control
Comparability of results can only be ensured if the analytical skills of
laboratory staff have been confirmed through inter-laboratory comparison or other external quality control methods. An ideal way to ensure the consistency of results is to analyse all samples in one accredited reference laboratory. However, this is frequently not feasible, due to high transportation costs. It is also desirable to ensure that countries have access to domestic laboratories. Laboratory proficiency testing is useful in identifying laboratories where staff needs to have additional training prior to being included in research projects.
Sampling location
Comparability of measurement results also depends on using consistent rules for selecting appropriate sampling locations. In accordance with ISO 16000-1 the following rules should be followed:
a. the centre of a room is generally considered as the most suitable location for sampling;
b. in case sampling in the centre of the room is not possible, samplers should not be installed closer than 1 m from the wall;
c. the sampling height should be about 1.0 – 1.5 m from the floor; and
d. locations exposed to direct sunshine, near heating sources, or near ventilation channels should be avoided.
At each school, it is recommended to have at least one outdoor sampling site, where monitoring is conducted concurrently with indoor monitoring. Outdoor samplers are placed in special shelters to prevent exposure to sunlight and rain. Comparison of indoor and outdoor concentrations helps to find out if pollution originates mainly from indoor sources.
examples of standard sampling and analysis methods applicable to IAQ monitoring in schools
Benzene (Chemical Abstracts Service (CAS) 71-43-2), trichloroethylene (CAS 79-01-6) and tetrachloroethylene (CAS

23
127-18-4). Reference methods: ISO 16000-5, CEN EN14662-5, ISO 16200-2.Long-term monitoring is in this case the preferred method. Passive samplers are exposed to the air for several days. Benzene and other volatile organic compounds are trapped in an activated charcoal based sorbent. After the sampling procedure, these compounds are recovered with carbon disulphide, and the solution is analysed using a gas chromatograph coupled to a mass selective or a flame ionisation detector.
Formaldehyde (CAS 50-00-0). Reference method: ISO 16000-4. Formalde-hyde (HCHO) has a 30-minute-averaged guideline value which formally requires short-term sampling. However, the likelihood of strong short-term fluctuations in formaldehyde concentration in classrooms is rather low. Thus, the use of passive samplers is an appropriate, affordable option. Passive samplers are exposed to air for several days. Formaldehyde is trapped in a 2,4-dinitrophenylhydrazine based sorbent. After the sampling procedure, formaldehyde is recovered using acetonitrile, and the solution is analysed using a HPLC system coupled to an ultraviolet/visible or diode-array detector.
Nitrogen Dioxide (CAS 10102-44-0). Reference method: ISO 16000-15. Pas-sive samplers are exposed to air for several days. NO2 is trapped as nitrite ion in a triethanol amine based sorbent. The nitrite ion is extracted using water and analysed by spectrophotometry (or ion chromatography) after the extract, having been treated with Griess reagent, sulphanilamide and α-naphthylamine, displays a red/pink colour.
Polycyclic aromatic hydrocarbons (PAHs) including benzo[α]pyrene (CAS 50-32-8) and naphthalene (CAS 91-20-3). Reference methods: ISO 16000-12/13/14, United States EPA TO-13A and method developed by Wauters et al. (2008). The sampling of semi-volatile organic compounds (SvOC), which are partly adsorbed on particles, is typically conducted using high-volume active samplers. The method described by
Wauters et al. (2008) is based on 24-hour active sampling on sorption tubes consisting of polydimethylsiloxane (PDMS) foam, PDMS particles and a TENAx TA bed. After sampling, the solutes (e.g. benzo[α]pyrene) are quantitatively recovered by thermal desorption and analysed by capillary GC-MS. In the United States EPA method, TO-13A, approximately 300 m3 of air is sampled through filters and sorbent cartridges (containing polyurethane foam [PUF] or xAD-2®). The filters and sorbent cartridges are extracted using a Soxhlet extractor and the concentrated extract is analysed using GC-MS. The ISO methods 16000-12/13/14 involve pulling a sample of air through a fine particle filter that contains a vapour trap consisting of polyurethane foam. Filter and PUF extracts are analysed by GC-MS.
Carbon Monoxide (CAS 630-08-0). Reference methods: ISO 4224:2000. Measuring short-term peak levels of carbon monoxide is important in the presence of indoor combustion sources. A variety of monitoring devices using infrared radiation adsorption and electrochemical sensors can be used for real-time carbon monoxide monitoring. Some commercially available monitoring devices for CO2 also have sensors for carbon monoxide enabling real-time monitoring of both pollutants and storage of data in device memory.
3.1.2 Monitoring exposure to mould and dampness
Overview of health effects and risk factors for exposure
Microbial pollution is a key element of indoor air pollution. It is composed of hundreds of species of bacteria and fungi, in particular filamentous fungi (mould), some of which proliferate indoors when sufficient moisture is available. The links between dampness and mould exposure and adverse respiratory health effects are well established (WHO Regional Office for Europe, 2009; Mendell et al., 2011; Tischer et al., 2011; Jacobs et al., 2013; Kanchongkittiphon et al., 2015). Generally, the presence of dampness and visible mould indicates excessive microbial

24
proliferation, which is problematic because it may lead to increased exposure to airborne biological contaminants that can cause adverse health outcomes (e.g. respiratory diseases, allergic reactions) in building occupants (Fisk et al., 2007).
The WHO Guidelines for Indoor Air Quality – Dampness and Mould (WHO Regional Office for Europe, 2009) are formulated on the basis of a comprehensive review demonstrating that exposure to indoor dampness is very common. The review concludes that the most important effects of exposure to dampness and mould are increased prevalence of respiratory symptoms, allergies and asthma, as well as perturbation of the immunological system. In addition to residential buildings, dampness and mould problems occur in school buildings, day-care centres, and other buildings. The Guidelines describe agents that may be associated with adverse health effects: bacterial and fungal spores and cell fragments or components, such as endotoxin and β-glucans, microbial volatile organic compounds (MvOCs) and mycotoxins.
Exposure to visible mould, dampness or mould odour is associated with elevated risks of respiratory symptoms or diseases, such as upper respiratory track symptoms, cough, wheeze, and asthma. Results of meta-analysis of published epidemiological study results, the central estimates of the odds ratio range from 1.34 for asthma development to 1.75 for cough in children, with most estimates being statistically significant (i.e. lower confidence limit for odds ratio exceeding 1) (WHO Regional Office for Europe, 2009a). As the relationships between dampness, microbial exposure and health effects cannot yet be quantified precisely, no numerical, health-based guideline values or thresholds can be recommended. Instead, it is recommended that dampness and mould-related problems be prevented (WHO Regional Office for Europe, 2009a). When problems do occur, they should be remediated because they increase the risk of hazardous exposure to microbes and chemicals.
Observation of moisture damage and/or visible mould in school buildings has been
linked to increased levels of a variety of microbial agents, including viable spores, fungal DNA, mycotoxins, and various markers for microbial exposure, such as ergosterol, 3-hydroxy fatty acids and muramic acid in indoor air (Meklin et al., 2002; Hyvärinen et al., 2003; Lignell et al., 2007; Cai et al., 2009; Peitzsch et al., 2012; Thomas et al., 2012; Jacobs et al., 2013, 2014). The available evidence does not suggest that any measurement of microbial materials is demonstrably more specific or sensitive in terms of measuring health-related exposure.
Factors promoting mould growth and measures aiming at exposure prevention
The term “mould growth” refers to microbial growth in general. Factors contributing to mould growth and dampness in school buildings are not very different from those associated with residential or other indoor environments. The definition of “dampness” from the WHO guidelines (WHO Regional Office for Europe, 2009) is the following:
any visible, measurable or perceived outcome of excess moisture that causes problems in buildings, such as mould, leaks or material degradation, mould odour or directly measured excess moisture (in terms of relative humidity or moisture content) or microbial growth.
The key factor in preventing mould growth is moisture control, since microbial life is water-dependent. Causes of excess moisture in indoor environments include high air humidity, condensation on surfaces and presence of water due to flooding or leakages (Warscheid, 2011). In addition to external sources of water (e.g. rain, ground moisture/water, melting snow) and water supply, sewage, heating or cooling systems, other sources of water include cooking and cleaning, as well as moisture emissions by building occupants. It has been demonstrated that remediation of dampness problems can reduce adverse health outcomes. The primary means for avoiding adverse health effects is prevention (or minimization) of dampness and microbial growth on interior surfaces

25
and in building structures.
The school environment may contribute considerably to the total daily exposure of children to microbial agents and allergens, as exposure levels in schools may be higher than in homes (Jacobs et al., 2013; Krop et al., 2014). High classroom occupancy density has been associated with increased levels of exposure to indoor microbial agents and allergens (Jacobs et al., 2013; Liu et al., 2000). There are large differences in indoor microbial levels between different countries and climatic regions, as well as between school buildings within the same country (Wady et al., 2004; Simoni et al., 2011; Jacobs et al., 2014). Indoor allergens, such as dander from cats and dogs, excrement and residues from dust mites, cockroaches and rodents, and fungal allergens, are also commonly found in school buildings, especially in low-income neighbourhoods and rural areas, although assessing a relative importance of allergen exposure in schools for public health requires further investigations (Salo et al., 2009).
The type of ventilation system and season affect indoor microbial levels in schools (Liu et al., 2000; Wady et al., 2004; Meyer et al., 2011; Jacobs et al., 2013, 2014). Successful moisture control usually requires a sufficient flow of outdoor air for ventilation: to remove indoor-generated pollutants and moisture from indoor air and/or to dilute their concentrations to acceptable levels; and to maintain building integrity.
Proposed data collection via inspections
In lieu of reliable and accurate methods to measure exposure to biological indoor air pollutants directly, many surveys have used observations of dampness and mould as an exposure indicator. Observational data have usually been collected from building owners and occupants using questionnaires, or via conducting on-site building inspections. The Health Effects of Indoor Pollutants: Integrating microbial, toxicological and
epidemiological approaches (HITEA) study involved both questionnaires and inspections, and it compared these two methods for validation purposes (Haverinen-Shaughnessy et al., 2012a). It was recommended that questionnaire based results should always be validated using on-site inspections by trained staff.
A typical school inspection protocol includes the following.
1. Collecting background information about the school building: occupancy, year of construction, type of structure, history of water damage, dampness and mould, IAQ complaints, related investigations and remediation actions.
2. Inspecting the school building: a walk-through utilizing standard checklists and applicable tools (e.g. surface moisture detectors, also known as moisture meters, which measure the moisture content of building materials such as carpet, wood, brick, concrete). During inspection, signs of dampness and mould problems (on walls, floors, ceilings, windows and ventilation, plumbing, and sewage systems) are assessed. Examples of signs include: water leaks, condensation on surfaces, detached covering and finishing materials, blistered paint, discoloured materials, and visible mould growth.
Whereas building inspections in large scale surveys have been limited to the use of non-destructive methods, it should be noted that in many case studies and smaller scale surveys designed to solve indoor environmental quality [IEQ] problems related to dampness and mould, it is often necessary to include destructive methods in building inspections. This is because opening building structures provides more in-depth information about the sources and extent of dampness and mould problems; microbial determination from building materials often provides valuable data.
Adequate training of building inspectors is essential for ensuring the comparability of inspection data produced by different individuals.

26
3.1.3 Monitoring CO2 levels and ventilation rate
ventilation introduces fresh air and re-moves pollutant emissions from occu-pants, furniture, materials, appliances and activities (e.g. using chemical cleaners). Building occupants always generate bio effluent emissions, such as CO2, moisture, vOCs and particles from skin, hair and clothing. vOCs, such as formaldehyde, are also commonly emitted from building materials. Combustion-based indoor heaters emit nitrogen dioxides, carbon monoxide, benzene and other pollutants.
One of the most critical functions of ventilation is to remove moisture from the building. Moisture is emitted by occupants, generated through their activities (e.g. cooking, showering, cleaning), and produced via chronic leaks from the piping, roofs or through basement walls. If this moisture is not sufficiently transported away, it may lead to the growth of moulds and bacteria.
Insufficient ventilation may also lead to complaints from building occupants about “air stuffiness”. This is problematic because air stuffiness is associated with increased infection risk due accumu-lation of viruses and pathogenic bacteria emitted by infected individuals, including those without any symptoms of illness. These exposures to physical, chemical and biological factors may be associated with school absenteeism and reduced learning and academic performance.
The key parameter which is used for assessing air stuffiness in indoor spaces is the concentration of CO2, a gaseous compound exhaled by humans. Perhaps the oldest known recommendation on IAQ and CO2 level is the one developed by Max von Pettenkofer in 1858 (Pettenkofer, 1858). He recommended a maximum level of 1000 ppm for indoor spaces, which is currently also the recommended maximum level in classrooms in Germany (UBA, 2008).
Besides overt health effects caused by exposures to pollutants and biological organisms and toxins, elevated levels
of CO2 may also directly affect the emotional/mental well-being and cognitive performance of pupils. The performance on tasks, which require concentration and are mentally demanding, has been shown to decline when CO2 level increases. A recent double-blinded experimental-controlled study demonstrated that even moderately elevated CO2 levels, which are very common in classrooms, can adversely affect cognitive performance (Satish et al., 2012). Furthermore, a controlled classroom study found that pupils performed faster and more accurately on four different performance tests when they were in rooms with higher ventilation rates (Bako-Biro et al., 2012). Similar associations between the academic performance of elementary school students and ventilation were observed in non-controlled settings (Haverinen-Shaughnessy, Moschandreas & Shaughnessy, 2011; Haverinen-Shaughnessy et al., 2012c).
For the purpose of school surveys, CO2 logging devices which store a continuous time series of sampled values are preferable. Modern devices can store tens of thousands of values, allowing monitoring during an entire school week. At least one week of monitoring is recommended to accurately capture the day-to-day variability in the conditions due to changes in weather, occupant behaviour and other factors.
The most reliable portable CO2 monitoring method is based on non-dispersive infrared (NDIR) sensor technology. Handheld devices can operate on battery power for one to two days, but require external power to operate for a school week. CO2 monitors are prone to calibration errors and, therefore, require comprehensive QA/QC procedures. Some models of CO2 monitors have integrated temperature and relative humidity sensors so that all these parameters can be monitored simultaneously with the same device.
CO2 time-series data can be used to estimate air exchange rates (typically expressed as air exchanges per hour, [hr-1]) in classrooms and, in combination with classroom occupancy data, ventilation

27
rates, which are typically expressed as litre per second per person (lps pp) (Hänninen, 2013).
3.1.4 Monitoring other physical factors (temperature, relative humidity, reverberation time, noise and lighting)
Temperature and relative humidity are important physical factors affecting the sense of well-being. Too low or too high indoor air temperature is associated with performance decrements (Lan et al., 2011). The optimal temperature range depends on the country and season, which may also influence the individuals’ choice of clothing. In winter conditions, temperatures below 19° C have been associated with more than a measurable decrease in academic performance (Berglund, Gonzales & Gagge, 1990). Many countries have requirements for thermal comfort in classrooms that specify minimum and, sometimes, maximum, allowable temperatures (see the WHO Policy Questionnaire, IAQ section, more detailed data). In Germany, the classroom temperature is required to be between 20°C and 26°C (UBA, 2008).
Controlling relative humidity is important for children’s comfort and for the prevention of moisture accumulation, which can lead to mold growth. In general, relative humidity shall be between 30% and 50%. Relative humidity and temperature can be monitored using a single, small-sized device that can run for as long as one year with a single set of batteries.
The reverberation time in the classroom affects speech understandability and
the level of noise, as a function of the Lombard effect; this phenomenon is illustrated in Fig. 2. The reverberation time can be understood as the acoustic card of a given room. It depends on the presence of sufficient sound-absorbing surfaces in the room. Classrooms need to have a short reverberation time so that speech can be understood more clearly. Appropriate reverberation time for classrooms is 0.5 s ± 20% (DIN, 2004). Increased reverberation time results in higher noise levels which can impair speech understandability, adversely affect learning process and induce mood disorders (Schönwälder et al., 2004).
In Germany, exposure to noise in schools, is regulated using lower and upper action levels, which are based on measurements of eight hours average noise level in decibel units using decibel A filters (dB(A)), which reflects the frequency sensitivity of the human ear. The lower action level is 80 dB(A) (recommended measures to reduce exposure), the upper action level of 85 dB(A) triggers mandatory actions to reduce exposure to noise, as specified in the Occupational Safety and Health Regulation (Bundesregierung, 2010).
Bad lighting can cause early fatigue and lead to impaired concentration, adversely affecting the learning process and well-being. In Germany, lighting in classrooms should be at least 300 lux (DIN, 2011).
Table 7 summarizes the most important physical factors affecting the quality of the school environment with German limit values provided as an example of existing national regulations.
3.2 examples of recent and ongoing exposure assessment surveys in the WHO european regionThe list of surveys summarized in this report and their parameters are presented in Table 8.
3.2.1 SEARCH project
The SEARCH (School Environment And
Respiratory health of CHildren) project was a research initiative supported by the Italian Ministry for the Environment, Land and Sea (IMELS) and implemented within the international frameworks of the EU Action Plan on Environment and Health and the WHO Children’s Environment and

28
Health Action Plan for Europe (CEHAPE) (Csobod et al., 2010).
The first phase of the SEARCH initiative was the SEARCH-I project (2006–2009) in six countries. The SEARCH-II project (2010–2013) geographically expanded the SEARCH initiative to four additional countries in eastern Europe, Caucasus and
central Asia (EECCA) region and extended its scope. Data from the two phases have been pooled and the results are based on the analysis of all data from all ten participating countries (Albania, Belarus, Bosnia and Herzegovina, Hungary, Italy, Kazakhstan, Serbia, Slovakia, Tajikistan and Ukraine).
Table 7. Indoor environment in schools: physical factors, measurement methods and reference values
Physical factor Measurement method reference value in Germany
Air exchange rate (ventilation)
CO2 analyser 1 000 ppm
room air temperature Thermo hygrometer 20–26°C
relative humidity Thermo hygrometer 30–50%
reverberation time Analyser for reverberation time 0.5 s ± 20%
Lighting Lux meter 300 lux
Fig. 2. The effect of reverberation on noise and speech understandability – the Lombard effect
Reverberance reduces speech understandability
Reduced speech understandability increases
noise
Increased noise leads to louder speaking
Loud speaking does not improve speech
understandability
Source: Lombard (1911).
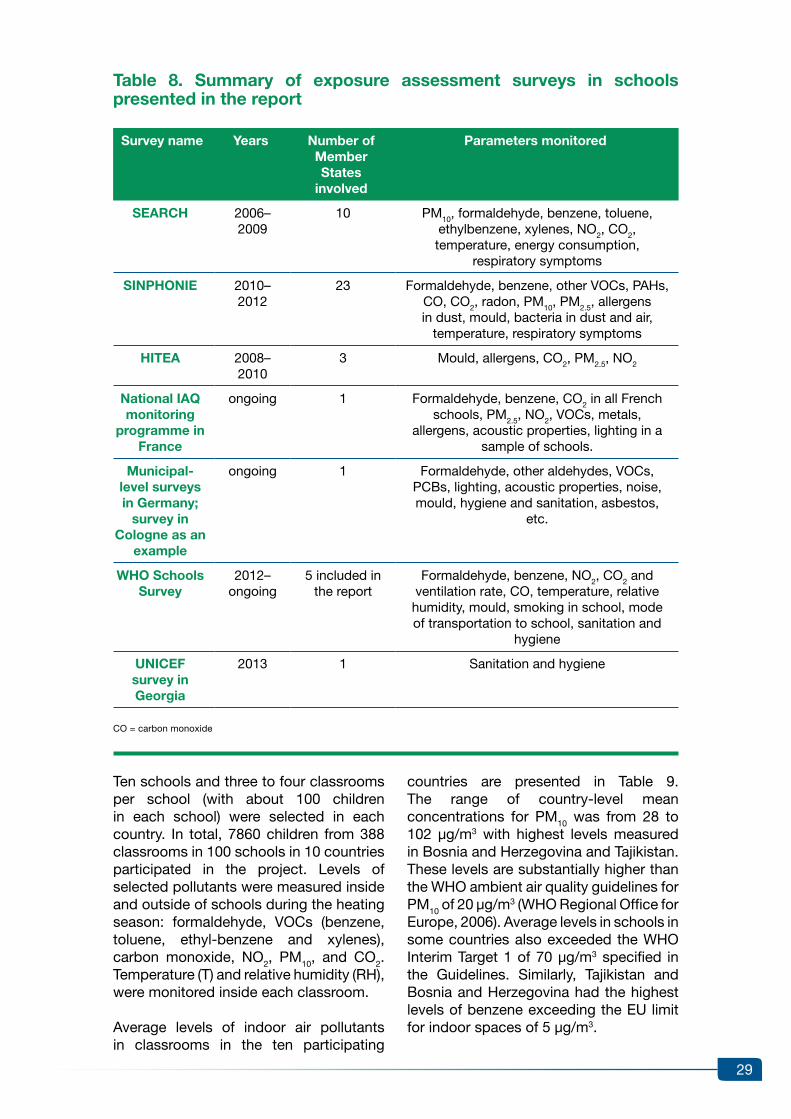
29
Table 8. Summary of exposure assessment surveys in schools presented in the report
Survey name years Number of Member States
involved
Parameters monitored
SeArCH 2006–2009
10 PM10, formaldehyde, benzene, toluene, ethylbenzene, xylenes, NO2, CO2, temperature, energy consumption,
respiratory symptoms
SINPHONIe 2010–2012
23 Formaldehyde, benzene, other vOCs, PAHs, CO, CO2, radon, PM10, PM2.5, allergens in dust, mould, bacteria in dust and air,
temperature, respiratory symptoms
HITeA 2008–2010
3 Mould, allergens, CO2, PM2.5, NO2
National IAQ monitoring
programme in France
ongoing 1 Formaldehyde, benzene, CO2 in all French schools, PM2.5, NO2, vOCs, metals,
allergens, acoustic properties, lighting in a sample of schools.
Municipal-level surveys in Germany;
survey in Cologne as an
example
ongoing 1 Formaldehyde, other aldehydes, vOCs, PCBs, lighting, acoustic properties, noise, mould, hygiene and sanitation, asbestos,
etc.
WHO Schools Survey
2012–ongoing
5 included in the report
Formaldehyde, benzene, NO2, CO2 and ventilation rate, CO, temperature, relative humidity, mould, smoking in school, mode of transportation to school, sanitation and
hygiene
UNICeF survey in Georgia
2013 1 Sanitation and hygiene
CO = carbon monoxide
Ten schools and three to four classrooms per school (with about 100 children in each school) were selected in each country. In total, 7860 children from 388 classrooms in 100 schools in 10 countries participated in the project. Levels of selected pollutants were measured inside and outside of schools during the heating season: formaldehyde, vOCs (benzene, toluene, ethyl-benzene and xylenes), carbon monoxide, NO2, PM10, and CO2. Temperature (T) and relative humidity (RH), were monitored inside each classroom.
Average levels of indoor air pollutants in classrooms in the ten participating
countries are presented in Table 9. The range of country-level mean concentrations for PM10 was from 28 to 102 µg/m3 with highest levels measured in Bosnia and Herzegovina and Tajikistan. These levels are substantially higher than the WHO ambient air quality guidelines for PM10 of 20 µg/m3 (WHO Regional Office for Europe, 2006). Average levels in schools in some countries also exceeded the WHO Interim Target 1 of 70 µg/m3 specified in the Guidelines. Similarly, Tajikistan and Bosnia and Herzegovina had the highest levels of benzene exceeding the EU limit for indoor spaces of 5 µg/m3.

30
For NO2, the average levels ranged from 12 µg/m3 to 22 µg/m3 with the highest average level observed in Serbia. These levels were substantially below the WHO guidelines value of 200 µg/m3 for annual mean level and also below the short-term guideline of 40 µg/m3 for 1-hour average level.
Average concentrations of formaldehyde varied widely among the participating countries from 1.7 µg/m3 in Serbia to 33.1 µg/m3 in Italy. These values are well below the WHO guideline value of 100 µg/m3 for 30 minute average. Although concentrations were measured during one school week, variability of formaldehyde levels in time is likely to be limited as this compound is steadily emitted from certain indoor materials.
Fig. 3 presents the relationships between the indoor and outdoor concentrations of various pollutants in the surveyed
schools. The low ratios for NO2, PM10 and benzene show that main sources of these pollutants were located outdoor (mainly traffic), while higher ratios for vOCs and especially for formaldehyde show that these pollutants were mainly emitted from indoor sources.
The mean floor space per child in all classrooms was 2.0 m2/child. Overcrowding (less than 1.5 m2/child) in the classroom was associated with significant increases in concentrations of several pollutants, such as CO2, benzene, toluene and PM10. In overcrowded classrooms significantly more children suffered from respiratory tract symptoms compared to children in reference classrooms with adequate space (Fig. 4).
Based on the survey results, the following recommendations can be suggested: overcrowding in the classrooms should be
Table 9. Average levels of indoor air pollutants in schools
Pollutant
Alb
ania
Bel
arus
Bo
snia
and
H
erze
go
vina
Hun
gar
y
Ital
y
Kaz
akhs
tan
Ser
bia
Slo
vaki
a
Tajik
ista
n
Ukr
aine
PM10 (μg/m3) 69 28 102 56 82 65 81 80 91 33
Formaldehyde (μg/m3) 5.6 7.5 7.1 2.4 33.1 10.4 1.7 8.7 12.9 11.5
Benzene (μg/m3) 4.1 2.0 6.3 2.2 2.0 6.3 5.9 4.8 7.4 2.5
Toluene (μg/m3) 15.5 6.2 27.6 4.6 5.0 18.1 21.9 29.5 17.4 4.9
Ethylbenzene (μg/m3) 1.2 0.9 1.6 1.6 1.8 1.6 1.6 1.4 1.5 0.8
xylenes (μg/m3) 5.0 5.9 7.7 7.0 7.1 9.1 8.0 5.1 7.0 4.3
NO2 (μg/m3) 12 10 21 16 19 17 22 14 13 12
Source: data from the SEARCH project (Csobod et al., 2010).
avoided; ventilation should be improved by opening windows during each break or, when appropriate, during classes; sources of emissions of formaldehyde and vOCs indoors should be minimized; schools should not be built near roads with busy traffic or other sources of air pollution.
The comfort assessment was a useful tool for collecting information from children about their perceptions of the school environment. The children’s subjective perceptions were well supported by objective measurements of temperature, relative humidity and CO2 concentrations. The results show that 48% of children considered the indoor temperature in

31
classrooms to be higher than optimal (typically, children considered the air temperature to be too high when it exceeded 22° C). Regression analysis of data also demonstrated that poor quality, stuffy air in classrooms was associated with an increase in self-reported headache symptoms in pupils.
Based on the analysis of data on energy consumption in schools, it was concluded that the modernisation of the building structures and heating, ventilation, and air conditioning (HvAC) systems has a large energy-saving potential.
Fig. 3. Average ratios of indoor and outdoor concentrations of pollutants in schools
NO
2
PM
10
Ben
zene
Eth
ylbe
nzen
e
Xyl
enes
Tolu
enes
Form
alde
hyde
0,0
0,5
1,0
1,5
2,0
2,5
3,0
3,5
4,0
4,5
Source: combined data from ten countries which participated in the SEARCH project.
Fig. 4. Percent of children with specific symptoms by classroom occupation density
0
5
10
15
20
25
30
35
40
45
Any chronic Chronic Dry cough Earache Sinusitis cough day/night at night cough
Classroom floor area per child
< 1.5 m2
1.5 m2 or more
Source: data from the SEARCH project

32
3.2.2 SINPHONIE survey
Background and objectives
The SINPHONIE (Schools Indoor Pollution and Health: Observatory Network in Europe) project was conceived as a pilot research project to assess the quality of indoor air in schools and outdoor air in the school vicinity, and to establish a European observatory network focused on school indoor air pollution and health. This multidisciplinary project was conducted during 2010–2012. The project was initiated and funded by the European Parliament. It was carried out under a contract with DG SANCO.
SINPHONIE also aimed at improving IAQ assessments in European schools though developing methods and procedures for surveys. The project used standardized data collection procedures which were implemented by specially trained national survey staff.
The SINPHONIE project had synergies with other concurrent projects such as the European Commission’s PILOT INDOOR AIR MONIT project (Kephalopoulos et al., 2013), the WHO Schools Survey (WHO Regional Office for Europe, 2011) and the SEARCH project (Csobod et al., 2010).
The project also produced recommendations on improving the quality of environment in schools which are described in section 2 of this report.
The project involved the following specific aims:
•measure physical and comfort parameters (temperature, relative humidity and ventilation rate) and chemical and biological pollutants in the indoor and outdoor air in schools and childcare facilities: formaldehyde, benzene, α-pinene and limonene, naphthalene, NO2, carbon monoxide, CO2, radon, trichloroethylene, tetrachloroethylene, PAH and benzo(a)pyrene (BaP), PM10 and PM2.5, allergens in dust and mould, and bacteria in dust and air;
•evaluate the impact of the outdoor air surrounding the school environment, including the effects of transportation, traffic and climate change;
•assess the influence of building characteristics, cleaning products and ventilation systems on the exposure data obtained;
•assess the impacts of outdoor air pollution abatement measures on IAQ in schools;
•obtain data on the health status of children via questionnaires and clinical tests, focusing on asthma, respiratory infections, upper respiratory tract symptoms, coughing, wheezing, dyspnoea, allergic rhinitis, bronchitis and academic performance;
•evaluate the impact of the indoor air in classrooms on children’s health and academic performance;
•develop recommendations and guidelines on remedial measures in school environments.
Methodology
Field surveys were carried out in selected schools in each country (maximum of six schools per country). A total of 114 schools in 23 countries participated in the project (Fig. 5). In each school, three classrooms were assessed. Standardized methodological approaches that were used in all schools were developed building upon methods which were used in other international projects (Kotzias et al., 2005; Franchi et al., 2006; Geiss et al., 2011; Csobod et al., 2010; Kephalopoulos et al., 2013).
The SINPHONIE field surveys involved walkthrough inspections of school buildings, which were followed by the collection of data on school building characteristics. Data on the school environment (operations, occupants’ patterns of activity etc.), and respiratory symptoms/diseases of building occu-pants were collected using questionnaires distributed to teachers, pupils and

33
parents. Specific clinical tests were also administered to pupils.
IAQ characterization involved measure-ments of 16 chemical, physical and comfort parameters and 13 biological contaminants, including endotoxins (one analyte), fungal and bacterial DNA (seven analytes) and allergens (five analytes).
Thirty laboratories in 23 countries were involved in chemical analyses. Each national team delegated monitoring specialists to the Joint Research Centre (JRC) training in May 2011 where they learned sample collection, preparation and analysis methods. The measurements of biological contaminants were conducted at three laboratories in Finland, Hungary and Sweden.
Fig. 5. Countries that participated in the SINPHONIe project
The designations employed and the presentation of this material do not imply theexpression of any opinion whatsoever on the part of the Secretariat of the World Health Organization concerning the legal status of any country, territory, city or area or of its authorities, or concerning the delimitation of its frontiers and boundaries.Dotted and dashed lines on maps represent approximate borders for which there may be not full agreement.
Cartography by Pierpaolo Mudu (WHO)Data Source and map production:© WHO Regional Office for Europe 2015All rights reserved
SINPHONIE project
Non participating
Participating
Night-time ventilation rates were evaluat-ed by analysing CO2 decay curves after the end of the school day. While this method is well suited for estimating the intrinsic air exchange rate of the building, it only applies to periods when the building is not occupied and does not characterize ventilation during classes. Therefore, the results are not presented in this report.
results and conclusions
The SINPHONIE results are described comprehensively in the project final report (Csobod et al., 2014). Briefly, the results of SINPHONIE project are summarized below.
1. Chemical IAQ in classrooms in schools (N = 300):
•IAQ in classrooms varied significantly among the schools and cities in the 23 European countries that participated in the SINPHONIE survey depending on the type, location (neighbourhood environment), age and management (including cleaning practices) of the school buildings.
•67% of inspected schools are located near busy roads.
•The median PM2.5 level in all classrooms in all participating

34
countries was 37 µg/m3, range from 4 to 250 µg/m3. Approximately 65% of classrooms exceeded the WHO ambient air quality guideline. Bosnia and Herzegovina had the highest country-level median value.
•The median of average weekly levels of formaldehyde was 12 µg/m3 (range from 1 to 66 µg/m3). The maximum concentration and the highest country-level median value were detected in Romania, the second highest levels were measured in Poland. The WHO guideline for formaldehyde (100 µg/m3) was not exceeded in any schools.
•The median level of benzene was 2 µg/m3 (ranging from below the method detection limit to 38 µg/m3). The maximum value and the highest country-level median were in Poland. Benzene is a carcinogen with no safe level.
•The median level of naphthalene was below detection limit, the maximum was 31 µg/m3. Bulgaria had by far the highest concentrations with country-level mean and median values exceeding the WHO guideline of 10 µg/m3. Maximum values were also above the WHO guideline in Bosnia & Herzegovina and Greece.
•The median level of NO2 was 11 µg/m3, range from below detection limit to 88 µg/m3. The maximum level was observed in Italy. The maximum level is above the WHO guideline of 40 µg/m3 for annual mean but below the WHO guideline for hourly means, 200 µg/m3.
•For trichloroethylene and tetrachloroethylene, median levels were below the limits of detection while maximum levels were 126 µg/m3 and 81 µg/m3 respectively. The WHO guideline for tetrachloroethylene (250 µg/m3) was not exceeded. Trichloroethylene is a carcinogen with no safe level.
The levels of pollutants in kindergartens
(summarized separately in the SINPHONIE report) were quite similar to the levels in schools described above.
2. Dampness and moisture indicators:
•visible mould growth was present in 7% of classrooms, mould odour in 3%, visible damp in 9%, condensation on window frames in 17% of classrooms; roof leaks were detected in 21% of school buildings.
•Average relative humidity in classrooms in schools was 43%, range from 6% to 98%. Albania had the highest country-level average relative humidity, followed by Malta and Portugal.
•Exposure to biological contaminants including microbial agents and allergens varied widely among countries and schools; due to the lack of reference values classifying exposures as high or low is not straightforward.
3. ventilation in classrooms:
•Most schools (86%) used natural ventilation; 7% of schools used assisted ventilation and 7% of schools used mechanical ventilation.
•Among schools with mechanical or assisted ventilation, 47% used CO2 controlled ventilation (that is in approximately 7% of all schools).
•Mean CO2 level in all classrooms was 1433 ppm; mean CO2 levels above 1500 ppm were found in different geographic regions throughout Europe. The maximum weekly average CO2 level in a classroom was 4,960 ppm.
•In terms of occupation density, 8% of the classrooms were found to be greatly overcrowded, providing less than 1.5 m2/child; 20% of classrooms were mildly overcrowded, providing less than 2 m2/child. The high occupation density is a risk factor for poor ventilation and high air stuffiness

35
(i.e. CO2 concentrations well above 1500 ppm), which could negatively affect children’s health and learning performance.
4. Respiratory symptoms in children:
•There was a high prevalence (3.6%) of ever having had an asthma attack; there is also a considerable proportion of pupils who have had an asthma attack in the classrooms (1.4%).
•Children attending schools with elevated levels of air pollutants are at a greater risk of having respiratory symptoms.
5. Smoking in schools:
•In 5% of schools, smoking is still permitted indoors for adult individuals.
Concerning the impacts of transportation and traffic, it was found that traffic-related pollutants such as PM2.5 and NO2, influence IAQ in schools, especially those located near busy roads. Since the issue of IAQ in school buildings cannot be properly addressed without improving the quality of the ambient air, it is essential that the local/national authorities managing maximise their efforts to ensure that the ambient air meets the WHO guidelines.
Another conclusion is that the use of low-emission materials and other measures to prevent emissions of toxic chemicals in school buildings should be promoted. Specific measures are also recommended to improve ventilation and prevent mould growth. More detailed information on SINPHONIE recommendations is presented in section 2 of this report.
3.2.3 HITEA study
Overview and methods
The objective of the Health Effects of Indoor Pollutants: Integrating Microbial, Toxicological, and Epidemiological Ap-proaches (HITEA) study was to assess the health impacts of indoor exposures on
children and adults in Europe. It involved the collection of comprehensive data on exposures to indoor dampness, and biological and chemical pollutants, which were then combined with extensive data on health outcomes from the HITEA field survey (see below) and from existing population cohorts. The focus was on microbial exposures due to dampness problems in buildings. The roles of allergens, chemicals, cleaning agents, and poor ventilation were also studied.
HITEA included a longitudinal field study in schools in three countries that represented three climatic regions in Europe: Finland, the Netherlands and Spain. The field survey was conducted in 2008–2010. Respiratory health questionnaire data were analysed from more than 9200 pupils and about 650 teachers from 66 schools that were initially inspected for moisture and dampness. Spirometric lung function measurements were conducted in approxi- mately 3800 pupils. More than 500 pupils with asthma or asthma symptoms, and over 180 teachers, were followed in a longitudinal, detailed health survey. In parallel, extensive monitoring campaigns were conducted in the study schools assessing biological parameters (mi-crobes and microbial agents, allergens), chemical parameters (PM2.5, NO and NOx, CO2) and physical parameters (temperature, relative humidity).
School buildings were dichotomized as being affected or not affected by damp-ness and mould. This was done using a gradient classification based on the number, location, extent and severity of damp-ness observations recorded during walk-through building inspections, which also involved surface moisture measurements. This dichotomous categorization was then used in subsequent health effect analyses, assuming all pupils in affected schools were exposed (Borras-Santos et al., 2013).
results
The occurrence of moisture problems in schools was investigated using questionnaires and building inspections. The study findings indicated that,

36
although questionnaires can be used to assess moisture problems in school buildings, they need to be validated by on-site inspection in a subsample of the surveyed buildings (Haverinen-Shaughnessy et al., 2012a). Estimates for prevalence of moisture problems in school buildings were 24% in Finland, 20% in the Netherlands, and 41% in Spain.
Similar results were produced in a national level survey in Finland, involving about 40% of all elementary schools in the country, where signs of damp or mould were reported in 27% of the schools (Haverinen-Shaughnessy et al. 2012b).
Several reports have been published on microbial and allergen exposures, and reporting of HITEA results is still on-going. One key finding is that levels of microbial agents and some allergens in schools appear to be several times higher compared to homes, indicating that the school environment may contribute considerably to the daily exposure of pupils (Jacobs et al., 2013 and 2014; Krop et al., 2014). Microbial exposure in schools varied widely. Factors associated with exposure levels include: type of ventilation system, building characteristics and the intensity of building usage, and climatic conditions. Seasonal effects (particularly in the colder climatic zone) have also been observed. Elevated microbial levels were observed in classrooms with higher occupancy (Jacobs et al., 2014; Krop et al., 2014). Moisture damage in schools has been found to be associated with increased levels of various microbial agents in the classrooms; it may also increase the immunotoxic potential of dust allergens.
Preliminary analyses indicated higher levels of indoor PM2.5 and NO2 in Spanish and Dutch schools, which are likely to be related to higher traffic loads in these countries, as compared to Finland. CO2 levels were highest in Spanish classrooms (median of school-day averages: 1167 ppm; some peaks exceeded 5000 ppm). CO2 levels were substantially lower in the Netherlands (median: 936 ppm) and Finland (median: 603 ppm). Indoor relative humidity levels, assessed during winter,
were the lowest in Finnish schools (median of school-day averages: 15%), and comparable in Spain and the Netherlands (41% and 40%, respectively).
Analyses of health effects in relation to different school-based exposures are currently on-going. An initial report of Borrás-Santos et al. (2013) confirmed earlier findings of the association between exposure to moisture damage in schools and adverse respiratory health effects.
3.2.4 National IAQ monitoring programmes in France
Indoor air quality monitoring in public premises with vulnerable populations, especially in children’s facilities, became a legal requirement in France in 2014. The Observatory for IAQ was created in 2001, with support from the government authorities, in order to set up a system for continuous monitoring of IAQ in indoor environments, including schools and kindergartens. France is the only country in the WHO European Region which has a policy requiring IAQ monitoring key IAQ parameters (formaldehyde, benzene, CO2) in all schools and kindergartens. In addition, in-depth assessments of exposures to environmental factors are conducted in a representative random sample of schools and kindergartens across the country.
National pilot survey in schools and kindergartens
A national pilot survey was conducted in 101 kindergartens (“nursery schools”) and 108 elementary schools, from 2009 to 2011, in order to evaluate the methodology for the full-scale national survey and to provide preliminary estimates of exposure levels for selected pollutants (Michelot et al., 2013).
Formaldehyde and benzene were measured using passive samplers during one school week (from Monday to Friday), during heating and non-heating seasons, in one to eight classrooms in each investigated school. The number of classrooms assessed depended on the size of the school. A building audit was

37
carried out by professional technicians in order to identify sources of emissions.
CO2 levels in classrooms were measured in 10-minute time intervals during two weeks in the heating season. The CO2 concentration data were used to calculate an “air stuffiness index” for each classroom (Ramalho et al., 2013). The level of air stuffiness was represented by a score from zero (fresh air, 100% of CO2 measurements below 1000 ppm) to five (extreme air stuffiness, 100% of CO2 measurements are above 1700 ppm).
very high (2/3 of CO2 measurements above 1700 ppm) or extreme air stuffiness was found in 9.1% of kindergartens and 32.9% of elementary schools (Ramalho et al., 2013). It should be noted that 18% of kindergartens and 19% of elementary schools were equipped with mechanical ventilation (Michelot et al., 2013). Air exchange rates were higher, and the CO2 concentration and air stuffiness were lower, in buildings with mechanical ventilation systems. However, the differences between mechanically and naturally ventilated schools were rather small (Ramalho et al., 2013).
The average weekly concentrations of pollutants were compared with the guidance values set by the French Committee for Public Health for formaldehyde (30 µg/m3 for long-term exposure with remediation actions needed for levels above 100 μg/m3) and benzene (5 µg/m3 for long-term exposure with remediation actions needed for levels above 10 μg/m3). Formaldehyde exceeded 30 µg/m3 in 10.6% of establishments, while benzene exceeded 5 µg/m3 in 2.5% of establishments (Michelot et al., 2013). No establishments had concentrations exceeding the action levels for either formaldehyde or benzene.
Examples of identified sources of formaldehyde emission included activities such as: the use of a cleaning product containing 3% of formaldehyde when the mechanical ventilation system was out of order; and the use of highly-emitting ceiling materials under warm conditions. Examples of identified sources of benzene
emission included: having an air intake of a ventilation system located close to the underground car park air exhaust and having a petrol lawnmower parked inside the school building.
This pilot survey demonstrated that specific recommendations can be provided to building managers to improve the IAQ at little to no cost. Examples of recommendations include: opening windows to improve ventilation, cleaning air filters, and repairing existing mechanical ventilation systems.
Ongoing national survey in a random sample of schools
In June 2013 the Observatory launched a nationwide IAQ monitoring campaign in kindergartens and elementary schools in order to better understand indoor environment quality and comfort in French schools, and to identify building characteristics that affect these parameters.
The campaign is coordinated by the “Centre Scientifique et Technique du Bâtiment” (CSTB – Scientific and Technical Centre for Building), as the technical operator of the Observatory for IAQ. Seven trained teams are working in parallel across France. Approximately ten laboratories are analysing the samples.
The target sample size is 300 schools. The method for selecting schools is a three-stage stratified random sampling design, with the first stage stratified for climatic zone and the second for school type (nursery or elementary) and environment type (urban or rural). In each school, two classrooms are randomly selected for monitoring.
Chemical pollutants are monitored in classrooms during one school week. The list of pollutants includes PM2.5 (mass and number), NO2, volatile and semi-volatile organic compounds (around 60 compounds), and aldehydes. vOCs and aldehydes are also measured outdoor. SvOC, seven metals including lead, as well as dust mite and pet allergens are also measured in settled dust (vacuumed

38
and wiped). In addition, lead is measured in wall coatings. Temperature, relative humidity and CO2 are measured continuously during the sampling week. Light and noise levels are also measured, allowing for a complete assessment of the indoor environment. Detailed inspection checklists, characterizing the building, the classrooms, and the outdoor environment, are filled out by trained survey technicians. Time-activity diaries, as well as a questionnaire on perceived comfort, are completed by teachers. Approximately 70 schools are monitored each year; the survey will be completed in 2016.
Compulsory IAQ monitoring in schools
Under the French law, all schools have to conduct monitoring of IAQ. Formaldehyde and benzene are monitored for one week during the cold season in two classrooms in each school using passive diffusion samplers. CO2 is monitored using automatic monitors with data loggers in order to estimate the air stuffiness index. In the administrative regions, there are commercial service providers that organize sampling, conduct laboratory analysis and prepare data for submission to the programme database at the national Observatory. The first round of monitoring
is currently ongoing.
3.2.5 Municipal-level surveys in Germany
Overview of municipal surveys in schools in Germany
While Germany does not have a national-level monitoring programme in schools, many large German cities have their own monitoring programmes. A Google search using the German key words, Schadstoffe (English: pollutants) and Schulen (English: schools), produced the results shown in Table 10, without any claim or warranty of completeness. It appears that many large cities have systematic monitoring programmes. More detailed information on one of the most comprehensive programmes in the city of Cologne is presented below as an example.
example of a school survey in Germany – municipal school and kindergarten surveillance programme in the city of Cologne
The municipal government of the city of Cologne conducts systematic inspections (active surveillance) of all public buildings and also investigates complaints (reactive inspections) about indoor conditions.
Table 10. results of a non-systematic internet search for school building monitoring programmes in municipalities in Germany
City / Municipality
Indoor air pollutants,
PCB, asbestos
Ventilation(CO2 conc.)
reverbe-ration time
dampness/ mold
electro-magnetic
fields
Bielefeld x x
Bonn x
Borken x x
Bornheim x
Bremen x x x x x
Bremerhaven x
Cologne x x x x x
darmstadt x
duisburg x
düsseldorf x

39
The Cologne programme “Classical Pollutants” was implemented from 1989 to 2003 (Gesundheistsamt Köln, 2000, 2002). Examples of monitored classical pollut-ants include: asbestos, polychlorinated biphenyls (PCB), pentachlorophenol (PCP), lindane, formaldehyde, vOCs, and mold. Monitoring was conducted in 554 public school buildings, including 299 primary/secondary schools and 255 kindergartens. Active sampling was conducted in each school in a representative number of classrooms to monitor levels of air pollutants.
An elevated concentration of at least one pollutant was detected in 25% of the buildings. As shown in Table 11, 9% of buildings had polychlorinated biphenyl (PCB) levels in excess of the German limit
value 1 of 300 ng/m3, and 2.3% of buildings had levels in excess of the limit value 2 of 3,000 ng/m3. Other findings included: 5.2% of buildings had pentachlorophenol (PCP) and lindane levels in excess of the German reference values; 4.9% of buildings had vOC levels in excess of the German guidance values; and 4% of buildings had formaldehyde levels in excess of the German guidance value. In almost one-third (30%) of buildings hygienic and constructional deficiencies were observed. In all cases when elevated exposure levels or other deficiencies were detected, remediation measures were reported to have been conducted.
Based on the experiences in the aforementioned monitoring programme which identified multiple IAQ problems, a
City / Municipality
Indoor air pollutants,
PCB, asbestos
Ventilation(CO2 conc.)
reverbe-ration time
dampness/ mold
electro-magnetic
fields
Frankfurt x x
Gelsenkirchen x
Gießen x
Hamburg x
Hamm x x
Hannover x
Horb x
Karlsruhe x x
Kevelaer x
Kiel x x
Lünen x
Marburg region x
Minden x x
Munich (rural district)
x
Neuss x
Nuremberg x x
Salzgitter x x x
Trier (rural district)
x
Wermelskirchen x
Table 10 (concluded)

40
Table 11. elevated pollutant concentrations in public buildings: data from the “Classical Pollutants” monitoring programme in Cologne, Germany (1989–2003)
Indoor air pollutant Limit value / reference value / guidance value
Number (percent) of buildings with exceedance
of limit value / reference value / guidance value
PCB Limit value 1: 300 ng/m3
Limit value 2: 3 000 ng/m3
50 (9.0%) 13 (2.3%)
PCP, lindane 100 ng/m3 29 (5.2%)
VOC 300 µg/m3 27 (4.9%)
Formaldehyde 0.1 ppm (125 µg/m3) 22 (4.0%)
new programme called “Active Health Care” was started in Cologne in 2004. In addition to the above pollutants, it included data collection on the following environmental factors: mold and dampness, ventilation (CO2 concentration), quality of air conditioning systems, room acoustics (reverberation time, speech intelligibility), lighting, drinking water (cold and hot water), kitchen hygiene, and WASH conditions (Barth et al., 2011; Kaesler et al., 2014). The survey methodology and assessment criteria are summarized in Table 12. The results of the Cologne programme “Active Health Care” up to date are summarized in Table 13.
Providing evidence for the need to make improvements to the indoor environment in public buildings was the main benefit of the “Active Health Care” programme. The detection of health hazards at levels exceeding legally binding threshold values immediately resulted in corrective actions funded from the municipal budget. A proactive approach to avoiding pollution problems has also been developed and implemented. It includes the following two lists of recommendations:
•recommended low emitting building materials for school construction/renovation; and
•low emitting toys, furniture and other items used in schools.
Conclusions
Based on findings from the Cologne programmes, “Classical Pollutants” and “Active Health Care”, as well as findings from similar programmes in Germany, the following school-based exposures have been identified as important factors that affect the health and well-being of pupils and the learning process:
•Elevated CO2 level, an indicator of air stuffiness
•Classical pollutants including asbestos (see the German asbestos regulations [BAUA, 2014] for more information), PCB, wood preservatives (PCP, lindane), vOCs and aldehydes
•Dampness and mold
•Poor room acoustics
•Inadequate lighting
•Inadequate kitchen hygiene
•Inadequate hygiene and sanitation.
The following steps are recommended as a way to move forward:
Step 1: ventilate school buildings properly.
Step 2: Identify buildings with problems listed above and develop a building cadaster describing the following:

41
Table 12. Parameters, measurements, and assessment criteria of the school monitoring programme, “Active Health Care”, in Cologne, Germany
Parameters Measurements Assessment criteria
dampness with / without mold infestation
Structural-physical measurements using analysers (for dampness of building materials) and infrared thermography
Mold measurement by external accredited laboratories according to DIN ISO IEC 17025 (2005)
Mold Remediation Guideline (UBA, 2005)
Ventilation quality CO2-measurements according to vDI 4300-9 (2005)
Guideline for Indoor Hygiene in School Buildings (UBA, 2008)
DIN EN 13779 (2007)
Air conditioning systems Hygiene inspection according to vDI 6022 (2011)
vDI 6022 (2011)
DIN EN 13779 (2007)
room acoustics Measurements according to DIN EN ISO 3382 (2009)
DIN 18041 (2004)
Lighting Exploratory measurement using a lux meter
DIN EN 12464-1 (2011)
Kitchen hygiene Inspection according to Protection Against Infection Act (Bundesregierung, 2013) and Food Law
Protection Against Infection Act (Bundesregierung, 2013)
Food law
drinking water Investigations according to Drinking Water Ordinance (Bundesregierung, 2001) and Protection Against Infection Act (Bundesregierung, 2013)
DvGW Guidelines (DvGW, 2004)
Drinking Water Ordinance (Bundesregierung, 2001)
Protection Against Infection Act (Bundesregierung, 2013)
DvGW Guidelines (DvGW, 2004)
Sanitation and hygiene Inspection according to Protection Against Infection Act (Bundesregierung, 2013), vDI 6000 Bl. 6 (2006)
Protection Against Infection Act (Bundesregierung, 2013) vDI 6000 Bl. 6 (2006)
Chemicals/indoor air pollutants
Depending on problem/question, according to corresponding DIN or vDI regulations
Corresponding DIN or vDI regulations
DIN = Deutsches Institut für Normung (German Institute for Standardization) DvGW = Deutsche vereinigung des Gas- und Wasserfaches (German Technical and Scientific Association for Gas and Water) IEC = International Electrotechnical Commission vDI = Association of German Engineers

42
Table 13. results of the “Active Health Care” programme, Cologne, Germany
Parameters Findings remedial action recommended/taken
dampness with/without mold infestation
Deficiencies in ~30% of school buildings
Recommendation of remediation according to regulations of the Federal Environment Agency
Ventilation quality Pilot study of 35 schools: deficiencies in 80% of schools
Remediation (increase of ventilation area) or implementation of ventilation plans
Air conditioning systems
Pilot study of 50 schools: deficiencies in 64% of schools
Removal of maintenance and constructional deficiencies
room acoustics Assessment based on 241 measurements: 53% of measured values exceeded recommended level
Acoustic retrofitting of sound-absorbent materials
Lighting Deficiencies in 28% of buildings
Recommendation of remediation (to meet recommended German lighting values)
Kitchen hygiene Deficiencies in ~85% of schools
Operators were informed about constructional deficiencies and/or structural deficiencies
drinking water quality Pilot study of 38 schools: 24% of 426 measurements of drinking water quality did not meet the existing standards
Intensive water jetting and re-measure; in single cases constructional modifications were necessary
Sanitation and hygiene Deficiencies in 70% of schools
Operators were informed about constructional deficiencies and/or structural deficiencies
•use of interior building materials with high levels of emission of chemical pollutants;
•use of asbestos-containing materials;
•building design, operation and maintenance problems resulting in indoor dampness and mould;
•room acoustics;
•lighting; and
•unhygienic sanitation facilities and kitchens.
Step 3: Address problems identified in step 2.
Step 4: Develop and implement standards for establishing and maintaining a healthy school environment, focusing on sustainable practices during new construction and renovations. A list of recommended low emission materials would be helpful.
Step 5: Implement standards for regular monitoring, evaluation, and follow-up action.
3.2.6 WHO Schools Survey
Survey objectives and design
The WHO Regional Office for Europe has coordinated the development of survey protocols, training and technical support

43
to facilitate the implementation of school surveys in volunteering countries. The survey aims at closing critical data gaps and producing comparable and consistent data on the school environment. The methodology was developed in collaboration with the European Commission JRC, the Finnish Institute for Health and Welfare (THL) and Women in Europe for a Common Future (WECF) (WHO Regional Office for Europe, 2011) and other institutions. Information about the indicators to be included in the survey, and technical documents outlining its design and methodology were presented at the Extraordinary Second meeting of the European Environment and Health Task Force as background materials describing a supplemental approach for monitoring the implementation of school-related Parma Declaration commitments in volunteering countries (WHO Regional Office for Europe, 2010).
The survey has a stratified clustered design, where geographic strata can be defined according to conditions in a specific country. Geographic clusters are selected using a standardized sampling schema. Schools are then randomly sampled from each cluster, and measurements and inspections are carried out during one school year during the cold season in order to characterize highest levels of indoor pollutants and lowest ventilation rates.
The survey is designed to produce information for the following primary indicators:
•exposure to benzene, NO2 and formaldehyde in classrooms (via IAQ monitoring using passive diffusion samplers)
•exposure to mould and dampness (via school inspections)
•exposure to stuffy air (via CO2 monitoring)
•smoking in schools and on school grounds (via questionnaires for pupils and teachers)
•access to improved and adequately
operated and maintained sanitation facilities (via inspections, and questionnaires for pupils and administration)
•hygienic practices of pupils (via questionnaire for pupils)
•proportion of children going to and from school by different modes of transportation modes (via questionnaire for pupils).
Data collection in participating schools starts with an interview with the school principal or administration officer using a standardized interview form. It is followed by a general inspection of school build-ing(s) to describe structural characteristics, materials, and sources of air pollution, inspection of toilets and hand washing facilities using a standardized check list, and inspection of all indoor premises for mould and dampness using standardized log forms and portable moisture meters. Questionnaires on smoking rules and policies are administered to at least five teachers or employees in each school. Questionnaires for pupils include sections on the mode of transportation to school, smoking (general smoking habits and smoking in the school), and school sanitation and hygiene. It is recommended to administer the questionnaire to pupils age 12 years or older in three classes in each school (typically, 60 to 90 pupils).
During school inspection, three representative classrooms are selected for monitoring of selected indoor air pollutants (formaldehyde, benzene and NO2), temperature, relative humidity and CO2. The selection process takes in account the building’s configuration and its position in relation to busy roads and other pollution sources. In addition, one outdoor site is selected for air quality monitoring. Monitoring is conducted during one school week. Passive diffusion monitors for benzene, formaldehyde and NO2, and automatic CO2 and carbon monoxide monitors are placed in the classrooms on Monday mornings and are collected on Friday afternoons. Classrooms where monitoring is conducted are inspected

44
using a special, more detailed form. In addition, teachers maintain classroom use diaries during the monitoring week.
Standard operating procedures (SOPs) and data collection forms, as well as data analysis procedures and recommen-dations, are available from the WHO European Centre for Environment and Health in Bonn, Germany upon request.
Preliminary survey results
This report includes the results of school surveys, conducted from 2012 to early 2014, in five European countries: Albania, Croatia, Latvia, Estonia and Lithuania. Analysis of data from these pilot surveys was conducted at WHO. A summary of data collection activities in these five countries is provided in Table 14. The average age of pupils who filled out survey questionnaires varied from 13.1 years in Albania to 15.7 years in Estonia. While surveys in Albania, Estonia, Latvia and Lithuania were pilot projects involving limited numbers of schools, the survey in Croatia involved a large number of schools throughout
the country. It was conducted in stages starting with a pilot project in two schools, followed by a two-stage national survey with the first stage involving interviews, inspections and questionnaires for pupils and teachers in almost 200 schools and the second stage involving IAQ monitoring in a subset of 20 schools.
Data from similar ongoing school surveys in several countries (Serbia, Poland, Malta, Lithuania and Latvia) are not included in this report. They will be presented in separate publications.
exposures to indoor chemical air pollutants
Exposures to benzene, formaldehyde and NO2 were monitored using passive diffusion samplers, similar to those used in the SINPHONIE survey. Typically, samplers were installed in three classrooms and at one outdoor size in each school. Due to budgetary limitation, only three surveys in Albania, Croatia and Estonia included monitoring of these chemical pollutants. Carbon monoxide levels
Table 14. Summary of data collection
Parameter
Alb
ania
Cro
atia
est
oni
a
Latv
ia
Lith
uani
a
All
coun
trie
s
Parameter 12 199 4 4 10 229
Total number of schools involved 12 203 4 4 10 233
Interviews with school administration (sanitation, smoking, building characteristics, mould)
660 11 731
257 166 697 13 511
Questionnaires for pupils (sanitation, hygiene, smoking, transportation)
36 972 39 21 50 1118
Questionnaires for teachers (smoking) 12 23 4 4 10 53
Mould inspections, number of schools 42 1170 37 58 254 1561
Sanitation facilities inspected 36 66 12 12 12 138
IAQ monitoring, number of classrooms
Notes: IAQ monitoring in Latvia and Lithuania included CO2 and carbon monoxide only. Some Croatian data, which are still being processed and cleaned for analysis, were not used in this report. Source: unpublished data from the WHO Schools Survey; Egorov et al. (2012).

45
were monitored using carbon monoxide sensors incorporated in some types of CO2 monitors. Measurements were taken every minute. Only data collected during classes were included in analysis.
NO2 levels were well below WHO guidelines in all schools (Table 15). Concentrations were similar at outdoor and indoor sampling sites suggesting that main sources are located outdoor and associated with traffic.
Benzene monitoring results are summarized in Table 16. A relatively high level of benzene (28.3 µg/m3, almost six times higher than the EU limit of 5 µg/m3) was detected in a rural school in Albania where indoor kerosene heaters were used in classrooms.
Formaldehyde levels were also below WHO guidelines in all classrooms (Table 17). The indoor levels were substantially higher than ambient levels confirming the presence of indoor sources of emission.
The levels of carbon monoxide were below the 1 ppm detection limit in most schools, except several rural schools in Albania, where carbon monoxide levels peaked during classes and dropped during breaks indicating the
use of indoor combustion (kerosene heaters). The maximum level was 9 ppm (approximately 10.5 mg/m3), which was maintained only during short time intervals (several minutes). This level is substantially below the short-term WHO guideline values of 100 mg/m3 for 15 minute average and 35 mg/m3 for one hour average. It should be noted, however, that the sample size was rather small: three out of four participating rural schools in Albania reported using indoor combustion heaters. If the use of kerosene heaters is common during the cold season in rural areas of some other countries, which did not participate in the survey, maximum carbon monoxide levels in some classrooms may potentially exceed WHO guideline levels.
exposure to CO2 (stuffy air) and ventilation rates
CO2 levels were measured in three classrooms located on different sides of the building and on different floors in each participating school during one school week, from Monday through Friday. Automatic CO2 monitors with data loggers were installed in places far from windows and doors. Measurements were taken
Table 15. Summary of monitoring results for NO2 (µg/m3)
Country Type Number of schools
Indoor Outdoor
Number of sites
Median 90th percen-tile
Number of sites
Median 90th percen-tile
Albania Rural 4 12 6.1 13.8 4 8.1 8.1
Urban 8 24 6.2 19.6 8 10.9 33.7
estonia Rural 2 6 7.3 13.7 2 4.0 6.5
Urban 2 6 8.4 13.9 2 3.7 4.4
Croatia Rural 10 30 0.9 12.3 10 1.5 22.2
Urban 12 36 2.0 11.3 12 3.1 14.9
Source: unpublished data from the WHO Schools Survey; Egorov et al. (2012).

46
every minute. In addition, teachers in each classroom kept room occupancy diary recording the number and average age of pupils in each class, as well as actual schedule of classes. Each classroom was described in details using standardized classroom inspection form. The room volume, type of ventilation and other pertinent observations were recorded. Data from monitors were automatically uploaded to a specially developed Excel data analysis tool; data from classroom use diaries and classroom volumes were also entered. The tool employs visual Basic macros to fit curves to CO2 data in each classroom and to identify build-up, steady state and decay phases. The standard equations describing the build-up phase and steady state are solved to estimate air exchange rates (in hr-1 units) and ventilation rates in lps pp during classes. The tool also produces a summary of exposure to CO2 (as proportion of person-time spent in each specified interval of
CO2 concentrations) and analyses data on relative humidity, temperature and carbon monoxide, if a CO2 monitor using for data collection had these sensors.
There are no WHO or EU standards on CO2 or ventilation rate applicable to schools. Therefore, the measured values are compared to existing national standards or guidelines. Elevated average CO2 levels, in excess of the 1000 ppm health-based recommended limit in Germany were observed in many classrooms; in some countries pupils spent most of their time at CO2 levels exceeding 1000 ppm or even 2500 ppm (Fig. 6). The highest CO2 levels were measures in Albanian classrooms where highest weekly classrooms averages were above 5000 ppm, the maximum concentration of CO2 which should not be exceeded even during a short interval in schools in the United Kingdom (EFA, 2006). It
Table 16. Summary of monitoring results for benzene (µg/m3)
Country Type Number of schools
Indoor sites Outdoor sites
Number of sites
Median 90th percen-tile
Number of sites
Median 90th percen-tile
Albania Rural 4 12 4.5 28.3* 4 1.9 2.0
Urban 8 24 4.2 7.9 8 4.2 7.1
Croatia Rural 10 30 0.7 11.4 10 0.8 6.0
Urban 12 36 1.0 2.0 12 1.1 1.9
* This is also the maximum level for the survey. Source: unpublished data from the WHO Schools Survey; Egorov et al. (2012).
Table 17. Summary of monitoring results for formaldehyde (µg/m3)
Country Number of schools
Indoor sites Outdoor sites
Number of sites
Median 90th per-centile
Number of sites
Median 90th per-centile
Albania 12 36 6.6 11.5 12 3.3 5.7
estonia 4 12 10.7 14.9 4 1.7 2.2
Croatia 22 66 8.5 15.0 22 2.2 3.1
Source: unpublished data from the WHO Schools Survey; Egorov et al. (2012).

47
Fig. 6. Percent of pupils’ person-time in classrooms spent at specific CO2 concentrations (ppm)
Albania Croatia Estonia Latvia Lithuania0%
10%
20%
30%
40%
50%
60%
70%
80%
90%
100%P
erso
n tim
e sp
ent i
n C
O2
expo
sure
cat
egor
ies
>5000 ppm
2501–5000 ppm
1001–2500 ppm
0–1000 ppm
appears that the main reason for the very poor ventilation was the lack of adequate heating and, as a result, very low indoor air temperature during the cold season. In some classrooms, air temperature in the morning was below 10° C.
An example of CO2 monitoring data in an inadequately ventilated classroom showing CO2 reaching a maximum level of almost 10 000 ppm is presented in Fig. 7. Blue points mark the start of each class. Note the lack of CO2 decay events during two morning breaks indicating that the classroom was not properly ventilated during these breaks.
The CO2 level continued rising through the entire school day.
The results of analysis of ventilation rates based on CO2 monitoring, classroom volume and classroom occupancy data are presented in Table 18. More than half of the inspected classrooms had ventilation rates below the European Norm (EN) and Federation of European Heating, ventilation and Air Conditioning Associations (REHvA) limit value (3 lps pp), and almost 80% had ventilation rates lower than the American Society of Heating, Refrigerating, and Air-
Fig. 7. example of CO2 accumulation in a classroom with poor ventilation
7:00 8:00 9:00 10:00 11:00 12:00 13:00
8:00
9:50 10:4311:37 12:27
3 2012-1-2012300
10300
8300
6300
4300
2300
300
CO
2 le
vel (
ppm
)
8:55
Source: unpublished data from a selected school in the WHO Schools Survey.

48
Table 18. Overview of air exchange and ventilation rates from the WHO Schools Survey pilot studies (2011–2013)
Country
Sch
oo
ls
Cla
ssro
om
s
Sch
oo
l day
s
Air
exc
hang
e ra
te (h
-1)
Vent
ila-t
ion
(lps
pp
)
Cla
ssro
om
s w
ith
vent
ilati
on
< 3
lps
pp
Cla
ssro
om
s w
ith
vent
ilati
on
< 7
lps
pp
Albania 12 36 139 1.9 2.1 86 % 97 %
Croatia* 2 6 13 4.3 10.1 0 % 0 %
estonia 4 12 26 2.8 9.7 10 % 40 %
Latvia 4 12 38 1.9 4.5 33 % 92 %
Lithuania 4 12 79 3.3 7.7 8 % 58 %
Total 26 78 295 2.4 4.7 51 % 79 %
*Only results from a pilot survey in two schools are included. The main survey in Croatia included CO2 monitoring in 20 more schools (60 classrooms); data analysis is in progress. Source: unpublished data, WHO Survey in Schools; Hanninen et al. (2012).
Conditioning Engineers (ASHRAE) standard (7 lps pp).
exposure to mould and dampness, relative humidity and uncomfortable temperature
The WHO Schools Survey aimed at estimating the percentage of pupils at the country level who are exposed to dampness or mould in schools. Data collection was based on a systematic walkthrough of the buildings, standardized documentation of visual observations and surface moisture measurements using special moisture monitors. To the extent possible, inspections were conducted in all indoor premises in each school (including classrooms, hallways, bathrooms, and unoccupied spaces, such as basements).
Moisture content of interior building materials was measured using portable surface moisture meters. In each room, several measurements were taken from the floor and walls. If an area with elevated moisture content was detected, more measurements were taken to determine its boundaries and to estimate its area in square meters.
The protocol of the WHO survey combined building inspections with questionnaires
and interviews. This helped to overcome problems associated with reporting bias and inaccuracy, while simultaneously taking into account the long-term perspective and breadth of background knowledge of the building administrators. Microbial determinations were not included in this survey. Data were entered in Excel forms or uploaded to a relational database (in this case, a SQL database). Analysis of data was conducted using a specially developed Excel data analysis tool or an SQL query.
Building upon the HITEA study experience, the WHO Schools Survey involved the development of a more detailed exposure assessment approach. Instead of dichotomizing entire schools as affected or not affected, the WHO schools survey dichotomised individual class rooms and other premises. Each room was dichotomized as “affected” or “not affected” based on a ratio of the area affected by mould/dampness to the floor area of the room. If mouldy odour was present, then the room was classified as “affected”. Standard usage coefficients for different types of spaces, ranging from one (for regular classrooms) to 0.1 (for indoor premises which are only occasionally used by pupils) and room floor area data were used to estimate the proportion of person-

49
time that pupils spent in mould/dampness-affected spaces in each school. At the country level, the proportion of school time that pupils spend in affected spaces was estimated by taking into account the number of pupils in each participating school (Table 19).
Relative humidity in classrooms was measured during one school week in one to three classrooms per school using data loggers with relative humidity sensors.
Average values for the entire monitoring period (including nights) were estimated. Temperature was also measured and recorded during one school week using temperature sensors with data loggers (they were integrated in CO2 monitors). Average temperature values were estimated for school time (excluding nights) to assess pupils’ exposure to uncomfortable temperature in classrooms.
An example of classroom temperature and
Table 19. Country-level estimates of the percent of time that pupils are exposed to mould and dampness in schools
Country Number of schools inspected
Total number of pupils
Overall percent
person-time exposed
Lowest percent
person-time exposed in a
school
Highest percent
person-time exposed in a
school
Albania 12 7 440 46.1% 0% 77.4%
Croatia 23 10 750 15.8% 0% 71.5%
estonia 4 958 6.5% 0% 12.9%
Latvia 4 1 650 36.0% 20.4% 66.4%
Lithuania 10 5 606 4.5% 0% 15.7%
Source: data from the WHO Schools Survey
relative humidity fluctuations in a classroom without heating system is presented in Fig. 8. In the morning the temperature was 7 °C and then it increased up to 15 °C during the day. Moisture emitted by the occupants also raised the relative humidity to over 80%. The average CO2 level during classes in that classroom was almost 6000 ppm and median ventilation rate was less than 1 lps pp.
In most (90%) classrooms in the Albanian survey, the average temperature during classes in winter was substantially below the 18° C Albanian minimum temperature standard for schools (information on the standard from the WHO policy questionnaire); the lowest weekly average temperature during classes was 10.1° C while the minimum temperature (usually at the beginning of classes in the morning) was as low as 6° C. In such schools, the
lack of proper heating resulted in poor ventilation because windows were kept closed.
It should be noted that Albania was the only middle-income country which completed a school survey using the WHO protocol. It is likely that similar winter-specific problems exist in some other countries with similar socioeconomic conditions for which comparable data are not available. The Albanian survey demonstrates the need to close this data gap and, if problems with low indoor temperature, mould and dampness or poor ventilation are demonstrated, to design targeted interventions to improve conditions in schools.
Sanitation and hygiene in schools
Data on sanitation and hygiene

50
were collected using three methods: questionnaire for pupils, inspection of toilets and hand washing facilities by survey staff, and questionnaire for school administration. Survey staff used standardized checklists to assess all toilets and hand washing facilities in all
participating schools. The cleanliness of facilities, availability of water, soap, toilet paper, hand driers or towels, presence of adequate light, level of privacy (cabins with doors which can be locked from inside) and other parameters were initially evaluated at a school level; country level
Fig. 8. example of temperature and relative humidity patterns during two school days in a non-heated classroom
0
5
10
15
20
25
0102030405060708090100
6:00 12:00 18:00 0:00 6:00 12:00 18:00 0:00 6:00
Time of the day
Tem
pera
ture
[°C
]
Rel
ativ
e hu
mid
ity (%
)
(°C)
(%)
Source: data from one school in the WHO Schools Survey
parameters were estimated taking in account the size of each participating school. Questionnaires for pupils were used to collect data on their satisfaction with sanitation facilities, usage of facilities, availability of soap and toilet paper. School administrators answered standard questions on the type of toilets and hand washing facilities, and on maintenance and operation practices. Data from the survey were entered in Excel forms and analysed using standardized approaches.
Selected results of pupils’ questionnaires are presented on Fig. 9. Insufficient availability of toilet paper and soap for hand washing were commonly reported problems in all countries. A majority of pupils in each country were not satisfied with school toilets; Albanian pupils had the lowest level of satisfaction. Girls were more likely to report using toilet daily than boys in all countries except Albania. Also, girls were more likely to be satisfied with privacy in toilets in four out of five surveys (except Croatia). In Albania, Croatia and Estonia, pupils in rural schools provided
more favorable responses to most questions (except the availability of water for hand washing) than in urban schools. In Latvia and Lithuania, the pattern was inverted with urban pupils providing substantially more favorable answers to most questions. Further surveys in Albania, Latvia and Lithuania are expected to produce data on bigger numbers of schools and to more reliably characterize urban-rural contrasts in sanitation and hygiene in schools.
The results of pupils’ questionnaires are corroborated by the results of inspections (selected data are shown on Fig. 10). None of the 42 Albanian school toilets inspected had sufficient toilet paper or comfortable temperature (inspections were conducted in winter) while no hand washing facility had sufficient soap. The differences between urban and rural schools were minor with the exception of the availability of toilet paper and soap in Lithuanian schools were the situation appeared substantially better in urban schools (67% vs. 21% of toilets had sufficient amount

51
Fig. 9. Percent of pupils who answered positively to selected questions about sanitation facilities in schools
0%
10%
20%
30%
40%
50%
60%
70%
80%
90%
100%
Satisfied Use school Toilet paper Toilets There is Soap is Water is Hand with school toilets always are clean privacy available always washing toilets daily available in toilets for hand available rooms washing for hand are clean washing
Satisfied Use school Toilet paper Toilets There is Soap is Water is Hand with school toilets always are clean privacy available always washing toilets daily available in toilets for hand available rooms washing for hand are clean washing
Satisfied Use school Toilet paper Toilets There is Soap is Water is Hand with school toilets always are clean privacy available always washing toilets daily available in toilets for hand available rooms washing for hand are clean washing
Satisfied Use school Toilet paper Toilets There is Soap is Water is Hand with school toilets always are clean privacy available always washing toilets daily available in toilets for hand available rooms washing for hand are clean washing
0%
10%
20%
30%
40%
50%
60%
70%
80%
90%
100%
0%
10%
20%
30%
40%
50%
60%
70%
80%
90%
100%
0%
10%
20%
30%
40%
50%
60%
70%
80%
90%
100%
Boys, rural and urban
Girls, rural and urban
Rural, boys and girls
Urban, boys and girls
Albania
Croatia
Estonia
Latvia
Lithuania
Source: data from the WHO Schools Survey

52
of toilet paper and 83% vs. 21% of hand washing facilities had soap).
Smoking in schools
Data on the smoking behaviour of pupils were collected using questionnaires for pupils, which were administered in three
classes in each participating school. The questionnaire included questions on general smoking behaviour, which were adopted from the Global youth Tobacco Survey (GyTS). In addition, there were specially designed questions for assessing smoking inside the school building, in the school yard or elsewhere during the school hours.
Fig. 10. Selected results of inspections of sanitation facilities in schools
0%
10%
20%
30%
40%
50%
60%
70%
80%
90%
100%
Enough Cabins Comfortable Lights Toilets There are Enough toilet have temperature work seats are garbage soap paper locks clean bins
Albania
Croatia
Estonia
Latvia
Lithuania
Per
cent
of f
acili
ties
Source: data from the WHO Schools Survey
Questionnaires were given to pupils, age 11 years and older, by survey staff (rather than teachers) in order to maintain confidentiality. There were no personal identifiers in the questionnaire except gender and age.
The rate of smoking increased with age steeply (Fig. 11). In every age category, only a subset of pupils who reported smoking in any place at least once during the past month also smoked in the schools at least rarely. Overall, from almost half of all pupils who smoke in general also smoke in the school or on the school territory during school hours. Proportions of smokers who smoke in the school were rather similar in all participating countries ranging from 40.1% in Latvia to 46.5% in Lithuania. Some of the highest age-specific prevalence rates of smoking in general and smoking in the school were reported in Croatia. Almost one-third (29.4%) of Croatian pupils who smoke in the school do it every school day.
In addition, a short questionnaire form on smoking prevention rules was administered to teachers or other school personnel (minimum of five individuals per school). The data from this questionnaire were summarized as proportion of positive responses to each question, at the school and national levels. The results presented on Fig. 12 show proportions of school employees who answered positively to questions about smoking policies in schools. In all five countries, most responders believed that pupils are not allowed to smoke inside schools. However, substantial proportions of respondents in some countries believe that school employees are allowed to smoke outside school building on the school property during school hours.
More detailed results of analysis of teachers’ questionnaires will be presented in WHO reports on school surveys. Similar questionnaire forms for teachers developed by WHO were incorporated in

53
Fig. 11. Percent of pupils who reported smoking in general and smoking in the school or on the school ground, by age
Albania
Estonia
Lithuania
Croatia
Latvia
0%
10%
20%
30%
40%
50%
60%
70%
0%
10%
20%
30%
40%
50%
60%
70%
0%
10%
20%
30%
40%
50%
60%
70%
0%
10%
20%
30%
40%
50%
60%
70%
0%
10%
20%
30%
40%
50%
60%
70%
12 or 13 14 15 16 17 18 or less more Age of pupils, years
12 or 13 14 15 16 less Age of pupils, years
12 or 13 14 15 16 17 less Age of pupils, years
13 14 15 16 17 18 or more Age of pupils, years
12 or 13 14 15 16 17 less Age of pupils, years
Smoke in general
Smoke in school
Source: unpublished WHO Schools Survey data.
the latest round of the GYTS. The results are currently being analysed.
Mode of transportation to schools
Data on the mode of transportation to schools were collected using questionnaire for pupils which were administered to three classes in each participating school. Pupils had to select
the most common transportation method to schools from among four options: walking, cycling, using private car and using public transport.
Among all countries surveyed, Albania had the highest proportion of pupils walking to schools, both in rural and urban areas (Fig. 13). The use of bicycles was very uncommon in both rural and urban areas

54
Fig. 12. Percent of school employees who answered positively to questions about school smoking bans
0%10%20%30%40%50%60%70%80%90%
100%
Albania Croatia Estonia Latvia Lithuania
Smoking is banned for:
Students inside school
Students on school ground
Employees inside school
Employees on school ground
Per
cent
of p
ositi
ve re
spon
ses
Fig. 13. Percent of pupils using different modes of transportation (cycling, private car, public transport or walking)
0%
10%
20%
30%
40%
50%
60%
70%
80%
0%
10%
20%
30%
40%
50%
60%
70%
80% cycle
walk
private car
public transp.
cycle
walk
private car
public transp.
Albania Croatia Estonia Latvia Lithuania
Albania Croatia Estonia Latvia Lithuania
Rural schools
Urban schools
Source: data from the WHO Schools Survey.

55
in all five countries, suggesting the need to facilitate the use of this health-promoting and environmentally friendly mode of transportation. Further information on the presence of bicycle lanes, secure bicycle parking places at schools, and other infrastructure would need to be collected in order to identify specific areas for improvement.
3.2.7 National survey of sanitation and hygiene in public schools in Georgia
Background
Improving WASH and infrastructure conditions is an important component of education policy in Georgia. The national WASH survey in schools was conducted by the Educational and Scientific Infrastructure Development Agency (ESIDA) and UNICEF as an important step forward in this regard (UNICEF, 2013). The goals of the survey were to collect data on WASH infrastructure in the general education public schools and on hygiene behaviour in school pupils.
Survey design
The UNICEF methodology of Global Evaluation and Monitoring of WASH Conditions was applied in this survey. This methodology includes three basic methods of data collection:
1. face to face interviews with school principals/administrators;
2. facility inspection and pupils’ hygiene behaviour observation (quantitative components); and
3. focus group discussions involving pupils and teachers (qualitative component of the survey).
For the quantitative components the sample size was 600 schools. The survey used stratified random selection of schools. All schools in Georgia were divided into 35 strata, and 600 schools were drawn proportionally from all strata using weighted random selection. For
the qualitative component, focus group discussions were held with school teachers and pupils in the capital city and three selected administrative regions.
Summary of results
More than 70% percent of public schools have access to a piped water supply either inside or outside school buildings. However, only 30% of all schools (61% of schools in urban areas and 15% of schools in rural areas) have water pipes installed inside the school buildings. Four percent of schools in urban areas and 12% in rural areas use unimproved water sources as their main source of water; 6% of schools in rural areas have no water sources at all. In one administrative region the situation was especially problematic with 24% of all inspected schools having no water source.
The proportions of schools using unimproved sanitation (e.g. pit latrine without slab or bucket) were 9% in urban areas and 20% in rural areas. In addition, 0.2% of schools in rural areas had no toilets at all. Only 31% of the schools had sanitation facilities inside the school building. In general, Georgian public schools have a number of toilet compartments that are not sufficient for the number of pupils. In all schools there are, on average, 35 pupils per toilet seat/compartment (WHO recommends that there should be no more than 25 pupils per toiled seat). In most schools (with the exception of some small schools in villages) there are separate toilets for boys and girls. Concerning the access of children with physical disabilities to the toilets, the situation generally is not satisfactory, as practically no schools had special arrangements for this category of children.
There is no possibility to wash hands in 11% of schools countrywide. Some administrative regions had almost 30% of such schools. Hand wash facilities located inside the school building were found only in 41% of all schools and in 46% of schools with piped water supplies. Approximately 70% of schools have hand wash facilities inside the toilet compartment or nearby.

56
Conclusions
The results of the survey demonstrate that most Georgian public schools do not meet the international standards for WASH in schools. The conditions are better in urban areas (especially in the capital city, Tbilisi) compared to rural areas. Targeted interventions are
urgently needed to improve the situation. According to the opinions of different groups of stakeholders (school principals, teachers and pupils), the most important prerequisites for improving sanitation and hygiene conditions in schools are infrastructure rehabilitation and introduction of hygiene education.
© Andrey Egorov

57
4. Summary of exposure to eH risk factors in schools
4.1 exposure to chemical indoor air pollutantsThe available data demonstrate that levels of main indoor pollutants are below the WHO Indoor Air Quality Guidelines in most schools. However, exposure surveys also demonstrated elevated levels of specific pollutants in some classrooms exceeding the WHO guidelines.
The levels of formaldehyde are well below the WHO guideline of 100 µg/m3 in almost all classrooms. While earlier surveys (e.g. the school survey in Cologne in the late 1990-s early 2000-s, demonstrated that a sizable proportion of schools had high levels of this chemical exceeding the WHO guideline level (which was introduced later), more recent surveys, such as SINPHONIE, WHO Schools Survey and national pilot survey in France did not detect concentrations in excess of the WHO guideline. There is an important data gap in the eastern part of the Region and in low- and lower-middle-income countries. The use of low emission materials in schools and other source control measures should be further promoted across the Region in order to prevent potential episodes of high level exposure.
Pupils are also exposed to carcinogenic compounds in schools, such as benzene. While there is no WHO guideline values for this carcinogen (no safe level), a substantial proportion of schools have benzene levels exceeding the EU standard
of 5 µg/m3. The use of indoor combustion for heating may be an important source of exposure in winter in schools which lack central heating systems. While the use of indoor combustion devices, such as kerosene heaters, may be a common practice in some Member States, benzene monitoring data are not available in most low- and lower-middle-income countries.
Exposures to NO2 are mainly related to outdoor traffic sources in most schools. While the surveys presented in this report did not identify schools with NO2 levels in classrooms exceeding the short term WHO guideline level (200 µg/m3 one-hour average); however, weekly average concentrations in some schools in two countries which participated in the SINPHONIE survey exceeded the WHO guideline for long-term exposure (40 µg/m3 for one-year average). It should be noted that the available data do not characterize many countries with limited resources, where indoor combustion sources may be used in some schools during the cold season resulting in high NO2 levels. Limited available data on IAQ in rural schools in some south-east European countries show that the use of kerosene heaters in classrooms may also be associated with exposure to carbon monoxide, although the levels tended to be below the WHO guidelines for this compound.
4.2 exposure to dampness/mould in schoolsCurrently available data on exposure to mould/dampness in schools across the WHO European Region are poorly comparable due to the use of different
monitoring methods and data analysis and interpretation approaches. Recently conducted multi-national HITEA and SINPHONIE surveys, as well as the ongoing

58
WHO School Survey, and municipal surveillance programme in Cologne (an example of city-level surveys in Germany) all used different methodologies. None of these surveys can be considered fully representative of the populations of school pupils in participating countries, as typically only a limited number of schools were included and the selection of schools was not fully random. For example, the methodological differences make it difficult to compare the results of HITEA with the results of WHO School Surveys without additional analyses of crude data. There is an urgent need to develop and apply harmonized inspection and data analysis approaches in order to produce comparable data suitable for integration in reference datasets.
Based on the available information, it appears that exposure to mould in schools is a widespread problem and, therefore, a large number of exposed pupils are at risk of developing adverse health effects. It also seems that the availability of local expertise in identifying dampness and mould problems, and resources for addressing them are limited in some countries. Training and awareness building measures are needed to improve surveillance and support targeted interventions.
Existing data are not sufficient for making conclusions about the magnitude of detrimental effects of school-based exposure to dampness and mould on children’s health in the European Region. Data from low- and lower-middle-income countries are especially sparse. Given that the mould and dampness problems appeared to be most common in schools in a middle-income country in southeast Europe which participated in the WHO Schools Survey and in the SINPHONIE survey, and that data from many other countries with similar socioeconomic conditions are not available, it is imperative to support efforts aiming at closing this data gap.
The WHO guidelines for indoor air quality: dampness and mould (WHO Regional Office for Europe, 2009a) identified three goals for controlling indoor moisture.
These goals, which are equally applicable in schools and residential buildings, are to:
1. control liquid water;
2. manage indoor humidity levels and condensation; and
3. carefully select building materials and hydrothermal assembly designs that minimize moisture problems.
Effective control of liquid water intrusion required specific measures during building design, construction, operation and maintenance stages. This involves establishment and maintenance of barriers preventing direct water entry and barriers to control moisture migration by capillary action (i.e. capillary breaks), control of condensation and indoor humidity levels through proper heating, ventilation and air-conditioning. ventilation systems are intended to control the thermal environment, humidity and indoor pollutant levels. However, if not properly designed, installed and maintained, ventilation systems may actually contribute to moisture problems. This is because ventilation affects air and moisture flow in the building envelope and produces pressure differences within the building. Building materials should be chosen so as to minimize the risk of mould growth and dampness problems. Where moisture damage and or mould are observed, the source of excess moisture needs to be identified and removed. Affected building materials need to be cleaned or removed, depending in the degree of mould contamination.
School administration is responsible for providing a healthy workplace and learning environment, free of excess moisture and mould. Informing key stakeholders about the health significance of IAQ and factors that cause indoor air pollution is important for facilitating effective actions aimed at maintaining clean indoor air. Many of these actions are beyond the power of the individual building user and must be taken by public authorities through the relevant regulatory measures concerning building design, construction and maintenance,

59
and through adequate housing and occupancy policies.
Dampness and mould may be particularly prevalent in poorly maintained buildings in low-income areas. Prevention and remediation of exposure in disadvantaged
populations should be given a priority. Recommendations for specific climatic, economic and historic regions should be developed in order to efficiently control dampness-mediated microbial growth in buildings and to ensure desirable IAQ at manageable costs.
4.3 CO2 levels and ventilation in classroomsData on CO2 levels in classrooms are not collected on a regular basis in most countries. The most extensive national monitoring programme, which was recently initiated in France, will involve measurements of CO2 levels in every school and kindergarten in the country. While some high-income countries, such as Finland, have a substantial proportion of schools equipped with mechanical CO2-controlled ventilation systems, natural ventilation remains the most common ventilation method in the Region.
The available data show that poor ventilation and exposure to stuffy air are very common in many countries during the cold season. According to the results of SINPHONIE and WHO Schools Survey, the highest levels of CO2 were detected in classrooms in a middle-income country in south-eastern Europe where levels about 5000 ppm (the maximum allowable peak level in the United Kingdom) were rather common. A combination of study air with very low indoor temperature and high relative humidity, which were detected in the same schools, makes a rather uncomfortable environment which is likely to have a strong detrimental impact on the learning efficiency and well-being of pupils. Recent studies demonstrated
that exposure even to lower CO2 levels (e.g. 2,500 ppm) is linked to reduced performance at various cognitive tests in children.
Technical and operational requirements for ensuring sufficient ventilation may include establishing the following: minimum number and surface area of vents in natural ventilation systems; minimum number of windows/window surface area; functioning heating systems and temperature controls; specifications of mechanical systems (e.g. exhaust only- or two-way systems); protocol for opening windows during classes and breaks; and CO2-based demand-controlled mechanical systems. In practice, increasing teachers’ awareness may also have substantial impact on the ventilation practices. Potential interventions to meet this aim include using non-logging display-only devices and traffic light indicators to inform teachers about the IAQ conditions and prompt them to take measures improving ventilation (e.g. opening windows or doors). Detailed recommendations and tools for ventilation in schools developed by the United States EPA (EPA, 2012) can be used to develop targeted interventions.
4.4 Sanitation and hygiene in schoolsSanitation and hygiene in schools remains a high priority in the WHO European Region. Recent surveys demonstrated the need for more targeted interventions, especially those aimed at rural populations in resource-limited areas. Problems with access to adequate hygiene and
sanitation in schools persist despite the existence of comprehensive policies and regulations. Poor sanitation facilities in schools and poor hygiene are associated with transmission of infectious diseases and may adversely affect pupils well-being and, potentially, learning process.

60
While all countries have policies setting requirements for inspections of sanitation facilities in schools, very limited consistently collected data are available for international comparisons. Results of recent or ongoing surveys using standardized methodology developed by WHO and UNICEF demonstrated serious problems, especially in countries with limited resources. WHO surveys demonstrated high levels of dissatisfaction with school toilets among pupils in all five participating countries ranging from 55% to 90%. A majority of pupils in each country reported a lack of toilet paper. According to the results of UNICEF survey, almost 30% of schools in Georgia do not have access to piped water supply, only 15% of schools in urban areas have access to piped water inside school buildings while 20% of rural schools use unimproved sanitation. Overall, data suggest that urgent interventions are needed to improve the situation and reduce disparities among Member States. Limited available data also suggests that urban-rural disparity is pronounced in resource-limited settings.
In order to improve the availability and quality of sanitation facilities, and promote good hygiene practices in pupils, the following recommendations are proposed:
•improve inspections of sanitation facilities, in particular to take into account pupils’ perceptions and needs;
•establish requirements for operation and maintenance of school toilets and hand washing facilities including guidance for regular cleaning, stocking soap and toilet paper, and protocols for reporting and addressing problems and complaints;
•improve awareness of school management of problems related to poor sanitation and hygiene facilities, including potential adverse impacts on health and educational outcomes, and develop approaches to stimulate the involvement of parents and pupils in monitoring and reporting; and
•improve operation and maintenance of sanitation and hygiene facilities, and implement further measures to improve the situation in lower-middle and low-income countries. Results of a survey in Georgia and available data from other lower-middle and low-income countries in the Region suggest that substantial investments in infrastructure are necessary in order to improve sanitation and hygiene in schools.
The Protocol on Water and Health allows Member States to set national targets on water, sanitation and hygiene in schools and programming of country-specific activities to incrementally advance progress towards goals set in the Parma Declaration.
4.5 Smoking in schoolsThe results of the WHO Schools Survey demonstrated that smoking in schools is a wide-spread problem in the five participating countries despite the existence of reasonably strong smoke-free policies in educational facilities in these countries. This may be due to a weak enforcement of existing policies. Rates of smoking in schools varied substantially among the five countries. The prevalence of smoking in general was appreciably higher than the prevalence
of smoking in schools, suggesting that stronger enforcement of smoking bans by the school personnel may be effective in preventing smoking in schools.
A limitation of the WHO Schools Survey is that sampling focused on middle schools with children up to 15 or 16 years of age. Thus, few data from older teenagers (who, perhaps, are more likely to smoke) were collected. An example that indicates that older teenagers are more likely to smoke

61
compared to younger teenagers is the very high rate of smoking (nearly 50%) in 17 and 18 year-old pupils reported in some high schools.
While adult smoking rates in most Member States have been relatively stable during the past several years, smoking rates among young people tend to increase in some countries. As most adult smokers started smoking before the age of 18 years, it is of paramount importance to ensure that school-age children do not
pick up smoking habits and become addicted as. A large majority of Member States of the WHO European Region including all five countries that participated in the WHO Schools Survey have ratified the WHO Framework Convention on Tobacco Control, which requires strong actions aiming at preventing smoking in all indoor public places including educational facilities. Further actions are required in order to improve enforcement and compliance among school pupils and adults working in educational institutions.
4.6 Walking and cycling to schoolsCycling and walking are important means for children and adolescents to achieve the recommended level of at least one hour of moderate- to vigorous-intensity physical activity per day. The main takeaway message from the WHO Schools Survey is that walking to school is a prevalent commuting method while cycling is rather uncommon. Although cycling is a very healthy, cost-effective, and environmentally friendly mode of transportation, it is underutilized by pupils in all five countries which participated in the WHO Schools Survey. Potential reasons for not using bicycles may include safety concerns by parents and children, lack of bicycle lanes and other cycling infrastructure (e.g. secure bicycle parking spaces in schools) and weather conditions, particularly in winter. In countries where cycling is not a mainstream transportation method, the socio-cultural environment may need to be re-oriented towards supporting the use of cycling in the general population as well as in children and adolescents.
The following measures are recommended in order to increase levels of active mobility in school age children.
•Identify and address safety concerns and risks, and introduce measures to calm traffic and reduce the risk of collisions between vehicles and cyclists,
and between pedestrians and cyclists, particularly near schools and in areas that pupils use for cycling to schools.
•Implement reduced speed limits (not higher than 30 km/h) in residential areas.
•Encourage the collaboration between school administration and local transport and community planners to integrate the need for active and independent mobility of children in local transport and urban development plans.
•Conduct awareness raising campaigns that promote cycling as a healthy, safe and enjoyable alternative mode of transportation to school.
•Ensure that there are bicycle lanes along the routes to school.
•Develop and maintain cycling infrastructure in schools, ensuring that there are adequate bicycle parking spaces.
•Monitor the use of cycling as a means of transportation to schools and collect information from pupils about their perceived barriers to walking and cycling to school in order to develop targeted interventions facilitating the use of cycling as a mode of commuting.

62
4.7 General conclusionsWHO Constitution defines health as “…a state of complete physical, mental and social well-being and not merely the absence of disease or infirmity” (WHO, 1946). All components of health are greatly affected by indoor environments. Chemical and biological exposures in the indoor environment cause an estimated annual loss of two million healthy life years in the EU according to the estimates from the HEALTHvENT project (Hänninen & Asikainen, 2013). Exposures in schools, where children spend a substantial proportion of their time, are important in this context. Due to the high density of occupants, exposures to chemical and biological agents in schools can be substantially higher than in homes. In addition to causing diseases and adverse health symptoms, school-based environmental exposures may also negatively impact pupils’ well-being, learning, and academic performance.
The economic development of Member States, in an increasingly globalized and competitive environment, will depend heavily on future generations of young people who are capable of effectively
driving the societies forward. In order to succeed, these young people must first of all be healthy. They must also possess the social and academic skills which are necessary for successfully adapting to and mastering new technologies. Such skills are typically acquired by individuals during childhood, in kindergartens and schools. Thus, school environments need to be supportive, health-promoting, and conducive of the learning process. This means that schools have to be clean, safe and comfortable with adequate lighting, indoor air temperature and relative humidity, adequately ventilated classrooms, and functional sanitation facilities that pupils would not hesitate to use. Such environments not only reduce pupils’ exposure to toxic substances and prevent diseases, but also enable and facilitate efficient and enjoyable cognitive development. Providing equitable environmental conditions in schools for all children, including those living in disadvantaged areas or belonging to vulnerable groups, is especially important for preventing unequal educational outcomes and promoting socioeconomic development.

63
references5.Adams J, Bartram J, Chartier y, Sims J, editors (2009). Water, Sanitation and Hygiene Standards
for Schools in Low-cost Settings. Geneva: World Health Organization (http://www.who.int/water_sanitation_health/publications/wash_standards_school.pdf, accessed 29 March 2015).
ALSPAC (2015). Avon Longitudinal Study of Parents and Children [website]. Bristol: University of Bristol (http://www.bristol.ac.uk/alspac/, accessed 30 March 2015).
Bakó-Biró Zs, Clements-Croome DJ, Kochhar N, Awbi HB, Williams MJ (2012). ventilation rates in schools and pupils’ performance. Building and Environment, 48:215–23.
Ballesta PP, Field RA, Conolly R, Cao N, Caracena AB, De Saeger E (2006). Population exposure to benzene: One day cross-sections in six European cities. Atmospheric Environment, 40:3355–66.
Barth G, Kaesler Ch, Wiesmüller GA (2011). Redevelopment measures in public buildings in Cologne, Germany. In: ISIAQ. 12th International Conference on Indoor Air Quality and Climate 2011. Proceedings of a meeting held 5–10 June 2011, Austin, Texas. Red Hook, Ny: Curran Associates Inc., 1305–10.
Bartzis JG, Michael C, Michaelidou S, Missia DA, Saraga DE, Tolis EI et al. (2008). Concentrations of vOCs and ozone in indoor environments: A case study in two Mediterranean cities during winter period. Fresenius Environmental Bulletin, 17(9B):1480–4.
BAUA (2014). Asbest: Regelungen zum Schutz der Arbeitnehmer in der Bundesrepublik Deutschland. Dortmund: Bundesanstalt für Arbeitsschutz und Arbeitsmedizin (http://www.baua.de/cae/servlet/contentblob/674016/publicationFile/55582/artikel18.pdf, accessed 6 February 2014).
Becker K, Müssig-Zufika M, Conrad A, Lüdecke A, Schulz C, Seiwert M et al. (2008). German Environmental Survey for Children 2003/06 – GerES Iv – Human Biomonitoring: Levels of selected substances in blood and urine of children in Germany. Dessau-Roßlau: Umweltbundesamt (http://www.umweltbundesamt.de/sites/default/files/medien/publikation/long/3355.pdf, accessed 30 March 2015).
Bluyssen PM, Fossati S, Mandin C, Cattaneo A, Carrer P (2012). Towards a new procedure for identifying causes of health and comfort problems in office buildings. In: ISIAQ. 10th International Conference on Healthy Buildings 2012. Proceedings of a meeting held 8–12 July 2012, Brisbane, Australia. Red Hook, Ny: Curran Associates Inc., vol.3:1855–60.
Berglund LG, Gonzales RR, Gagge AP (1990). Predicted human performance decrement from thermal discomfort and ET. In: Proceedings of the fifth international conference on indoor air quality and climate, Toronto, Canada, 215–20.
Borràs-Santos A, Jacobs JH, Täubel M, Haverinen-Shaughnessy U, Krop EJ, Huttunen K et al. (2013). Dampness and mould in schools and respiratory symptoms in children: the HITEA study. Occup Environ Med, 70(10):681–7.
Bruinen De Bruin y, Koistinen K, Kephalopoulos S, Geiss O, Tirendi S, Kotzias D (2008). Characterisation of urban inhalation exposures to benzene, formaldehyde and acetaldehyde in the European Union: Comparison of measured and modelled exposure data. Environmental Science and Pollution Research, 15(5):417–30.
BUMA (2006). Prioritizitation of BUilding MAterials as indoor pollution sources (BUMA) [website]. Kozani: University of West Macedonia (http://www.uowm.gr/bumaproject/, accessed 30 March 2015).
Bundesregierung (2001). verordnung über die Qualität von Wasser für den menschlichen Gebrauch (Trinkwasserverordnung – Trinkwv 2001) [Ordinance on the quality of water intended for human consumption (Drinking Water Ordinance Trinkwv 2001)]. Berlin: Federal Government of Germany (http://www.gesetze-im-internet.de/trinkwv_2001/BJNR095910001.html#BJNR095910001BJNG000201310, accessed 23 March 2015).

64
Bundesregierung (2010). Lärm- und vibrations-Arbeitsschutzverordnung vom 6. März 2007 (BGBl. I S. 261), die zuletzt durch Artikel 3 der verordnung vom 19. Juli 2010 (BGBl. I S. 960) geändert worden ist [Noise and vibration Occupational Safety and Health Regulation from March 6, 2007 (BGBl. I S. 261), last modified by Article 3 of the Order from July 19, 2010 (BGBl. I S. 960)]. Berlin: Federal Government of Germany (http://www.gesetze-im-internet.de/bundesrecht/l_rmvibrationsarbschv/gesamt.pdf, accessed 29 March 2015).
Bundesregierung (2013). Infektionsschutzgesetz vom 20. Juli 2000 (BGBl. I S. 1045), das zuletzt durch Artikel 2 Absatz 36 u. Artikel 4 Absatz 21 des Gesetzes vom 7. August 2013 (BGBl. I S. 3154) geändert worden ist [Infection Protection Act from July 20, 2000 (BGBl I p. 1045), lastly modified by Article 2 Section 36 and Article 4 Section 21 of the law from August 7, 2013 (BGBl. I p. 3154). Berlin: Federal Government of Germany (http://www.gesetze-im-internet.de/bundesrecht/ifsg/gesamt.pdf, accessed 29 March 2015).
Cai GH, Bröms K, Mälarstig B, Zhao ZH, Kim JL, Svärdsudd K et al. (2009). Quantitative PCR analysis of fungal DNA in Swedish day care centers and comparison with building characteristics and allergen levels. Indoor Air, 19(5):392–400.
Carrer P, Wargocki P, De Oliveira Fernandes E, Kephalopoulos S et al. (in press). Guidelines for health-based ventilation in Europe (Healthvent). Luxembourg: Office for Official Publications of the European Communities (ECA Report No. 30).
Cocheo v, Sacco P, Boaretto C, De Saeger E, Perez Ballesta P, Skov H et al. (2000). Urban benzene and population exposure. Nature, 404:141–2.
Coward SKD, Llewellyn JW, Raw GJ, Brown vM, Crump DR, Ross DI (2001). Indoor air quality in homes in England. London: CRC press (BRE Report 433).
Csobod E, Annesi-Maesano I, Carrer P, Kephalopoulos S, Madureira J, Rudnai P et al. (2014). SINPHONIE: Schools Indoor Pollution & Health Observatory Network in Europe. Final Report. Luxembourg: Publications Office of the European Union (http://www.sinphonie.eu/sites/default/files/ExecutiveSummary/lbna26738enn.pdf, accessed 23 March 2015).
Csobod E, Rudnai P, vaskovi E (2010). School Environment and Respiratory Health of Children (SEARCH): International research project report within the programme “Indoor air quality in European schools: Preventing and reducing respiratory diseases”. Szentendre: Regional Environmental Centre for Central and Eastern Europe.
DIN (2004). 18041. Hörsamkeit in kleinen bis mittelgroßen Räumen [Acoustic quality in small to medium-sized rooms]. Berlin: Beuth verlag (available also in English).
DIN (2005). EN ISO IEC 17025 General requirements for the competence of testing and calibration laboratories. Berlin: Beuth verlag (available in English and German).
DIN (2007). EN 13779. Lüftung von Nichtwohngebäuden – Allgemeine Grundlagen und Anforderungen für Lüftungs– und Klimaanlagen und Raumkühlsysteme [ventilation for non-residential buildings - Performance requirements for ventilation and room-conditioning systems]. Berlin: Beuth verlag (available also in English).
DIN (2009). EN ISO 3382-1. Akustik - Messung von Parametern der Raumakustik - Teil 1: Aufführungsräume (ISO 3382-1:2009); Deutsche Fassung EN ISO 3382-1:2009 [Acoustics - Measurement of room acoustic parameters - Part 1: Performance spaces (ISO 3382-1:2009); German version EN ISO 3382-1:2009]. Berlin: Beuth verlag (http://www.beuth.de/de/norm/din-en-iso-3382-1/116072001, accessed 30 March 2015).
DIN (2011). EN 12464–1. Licht und Beleuchtung - Beleuchtung von Arbeitsstätten. Teil 1: Arbeitsstätten in Innenräumen; Deutsche Fassung [Light and lighting - Lighting of workplaces - Part 1: Indoor work places; German version]. Berlin: Beuth verlag.
DvGW (2004). Arbeitsblatt W 551. Trinkwassererwärmungs- und Trinkwasserleitungsanlagen; Technische Maßnahmen zur verminderung des Legionellenwachstums; Planung, Errichtung, Betrieb und Sanierung von Trinkwasser-Installationen [Drinking water heating and drinking water piping systems; technical measures to reduce Legionella growth; design, construction, operation and rehabilitation of drinking water installations]. Bonn: Deutscher verein des Gas- und Wasserfaches e.v. [German Association for Gas and Water].
Edwards RD, Jurvelin J, Koistinen K, Saarela K, Jantunen M (2001). vOC source identification from personal and residential indoor, outdoor and workplace microenvironment samples in ExPOLIS-Helsinki, Finland. Atmospheric Environment, 35:4829–41.
65
EFA (2006). Building Bulletin 101: ventilation of School Buildings. London: Education Funding Agency (https://www.gov.uk/government/publications/building-bulletin-101-ventilation-for-school-buildings, accessed 31 March 2015).
Egorov A, Mata E, Deliu A, Coku A, Kasaj P, Sangalang S et al. (2012). Pilot WHO survey in Albania to assess pupils’ exposure to environmental hazards in schools (ISEE 2012 Conference Abstracts. Epidemiology, 23(5S):P-232, doi:10.1097/01 (http://journals.lww.com/epidem/Citation/2012/09001/P_232___Pilot_WHO_Survey_in_Albania_to_Assess.636.aspx, accessed 30 March 2015).
EPA (1999). Compendium method TO-13A: Determination of polycyclic aromatic hydrocarbons (PAHs) in ambient air using gas chromatography/mass spectrometry (GC/MS). Washington, DC: United States Environmental Protection Agency (EPA/625/R-96/010b; http://www.epa.gov/ttnamti1/files/ambient/airtox/to-13arr.pdf, accessed 29 March 2015).
EPA (2012). IAQ Design Tools for Schools [website]. Washington, DC: United States Environmental Protection Agency (http://www.epa.gov/iaq/schooldesign/index.html, accessed 30 March 2015).
EU (2004a). EU Directive 2008//50/EC of the European Parliament and of the Council of 21 May 2008 on ambient air quality and cleaner air for Europe. Official Journal of the European Union, L152:1–44 (http://eur-lex.europa.eu/legal-content/EN/TxT/?uri=CELEx:32008L0050, accessed 23 March 2015).
EU (2004b). Communication from the Commission to the Council, the European Parliament, the European Economic and Social Committee - “The European Environment & Health Action Plan 2004-2010”. Brussels: European Commission (COM/2004/0416 vol. I final; http://eur-lex.europa.eu/legal-content/EN/TxT/?uri=CELEx:52004DC0416, accessed 23 March 2015).
ExPOLIS (2007). Expolis project homepage [webspage]. Kuopio: National Public Health Institute of Finland (http://www.thl.fi/expolis/, accessed 30 March 2015).
Field RA, Perez Ballesta P, Baeza Caracena A, Nikolova I, Connolly R, Cao N et al. (2005). Population Exposure to Air Pollutants in Europe (PEOPLE). Methodological Strategy and Basic Results. European Commission, Joint Research Centre (EUR 21810 EN; http://www.citidep.net/people/docs/PEOPLE-finalreport.pdf, accessed 27 March 2015).
Fisk WJ, Lei-Gomez Q, Mendell MJ (2007). Meta-analyses of the associations of respiratory health effects with dampness and mold in homes. Indoor Air, 17:284–96.
FLIES (2012). Flanders Indoor Exposure Survey [website]. Brussels: Flemish Environment, Nature and Energy Department; Mol: vITO Nv (https://esites.vito.be/sites/FLIES/EN/home/Pages/home.aspx, accessed 30 March 2015).
Franchi M, Carrer P, Kotzias D, Rameckers EM, Seppänen O, van Bronswijk JE et al. (2006). Working towards healthy air in dwellings in Europe. Allergy,61(7):864–8.
Geiss O, Giannopoulos G, Tirendi S, Barrero-Moreno J, Larsen BR, Kotzias D (2011). The AIRMEx study – vOC measurements in public buildings and schools/kindergartens in eleven European cities: Statistical analysis of the data. Atmospheric Environment, 45(22):3676–84.
Gesundheitsamt Köln (2000). Schadstoffbericht. Cologne: Gesundheitsamt Köln.
Gesundheitsamt Köln (2002). Ergebnisbericht. Cologne: Gesundheitsamt Köln.
Hänninen O (2013). Novel second degree solution to single zone mass-balance equation improves the use of build-up data in estimating ventilation rates in classrooms. Journal of Chemical Health and Safety 20(2):14–9.
Hänninen O, Asikainen A, editors (2013). Efficient reduction of indoor exposures - Health benefits from optimizing ventilation, filtration and indoor source controls (revised version, updated 25 November 2014). Tampere: National Institute for Health and Welfare (THL) (http://urn.fi/URN:ISBN:978-952-245-822-3, accessed 1 April 2015).
Hänninen OO, Alm S, Katsouyanni K, Künzli N, Maroni M, Nieuwenhuijsen MJ et al. (2004). The ExPOLIS study: Implications for exposure research and environmental policy in Europe. Journal of Exposure Analysis and Environmental Epidemiology, 14:440–56.
Hänninen O, Canha N, Dume I, Deliu A, Mata E, Egorov A (2012). Evaluation of ventilation rates in a sample of Albanian schools using CO2 measurements – a pilot WHO survey (ISEE 2012 Conference Abstracts). Epidemiology, 23(5S):P-217. doi:10.1097/01 (http://journals.lww.

66
com/epidem/Citation/2012/09001/P_217___Evaluation_of_ventilation_Rates_in_a.621.aspx, accessed 30 March 2015).
Haverinen-Shaughnessy U, Moschandreas DJ, Shaughnessy RJ (2011). Association between substandard classroom ventilation rates and students’ academic achievement. Indoor Air, 21(2):121–31.
Haverinen-Shaughnessy U, Borras-Santos A, Turunen M, Zock JP, Jacobs J, Krop EJ et al. (2012a). Occurrence of moisture problems in schools in three countries from different climatic regions of Europe based on questionnaires and building inspections – the HITEA study. Indoor Air, 22(6):457–66.
Haverinen-Shaughnessy U, Turunen T, Borras A, Zock J-P, Jacobs J, Krop E et al. (2012b). Occurrence of dampness, excess moisture and mould in schools in three climatic regions of Europe. Indoor Air, 22(6):457–66.
Haverinen-Shaughnessy U, Turunen M, Metsämuuronen J, Palonen J, Putus T, Kurnitski J et al. (2012c). Health and Academic Performance of Sixth Grade Students and Indoor Environmental Quality in Finnish Elementary Schools. British Journal of Educational Research, 2(1):42–58.
HESE (2015). Health Effects of School Environment [website]. Siena: University of Siena (http://respir.med.unisi.it:8008/hesejoomla/index.php?option=com_frontpage&Itemid=1, accessed 30 March 2015).
Hyvärinen A, Husman T, Laitinen S, Meklin T, Taskinen T, Korppi M et al. (2003). Microbial exposure and mold-specific serum IgG levels among children with respiratory symptoms in 2 school buildings. Arch Environ Health, 58(5):275–83.
Jacobs JH, Krop EJ, Borras-Santos A, Zock JP, Taubel M, Hyvarinnen A et al. (2014). Endotoxin levels in settled airborne dust in European schools: the HITEA school study. Indoor Air, 24(2):148–57.
Jacobs JH, Krop EJ, de Wind S, Spithoven J, Heederik DJ (2013). Endotoxin levels in homes and classrooms of Dutch school children and respiratory health. Eur Respir J, 42(2):314–22.
Jantunen MJ, Hänninen O, Katsouyanni K, Knöppel H, Künzli N, Lebret E et al. (1998). Air pollution exposure in European cities: The “Expolis”–study. Journal of Exposure Analysis and Environmental Epidemiology (JEAEE), 8(4):495–518.
Jurvelin J, Edwards R, Saarela K, Laine-ylijoki J, De Bortoli M, Oglesby L et al. (2001). Evaluation of vOC measurements in the ExPOLIS study. Journal of Environmental Monitoring, 3:159–65.
Jurvelin J, vartiainen M, Jantunen M, Pasanen P (2000). Personal exposure levels and microenvironmental concentrations of formaldehyde and acetaldehyde in Helsinki metropolitan area, Finland. Journal of the Air & Waste Management Association (JAWMA), 51:17–24.
Kaesler Ch, Barth G, Wiesmüller GA (2014). Gesundes Lernen und Spielen in gesunden Gebäuden – Das Gebäudeprogramm „Aktive Gesundheitsvorsorge“ des Kölner Gesundheitsamtes. Umweltmed – Hygiene – Arbeitsmed, 18:289–98.
Kanchongkittiphon W, Mendell MJ, Gaffin JM, Wang G, Phipatanakul W (2015). Indoor environmental exposures and exacerbation of asthma: an update to the 2000 review by the Institute of Medicine. Environmental Health Perspectives, 123(1):6–20.
Kephalopoulos S, Barrero-Moreno J, Larsen B, Geiss O, Tirendi S, Reina v (2013). PILOT INDOOR AIR MONIT AA final report. Luxembourg: Publications Office of the European Union.
Kephalopoulos S, Csobod E, Bruinen de Bruin y, De Oliveira Fernandes E (2014). Guidelines for healthy environments within European schools. Luxembourg: Publications Office of the European Union.
Kotzias D, Geiss O, Tirendi S, Josefa BM, Reina v, Gotti A et al. (2009). Exposure to multiple air contaminants in public buildings, schools and kindergartens-the European indoor air monitoring and exposure assessment (Airmex) study. Fresenius Environmental Bulletin, 18(5A):670–81.
Kotzias D, Koistinen K, Kephalopoulos S, Schlitt C, Carrer P, Maroni M et al. (2005). The INDEx project. Critical Appraisal of the Setting and Implementation of Indoor Exposure Limits in the EU. Final Report. Luxembourg: Publications Office of the European Union (http://ec.europa.eu/health/ph_projects/2002/pollution/fp_pollution_2002_frep_02.pdf, accessed 29 March 2015).

67
Krop EJ, Jacobs JH, Sander I, Raulf-Heimsoth M, Heederik DJ (2014). Allergens and β-Glucans in Dutch homes and schools: characterizing airborne levels. PLoS One, 9(2):e88871.
Lai H-K, Jantunen MJ, Künzli N, Kulinskaya E, Colvile R, Nieuwenhuijsen MJ (2007). Determinants of indoor benzene in Europe, Atmospheric Environment, 41:9128–35.
Lan L, Wargocki P, Wyon DP, Lian Z (2011). Effects of thermal discomfort in an office on perceived air quality, SBS symptoms, physiological responses, and human performance. Indoor Air, 21(5):376-90.
Lignell U, Meklin T, Putus T, Rintala H, vepsäläinen A, Kalliokoski P, Nevalainen A (2007). Effects of moisture damage and renovation on microbial conditions and pupils’ health in two schools--a longitudinal analysis of five years. J Environ Monit, 9(3):225–33.
Liu LJ, Krahmer M, Fox A, Feigley CE, Featherstone A, Saraf A et al. (2000). Investigation of the concentration of bacteria and their cell envelope components in indoor air in two elementary schools. J Air Waste Manag Assoc, 50(11):1957–67.
Lombard E (1911). Le signe de l’élévation de la voix. In: Annales des maladies de l‘oreille, du larynx du nez et du pharynx, 37:101–19.
Meklin T, Husman T, vepsäläinen A, vahteristo M, Koivisto J, Halla-Aho J et al. (2002). Indoor air microbes and respiratory symptoms of children in moisture damaged and reference schools. Indoor Air; 12(3):175–83.
Mendell MJ, Mirer AG, Cheung K, Tong M, Douwes J (2011). Respiratory and allergic health effects of dampness, mold, and dampness-related agents: a review of the epidemiologic evidence. Environ Health Perspect, 119(6):748–56
Meyer HW, Suadicani P, Nielsen PA, Sigsgaard T, Gyntelberg F (2011). Moulds in floor dust − a particular problem in mechanically ventilated rooms? A study of adolescent schoolboys under the Danish moulds in buildings program. Scand J Work Environ Health, 37(4):332–40.
Michelot N, Marchand C, Ramalho O, Delmas v, Carrega M (2013), Monitoring indoor air quality in French schools and day-care centres. HvAC&R Research, 19:1083–9.
Ministry of Ecology, Sustainable Development, Transport and Housing (2010). Le Grenelle Environnement. Paris : Ministère de l’Écologie, du Développement durable et de l’Énergie (http://www.developpement-durable.gouv.fr/IMG/pdf/Grenelle_Loi-2_GB_.pdf, accessed 23 March 2015).
Missia DA, Demetriou E, Michael N, Tolis EI, Bartzis JG (2010). Indoor exposure from building materials: A field study. Atmospheric Environmen, 44(35):4388–95.
Officeair (2013). Officeair [website]. Kozani: University of Western Macedonia (http://www.officair-project.eu/, accessed 30 March 2015).
OQAI (2014). Observatoire de la Qualité de l’Air Intérieur [website]. Marne la vallé: Observatoire de la Qualité de l’Air Intérieur (http://www.oqai.fr/ModernHomePage.aspx, accessed 30 March 2015).
Peitzsch M, Sulyok M, Täubel M, vishwanath v, Krop E, Borràs-Santos A et al. (2012). Microbial secondary metabolites in school buildings inspected for moisture damage in Finland, The Netherlands and Spain. J Environ Monit, 14(8):2044–53.
Pettenkofer M (1858). Über den Luftwechsel in Wohngebäuden [About air exchange in residential buildings]. Munich: JG Cotta’schen Buchhandlung.
Project PEOPLE (2005). Project PEOPLE Lisboa [website]. Lisbon: Project People (http://www.citidep.net/people/, accessed 30 March 2015).
Ramalho O, Mandin C, Ribéron J et al. (2013) Air Stuffiness and Air Exchange Rate in French Schools and Day-Care Centres. International Journal of ventilation, 12(2):175–80.
Rotko T, Oglesby L, Künzli N, Jantunen M (2000). Population sampling in European air pollution exposure study, ExPOLIS: comparisons between the cities and representativity of the samples. JEAEE, 10(4):355–64.
Salo PM, Sever ML, Zeldin DC (2009). Indoor allergens in school and day care environments. J Allergy Clin Immunol, 124(2):185–92. doi:10.1016/j.jaci.2009.05.012.

68
Satish U, Mendell MJ, Shekhar K, Hotchi T, Sullivan D, Streufert S et al. (2012). Is CO2 an indoor pollutant? Direct effects of low-to-moderate CO2 concentrations on human decision-making performance. Environ Health Perspect, 120(12):1671–7.
Schönwälder HG, Berndt J, Ströver F, Tiesler G (2004). Lärm in Bildungsstätten – Ursachen und Minderung [Noise in educational institutions – Causes and reduction]. Bremerhaven: verlag für neue Wissenschaft GmbH (Schriftenreihe der Bundesanstalt für Arbeitsschutz und Arbeitsmedizin, Fb 1030; http://www.baua.de/de/Publikationen/Forschungsberichte/2004/Fb1030.pdf?__blob=publicationFile, accessed 29 March 2015).
Thomas G, Burton NC, Mueller C, Page E, vesper S (2012). Comparison of work-related symptoms and visual contrast sensitivity between employees at a severely water-damaged school and a school without significant water damage. Am J Ind Med, 55(9):844–54.
Tischer C, Chen CM, Heinrich J (2011). Association between domestic mould and mould components, and asthma and allergy in children: a systematic review. Eur Respir J, 38(4):812–24.
UBA (2005). Leitfaden zu Ursachensuche und Sanierung bei Schimmelpilzwachstum in Innenräumen („Schimmelpilzsanierungs-Leitfaden“) [Guideline for cause analysis and redevelopment of mold growth indoors (“mold redevelopment guideline”)] Dessau-Roßlau: Umweltbundesamt (http://www.apug.de/archiv/pdf/Schimmelpilzsanierungsleitfaden.pdf, accessed 29 March 2015).
UBA (2008). Leitfaden für die Innenraumhygiene in Schulgebäuden [Guideline of indoor hygiene in school buildings]. Dessau-Roßlau: Umweltbundesamt (https://www.umweltbundesamt.de/sites/default/files/medien/publikation/long/3689.pdf, accessed 29 March 2015).
Uhde E (2009). Application of solid sorbents for the sampling of volatile organic compounds in indoor air. In: Salthammer T, Uhde E, editors. Organic Indoor Air Pollutants: Occurrence, Measurement, Evaluation. 2nd Edition. Weinheim: Wiley-vCH verlag GmbH (http://www.wiley-vch.de/books/sample/3527312676_c01.pdf, accessed 29 March 2015):3–18.
UN (2000). Protocol on Water and Health to the 1992 Convention on the Protection and Use of Transboundary Watercourses and International Lakes. Geneva: United Nations Economic Commission for Europe; Copenhagen: WHO Regional Office for Europe (MP.WAT/2000/1EUR/ICP/EHCO 020205/8Fin; http://www.unece.org/fileadmin/DAM/env/documents/2000/wat/mp.wat.2000.1.e.pdf, accessed 27 March 2015).
UNICEF (2013). Survey of Water, Sanitaion and Hygience Conditions in Public Schools. Georgia, 2013. Tbilisi: United Nations Children’s Fund – Georgia; Educational and Scientific Infrastructure Development Agency (http://unicef.ge/uploads/WASH_in_Schools_Survey_Report.pdf, accessed 29 March 2015).
vDI (2005). Messen von Innenraumluftverunreinigungen – Messstrategie für Kohlendioxid [Measurement of indoor air pollution – Measurement strategy for carbon dioxide]. Berlin: Beuth verlag (vDI 4300 Blatt 9).
vDI (2006). Ausstattung von und mit Sanitärräumen – Kindergärten, Kindertagesstätten, Schulen [Equipment and installation of sanitary spaces – kindergartens, day-care centres, schools]. Berlin: Beuth verlag (vDI 6000 Blatt 6; http://www.vdi.de/uploads/tx_vdirili/pdf/9762402.pdf; accessed 29 March 2015).
vDI (2011). Raumlufttechnik, Raumluftqualität: Hygieneanforderungen an Raumlufttechnische Anlagen und Geräte (vDI-Lüftungsregeln) [ventilation and indoor-air quality: Hygiene requirements for ventilation and air-conditioning systems and units]. Berlin: Beuth verlag (vDI 6022; http://www.vdi.de/technik/fachthemen/bauen-und-gebaeudetechnik/fachbereiche/technische-gebaeudeausruestung/richtlinienarbeit/richtlinienreihe-vdi-6022-raumlufttechnik-raumluftqualitaet/, accessed 29 March 2015).
Wady L, Shehabi A, Szponar B, Pehrson C, Sheng y, Larsson L (2004). Heterogeneity in microbial exposure in schools in Sweden, Poland and Jordan revealed by analysis of chemical markers. J Expo Anal Environ Epidemiol, 14(4):293–9.
Warscheid T (2011). Mold remediation in West-European buildings. In: Adan OCG, Samson RA, editors. Fundamentals of mold growth in indoor environments and strategies for healthy living. Wageningen: Wageningen Academic Publishers: 413−34.

69
Wauters E, van Caeter P, Desmet G, David F, Devos C, Sandra P (2008). Improved accuracy in the determination of polycyclic aromatic hydrocarbons in air using 24h sampling on a mixed bed followed by thermal desorption capillary gas chromatography-mass spectrometry. Journal of Chromatography, 1190:286–93.
WHO (1946). Constitution of the World Health Organization. Geneva: World Health Organization (http://www.who.int/library/collections/historical/en/index3.html, accessed 29 March 2015).
WHO Regional Office for Europe (2006). Air quality guidelines. Global update 2005. Particulate matter, ozone, nitrogen dioxide and sulfur dioxide. Copenhagen: WHO Regional Office for Europe (http://www.euro.who.int/__data/assets/pdf_file/0005/78638/E90038.pdf?ua=1, accessed 29 March 2015).
WHO Regional Office for Europe (2009). Guidelines for indoor air quality: Dampness and mould. Copenhagen: WHO Regional Office for Europe (http://www.euro.who.int/__data/assets/pdf_file/0017/43325/E92645.pdf?ua=1, accessed 29 March 2015).
WHO Regional Office for Europe (2010a). Parma Declaration on Environment and Health. Copenhagen: WHO Regional Office for Europe (http://www.euro.who.int/__data/assets/pdf_file/0011/78608/E93618.pdf, accessed 29 March 2015).
WHO Regional Office for Europe (2010b). Guidelines for Indoor Air Quality: Selected Pollutants. Copenhagen: WHO Regional Office for Europe (http://www.euro.who.int/__data/assets/pdf_file/0009/128169/e94535.pdf, accessed 29 March 2015).
WHO Regional Office for Europe (2011). Methods for monitoring indoor air quality in schools: Report of a meeting, Bonn, Germany, 4−5 April 2011. Copenhagen: WHO Regional Office for Europe (http://www.euro.who.int/__data/assets/pdf_file/0011/147998/e95417.pdf, accessed 29 March 2015)
World Bank (2015). Country and Lending Groups [online database]. Washington, DC: The World Bank (http://data.worldbank.org/about/country-and-lending-groups, accessed 30 March 2015).

The WHO regional Office for europe
The World Health Organization (WHO) is a specialized agency of the United Nations created in 1948 with the primary responsibility for international health matters and public health.The WHO Regional Office for Europe is one of six regional offices throughout the world, each with its own programme geared to the particular health conditions of the countries it serves.
Member States
AlbaniaAndorraArmeniaAustriaAzerbaijanBelarusBelgiumBosnia and HerzegovinaBulgariaCroatiaCyprusCzech RepublicDenmarkEstoniaFinlandFranceGeorgiaGermanyGreeceHungaryIcelandIrelandIsraelItalyKazakhstanKyrgyzstanLatviaLithuaniaLuxembourgMaltaMonacoMontenegroNetherlandsNorwayPolandPortugalRepublic of MoldovaRomaniaRussian FederationSan MarinoSerbiaSlovakiaSloveniaSpainSwedenSwitzerlandTajikistanThe former yugoslav Republic of MacedoniaTurkeyTurkmenistanUkraineUnited KingdomUzbekistan
World Health Organizationregional Office for europe
UN City, Marmorvej 51, DK-2100 Copenhagen Ø, DenmarkTel.: +45 45 33 70 00/Fax: +45 45 33 70 01
Email: [email protected]: www.euro.who.int