SCARF Annual Report 2013-2014
47
SCARF Annual Report 2013-2014 Version: 1.0 D Ross (ed) November 2014 Technical Report RAL-TR-2014-017
Transcript of SCARF Annual Report 2013-2014

SCARF Annual Report 2013-2014Version: 1.0
D Ross (ed)
November 2014
Technical Report RAL-TR-2014-017
vvf24852
Typewritten Text
vvf24852
Typewritten Text
vvf24852
Typewritten Text

©2014 Science and Technology Facilities Council
This work is licensed under a Creative Commons Attribution 3.0 Unported License. Enquiries concerning this report should be addressed to: RAL Library STFC Rutherford Appleton Laboratory Harwell Oxford Didcot OX11 0QX Tel: +44(0)1235 445384 Fax: +44(0)1235 446403 email: [email protected] Science and Technology Facilities Council reports are available online at: http://epubs.stfc.ac.uk ISSN 1358-6254 Neither the Council nor the Laboratory accept any responsibility for loss or damage arising from the use of information contained in any of their reports or in any communication about their tests or investigations.
SCARF Annual Report 2013-‐‑2014
07/11/14 1
SCARF Annual Report 2013-‐‑2014 Version: 1.0 Date: 19/11/2014 Edited by Derek Ross ([email protected]) 01235 445651 Content written by the respective authors
Date Revision Changes 21/10/14 0.1 Initial document 04/11/14 0.2 Additional Science highlights 06/11/14 0.3 Final formatting 19/11/14 1.0 Released
Abstract Annual Report on the Usage and Scientific Impact of the SCARF Service Dissemination This is a public document
SCARF Annual Report 2013-‐‑2014
07/11/14 2
1. SCARF Service ............................................................................................................................ 5 1.1 SCARF Usage by Department .................................................................................................................... 5
1.2 SCARF Availability ....................................................................................................................................... 6
1.3 SCARF Developments 2013-‐14 ................................................................................................................ 6
1.4 Future Development ................................................................................................................................... 7
1.5 Help and Support ......................................................................................................................................... 7
2. Publications and Presentations ................................................................................................ 8 2.1 Publications ................................................................................................................................................... 8
2.2 Presentations ................................................................................................................................................ 8
3. Science Highlights ...................................................................................................................... 9 3.1 R.S. Pinna (ISIS and Università degli Studi di Milano-‐Bicocca), S. Rudic (ISIS), S.F. Parker
(ISIS), G. Gorini (Università degli Studi di Milano-‐Bicocca) and F. Fernandez-‐Alonso (ISIS and
University College London) ................................................................................................................................. 9
3.1.1 Monte Carlo Simulations of the TOSCA Spectrometer: Assessment of Current Performance and Future Upgrades ........................................................................................... 9
3.2 M. R. Ryder,1,2,3 B. Civalleri,4 T. D. Bennett,5 S. Henke,5 S. Rudic,2 G. Cinque,3 F. Fernandez-‐
Alonso,2 and J-‐C Tan1 ........................................................................................................................................... 10
3.2.1 Identifying the Role of Terahertz Vibrations in Metal-Organic Frameworks: From Gate-Opening Phenomenon to Shear-Driven Structural Instability .................................. 10
3.3 S. Mukhopadhyay, M. J. Gutmann, and F. Fernandez-‐Alonso (ISIS) ........................................... 11
3.3.1 Hydrogen-bond Dynamics and Proton Transfer in Room-Temperature Organic Ferroelectrics using First-principles and Neutron Scattering ............................................. 11
3.4 C. W. Yong1,2 .................................................................................................................................................. 13
3.4.1 Study of interactions between polymer nanoparticles and cell membranes at atomistic levels ........................................................................................................................... 13
3.5 G. Graziano (University College London), M. J. Gutmann (ISIS), A. Michaelides (University
College London), and F. Fernandez-‐Alonso (ISIS & University College London) ............................. 15
3.5.1 Nuclear dynamics of carbon atoms in graphite ......................................................... 15 3.6 R. Scott (CLF) ................................................................................................................................................ 17
3.6.1 Work performed on SCARF 2013-2014 ....................................................................... 17 3.7 D.J. Voneshen (RHUL), K. Refson (STFC), J.P. Goff (RHUL) ............................................................ 18
3.7.1 Rattling modes in new thermoelectrics ...................................................................... 18 3.8 V. Losasso (STFC) ....................................................................................................................................... 19
3.8.1 Computational studies of EGFR extracellular and intracellular domains ............. 19

SCARF Annual Report 2013-‐‑2014
07/11/14 3
3.9 H. Loeffler (STFC) ....................................................................................................................................... 21
3.9.1 Free Energy Simulations of Protein Receptors and Solvated Organic Molecules 21 3.10 R. Fernandez-‐Perea (iem-‐CSIC), S. Mukhopadhyay (ISIS), C. Cabrillo (iem-‐CSIC), F.
Fernandez-‐Alonso (ISIS and University College London) ....................................................................... 22
3.10.1 Towards a better description of carbon-based nanomaterials .............................. 22 3.11 R. J. Dance1, D. A. MacLellan1, D. C. Carroll1, R. J. Gray1, N. Booth2, M. Burza3, M. P.
Desjarlais4, F. Du5, B. Gonzalez-‐Izquierdo1, D. Neely2, H. W. Powell1, A. P. L. Robinson2, D. R.
Rusby1,2, G. G. Scott1,2, X. H. Yuan6, C.-‐G. Wahlstrom3 and P. McKenna1 ............................................... 25
3.11.1 The effect of low temperature resistivity on fast electron transport in solids .... 25 3.12 R. J. Dance1, D. A. MacLellan1, D. C. Carroll1, R. J. Gray1, N. Booth2, M. Burza3, M. P.
Desjarlais4, F. Du5, D. Neely2, H. W. Powell1, A. P. L. Robinson2, G. G. Scott1,2, X. H. Yuan6, C.-‐G.
Wahlström3, and P. McKenna1 .......................................................................................................................... 28
3.12.1 The effect of resistivity gradients on the transport of fast electrons in solid material ........................................................................................................................................ 28
4. APPENDIX: SCARF Hardware Details ................................................................................ 30
5. APPENDIX: Index of Figures ................................................................................................. 30
6. APPENDIX: Publications and Presentations ...................................................................... 33
7. APPENDIX: SCARF Queue Usage 2011-12 .......................................................................... 36 7.1 General SCARF Queue ............................................................................................................................... 36
7.2 SCARF-‐Lexicon1 and Lexicon2 Queues ............................................................................................... 39
7.3 SCARF-‐IBIS .................................................................................................................................................... 40
7.4 SCARF Total Power draw (amps) .......................................................................................................... 41
7.5 Filesystem Usage ........................................................................................................................................ 41
7.6 Networking .................................................................................................................................................. 42
8. APPENDIX: SCARF Developments ...................................................................................... 45 8.1 Technical Developments ......................................................................................................................... 45
8.2 Application Stack ....................................................................................................................................... 45


SCARF Annual Report 2013-‐‑2014
07/11/14 5
1. SCARF SERVICE
SCARF is a High Performance Cluster for STFC staff, Facilities (ISIS, DIAMOND, CLF) and their users. The SCARF Service was started in 2004 and has been upgraded year on year and now represents a significant capital investment in High Performance Computing. Overall SCARF now has over 4400 CPU cores, 17TB memory and 160TB of disk space (Details in Appendix 1). This report covers the year 2013-‐‑14 and outlines the research that SCARF has enabled. 1.1 SCARF Usage by Department
Each time a researcher uses the SCARF service the CPU time used is recorded. In total over 300,000 jobs, using 19M CPU hours, were submitted to SCARF during 2013-‐‑14.
Figure 1: Pie chart showing percentage usage of the SCARF service by department
It is clear from the usage chart that ISIS and Scientific Computing are the largest users of SCARF. The External category measures the usage from STFC collaboration such as the University of Oxford, the York Plasma Institute and the University of Strathclyde 2013-‐‑14 2011-‐‑12 2010-‐‑11
Dept Active Users
CPU hrs % Active Users
CPU hrs % Active Users
CPU hrs %
SCD 37 8980895.60 47.1 27 3432184.71 41.0 27 2156538.5 27.4 ISIS 23 2858306.49 15.0 17 2200465.95 26.3 17 1895822.3 24.0 External 22 4748211.01 24.9 23 1697806.08 20.3 6 2571711.1 32.6 CLF 29 2010153.36 10.5 23 1099791.25 13.1 13 1086765.3 13.8 ISIS_IBIS 6 68371.04 0.36 5 107783.83 1.3 8 136678.1 1.7 PPD 0 0 0 0 0.0 0.0 1 436.8 0.0 DIAMOND 3 5970.4 0.0 0 0.0 0.0 3 45814.3 0.6 ASTEC 3 112843.12 0.6 7 48549.59 0.6 0 0.0 0.0 RAL Space 2 267668.469 1.4 2 215804.818 2.6 0 0.0 0.0 Totals 128 19055284 100 100 8375330.95 100 75 7893766.3 100.0
Figure 2: Table displaying detailed usage from 2013-‐14 comparing with 2012-‐13 and 2011-‐12

SCARF Annual Report 2013-‐‑2014
07/11/14 6
A significant amount of computational resource has been used on SCARF; section 3 highlights some of the scientific achievements that have been enabled. 1.2 SCARF Availability
Planned downtimes were held in May for maintenance on the high speed parallel filesystem underpinning SCARF.
Figure 3: Availability for SCARF
As can can be seen in the table below, the oldest hardware is the least available, supporting the yearly refresh cycle.
Year Purchased Compute node Availability 2013-‐‑14
Compute node Availability 2012-‐‑13
Compute node Availability 2011-‐‑12
2008 98.86% 91.2% 97.9% 2009 100.00% 99.3% 99.2% 2010 99.99% 99.1 99.9% 2011 99.88% 98.9 99.7% 2012 99.95% 98.9 99.9% 2013 99.80% 100% N/A 2014 100.00% N/A N/A
Figure 4: Availability vs. Year Purchased
1.3 SCARF Developments 2013-14
Major SCARF Developments are listed below. A more detailed list can be found in Appendix 5 o New capacity added
§ 896 Intel E5-‐‑2650v2 CPU cores for general use went into production in May 2014
o SCARF has been migrated to RedHat Enterprise Linux 6

SCARF Annual Report 2013-‐‑2014
07/11/14 7
1.4 Future Development
SCARF 2015 Hardware Upgrade o Storage Upgrade o Compute upgrade
1.5 Help and Support
For any queries concerning the SCARF service please email the SCARF Helpdesk HUscarf@hpc-‐‑support.rl.ac.ukU

SCARF Annual Report 2013-‐‑2014
07/11/14 8
2. PUBLICATIONS AND PRESENTATIONS 2.1 Publications
A list of publications is give is Appendix 3. A way of estimating the impact that SCARF has had is to analyse the Journal Impact Factor using the Journal Citation Reports published by Thomson Reuters (2013). The average Impact Factor for Journals published as a result of using SCARF is 1.78. This compares to a median impact factor across all 8474 journals of 1.411. This is a simplistic analysis but demonstrates that the science done on SCARF is having an impact.
2.2 Presentations
Scientists have presented their work at 14 international conferences (Appendix 3). This helps to demonstrate that the science enabled by SCARF is world class.

SCARF Annual Report 2013-‐‑2014
07/11/14 9
3. SCIENCE HIGHLIGHTS 3.1 R.S. Pinna (ISIS and Università degli Studi di Milano-Bicocca), S. Rudic (ISIS), S.F. Parker (ISIS), G. Gorini (Università degli Studi di Milano-Bicocca) and F. Fernandez-Alonso (ISIS and University College London) 3.1.1 Monte Carlo Simulations of the TOSCA Spectrometer: Assessment of Current Performance and Future Upgrades
TOSCA at ISIS [1] continues to be the world-‐‑leading inelastic neutron spectrometer for chemistry and catalysis research. It is an instrument optimised for high-‐‑resolution chemical spectroscopy up to energy transfers of ca. 4000 cm-‐‑1 in neutron-‐‑energy loss. The secondary spectrometer sits at 17 m from a room-‐‑temperature water moderator on ISIS Target Station I and has been operational for over a decade, superseding its predecessor TFXA [2]. In this work, we have assessed the performance of a detailed computational description of the TOSCA spectrometer using neutron-‐‑transport Monte Carlo simulations. Extensive calculations using a parallelised version of the McStas software package have been performed on the SCARF-‐‑RAL cluster using the present instrument geometry and compared with available experimental data. The agreement between expected and measured performance is satisfactory in terms of the incident flux spectrum, associated time structure, and spectroscopic resolution. Encouraged by these results, we have also performed extensive simulations of an upgraded instrument using with a tapered high-‐‑m neutron guide. This instrument development offers the exciting prospects of providing order-‐‑of-‐‑magnitude gains in detected neutron flux over the energy-‐‑transfer range of the instrument whilst preserving its outstanding spectroscopic capabilities (see Figure 5).
Figure 5: Incident-‐wavelength spectra at the sample position as a function of guide m-‐number. The black trace corresponds to the current spectrometer (no guide).
[1] www.isis.stfc.ac.uk/instruments/tosca/ (last accessed 22 September 2014). [2] D. Colognesi, M. Celli, F. Cilloco, R. J. Newport, S.F. Parker, V. Rossi-‐‑Albertini, F. Sacchetti, J. Tomkinson, and M. Zoppi, Appl. Phys. A 74, S64–S66 (2002).

SCARF Annual Report 2013-‐‑2014
07/11/14 10
3.2 M. R. Ryder,1,2,3 B. Civalleri,4 T. D. Bennett,5 S. Henke,5 S. Rudic,2 G. Cinque,3 F. Fernandez-Alonso,2 and J-C Tan1
1Department of Engineering Science, University of Oxford, Parks Road, Oxford OX1 3PJ, United Kingdom. 2ISIS Facility, Rutherford Appleton Laboratory, Chilton, Didcot OX11 0QX, United Kingdom. 3Diamond Light Source, Harwell Campus, Didcot, Oxford OX11 0DE, United Kingdom. 4Department of Chemistry, NIS and INSTM Reference Centre, University of Turin, via P. Giuria 7, 10125 Torino, Italy. 5Department of Materials Science and Metallurgy, University of Cambridge, Cambridge CB3 0FS, United Kingdom. 3.2.1 Identifying the Role of Terahertz Vibrations in Metal-Organic Frameworks: From Gate-Opening Phenomenon to Shear-Driven Structural Instability
Zeolitic imidazolate frameworks (ZIFs) represent a major subfamily of metal-‐‑organic frameworks (MOFs). ZIFs combine the thermal and chemical stability of inorganic zeolites with the rich topological diversity and pore size tunability characteristic of MOFs. The structures of ZIFs comprise of tetrahedral metal centres (Mn+ = Zn2+, Co2+, Li+, B3+) bridged by imidazolate-‐‑derived linkers. In this work we used high-‐‑resolution neutron and synchrotron vibrational spectroscopy, in conjunction with ab initio quantum mechanical modeling to study the vibrational properties and low-‐‑frequency conformational dynamics of three prototypical ZIF materials: ZIFs-‐‑4, -‐‑7 and -‐‑8. Their distinctive open-‐‑framework structures are depicted in Figure 6. The origin of the mid-‐‑infrared (MIR) vibrational spectra can be explained by common characteristic vibrations (e.g., bond stretching and bending), for which their spectroscopic interpretation is well established. Even in materials, as complex as MOFs, the variations are minor. Therefore the real interest of this work is to interrogate the lower energy vibrational bands observed in the far-‐‑infrared (FIR) region of the spectrum (<400 cm-‐‑1), with particular emphasis on the low-‐‑frequency vibrations under ~3 THz (~100 cm-‐‑1). Unlike in MIR spectroscopy, since there are no known characteristic frequencies resulting from stereotypical functional groups, the identification of the nature of the vibrational modes is challenging and can only be established in conjunction with high-‐‑accuracy ab initio calculations, performed on SCARF.
Figure 6: Nanoporous hybrid framework structures of (a) ZIF-‐4, (b) ZIF-‐7, and (c) ZIF-‐8, in which the inorganic building units are represented by the ZnN4 tetrahedra (in purple). Right panel depicts the complex pore morphologies and solvent accessible volumes (SAV, denoted by yellow surfaces).

SCARF Annual Report 2013-‐‑2014
07/11/14 11
3.3 S. Mukhopadhyay, M. J. Gutmann, and F. Fernandez-Alonso (ISIS) 3.3.1 Hydrogen-bond Dynamics and Proton Transfer in Room-Temperature Organic Ferroelectrics using First-principles and Neutron Scattering
Croconic acid (C5O5H2, hereafter CA) displays room-‐‑temperature ferroelectricity in its crystalline form. In the solid, CA molecules are arranged in hydrogen-‐‑bonded sheets connected through hydrogen-‐‑bonded hinges. To understand the origin of ferroelectricity in this single-‐‑component hydrogen-‐‑bonded material, it is necessary to attain an atomic-‐‑scale knowledge of the material and, particularly, of possible proton-‐‑transfer pathways. On the experimental front, we have employed IRIS at ISIS to perform quasielastic neutron scattering (QENS) and diffraction experiments over the range 5-‐‑300K. The experimental data were analysed using state-‐‑of-‐‑the-‐‑art molecular dynamics (MD) calculations based on plane-‐‑wave pseudopotential density-‐‑functional theory (DFT) as implemented in the CASTEP code. A simulation cell of 384 atoms was used with periodic boundary conditions – cf. Fig. 7 (a). Electronic structure calculations were performed using optimized norm-‐‑conserving pseudopotentials generated with the Perdew-‐‑Burke-‐‑Ernzerhof (PBE) functional within the generalized-‐‑gradient approximation (GGA) with a plane-‐‑wave cutoff of 800 eV. We find that the inclusion of dispersion corrections to the PBE functional (PBE+D) becomes necessary in order to account for the structural and spectroscopic neutron data. All MD simulations were performed in the Canonical (NVT) ensemble with a Nose-‐‑Hoover thermostat to stabilise the temperature and a MD time step of 0.5 fs. Using 500 processors on the SCARF supercomputing cluster, these calculations took about 10 days/ps.
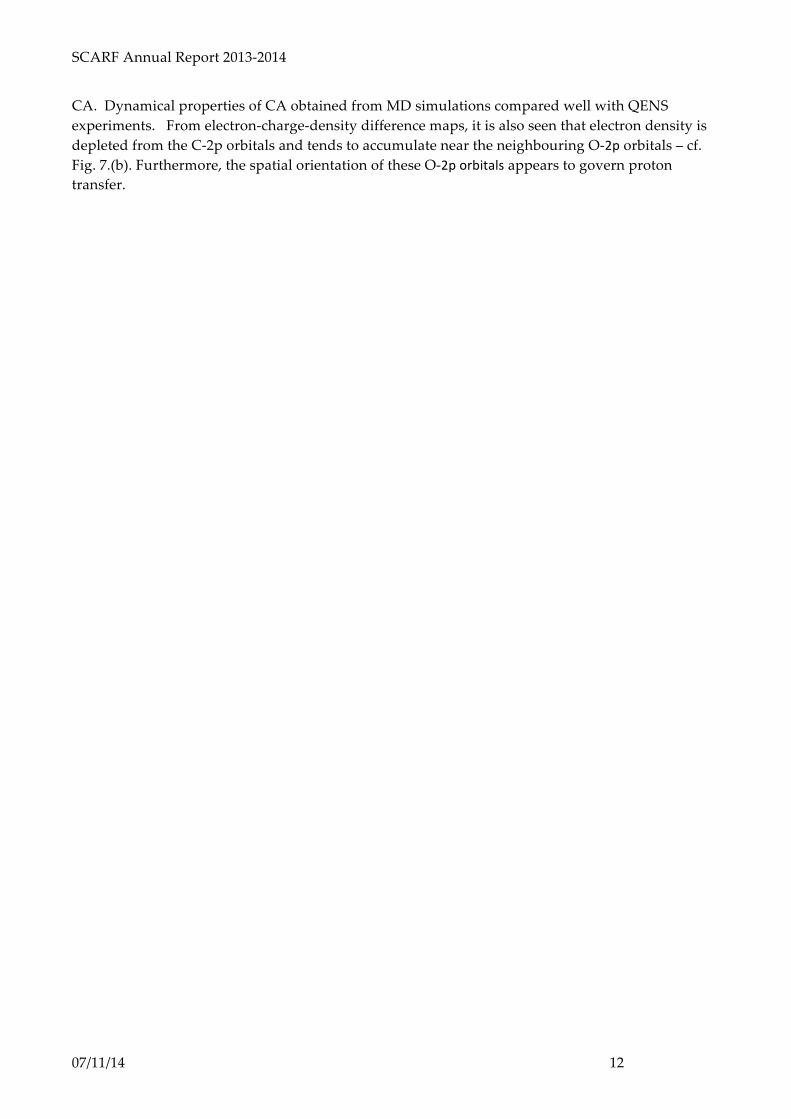
Figure 7: (a) Simulation box for solid CA used in the MD calculations. (b) Charge-‐density difference maps for crystalline CA.
Neutron observables were calculated from these simulations and compared with experimental data, highlighting the importance of anharmonic corrections in the description of vibrational motions in
(b)
SCARF Annual Report 2013-‐‑2014
07/11/14 12
CA. Dynamical properties of CA obtained from MD simulations compared well with QENS experiments. From electron-‐‑charge-‐‑density difference maps, it is also seen that electron density is depleted from the C-‐‑2p orbitals and tends to accumulate near the neighbouring O-‐‑2p orbitals – cf. Fig. 7.(b). Furthermore, the spatial orientation of these O-‐‑2p orbitals appears to govern proton transfer.

SCARF Annual Report 2013-‐‑2014
07/11/14 13
3.4 C. W. Yong1,2 1Scientific Computing Department, Science and Technology Facilities Council, Daresbury Laboratory, Sci-‐‑Tech Daresbury, Warrington WA4 4AD, UK 2Manchester Pharmacy School, Faculty of Medical and Human Sciences, Manchester Academic Health Science Centre, the University of Manchester, UK. 3.4.1 Study of interactions between polymer nanoparticles and cell membranes at atomistic levels
This is an important research work relates to the emerging field of nanotoxicology. The work was carried out in response to the invited talk for the Royal Society Discussion – Cell Adhesion Century: culture breakthrough, on 28-‐‑29 April 2014. The simulations were performed using SCARF (Scientific Computing Application Resource for Facilities), the computing resources provided by STFC'ʹs Scientific Computing Department. A paper will be published in a future issue of Philosophical Transaction B. Introduction Nanoparticles’ physical and chemical behaviour is often very different from bulk materials. Nanoparticles are now widely used in areas such as food sciences, materials sciences and common house-‐‑hold applications. The specificity and functionality of nanoparticles can be engineered and used in pharmaceuticals and medical sciences as nanomedicines, drug delivery agents and genetic therapeutic applications [1], with potential benefits for health care. As nanoparticles are produced at industrial scales, it is important to investigate their toxicological effects upon human health and the environment. In addition, degradation of bulk materials in the environment, such as polymeric packaging materials, can occur to generate micro fragments or even individual polymer chains. Indeed, it is known that nanoparticles can easily be ingested and adsorbed into living organisms [2] and yet studies regarding their biocompatibility and cytotoxicity effects are still quite limited. Whilst extra-‐‑cellular effects of nanoparticles are significant, their adhesion and entry into cells bring greater potential of both desired and toxic effects. This can take place by endocytosis, direct diffusion or membrane disruption. Clearly, there is a pressing need to understand how nanoparticles interact and adhere to cell membranes and the underlying factors and mechanisms by which nanoparticles are transferred into cells. Such knowledge would be important in the design of nanoparticles with surface morphologies that do not bring deleterious effects to living organisms, while still achieving their intended functions. A series of molecular simulations has been carried out, to investigate polymer nanoparticles’ interaction with the cell membranes, namely, the interactions of polyethylene (PE) and polystyrene (PS) nanoparticles with the POPC (1-‐‑palmitoyl-‐‑2-‐‑oleoyl-‐‑sn-‐‑glycero-‐‑3-‐‑phosphocholine) lipid cell membrane. These polymers are produced in a huge quantity annually and are found in abundance in industry, as well as the environment. The simulations are based on fully atomistic models using DL_POLY_4 package [3] and DL_FIELD [4] was used to set up the force field models. The aim is to investigate the initial stages of the polymer adsorption behaviour and their underlying mechanistic details, rather than exploring the whole process of subsequent particle uptake by the membranes. It is found that irreversible adhesion can be initiated by insertion of dangling chain ends from the polymer into the hydrophobic interior of the POPC membrane. In addition, the side groups, as well as the nature of chain entanglements, can also influence the behaviour of the membrane interaction
SCARF Annual Report 2013-‐‑2014
07/11/14 14
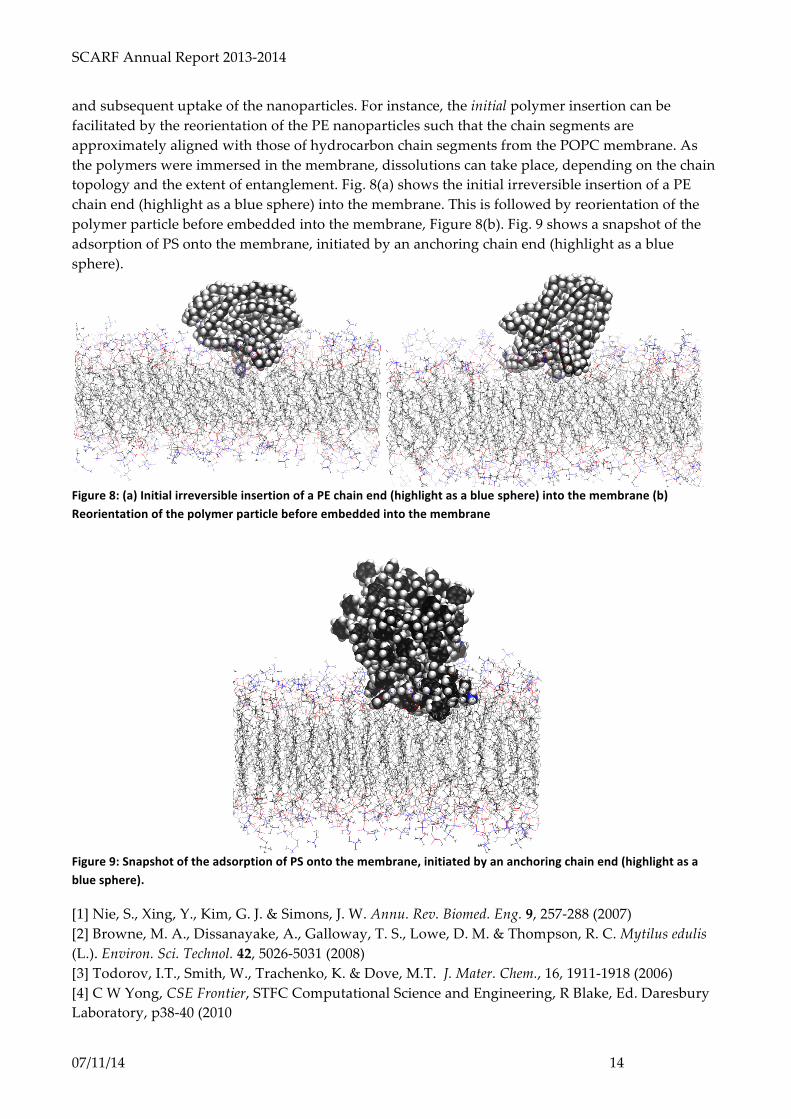
and subsequent uptake of the nanoparticles. For instance, the initial polymer insertion can be facilitated by the reorientation of the PE nanoparticles such that the chain segments are approximately aligned with those of hydrocarbon chain segments from the POPC membrane. As the polymers were immersed in the membrane, dissolutions can take place, depending on the chain topology and the extent of entanglement. Fig. 8(a) shows the initial irreversible insertion of a PE chain end (highlight as a blue sphere) into the membrane. This is followed by reorientation of the polymer particle before embedded into the membrane, Figure 8(b). Fig. 9 shows a snapshot of the adsorption of PS onto the membrane, initiated by an anchoring chain end (highlight as a blue sphere).
Figure 8: (a) Initial irreversible insertion of a PE chain end (highlight as a blue sphere) into the membrane (b) Reorientation of the polymer particle before embedded into the membrane
Figure 9: Snapshot of the adsorption of PS onto the membrane, initiated by an anchoring chain end (highlight as a blue sphere).
[1] Nie, S., Xing, Y., Kim, G. J. & Simons, J. W. Annu. Rev. Biomed. Eng. 9, 257-‐‑288 (2007) [2] Browne, M. A., Dissanayake, A., Galloway, T. S., Lowe, D. M. & Thompson, R. C. Mytilus edulis (L.). Environ. Sci. Technol. 42, 5026-‐‑5031 (2008) [3] Todorov, I.T., Smith, W., Trachenko, K. & Dove, M.T. J. Mater. Chem., 16, 1911-‐‑1918 (2006) [4] C W Yong, CSE Frontier, STFC Computational Science and Engineering, R Blake, Ed. Daresbury Laboratory, p38-‐‑40 (2010

SCARF Annual Report 2013-‐‑2014
07/11/14 15
3.5 G. Graziano (University College London), M. J. Gutmann (ISIS), A. Michaelides (University College London), and F. Fernandez-Alonso (ISIS & University College London) 3.5.1 Nuclear dynamics of carbon atoms in graphite
Although graphite is ubiquitous and has been the subject of a large body of experimental and theoretical works, a consistent physical picture describing carbon motions in this material does not exist. This work attempts to bridge this gap in our understanding by looking at the contribution of harmonic, anharmonic, and higher-‐‑order nuclear-‐‑quantum effects to carbon displacements. To this end, we have performed accurate single-‐‑crystal neutron diffraction (SXND) measurements to obtain anisotropic displacement parameters (ADPs) as a function of temperature. Following the formalism developed by Gutmann et al. [1], it has been possible to extract the ADPs from calculated phonon eigenvectors and eigenfrequencies using DFT on a number of functionals. Theoretical estimates of atomic displacements have also been obtained by direct recourse to classical ab initio molecular dynamics (AIMD) and are also being obtained by ongoing path-‐‑integral molecular dynamics (PIMD) simulations. The computed ADPs have been compared to experimental data. Our results to date are summarised in Fig. 10, showing that harmonic and quasiharmonic DFT calculations do not provide a quantitative agreement with experimental data for either in–plane or out–of–plane carbon displacements. Moreover, a classical description of carbon motions is no longer valid at temperatures well below 300 K, particularly along the crystallographic (soft) c-‐‑axis. These results have direct implications in future studies of processes where carbon dynamics need to be taken into account explicitly, including molecular diffusion on carbon-‐‑based materials or electric-‐‑ and thermal-‐‑transport properties. In particular, we anticipate that care must be exercised for a quantitative description of the adsorption and uptake of light molecules like hydrogen by graphite-‐‑based materials, particularly at low temperatures.
(a) (b)
Figure 10: Carbon ADPs as a function of temperature. (a) shows in-‐plane ADPs (u11 and u22) whereas (b) shows out-‐of-‐plane ADPs (u33).
Computed ADPs using the optB88-‐‑vdW functional [2] (solid lines) are compared to single-‐‑crystal neutron diffraction data (dashed line). Blue triangles refer to ADPs derived from phonon eigenvectors and frequencies within the harmonic approximation. Magenta triangles correspond to quasiharmonic results, obtained by performing phonon calculations on the unit cell derived from experimental data. Green data correspond to ADPs obtained from AIMD simulations. Additional neutron experiments on VESUVIO and TOSCA at ISIS have been conducted to probe the carbon momentum distribution and vibrational density of states with high-‐‑resolution. Comparison

SCARF Annual Report 2013-‐‑2014
07/11/14 16
of these experiments with first-‐‑principles calculations is in progress, including an assessment of the adequacy of van der Waals functionals to describe this ubiquitous material. [1] M. J. Gutmann, K. Refson, M. v. Zimmermann, I. P. Swainson A. Dabkowski, and H. Dabkowska, J. Condens. Matter 25, 315402 (2013).���[2] J. Klimeš, D. R. Bowler and A. Michaelides, J. Phys.: Condens. Matter 22, 022201 (2010).

SCARF Annual Report 2013-‐‑2014
07/11/14 17
3.6 R. Scott (CLF) 3.6.1 Work performed on SCARF 2013-2014
I have performed a wide range of simulation work has been performed on Scarf-‐‑Lexicon 2 over the last year including both personal research and simulations for users of the CLF from universities. A group from the university of Oxford uses the CLF’s Astra-‐‑Gemini laser to accelerate electrons to GeV energies using the ‘plasma wakefield’ technique, which, if perfected, will revolutionise future accelerator technology. Their experimental data showed some encouraging but hard to understand results. Using the 3 dimensional radiation-‐‑hydrodynamics code FLASH and the particle-‐‑in cell code EPOCH running on the Scarf-‐‑Lexicon 2 cluster, this work is making rapid progress in understanding the physics behind the experimental data. This should enable future experiments to be optimized, bringing the next generation of particle accelerators closer to reality. Physicists from Imperial College London have devised a new way of creating very short, intense bunches of coherent x-‐‑rays. As the coherent bunches pass through material of differing refractive index, the x-‐‑rays move out of phase with one another. This dephasing can greatly enhance the image quality in comparison to conventional x-‐‑ray imaging by using a technique called phase contrast imaging, which may be of great benefit to medicine. The radiation hydrodynamics code FLASH has been used both in the design and interpretation of an
experiment on the Astra-‐‑Gemini laser at the CLF. Particle-‐‑in-‐‑cell modelling using the code EPOCH on the Scarf-‐‑Lexicon 2 cluster, has been using to explore the feasibility of an innovative new laser-‐‑plasma interaction geometry. This work has shown for the first time that it is possible to create a convergent fast-‐‑electron (1-‐‑3MeV) beam from the laser-‐‑plasma interaction. The extremely high-‐‑current fast-‐‑electron beam can be focused at a specified depth within a solid target. This work may be very important to the fast-‐‑ignition inertial confinement fusion concept, which proposes the use of a beam of fast-‐‑electrons to heat compressed Deuterium and Tritium fuel to initiate thermonuclear fusion.
Figure 11: A thin filament of ionized Hydrogen caused by the Astra-‐Gemini laser’s pre-‐pulse. Modelled using EPOCH on Scarf-‐Lexicon 2.
Figure 12: A convergent beam of fast-‐electrons modelled using EPOCH on Scarf-‐Lexicon 2.

SCARF Annual Report 2013-‐‑2014
07/11/14 18
3.7 D.J. Voneshen (RHUL), K. Refson (STFC), J.P. Goff (RHUL) 3.7.1 Rattling modes in new thermoelectrics
The need for both high electrical conductivity and low thermal conductivity creates a design conflict for thermoelectric systems, leading to the consideration of materials with complicated crystal structures. Rattling of ions in cages results in low thermal conductivity, but understanding the mechanism through studies of the phonon dispersion using only momentum-‐‑resolved spectroscopy is made difficult by the complexity of the unit cells. This necessitates a combined experimental and theoretical approach to understand the low thermal conductivity in these compounds. Previously we have studied the so-‐‑called ‘square phase’ of NaxCoO2 [1]. Our more recent work has focused on how changing the superstructure affects the thermal conductivity. We have performed a number of experiments at ISIS (MERLIN and SXD), ILL (IN8) and ESRF (ID28) to probe this.
Figure 13: (a) The superstructure of calcium doped sodium cobaltate with Ca ions (in yellow) sitting at the centre of di-‐vacancy clusters. (b)The Phonon dispersion calculated on SCARF as colour contour plot and places phonons have been observed experimentally shown as red hexagons.(c) The real space atomic displacements of the Ca rattling mode observed at 19.5 meV. The vectors show the true direction of motion but with scaled amplitude.
We have also used CASTEP on SCARF to calculate the lattice dynamics in support of these experiments. In these we have focused on the doped cobaltate Na0.57Ca0.14CoO2 which has a long range superstructure based on di-‐‑vacancy clusters, as shown in figure 13a [2]. We have mapped out the dispersion for this system, and in figure 1b we show the excellent agreement with experiment along the ΓM direction. We observed an approximately flat mode near to 20meV and our SCARF calculation shows that this is the rattling mode shown in figure 1c. The rattling mode is shifted to higher energies by 50% compared to the square phase due to the change in superstructure. This shift in energy has subtle effects on the rest of the dispersion, but the change in energy scale of the rattler causes a factor 3 increase in the thermal conductivity which is a parameter of direct technological importance. [1] D. J. Voneshen, K. Refson, E. Borissenko, M. Krisch, A. Bosak, A. Piovano, E. Cemal, M. Enderle, M. J. Gutmann, M. Hoesch, M. Roger, L. Gannon, A. T. Boothroyd, S. Uthayakumar, D. G. Porter, J. P. Goff, Nature Materials (2013) doi:10.1038/nmat3739 [2] D. G. Porter, M. Roger, M. J. Gutmann, S. Uthayakumar, D. Prabhakaran, A. T. Boothroyd, M. S. Pandiyan, and J. P. Goff, PRB (2014), doi: 10.1103/PhysRevB.90.054101
(a) (b) (c)

SCARF Annual Report 2013-‐‑2014
07/11/14 19
3.8 V. Losasso (STFC) 3.8.1 Computational studies of EGFR extracellular and intracellular domains
Epidermal growth factor receptor (EGFR) belongs to the ErbB family of receptor tyrosine kinases, activated by binding with growth factors of the EGF-‐‑family of proteins. Its signaling controls key cellular functions. Deregulation of EGFR activity is frequently linked to the development and progression of several human tumors [1]. The EGFR protein consists of an extracellular ligand binding extracellular (EC) domain, a transmembrane (TM) alpha-‐‑helical domain and an intracellular (IC) domain, composed of a juxtamembrane region, a kinase domain (KD) and a C-‐‑terminal regulatory domain [2]. Our calculations on the SCARF cluster are focused on the description of EC (i), TM (iii) and IC (iii) domains. In particular: We are carrying out classical molecular dynamics simulation of EC as a whole (Fig. 14a) as well as force distribution analysis [3] and metadynamics [4] calculation on its so-‐‑called subdomain IV (residues 481-‐‑621) (Fig. 14b), with the aim of understanding the role of the EC-‐‑TM linker region (residues 605-‐‑618, Fig. 14c) on the EC flexibility. Active and inactive EGFR TM dimers are being simulated both in their wild-‐‑type and modified isoforms, in order to assess the effect of post-‐‑translational modifications on the effect of the dimer stability (Fig. 15). KD domains are being investigated in their asymmetric (Fig. 16a) and symmetric (Fig 16b, 16c) conformations, in complex with different ligands. Ligand molecules are composed of kinase inhibitors used as anticancer drugs such as gefitinib, which are attached to fluorescent probes via linkers of different length. These studies are aimed at complementing FRET microscopy data provided by the group of Marisa Martin-‐‑Fernandez at RAL. Simulations extending to hundreds of nanoseconds for each of the many systems under investigation have only been possible thanks to an extensive use of the SCARF cluster. Three manuscripts based on this work are currently in preparation.
Figure : 14 A) EGFR EC domain on membrane. B) subdomain IV (residues 481-‐621); C) linker region (residues 605-‐618).

SCARF Annual Report 2013-‐‑2014
07/11/14 20
Figure 15: EGFR TM domain. A) active conformation; B) inactive conformation. The two monomers are represented in different colors.
Figure 16: EGFR kinase dimers in complex with gefitinib + fluorescent dyes. A) asymmetric conformation (PDB 2GS2); B) symmetric conformation (PDB 2GS7); C) alternative symmetric conformation (PDB 3GT8).
[1] Normanno N, De Luca A, Bianco C, Strizzi L, Mancino M, Maiello MR, Carotenuto A, De Feo G, Caponigro F, Salomon DS. Epidermal growth factor receptor (EGFR) signaling in cancer. Gene 66(1):2-‐‑16, 2006. [2] Voldborg, B.R., Damstrup, L., Spang-‐‑Thomsen, M. and Poulsen, H.S. (1997). Epidermal growth factor receptor (EGFR) and EGFR mutations, function and possible role in clinical trials. Ann Oncol 8, 1197-‐‑ 1206. [3] Costescu, B.I. and Graeter, F. (2013). Time-‐‑resolved force distribution analysis. BMC Biophys. 6(1), 5. [4] Tribello, G.A., Bonomi, M., Branduardi, D., Camilloni, C. and Bussi, G (2014). PLUMED2: New feathers for an old bird. Comp Phys Comm. 185, 604.
SCARF Annual Report 2013-‐‑2014
07/11/14 21
3.9 H. Loeffler (STFC)
3.9.1 Free Energy Simulations of Protein Receptors and Solvated Organic Molecules
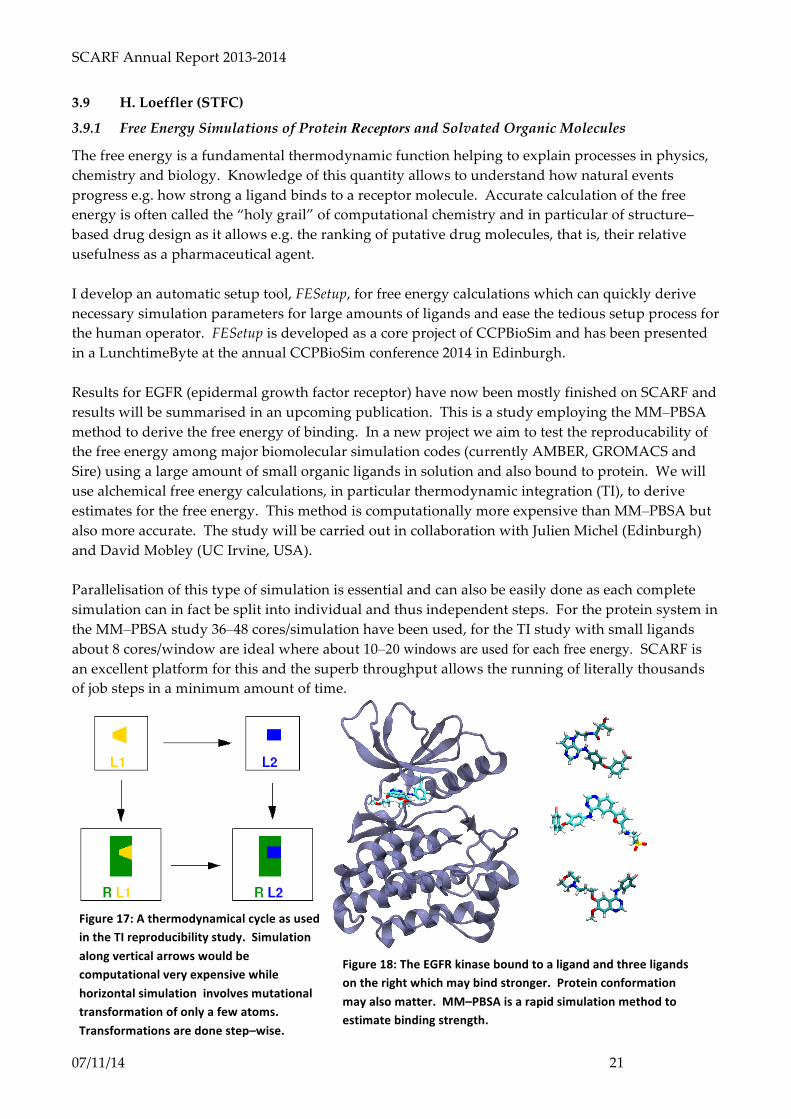
The free energy is a fundamental thermodynamic function helping to explain processes in physics, chemistry and biology. Knowledge of this quantity allows to understand how natural events progress e.g. how strong a ligand binds to a receptor molecule. Accurate calculation of the free energy is often called the “holy grail” of computational chemistry and in particular of structure–based drug design as it allows e.g. the ranking of putative drug molecules, that is, their relative usefulness as a pharmaceutical agent. I develop an automatic setup tool, FESetup, for free energy calculations which can quickly derive necessary simulation parameters for large amounts of ligands and ease the tedious setup process for the human operator. FESetup is developed as a core project of CCPBioSim and has been presented in a LunchtimeByte at the annual CCPBioSim conference 2014 in Edinburgh. Results for EGFR (epidermal growth factor receptor) have now been mostly finished on SCARF and results will be summarised in an upcoming publication. This is a study employing the MM–PBSA method to derive the free energy of binding. In a new project we aim to test the reproducability of the free energy among major biomolecular simulation codes (currently AMBER, GROMACS and Sire) using a large amount of small organic ligands in solution and also bound to protein. We will use alchemical free energy calculations, in particular thermodynamic integration (TI), to derive estimates for the free energy. This method is computationally more expensive than MM–PBSA but also more accurate. The study will be carried out in collaboration with Julien Michel (Edinburgh) and David Mobley (UC Irvine, USA). Parallelisation of this type of simulation is essential and can also be easily done as each complete simulation can in fact be split into individual and thus independent steps. For the protein system in the MM–PBSA study 36–48 cores/simulation have been used, for the TI study with small ligands about 8 cores/window are ideal where about 10–20 windows are used for each free energy. SCARF is an excellent platform for this and the superb throughput allows the running of literally thousands of job steps in a minimum amount of time.
Figure 18: The EGFR kinase bound to a ligand and three ligands
on the right which may bind stronger. Protein conformation may also matter. MM–PBSA is a rapid simulation method to estimate binding strength.
Figure 17: A thermodynamical cycle as used in the TI reproducibility study. Simulation along vertical arrows would be computational very expensive while horizontal simulation involves mutational transformation of only a few atoms. Transformations are done step–wise.

SCARF Annual Report 2013-‐‑2014
07/11/14 22
3.10 R. Fernandez-Perea (iem-CSIC), S. Mukhopadhyay (ISIS), C. Cabrillo (iem-CSIC), F. Fernandez-Alonso (ISIS and University College London)
3.10.1 Towards a better description of carbon-based nanomaterials
Carbon, with its incredibly rich variety of polymorphs, is one of the most common ingredients in novel nanostructured materials. Some of its novel polymorphs are paradigmatic of the nanoscience “revolution” (think of fullerenes, nanotubes, and graphene). It is also a light element, something particularly important for gas-‐‑storage applications. Indeed, carbon-‐‑based nanostructured materials (CNMs) have been extensively investigated as potential hydrogen-‐‑storage media (see Ref. [1] and references therein), mostly in its “nanotube” forms. While early experimental reports of their performance were encouraging [2], these have not stood the test of time. Much of the work performed to date in the search for the ideal, carbon-‐‑based gas store has been based on a “trial-‐‑and-‐‑error” approach. As a consequence, whether carbon-‐‑based substrates can outperform current technologies is still a matter of debate and controversy. Strong indications of the untapped potential of CNMs as next-‐‑ generation sorbents come mainly from simulation and theoretical work over the past few years [3]. In theory, practical hydrogen-‐‑storage requirements may be attained in graphite-‐‑based CNMs via the optimization of the interlayer distance (d) between graphitic planes (see Ref. [3]). Optimal volumetric capacities at room temperature and moderate pressures (<100 bar) become achievable for d=6-‐‑7 Å. Similar conclusions have also been reached in more recent computational studies exploring super-‐‑expanded graphitic nanostructures [3]. The vast majority of the computational or “in-‐‑silico” studies performed to date deal with rigid CNMs. On the experimental front, we have recently discovered using neutron-‐‑scattering experiments conducted at ISIS hitherto unknown deformation mechanisms in high-‐‑quality CNMs when subjected to moderate pressures (<5MPa), leading to a sensible enhancement of hydrogen uptake [4]. To understand the mechanism and process involved in these deformations of CNM porous materials as well as other experiments of carbon nanostructures carried out at ISIS, we have carried out extensive simulations using empirical Brenner-‐‑Stuart potentials, yet we find that these simulations cannot reproduce the experimental results given their poor description of dispersive interactions. To circumvent this limitation, we have embarked on a detailed characterisation of van-‐‑der-‐‑Waals interactions in CNMs using first-‐‑principles methodologies. This work has been partially supported by a STFC-‐‑CMSD travel grant and research grant MAT2012-‐‑33633 “Carbon Nanostructured Materials for Molecular Trapping and Confinement” from the Spanish Dirección General de Investigación Científica y Técnica.
As shown in recent works, new van-‐‑der-‐‑Waals DFT functionals provide a convenient starting point to attain an accurate representation of interlayer interactions in soft layered materials [5]. As a first step, we chose to examine an intrinsic (so-‐‑called) type-‐‑II stacking fault in graphite, for which ample experimental data exist (see Fig. 19). To this end, a series of large-‐‑scale DFT simulations using CASTEP and the PBE+D functional on the SCARF-‐‑RAL cluster were carried out in order to assess realm of applicability of the celebrated Brenner-‐‑Stuart potential. As shown in Fig. 20, the DFT results display a smooth dependence with basal shift and these results are in quantitative agreement with available
Figure 19: Cell tilt

SCARF Annual Report 2013-‐‑2014
07/11/14 23
experimental data. Meanwhile, a classical description of the material using Brenner-‐‑Stuart potentials is not only inherently noisy but also underestimate energy barriers by as much as an order of magnitude.
0
1
2
3
4
5
6
0 0.8 1.6 2.4 3.2 4 4.8 5.6
Brenner-StuartCASTEP
meV
Å-1
Basal shift (Å)
0
0.5
1
1.5
2
2.5
3
0 0.8 1.6 2.4 3.2 4 4.8
Brenner-StuartCASTEP
meV
Å-1
Basal shift (Å) Figure 20: Intrinsic stacking fault energy cost for the in-‐plane nearest-‐neighbour bond direction and the lattice-‐vector direction.
On the basis of the above results, we are in the process of developing new effective two-‐‑body potentials to reproduce the DFT results. This task has required additional calculations, including potential-‐‑energy scans across a wide range of interlayer distances (cf. Fig. 21).
-1 102
0
1 102
2 102
3 102
4 102
2.00 4.00 6.00 8.00 10.0 12.0 14.0
meV
per
ato
m
interlayer distance (Å)
-10
-8
-6
-4
-2
0
6.00 7.00 8.00 9.00 10.0 11.0 12.0 13.0 14.0
Figure 21: Energy scan as a function of interlayer distance for A-‐A Graphite (the insert shows the long-‐range behaviour of this potential-‐energy curve).
This computational work also highlights current challenges associated with the blind use of available (and widely used) two-‐‑body interaction potentials for CNMs. At this stage, we believe that the most probable cause of these shortcomings is related to the unavoidable presence of intermediate graphitic layers in complex geometries like those found in nanotubes, as well as the necessity to take into account longer-‐‑ranged interactions. To test this hypothesis and develop the more accurate classical potential mentioned above, a number of potential-‐‑energy curves for two-‐‑

SCARF Annual Report 2013-‐‑2014
07/11/14 24
and three-‐‑layered systems were also calculated using DFT methods (see Figs. 22-‐‑23). Given the inherently large system sizes of interest here, these calculations were computationally intensive and could not have been performed without recourse to the highly parallelised version of the CASTEP code currently available on SCARF.
-50
0
50
1 102
1.5 102
2 102
2.5 102
3 102
2.00 4.00 6.00 8.00 10.0 12.0 14.0 16.0 18.0
meV
per
ato
m
interlayer distance (Å)
-5
-4
-3
-2
-1
0
6.00 8.00 10.0 12.0 14.0 16.0 18.0
Figure 22: Two-‐layer interaction potential
-50
0
50
1 102
1.5 102
2 102
2.5 102
3 102
2.00 4.00 6.00 8.00 10.0 12.0 14.0m
eV p
er a
tom
interlayer distance (Å)
-7
-6
-5
-4
-3
-2
-1
0
6.00 7.00 8.00 9.00 10.0 11.0 12.0 13.0 14.0
Figure 23: Three-‐layer interaction potential
[1] M. Felderhoff, C. Weidenthaler, R. von Helmolt, and U. Eberle, Phys. Chem. Chem. Phys. 9, 2643 (2007); L. Zhou, Renew. Sust. Energy Rev. 9, 395 (2005); A. Züttel, Naturwissenschaften 91, 157 (2004). [2] A. Dillon et al., Nature (London) 386, 377 (1997); P. Chen et al., Science 285, 91 (1999). [3] S. Patchkovskii et al., Proc. Nat. Acad. Sci. (USA) 102, 10439 (2005); G. Mpourmpakis, E. Tylianakis and G. E. Froudakis, Nanoletters 7, 1893 (2007); G. K. Dimitrakis, E. Tylianakis and G. E. Froudakis, Nanoletters 8, 3166 (2008); Y.F. Zhao et al., Phys. Rev. B 78, 144102 (2008); S.S. Han, Chem. Comm. 36, 5427 (2009); Z.M. Ao et al., Solid State Comm. 149, 1363 (2009); Tylianakis and G. E. Froudakis, J. Phys. Chem. Lett 1, 2459 (2010). [4] Publication in preparation. [5] Graziano et al., J. Phys.: Condens. Matter 24 424216 (2012)

SCARF Annual Report 2013-‐‑2014
07/11/14 25
3.11 R. J. Dance1, D. A. MacLellan1, D. C. Carroll1, R. J. Gray1, N. Booth2, M. Burza3, M. P. Desjarlais4, F. Du5, B. Gonzalez-Izquierdo1, D. Neely2, H. W. Powell1, A. P. L. Robinson2, D. R. Rusby1,2, G. G. Scott1,2, X. H. Yuan6, C.-G. Wahlstrom3 and P. McKenna1
1Department of Physics, SUPA, University of Strathclyde, Glasgow G4 0NG, United Kingdom 2Central Laser Facility, STFC Rutherford Appleton Laboratory, Oxfordshire OX11 0QX 3Department of Physics, Lund University, Post Office Box 118, S-‐‑22100 Lund, Sweden 4Sandia National Laboratories, Post Office Box 5800, Albuquerque, New Mexico 87185, USA 5Beijing National Laboratory of Condensed Matter Physics, Institute of Physics, Chinese Academy of Sciences, Beijing 100190, China 6Department of Physics and Key Laboratory for Laser Plasmas (Ministry of Education), Shanghai Jiao Tong University, Shanghai 200240, China 3.11.1 The effect of low temperature resistivity on fast electron transport in solids
The transport of mega-‐‑ampere currents of relativistic electrons through solid targets is of fundamental interest due to its impact on a wide variety of applications including generation of bright x-‐‑ray sources [1], ion acceleration [2], and the fast ignition approach to inertial fusion [3]. The transport of an electron beam through a solid material is influenced strongly by a number of factors including the resistivity of the target material and the magnetic field generated by the electron beam itself. Recent work has shown that the lattice structure of the material is important for fast electron transport [4]. This atomic scale structural change between different allotropes manifests itself as a change in resistivity, which has been recognised as a key influence on fast electron transport. In previous studies, the variation of resistivity with material temperature has often been assumed to follow the Spitzer model which applies for fully ionised and non-‐‑degenerate plasma, and does not apply to lower temperature material. However, the highest temperatures occur only within the first tens of microns of material close to the target front surface, leaving the electron beam generated at the interaction point to propagate through material at a much lower temperature (sub 50eV), and it becomes clear that the transport of electrons through lower temperature material [even in these extreme interactions] and hence the resistivity in this regime is important to the resulting transport.
Figure 24: Hybrid-‐PIC simulations showing the fast electron density for peak intensity of 5x10²⁰ Wcm-‐2 (all densities on log scale) (m-‐3) at 1.4ps after laser irradiation comparing the (a), (b) Spitzer, (c),(d) Lee-‐More and (e),(f) QMD Kubo-‐Greenwood models. A lower intensity of 5x10¹⁹ Wcm-‐2 using the QMD model is shown in (g), (h) [5].

SCARF Annual Report 2013-‐‑2014
07/11/14 26
To accurately model this complex interaction, the ability to run large simulations is critical. The interaction between PW scale laser pulses and solid targets presents a significant computational challenge, with high resolutions simulations required to resolve the dynamics of these relativistic electrons in high density material. In this work, recently published in Physics Review Letters [5], the role of target resistivity has been investigated in detail using a combination of theoretical calculations of resistivity profiles, and 3D hybrid-‐‑PIC (Zephyros [6]) simulations on the SCARF cluster. This series of simulations directly compares the use of the Spitzer resistivity model, Lee-‐‑More and QMD Kubo-‐‑Greenwood models which, in increasing levels of detail, account for lower temperature regions of the plasma. All three of these models converge to the same resistivity at high temperatures. Figure 24 [5] shows a striking difference between the three models for peak intensity 5x10²⁰ Wcm-‐‑2. For the Spitzer model (a) -‐‑ (b), the electron transport is shown to produce a smooth beam profile at the rear surface. The Lee-‐‑More model (c) -‐‑ (d) shows filamentation of the electron beam, clearly evident in the side view and rear surface beam profile. The QMD Kubo-‐‑Greenwood simulation (e) -‐‑ (f) results produce a very distinct transport pattern which produces an annulus in the rear surface density profile. Figure 24 (g) – (h), the QMD calculation is used for a lower intensity of 5x10¹⁹ Wcm-‐‑2 , and shows the annulus disappear from the electron profile.
These results are shown to be in broad agreement with experimental measurement of the spatial dose profile at the Vulcan TAP facility at RAL, shown in Figure 25(a)-‐‑(c) [5]. A clear ring structure is seen in the proton beam produced from the rear surface of a 300um silicon target, which through the development of a analytical model, is directly related to annular transport of electrons within the target. This work shows that the few-‐‑eV region of the temperature-‐‑resistivity profile is important as it can have a great effect on the resulting fast electron
transport. It also further highlights the potential to produce annular electron or proton beams for applications such as fast ignition fusion schemes [7,8]. This work has been presented in several invited talks both nationally and internationally: Laser-‐‑driven ion acceleration at the University of York (May 2013), Photonics Ireland international conference (2013), CLPU workshop at the university of Salamanca, Spain (2013), Culham Plasma Physics Summer School (Jul 2014), CETAL facility forum (2013), 13th International Workshop on Fast Ignition of Fusion Targets (Sep 2014), International Conference: Laser-‐‑Optics-‐‑2014 (Jul 2014), Invited seminar: Current structures in relativistic laser-‐‑solid interactions (invited seminar, 2014) and talk at SPIE Inertial Fusion Energy conference (2013). We acknowledge the expert support of the staff at the CLF, and the use of computing resources provided by the STFC e-‐‑Science Facility. This work is supported by EPSRC (Grant No.
Figure 25: (a) -‐ (c) proton spatial intensity distributions measured at 7.3MeV for peak laser intensity of (a) 6x10¹⁹
Wcm-‐2, (b) 4x10²⁰ Wcm-‐2 and (c) 6.8x10²⁰ Wcm-‐2 [5].

SCARF Annual Report 2013-‐‑2014
07/11/14 27
EP/J003832/1), the Swedish Research Council, and the National Science Foundation of China (Grant No. 11205100). [1] M. D. Perry et al., Rev. Sci. Instrum. 70, 265 (1999) [2] X. H. Yuan et al., New J. Phys. 12, 063018 (2010) [3] M. Tabak et al., Phys. Plasmas 1,1626 (1994) [4] P. McKenna et al., Phys. Rev. Lett. 106 185004 (2011) [5] D. A. Maclellan et al., Phys. Rev. Lett. 111 095001 (2013) [6] A. P. L. Robinson et al., Phys. Rev. Lett. 108, 125004 (2012) [7] M. Storm et al., Phys Rev. Lett. 102, 235004 (2009) [8] J. A. Koch et al., Phys. Rev. E 65, 016410 (2001)

SCARF Annual Report 2013-‐‑2014
07/11/14 28
3.12 R. J. Dance1, D. A. MacLellan1, D. C. Carroll1, R. J. Gray1, N. Booth2, M. Burza3, M. P. Desjarlais4, F. Du5, D. Neely2, H. W. Powell1, A. P. L. Robinson2, G. G. Scott1,2, X. H. Yuan6, C.-G. Wahlström3, and P. McKenna1
1SUPA, Department of Physics, University of Strathclyde, Glasgow G4 0NG, United Kingdom 2Central Laser Facility, STFC Rutherford Appleton Laboratory, Oxfordshire OX11 0QX 3Department of Physics, Lund University, P.O. Box 118, S-‐‑22100 Lund, Sweden 4Sandia National Laboratories, P.O. Box 5800, Albuquerque, New Mexico 87185, USA 5Beijing National Laboratory of Condensed Matter Physics, Institute of Physics, Chinese Academy of Sciences, Beijing 100190, China 6Key Laboratory for Laser Plasmas (Ministry of Education) and Department of Physics and Astronomy, Shanghai Jiao Tong University, Shanghai 200240, China 3.12.1 The effect of resistivity gradients on the transport of fast electrons in solid material
Lattice structure plays a critical role in the electrical resistivity of materials, and further that this has a strong effect on the transport of fast electrons [1]. The low temperature component of the resistivity-‐‑temperature profile has been shown to have great effect on the resulting electron transport [2]. In this work, we build on this by looking in detail at the effects of a resistivity gradient
within the target. The resistivity gradient is produced by isochorically heating the target with a beam of laser-‐‑driven protons accelerated from a secondary target (see Figure 26). The spatial intensity distribution of protons accelerated from the rear surface of the preheated target is used to diagnose changes in fast electron transport by observing structural changes in the proton beam. Simulations of this preheated target were done using the 3D hybrid-‐‑PIC code Zephyros on the SCARF cluster, to produce the fast electron density profile at the rear surface. Accurate simulation of this interaction required adjustment to the Zephyros code [3], to enable the degree of lattice melt induced by the proton beam to define the initial resistivity profile of the target. Figure 2 shows the key simulation results (see Fig. 27 (a) -‐‑ (f)), illustrating that for interactions where there is no resistivity gradient present, the fast electron beam is smooth in profile ((a) -‐‑ (c)), with very little structure at the target rear surface. For an interaction where the target has been pre-‐‑heated by protons (Figure 27 (d) -‐‑ (f)), the electron and proton profiles take on a ring like
structure which further contains an asymmetry. This is more subtle in the electron beam and is highlighted by white line out in Fig 2(e). These results were tested on an experimental campaign at the TAW facility, and it was found that the measured proton beam distributions (Figure 27 (g) -‐‑ (i)) are in good qualitative agreement with those produced from simulations (see Fig.27), reproducing well the ring structure and its asymmetry. These hybrid-‐‑PIC modelling and experimental results have been recently published in Physics Review Letters [4], and show for the first time that resistivity gradients have a strong effect on the transport of fast electrons within the target.
By use of a laser-‐‑driven beam of protons to isochorically preheat the target, we demonstrate that the divergence, spatial intensity profile and symmetry of the fast electron beam can be actively manipulated by changing the temperature and resistivity gradients within the target. Using
Figure 26: Experimental schematic. Sheath accelerated protons produced by the beam 1 gold target heat the Si target at an angle, producing a resistivity gradient by different degrees of lattice melt. The beam 2 pulse is used to accelerate a population of electrons into the target and the sheath accelerated protons from the rear surface of Si are used to diagnose changes to FET [4].

SCARF Annual Report 2013-‐‑2014
07/11/14 29
variations of the approach used here, the aforementioned properties of the fast electron beam can be changed easily without the need for complex target engineering. The production of annular electron beams has been predicted to significantly lower the energy required for the fast ignition fusion regime, and as such the potential to reproduce annular transport is of key interest [5, 6].
Figure 27: For peak laser intensity of 7x10¹⁹Wcm-‐2, we show the fast electron density maps (a) -‐ (b) and proton profiles for an unheated target, and for preheated targets (d) -‐ (e) fast electron density and (f) proton profile showing much increased structure. Also shown are the experimental proton beams for a (g) unheated, with 10ps (h) and 30ps (i) of proton preheating before beam 2 pulse arrives [4].
This work has been presented in several invited talks both nationally and internationally: Laser-‐‑driven ion acceleration at the University of York (May 2013), Photonics CLPU workshop at the University of Salamanca, Spain (2013), Culham Plasma Physics Summer School (Jul 2014), CETAL facility forum (2013), 13th International Workshop on Fast Ignition of Fusion Targets (Sep 2014), International Conference: Laser-‐‑Optics-‐‑2014 (Jul 2014), Invited seminar: Current structures in relativistic laser-‐‑solid interactions (invited seminar, 2014) and talk at SPIE Inertial Fusion Energy conference (2013). We acknowledge expertise of the staff at the CLF, and the use of computing resources provided by the STFC e-‐‑Science project. This work is financially supported by EPSRC (Grants No. EP/J003832/1, No. EP/L001357/1, and No. EP/K022415/1). The research leading to these results has also received funding from LASERLAB-‐‑EUROPE (Grant No. 284464, EC’s Seventh Framework Programme) and from the Air Force Office of Scientific Research, USAF (Grant No. FA8655-‐‑13-‐‑1-‐‑3008). [1] P. McKenna et al., Phys. Rev. Lett. 106 185004 (2011) [2] D. A. Maclellan et al., Phys. Rev. Lett. 111, 095001 (2013) [3] A. P. L. Robinson et al., Phys. Rev. Lett. 108, 125004 (2012) [4] D. A. Maclellan et al., Phys. Rev. Lett. 113, 185001 (2014) [5] J. R. Davies, Phys. Rev. E 69, 065402(R) (2004) [6] M. Temporal et al., Phys. Plasmas 15, 052702 (2008)

SCARF Annual Report 2013-‐‑2014
07/11/14 30
4. APPENDIX: SCARF HARDWARE DETAILS
5. APPENDIX: INDEX OF FIGURES
Figure 1: Pie chart showing percentage usage of the SCARF service by department ............................. 5 Figure 2: Table displaying detailed usage from 2013-‐‑14 comparing with 2012-‐‑13 and 2011-‐‑12 ............ 5 Figure 3: Availability for SCARF ..................................................................................................................... 6 Figure 4: Availability vs. Year Purchased ...................................................................................................... 6 Figure 5: Incident-‐‑wavelength spectra at the sample position as a function of guide m-‐‑number. The black trace corresponds to the current spectrometer (no guide). ............................................................... 9 Figure 6: Nanoporous hybrid framework structures of (a) ZIF-‐‑4, (b) ZIF-‐‑7, and (c) ZIF-‐‑8, in which the inorganic building units are represented by the ZnN4 tetrahedra (in purple). Right panel depicts the complex pore morphologies and solvent accessible volumes (SAV, denoted by yellow surfaces). ............................................................................................................................................................................ 10 Figure 7: (a) Simulation box for solid CA used in the MD calculations. (b) Charge-‐‑density difference maps for crystalline CA. ................................................................................................................................. 11 Figure 8: (a) Initial irreversible insertion of a PE chain end (highlight as a blue sphere) into the membrane (b) Reorientation of the polymer particle before embedded into the membrane .............. 14 Figure 9: Snapshot of the adsorption of PS onto the membrane, initiated by an anchoring chain end (highlight as a blue sphere). ........................................................................................................................... 14 Figure 10: Carbon ADPs as a function of temperature. (a) shows in-‐‑plane ADPs (u11 and u22) whereas (b) shows out-‐‑of-‐‑plane ADPs (u33). .............................................................................................. 15 Figure 11: A thin filament of ionized Hydrogen caused by the Astra-‐‑Gemini laser’s pre-‐‑pulse. Modelled using EPOCH on Scarf-‐‑Lexicon 2. ............................................................................................... 18 Figure 12: A convergent beam of fast-‐‑electrons modelled using EPOCH on Scarf-‐‑Lexicon 2. ............ 18 Figure 13: (a) The superstructure of calcium doped sodium cobaltate with Ca ions (in yellow) sitting at the centre of di-‐‑vacancy clusters. (b)The Phonon dispersion calculated on SCARF as colour contour plot and places phonons have been observed experimentally shown as red hexagons.(c)
Host group CPU type and frequency Nodes Cores /node
Total cores
Interconnect Total memory
SCARF14 Intel E5-2650v2 @ 2.60GHz 56 16 896 QDR Infiniband
7168 GB
SCARF13 Intel E5-2660 @ 2.20GHz 68 16 1088 QDR Infiniband
4352 GB
SCARF12 Intel X5675 @ 3.06GHz 20 12 240 QDR Infiniband
960 GB
SCARF11 Intel X5660 @ 2.8GHz 32 12 384 QDR Infiniband
768 GB
Lexicon-2/ SCARF10
Intel E5530 @ 2.40GHz 104 8 832 DDR Infiniband
2496 GB
IBIS/ SCARF09
Intel E5462 @ 2.80GHz 48 8 384 SDR Infiniband 768 GB
SCARF08 Intel E5430 @ 2.66GHz 46 8 368 SDR Infiniband 736 GB Lexicon 1 (2013)
Intel E5-2660 @ 2.20GHz 16 16 256 GB Ethernet 1024 GB
Grand Totals
390 4448 17312 GB

SCARF Annual Report 2013-‐‑2014
07/11/14 31
The real space atomic displacements of the Ca rattling mode observed at 19.5 meV. The vectors show the true direction of motion but with scaled amplitude. ................................................................ 18 Figure : 14 A) EGFR EC domain on membrane. B) subdomain IV (residues 481-‐‑621); C) linker region (residues 605-‐‑618). ........................................................................................................................................... 19 Figure 15: EGFR TM domain. A) active conformation; B) inactive conformation. The two monomers are represented in different colors. ............................................................................................................... 20 Figure 16: EGFR kinase dimers in complex with gefitinib + fluorescent dyes. A) asymmetric conformation (PDB 2GS2); B) symmetric conformation (PDB 2GS7); C) alternative symmetric conformation (PDB 3GT8). ............................................................................................................................. 20 Figure 17: A thermodynamical cycle as used in the TI reproducibility study. Simulation along vertical arrows would be computational very expensive while horizontal simulation involves mutational transformation of only a few atoms. Transformations are done step–wise. ...................... 22 Figure 18: The EGFR kinase bound to a ligand and three ligands on the right which may bind stronger. Protein conformation may also matter. MM–PBSA is a rapid simulation method to estimate binding strength. .............................................................................................................................. 22 Figure 19: Cell tilt ............................................................................................................................................. 23 Figure 20: Intrinsic stacking fault energy cost for the in-‐‑plane nearest-‐‑neighbour bond direction and the lattice-‐‑vector direction. ............................................................................................................................. 23 Figure 21: Energy scan as a function of interlayer distance for A-‐‑A Graphite (the insert shows the long-‐‑range behaviour of this potential-‐‑energy curve). .............................................................................. 23 Figure 22: Two-‐‑layer interaction potential ................................................................................................... 24 Figure 23: Three-‐‑layer interaction potential ................................................................................................ 24 Figure 24: Hybrid-‐‑PIC simulations showing the fast electron density for peak intensity of 5x10²⁰ Wcm-‐‑2 (all densities on log scale) (m-‐‑3) at 1.4ps after laser irradiation comparing the (a), (b) Spitzer, (c),(d) Lee-‐‑More and (e),(f) QMD Kubo-‐‑Greenwood models. A lower intensity of 5x10¹⁹ Wcm-‐‑2 using the QMD model is shown in (g), (h) [5]. ....................................................................................................... 26 Figure 25: (a) -‐‑ (c) proton spatial intensity distributions measured at 7.3MeV for peak laser intensity of (a) 6x10¹⁹ Wcm-‐‑2, (b) 4x10²⁰ Wcm-‐‑2 and (c) 6.8x10²⁰ Wcm-‐‑2 [5]. ............................................................... 27 Figure 26: Experimental schematic. Sheath accelerated protons produced by the beam 1 gold target heat the Si target at an angle, producing a resistivity gradient by different degrees of lattice melt. The beam 2 pulse is used to accelerate a population of electrons into the target and the sheath accelerated protons from the rear surface of Si are used to diagnose changes to FET [4]. ................... 29 Figure 27: For peak laser intensity of 7x10¹⁹Wcm-‐‑2, we show the fast electron density maps (a) -‐‑ (b) and proton profiles for an unheated target, and for preheated targets (d) -‐‑ (e) fast electron density and (f) proton profile showing much increased structure. Also shown are the experimental proton beams for a (g) unheated, with 10ps (h) and 30ps (i) of proton preheating before beam 2 pulse arrives [4]. ......................................................................................................................................................... 29 Figure 28: SCARF Queue Usage ................................................................................................................... 37 Figure 29: ISIS SLA Usage of SCARF 13 ....................................................................................................... 38 Figure 30: ISIS SLA Usage of SCARF 14 ....................................................................................................... 38 Figure 31: CLF SLA Usage of SCARF 14 ...................................................................................................... 39 Figure 32: SCARF-‐‑Lexicon Usage ................................................................................................................. 39 Figure 33: SCARF Lexicon-‐‑2 Usage .............................................................................................................. 40 Figure 34: SCARF-‐‑IBIS Usage ....................................................................................................................... 40 Figure 35: SCARF Power Usage ................................................................................................................... 41 Figure 36: GFlops/W for SCARF generations of equipment ..................................................................... 41 Figure 37: Filespace usage on the Panasas Storage ..................................................................................... 42

SCARF Annual Report 2013-‐‑2014
07/11/14 32
Figure 38: SCARF Network Topology .......................................................................................................... 42 Figure 39: SCARF08 and SCARF09 Network Traffic .................................................................................. 43 Figure 40: SCARF10 and Lexicon 2 Network Traffic .................................................................................. 43 Figure 41: SCARF11 and SCARF12 Network Traffic .................................................................................. 43 Figure 42: SCARF13 and Lexicon 1 Network Traffic .................................................................................. 44 Figure 43: SCARF14 Network Traffic ........................................................................................................... 44 Figure 44: SCARF Application Stack ........................................................................................................... 45

SCARF Annual Report 2013-‐‑2014
07/11/14 33
6. APPENDIX: PUBLICATIONS AND PRESENTATIONS
Reference Author
1 Pub: Density Functional Theory for Experimentalists: A Four-Lecture Primer, RAL-TR-2014-004. STFC, 2014.
F. Fernandex-Alonso
2 Pub: Neutrons for Condensed Matter Research: Fundamentals and Applications, RAL-TR-2014-004. STFC, 2014.
F. Fernandex-Alonso
3 Pub: TOSCA International Beamline Review,RAL-TR-2013-015, STFC 2013
S. Rudic, A.J. Ramirez-Cuesta, S.F. Parker, F. Fernandez-Alonso, R.S. Pinna, G. Gorini, C.G. Salzmann, S.E. McLain, and N.T. Skipper
4 Pub: Recent and Future Developments on TOSCA at ISIS, J. Phys.: Conf. Ser. (in press).
S.F. Parker, F. Fernandez-Alonso, A.J. Ramirez-Cuesta, S. Rudic, R.S. Pinna, G. Gorini, J. Fernandez Castañón,
5 Pub: Monte Carlo Simulations of the TOSCA Spectrometer: Assessment of Current Performance and Future Upgrades, Eur. Phys. J. (in press).
R.S. Pinna, S. Rudic, S.F. Parker, G. Gorini, F. Fernandez-Alonso
6 Pub: Monte Carlo Simulations of the TOSCA Neutron Spectrometer: Assessment of Current Performance and Future Upgrades, MSc Thesis, Università degli Studi di Milano-Bicocca (2014).
R.S. Pinna
7 Presentation: Monte Carlo simulations of TOSCA: effects of installing a neutron guide on the TOSCA-INES beamline at ISIS, UK Neutron and Muon Users Meeting 8-9 April 2013, Warwick, UK.
R.S. Pinna, A.J. Ramirez-Cuesta
8 Presentation: Monte Carlo simulations of TOSCA: effects of installing a neutron guide on the TOSCA-INES beamline at ISIS, Joint Vitess and McStas School Workshop, 18-19 September 2013, Berlin, Germany.
R.S. Pinna
9
Presentation: Recent and future developments on TOSCA, Dynamics of Molecules and Materials-II, Satellite workshop of International Conference on Neutron Scattering, 5-6 July 2013, Glasgow, UK.
J.F. Castañón, F. Fernandez-Alonso, G. Gorini, S.F. Parker, R.S. Pinna, A. J. Ramirez-Cuesta, S. Rudic
10 Presentation: TOSCA: current and future developments, QENS 2014/WINS 2014, 11-16 May 2014, Autrans, France.
S. Rudic, J.F. Castañón, F. Fernandez-Alonso, G. Gorini, S.F. Parker, R.S. Pinna, A.J. Ramirez-Cuesta
11 Pub: Nanoporous Metal-Organic Framework Materials for Smart Applications, Invited Review - Special Issue on Smart Materials, Materials Science and Technology, 30(13b), pp. 1598-1612 (2014).
M. R. Ryder and J.C. Tan
12 Pub: Identifying the Role of Terahertz Vibrations in Metal-Organic Frameworks: From Gate-Opening Phenomenon to Shear-Driven Structural Instability, Paper Submitted (2014)
M. R. Ryder, B. Civalleri, T. D. Bennett, S. Henke, S. Rudic, G. Cinque, F. Fernandez-Alonso, and J.C. Tan
13 Presentation: Terahertz Vibrations of MOFs using Synchrotron and Neutron Spectroscopy in Conjunction with Ab Initio Density Functional Theory, UK Neutron and Muon Users Meeting 8-9 April 2014, Warwick, UK.
M. R. Ryder, B. Civalleri, T. D. Bennett, S. Henke, S. Rudic, G. Cinque, F. Fernandez-Alonso, and J.C. Tan
14
Presentation: Terahertz Vibrations of MOFs using Synchrotron and Neutron Spectroscopy in Conjunction with Ab Initio Density Functional Theory, British Zeolite Association Spring Meeting 9-11 April 2014, Glasgow, UK.
M. R. Ryder, B. Civalleri, T. D. Bennett, S. Henke, S. Rudic, G. Cinque, F. Fernandez-Alonso, and J.C. Tan
SCARF Annual Report 2013-‐‑2014
07/11/14 34
15 Presentation: Deciphering the Terahertz Vibrations of Metal-Organic Frameworks, International Colloquium on Synchrotron Applications in Research (I-CSAR) 29 May 2014, Oxford, UK.
M. R. Ryder
16
Presentation: Identifying the Role of Terahertz Vibrations in Metal-Organic Frameworks: From Gate-Opening Phenomenon to Shear-Driven Structural Instability, International School on Ab initio Modelling of Solids 20-25 July 2014, Regensburg, Germany.
M. R. Ryder, B. Civalleri, T. D. Bennett, S. Henke, S. Rudic, G. Cinque, F. Fernandez-Alonso, and J.C. Tan
17 Presentation: Identifying the Role of Terahertz Vibrations in Metal-Organic Frameworks: From Gate-Opening Phenomenon to Shear-Driven Structural Instability, CASTEP Training Workshop 2014 18-22 August 2014, Oxford, UK.
M. R. Ryder, B. Civalleri, T. D. Bennett, S. Henke, S. Rudic, G. Cinque, F. Fernandez-Alonso, and J.C. Tan
18 Pub: Ferroelectric Behaviour in Solid Croconic Acid using Neutron Scattering and First-principles Density Functional Theory”, Chem. Phys, 427, 95 (2013)
S. Mukhopadhyay, M. J. Gutmann, M. Jura, D. B. Jochym, M. Jimenez-Ruiz, S. Sturniolo, K. Refson, and F. Fernandez-Alonso
19
Pub: Hydrogen Bonding in the Organic Ferroelectric Croconic Acid: Insights from Experiment and First-principles Modelling”, J. Phys. Soc. Japan, 82, SA001 (2013).
F Fernandez-Alonso, MJ Gutmann, S Mukhopadhyay, DB Jochym, K Refson, M Jura, M Krzystyniak, M Jimenez-Ruiz, A Wagner
20 Pub: Hydrogen-bond Structure and Anharmonicity in Croconic Acid, Phys. Chem. Chem. Phys., (under review) (2014).
S. Mukhopadhyay, M. J. Gutmann, and F. Fernandez-Alonso
21
Presentation: Chemical Dynamics and Spectroscopy with Pulsed Neutrons. Invited talk presented at Thomas Young Centre & London Centre for Nanotechnology Seminar Series, Imperial College, July 7th 2014, London, United Kingdom.
F. Fernandez-Alonso
22 Presentation: Neutrons for Energy and the Environment. Invited seminar at the Area di Ricerca CNR di Capo Granitola, Consiglio Nazionale delle Richerche, July 3rd 2014, Capo Granitola, Italy.
F. Fernandez-Alonso
23
Presentation: Neutrons for Chemistry: An Overview of Current and Future Capabilities at ISIS. Invited talk at QIES2014: 16th Reunión Científica Plenaria de Química Inorgánica and 10th Reunión Científica Plenaria de Química del Estado Sólido, 15-18th June 2014, Almeria, Spain.
F. Fernandez-Alonso
24 Presentation: Recent and Ongoing Developments in High-resolution Neutron Spectroscopy at ISIS Invited talk at the 17th International Seminar on Neutron Scattering in Condensed Matter, 21-23rd May 2014, Poznan, Poland.
F. Fernandez-Alonso
25
Presentation: Proton dynamics in the room-temperature organic ferroelectric croconic acid, in Conference on Quasi-Elastic Neutron Scattering and Workshop on Inelastic Neutron Scattering (QENS-WINS-2014), May 2014, Autrans, France.
S. Mukhopadhyay, M. J. Gutmann, D. B. Jochym, M. Jimenez-Ruiz, M. Jura, K. Refson and Felix Fernandez-Alonso
26
Presentation: Modelling of neutron spectroscopy of hydrogen bonded organic crystals using first principles density functional theory, in Deutshe Physikalische Gesellschaft, e.V. (DPG) Meeting, March 2014, TU Dresden, Germany.
S. Mukhopadhyay, M. J. Gutmann and Felix Fernandez-Alonso

SCARF Annual Report 2013-‐‑2014
07/11/14 35
27
Presentation: Neutrons for Condensed Matter Research: Fundamentals and Applications. A series of three invited lectures (Erasmus Docenti Programme), 24-28th February 2014, Department of Physics, Università di Milano Bicocca, Italy.
F. Fernandez-Alonso
28 Presentation: Thomas Young Centre Postgraduate Student Day (London, December 2013)
G. Graziano
29 Presentation: VI Workshop in Electron-volt Neutron Spectroscopy: Frontiers and horizons (Abingdon, January 2014)
G. Graziano
30 Presentation: UK Neutron and Muon Users Meeting (Warwick, April 2014)
G. Graziano
31 Presentation: Thomas Young Centre Energy Materials Workshop (London, September 2014).
G. Graziano
32 Pub: A study of fast electron energy transport in relativistically intense laser-plasma interactions with large density scalelengths, Physics of Plasmas, 2012.
R. Scott
33 Presentation: Institute of Physics, Plasma Physics Conference, London, April 2014.
R. Scott
34 Presentation: Fast Ignition Workshop, Oxford, September 2014.
R. Scott
35 Presentation: American Physical Society, Division of Plasma Physics, New Orleans, October 2014.
R. Scott
36 Presentation: Limits in the dynamical modelling of carbon-based nanostructured porous materials. SETN-2014,(Pamplona. Spain).
R Fernandez-Perea, C. Cabrillo
37 Presentation : Need and limitations of dynamic modelling of carbon-based nanostructured porous materials for gas adsorption. HESSSME-2014, (Madrid,Spain)
R Fernandez-Perea, C. Cabrill
38 Pub: 2014 Plasma Phys. Control. Fusion 56 084002 D A MacLellan et al

SCARF Annual Report 2013-‐‑2014
07/11/14 36
7. APPENDIX: SCARF QUEUE USAGE 2011-12
Key:
• Red -‐‑ number of jobs pending • Green – number of jobs running • Yellow – number of jobs gathering CPUs so that they can run (large parallel jobs) • Blue -‐‑ total number of Jobs (sum of Red, Green, Yellow)
7.1 General SCARF Queue
Open to all SCARF Users

SCARF Annual Report 2013-‐‑2014
07/11/14 37
Figure 28: SCARF Queue Usage
The graph for the SCARF queue (and thus the combined SCARF/INTEL graph) shows consistently pending jobs for most of the year, which demonstrates that there is not sufficient capacity. This should be addressed by the next hardware procurement. In July the migration to RHEL6 was begun. This year we implemented a new mechanism to allow groups of users to get preferential access to portions of hardware they have contributed money to purchase, while still making the hardware available to other users jobs up to 24 hours in length. This is currently in place for ISIS on SCARF13 and ISIS and CLF FBI on SCARF14
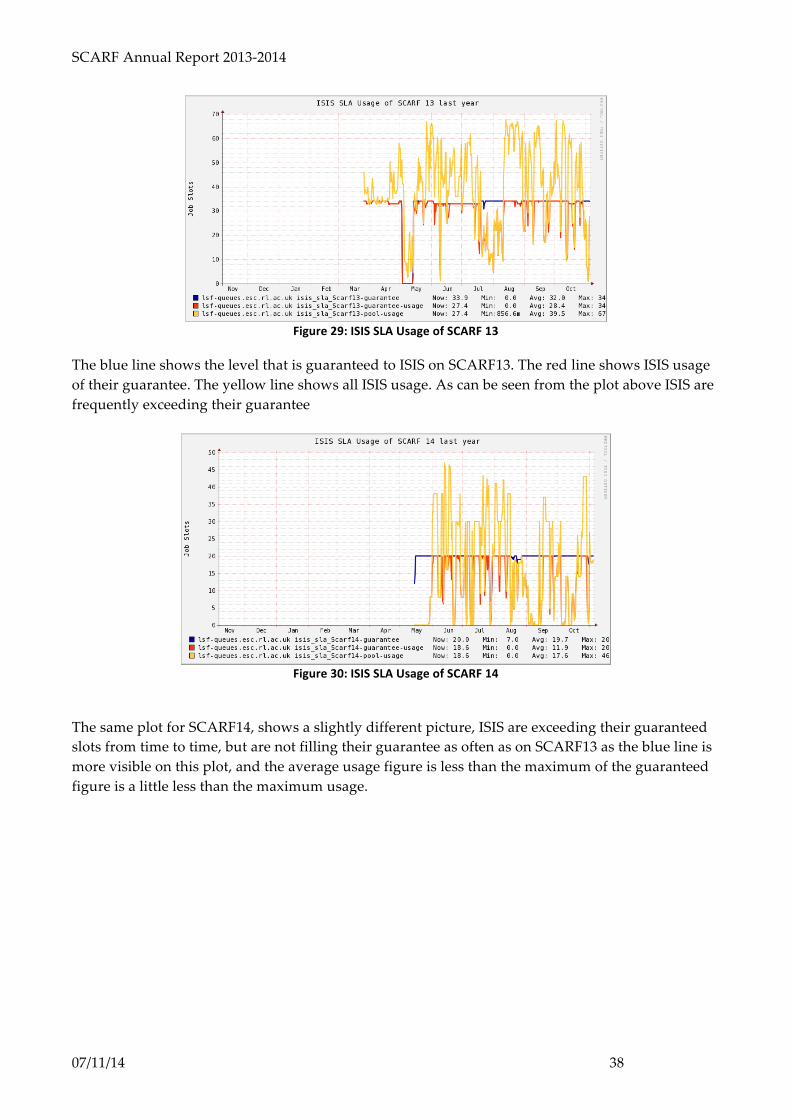
SCARF Annual Report 2013-‐‑2014
07/11/14 38
Figure 29: ISIS SLA Usage of SCARF 13
The blue line shows the level that is guaranteed to ISIS on SCARF13. The red line shows ISIS usage of their guarantee. The yellow line shows all ISIS usage. As can be seen from the plot above ISIS are frequently exceeding their guarantee
Figure 30: ISIS SLA Usage of SCARF 14
The same plot for SCARF14, shows a slightly different picture, ISIS are exceeding their guaranteed slots from time to time, but are not filling their guarantee as often as on SCARF13 as the blue line is more visible on this plot, and the average usage figure is less than the maximum of the guaranteed figure is a little less than the maximum usage.

SCARF Annual Report 2013-‐‑2014
07/11/14 39
Figure 31: CLF SLA Usage of SCARF 14
The SCARF 14 plot for CLF FBI, shows that they haven’t yet begun making extensive usage of their guaranteed resource. 7.2 SCARF-Lexicon1 and Lexicon2 Queues
These queues are primarily for CLF use with a capacity of 256 and 544 CPU cores for SCARF Lexicon 1 & 2 respectively. The original Lexicon 1 nodes were replaced with 256 new cores in June 2013.
Figure 32: SCARF-‐Lexicon Usage
The graph for the SCARF-‐‑LEXICON queue shows peaky but significant usage, though this has dropped somewhat since the purchase of SCARF-‐‑LEXICON-‐‑2.

SCARF Annual Report 2013-‐‑2014
07/11/14 40
Figure 33: SCARF Lexicon-‐2 Usage
SCARF-‐‑LEXICON-‐‑2 continues to be used for higher priority Lexicon users and on demand to support CLF experiments. 7.3 SCARF-IBIS
SCARF-‐‑IBIS has a capacity of 144 CPU cores.
Figure 34: SCARF-‐IBIS Usage
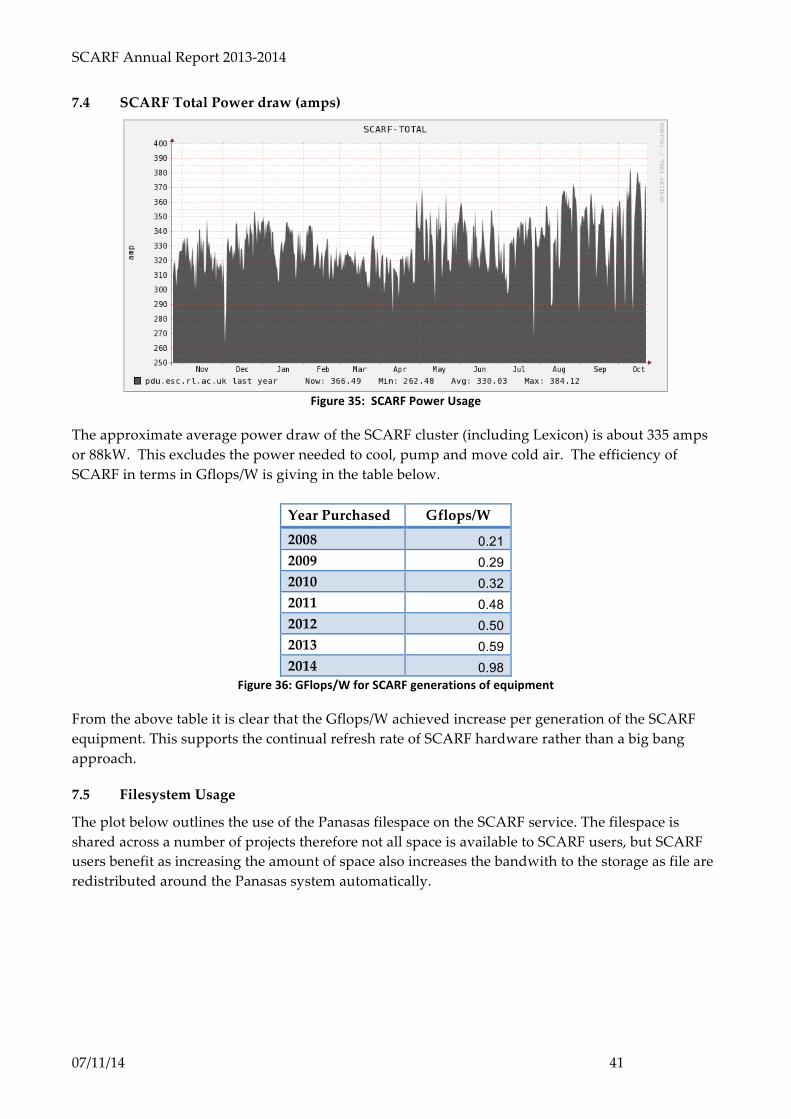
SCARF Annual Report 2013-‐‑2014
07/11/14 41
7.4 SCARF Total Power draw (amps)
Figure 35: SCARF Power Usage
The approximate average power draw of the SCARF cluster (including Lexicon) is about 335 amps or 88kW. This excludes the power needed to cool, pump and move cold air. The efficiency of SCARF in terms in Gflops/W is giving in the table below.
Year Purchased Gflops/W
2008 0.21 2009 0.29 2010 0.32 2011 0.48 2012 0.50 2013 0.59 2014 0.98
Figure 36: GFlops/W for SCARF generations of equipment
From the above table it is clear that the Gflops/W achieved increase per generation of the SCARF equipment. This supports the continual refresh rate of SCARF hardware rather than a big bang approach. 7.5 Filesystem Usage
The plot below outlines the use of the Panasas filespace on the SCARF service. The filespace is shared across a number of projects therefore not all space is available to SCARF users, but SCARF users benefit as increasing the amount of space also increases the bandwith to the storage as file are redistributed around the Panasas system automatically.

SCARF Annual Report 2013-‐‑2014
07/11/14 42
Figure 37: Filespace usage on the Panasas Storage
7.6 Networking
The diagram below shows the SCARF compute clusters embedded in the larger Research Infrastructure group’s networking infrastructure.
Figure 38: SCARF Network Topology
The following graphs outline the network traffic from the clusters. This captures traffic to the Panasas filesystems, backups and external traffic. SCARF08 and SCARF09 were originally connected via network switches in the original Lexicon 1 racks, but with the decommissioning of that hardware are now connected directly.

SCARF Annual Report 2013-‐‑2014
07/11/14 43
Figure 39: SCARF08 and SCARF09 Network Traffic
Figure 40: SCARF10 and Lexicon 2 Network Traffic
Figure 41: SCARF11 and SCARF12 Network Traffic

SCARF Annual Report 2013-‐‑2014
07/11/14 44
Figure 42: SCARF13 and Lexicon 1 Network Traffic
Figure 43: SCARF14 Network Traffic

SCARF Annual Report 2013-‐‑2014
07/11/14 45
8. APPENDIX: SCARF DEVELOPMENTS
It has been a busy year for the SCARF service. Users’ will have noticed most impact with the additional of capacity and upgrades to applications. However, a lot of effort goes into improving the management of SCARF. 8.1 Technical Developments
• In late May the 2014 hardware tranche of dual Intel E5-‐‑2650v2, providing 896 cores was made available
• A new interface to SCARF to allow users to upload and download files from their desktop more easily was made available.
• The SCARF web portal was made available which allows SCARF users to submit jobs via a web frontend.
• The new SCARF website www.scarf.rl.ac.uk went live. • Service level agreements were implemented to give ISIS and CLF priority access to the
equipment they purchased.
8.2 Application Stack
A selection of new or updated applications is in the table below:
Figure 44: SCARF Application Stack
A full list of the available software on SCARF can be found on the SCARF website: http://www.scarf.rl.ac.uk/applications-‐‑libraries
Application Area Version CASTEP Computational Chemistry 7.0.1 AMBER Computational Chemistry 14 CRYSTAL Computational Chemistry CRYSTAL14 netCDF data model, library, and file format
for storing and managing data 4.3.2
DL_POLY DL_POLY is a general purpose classical molecular dynamics (MD) simulation software
4.06
Intel compiler
Fortran, C, C++ compilers and Maths libraries
14.0
PGI compilers
Fortran, C, C++ compilers and Maths libraries
14.7