Scale Efficiency in Banking Sector of Pakistan€¦ · that the policy of deregulation adopted by...
13
International Journal of Business and Management www.ccsenet.org/ijbm 104 Scale Efficiency in Banking Sector of Pakistan Muhammad Usman (Corresponding author) School of Management, Huazhong University of Science & Technology Room # 505, Friendship Apartment, Wuhan 430071, China E-mail: [email protected] Zongjun Wang School of Management, Huazhong University of Science & Technology, Wuhan 430071, China E-mail: [email protected] Faiq Mahmood School of Management, Huazhong University of Science & Technology, Wuhan 430071, China E-mail: [email protected] Humera Shahid School of Management, Huazhong University of Science & Technology, Wuhan 430071, China E-mail: [email protected] Abstract The study employs data envelopment analysis to a panel of commercial banks operating in Pakistan for a period 2001 – 2008 in order to measure the technical efficiency of banks. Technical efficiency is then broken down into pure technical and scale components. We divide banks into three categories for analytical purposes: state owned banks, domestic private banks and foreign owned banks. We find foreign owned banks to be the most efficient, followed by state owned banks and domestic private banks are found to be the least efficient. Further, it is found that pure technical efficiency contributes more towards technical efficiency and banks are faced with serious scale problems. The scale inefficiency is found to be the main source of overall technical inefficiency. We observe an increasing trend in pure technical efficiency whereas an opposite trend is found in scale efficiency during the sample period. Keywords: Banking, Scale efficiency, Data envelopment analysis, Pakistan 1. Introduction Financial sector plays a significant role in the economic development. There is a strong association between financial sector and economic growth. Financial sector of Pakistan consists of central bank, commercial banks, specialized financial institutions, insurance companies, stock exchanges and development finance institutions. However, commercial banks are most important component and play a crucial role in the financing of economy. Commercial banks mobilize the savings and thus play a vital role in enhancing the productive capacity of the economy. The banking sector of Pakistan was nationalized in 1974 and since then it was dominated by government ownership with a minority share of foreign banks until the beginning of financial sector reforms in early 1990s. Government of Pakistan decided to undertake financial sector reforms on the advice of IMF and World Bank. The immediate objectives of reforms were restructuring of nationalized commercial banks, improving the supervision of financial institutions and licensing of new private banks. As a result, government of Pakistan
-
Upload
truongtuyen -
Category
Documents
-
view
218 -
download
0
Transcript of Scale Efficiency in Banking Sector of Pakistan€¦ · that the policy of deregulation adopted by...

International Journal of Business and Management www.ccsenet.org/ijbm
104
Scale Efficiency in Banking Sector of Pakistan
Muhammad Usman (Corresponding author) School of Management, Huazhong University of Science & Technology
Room # 505, Friendship Apartment, Wuhan 430071, China E-mail: [email protected]
Zongjun Wang
School of Management, Huazhong University of Science & Technology, Wuhan 430071, China
E-mail: [email protected]
Faiq Mahmood School of Management, Huazhong University of Science & Technology,
Wuhan 430071, China E-mail: [email protected]
Humera Shahid
School of Management, Huazhong University of Science & Technology, Wuhan 430071, China
E-mail: [email protected] Abstract The study employs data envelopment analysis to a panel of commercial banks operating in Pakistan for a period 2001 – 2008 in order to measure the technical efficiency of banks. Technical efficiency is then broken down into pure technical and scale components. We divide banks into three categories for analytical purposes: state owned banks, domestic private banks and foreign owned banks. We find foreign owned banks to be the most efficient, followed by state owned banks and domestic private banks are found to be the least efficient. Further, it is found that pure technical efficiency contributes more towards technical efficiency and banks are faced with serious scale problems. The scale inefficiency is found to be the main source of overall technical inefficiency. We observe an increasing trend in pure technical efficiency whereas an opposite trend is found in scale efficiency during the sample period. Keywords: Banking, Scale efficiency, Data envelopment analysis, Pakistan 1. Introduction Financial sector plays a significant role in the economic development. There is a strong association between financial sector and economic growth. Financial sector of Pakistan consists of central bank, commercial banks, specialized financial institutions, insurance companies, stock exchanges and development finance institutions. However, commercial banks are most important component and play a crucial role in the financing of economy. Commercial banks mobilize the savings and thus play a vital role in enhancing the productive capacity of the economy. The banking sector of Pakistan was nationalized in 1974 and since then it was dominated by government ownership with a minority share of foreign banks until the beginning of financial sector reforms in early 1990s. Government of Pakistan decided to undertake financial sector reforms on the advice of IMF and World Bank. The immediate objectives of reforms were restructuring of nationalized commercial banks, improving the supervision of financial institutions and licensing of new private banks. As a result, government of Pakistan

International Journal of Business and Management Vol. 5, No. 4; April 2010
105
privatized two major commercial banks in 1991, named Allied Bank of Pakistan and Muslim Commercial Bank. Further, ten new domestic private banks were granted license to operate in Pakistan. These steps changed pre-dominant government owned banking sector and promoted an environment of competition in the market. The term “efficiency” is used to describe the performance of a commercial bank. Efficiency refers to the utilization of resources in such a way as to maximize the production. A bank is said to be efficient when it cannot enhance its output without increasing inputs or cannot produce the same quantity of output by using less quantity of inputs. Efficiency is a relative term; one can measure the efficiency of a bank in different years or efficiency of various banks in same year. The efficiency of a commercial bank is usually measured in terms of minimization of inputs to produce a specific level of output or maximization of output at a given level of inputs. Measuring the efficiency of commercial banks is imperative for owners as monitoring criteria of their business, it is also important for depositors to make decision about their savings and most of all it is crucial for government to assess a particular sector of economy. The economists have taken keen interest in measuring the efficiency of banking sector because of its central role in the economic growth. But most of them have focused on US banking sector and banking sector of other developed countries, a little has so far been done on measuring the efficiency of banking sector in developing countries. Berger and Humphrey (1997) surveyed 130 studies which applied frontier efficiency analysis to financial sector in 21 countries, 60 Out of these 130 studies were conducted on the efficiency of US banking sector while most of the remaining studies were conducted on the banking sector of European countries. The study provides an insight into the performance of commercial banks operating in Pakistan. As many changes have taken place in commercial banks due to the financial sector reforms, banking sector was dominated by government ownership in pre-reform era. As a result of reforms, the share of public sector banks has decreased significantly and banking industry has become competitive. So, commercial banks operating in a developing country, that is Pakistan, are selected for this study. In Pakistan, the issue of efficiency of commercial banks has got immense importance because of the financial sector reforms carried out by government. Therefore, the objective of this study is to measure the technical efficiency of commercial banks operating in Pakistan. Further, we break down the technical efficiency into pure technical and scale components to evaluate the extent of scale inefficiency in commercial banks operating in Pakistan. We apply non-parametric data envelopment analysis (DEA) tool to a panel of commercial banks covering a period from 2001 – 2008. For the purpose of analysis, we divide the commercial banks into three groups: state owned banks, domestic private banks and foreign owned banks. The paper is organized as follows: a brief review of related literature is presented in next section. The DEA methodology used to calculate the efficiency is described in section 3. Section 4 discusses the sample data used in the study and construction of variables. Empirical results of the study are discussed in section 5 and section 6 concludes. 2. Literature Review Given the importance of banking sector for economic growth, it has become significant to evaluate the performance of banking sector and identify the distressed banks. This may help to take appropriate measures to restructure distressed banks and ensure sustainable economic growth. Moreover, in last few decades, a large number of countries have implemented financial reforms. These reforms include privatization of state-owned banks, licensing of new private domestic banks, increased level of competition, the introduction of market based securities, liberalization of interest rate determination, free movement of capital, entry of foreign banks and change in regulatory environment. All these reforms are implemented with a view to enhance the provision of financial services to all the sectors of economy and to increase the efficiency of financial system. This section critically reviews some of the studies which have measured the efficiency of banking sector of various countries. Resti (1998) analyzed the performance of merged banks and examined the impact of mergers on the efficiency of Italian banking system. The study used a sample of 67 deals and data from 1986 to 1995. The study revealed that merged banks seem to have increased their efficiency in the years after the merger particularly when the merger occurred between two banks operating in the same local market and when the size of new entity was not too big. Moreover, efficiency increased more when merger happened between two equally sized banks. Sathye (2003) determined the efficiency of Indian commercial banks using two DEA models with different combination of inputs and outputs. The study found public sector commercial banks to be most efficient in one model and foreign banks in second model but private sector commercial banks were found to be the least efficient in both models. Similarly, Ketkar et al. (2003) also found foreign banks operating in India to be the most efficient compared with public and private owned banks. Further, he found no improvement in the efficiency of Indian banks during the study period.

International Journal of Business and Management www.ccsenet.org/ijbm
106
Canhoto and Dermine (2003) investigated the impact of deregulation on the efficiency of Portuguese banking system. This study further measures the efficiency of new banks as compared to old banks. The study revealed that the policy of deregulation adopted by the Portugal had a positive significant impact on the banking system. The efficiency of banks showed an improvement for the overall sample over the period analyzed. When considering the efficiency of new banks and old banks, the new banks were found to be more efficient than old banks. Mercan et al. (2003) examined the financial performance of Turkish Banking Sector for the period 1989 to 1999 taking into consideration the modes of ownership (public, private and foreign) and assets size. The study found that average financial performance of all the commercial banks kept on increasing until 1993 at which time it started to decrease. Foreign owned banks and private banks are found to have been more efficient than public owned banks in Turkey. The banks that were taken over by the government regulatory agency were observed to perform poorly. Burki and Niazi (2003) analyzed the impact of policy reforms on the efficiency of Pakistani commercial banks over the period 1991-2000. They concluded foreign banks are the most efficient as a group while state-owned banks are least efficient. Moreover, it is found that policy reforms of privatization, liberalization and strengthening of central bank, instead of paying off, led to a decline in efficiency of banks. Sturm and Williams (2004) measured the efficiency of Australian banking system to assess the impact of deregulation and entry of foreign banks in post deregulation period 1998 to 2001. The results showed that bank efficiency has increased in post deregulation period; however, the main source of efficiency improvement was technological change rather than technical efficiency. The study also found that foreign banks were more efficient than domestic banks. Bonin et al. (2005) measured cost and profit efficiency by applying stochastic frontier to banking sector of eleven transition countries. They concluded that privatization itself is not sufficient to increase the efficiency of banks in transition economies; they found foreign owned banks to be the most efficient particularly those with strategic foreign owner. Bonin et al. (2005) investigated the impact of bank privatization on six relatively advanced countries, namely, Bulgaria, Czech Republic, Croatia, Hungry, Poland and Romania. The study confirmed that foreign Greenfield banks are most efficient and state owned banks are least efficient of all bank types in these six countries with respect to both cost and profit. Lin (2002) evaluated the effects of bank mergers on the bank efficiency of Taiwanese Commercial banks during the period from 1997 to 1999 using a two-stage methodology. Further, the study tried to find out whether the large institutions are more efficient compared with small institutions. The study found that a merger between a sound bank and an unsound bank does not have a significant effect on bank cost efficiency. Moreover, the study revealed that merger between banks with varying cultural backgrounds could improve bank cost efficiency. Further analysis revealed that small banks have superior performance as compared to large banks thus efficiency would seem to dictate against merger mania. Boubakri et al. (2005) assessed the post privatization performance of 81 banks from 22 developing countries in order to investigate whether or not privatization improves bank performance and whether it has an impact on risk taking behavior of banks. The study found that, on average, banks chosen for privatization appeared to have lower efficiency and lower capital adequacy as compared to banks held under government ownership. The study further revealed that performance of banks in post privatization period exhibit an increase in profitability but a significant decrease in efficiency and a more credit risk exposure. However, the study found that over time privatization yields significant improvements in efficiency and credit risk exposure. Omran (2007) measured the financial and operating performance of 12 Egyptian banks that were fully or partially privatized from 1996 to 1999 and compared pre verses post privatization performance of these banks. The study revealed that in post privatization period, some profitability and liquidity ratios for privatized banks declined significantly but other performance measures are not significant at any level. Moreover, the results indicated that relative performance changes of privatized banks were better than those of mixed banks with majority state ownership but worse than those of private owned banks, state owned banks and banks with majority private ownership particularly in terms of profitability. The study further found that private banks and banks with majority private ownership are more profitable and efficient than state owned banks and banks with majority state ownership. 3. Methodology Several techniques have been used to measure the efficiency of banking sector but there is no consensus on a single best method for the measurement of banking efficiency. Farrel (1957) first introduced the concept of productive efficiency or economic efficiency. He divided the productive efficiency into two components: technical efficiency and allocative efficiency and we intend to measure the technical efficiency of commercial banks operating in Pakistan. Technical efficiency is defined as the ability of a firm to produce maximum output

International Journal of Business and Management Vol. 5, No. 4; April 2010
107
with a given set of inputs or use minimum inputs to produce a given level of outputs. The concept of technical efficiency can be understood with the help of figure 1. Consider a bank that uses two inputs X1 and X2 in order to produce a single output Y under constant returns to scale and production function of fully efficient banks is known for given level of inputs. The figure 1 shows that the bank under study uses the combination of inputs X1 and X2 at point N in order to produce output Y. PP′ is the isoquant which shows the output level Y for fully efficient bank (technically efficient) by using different combinations of inputs X1 and X2. If the bank under study uses the combinations of inputs X1 and X2 at point M then it is technically efficient. So the inefficiency of bank is represented by the distance MN. Therefore, the technical efficiency of the bank can be defined as ratio of the distance from origin to point M over the distance from origin to point N, that is;
TE = OM/ON Technical efficiency takes a value between zero to one. A value of one means bank is fully efficient and value close to zero means bank is more inefficient. A value of 0.9 means bank is 90% efficient and it can produce the same level of output by using 10% less quantity of inputs. Two type of techniques have widely been used to measure the efficiency of banking sector; parametric and non-parametric techniques. Parametric techniques include Stochastic Frontier Approach (SFA), Distribution Free Approach (DFA) and Thick Frontier Approach (TFA) Berger and Humphrey (1997). In non-parametric approaches total factor productivity indices and Data Envelopment Analysis (DEA) are being widely used for measuring the efficiency. Every method has its own strengths and weaknesses. Berger and Humphrey (1997) surveyed 130 studies which used frontier efficiency analysis to financial institutions in 21 countries, out of these 130 studies 58 studies used DEA to measure the efficiency frontier which shows the popularity of DEA. DEA can handle multiple inputs and multiple outputs and does not require the assumption of functional form relating inputs to outputs. Another advantage of DEA is that inputs and outputs can have different units. For example one input can be in dollar amount while another input can be the number of employees. So our preferred methodology is DEA, we apply DEA to a panel of commercial banks operating in Pakistan in order to measure the technical efficiency covering a period from 2001 – 2007. A number of studies have used DEA; Ariff and Can (2007), Chiu and Chen (2008), Havrylchyk (2006), Halkos and Salamouris (2004), Ozkan-Gunay and Tektas (2006), Jemric and Vujcic (2002), Lin (2002), Brown and Skully (2006), Hu et al. (2008), Drake et al. (2006), Lim and Randhawa (2005), Isik (2008) to measure the efficiency of banking industry in various countries. 3.1 Data Envelopment Analysis Charnes et al. (1978) proposed data envelopment analysis (DEA) which is based on linear programming and used to measure the efficiency of decision making units. An efficiency frontier is constructed to measure the efficiency in DEA. The efficient banks are found on the frontier and receive a value of one and a divergence from the projected frontier represents inefficiency. Farrell (1957) was the first to propose the idea for measuring the efficiency based on single output and single input. Based on this idea of Farrell, Charnes et al. (1978) introduced linear programming model by allowing multiple inputs and multiple outputs under constant returns to scale. To understand the characteristics of DEA model, developed by Charnes, Cooper and Rhodes, assume there are N number of banks that convert J inputs into I outputs, DEA measures the efficiency of such a bank by finding out the maximum of ratio of weighted outputs to weighted inputs as proposed by Charnes et al. it is as follows:
)1(
Max ∑∑
=
== m
j jj
k
i ii
xv
yuE
1 0
1 00
Subject to
Nrxv
yum
j jrj
k
i iri,...,11
1
1 =≤∑∑
=
=
10,...,1,...,1,, <<<==≥ εε mjkivu ji

International Journal of Business and Management www.ccsenet.org/ijbm
108
Where E0 is the efficiency score of bank under consideration, yi0 is the output of bank under consideration and xjo is the input of that bank. ui and vj are the weights of output and input which are to be determined by solving the model. The model specified above is non-linear; it can be transformed into linear form as follows:
)2( Max ∑=
=k
iii yuE
100
Subject to
11
0 =∑=
m
jjj xv
∑∑==
=≤m
jjrj
k
iiri Nrxvyu
11
,...,1
10,...,1,...,1,, <<<==≥ εε mjkivu ji
The original problem is called primal problem in linear programming and corresponding to this, there exist a dual of the problem. If primal problem involves maximization of the objective function then dual problem involves minimization and vice versa. So by applying the dual theorem to the above linear programming problem (2), it takes the following form.
Subject to:
Where, λ is a column matrix having order N*1 and containing vector of constants only while θ is a scalar. This dual problem has fewer constraints as compared to the original problem. θ denotes the efficiency score of a particular banks which ranges between zero to one. This problem is solved N times to find out the value of θ for each bank in the sample. The above DEA model assumes that all the banks are operating under constant returns to scale which is not the situation in reality. Banker et al. (1984) proposed the extension of DEA model to account for variable returns to scale. The dual of original DEA model under constant returns to scale is modified to variable returns to scale by adding a convexity constraint.
Subject to:
In this model K denotes a matrix of order n*1 having ones and it envelopes data more tightly than the constant returns to scale specification of DEA. Scale efficiency is calculated by dividing the technical efficiency calculated under constant returns to scale (TECRS) by technical efficiency calculated under variable returns to scale (TEVRS).
SE = TECRS / TEVRS
4. Data and Construction of Variables State Bank of Pakistan issues a publication named “Banking Statistics of Pakistan” which contains annual information on balance sheet and profit and revenue items of all the banks operating in Pakistan. The requisite data is collected from various issues of “Banking Statistics of Pakistan.” This study covers a period from 2001 to 2008, during the sample period two state owned banks were privatized, some new domestic private banks entered the market, and some banks have been merged. Therefore, we have an unbalanced panel data which

International Journal of Business and Management Vol. 5, No. 4; April 2010
109
contains a minimum of 34 banks in 2001, a maximum of 37 banks in 2008 and a total of 285 observations. The table 1 gives a glance at the sample data used in the study. Though a bulk of literature is available on the efficiency of banking sector, still there is little agreement on what constitutes the inputs and outputs of a bank. Therefore, the choice of inputs and outputs for measuring the efficiency of banking sector has always been a serious issue. However, there are two approaches that have been most widely used in the literature; the production approach and intermediation approach. Banks are seen as provider of services to depositor and borrowers in production approach by using traditional factors of production; land, labor and capital. In intermediation approach, banks are treated as financial intermediaries which use labor and physical assets to convert deposits and other available funds into advances. Deposits are considered as output in production approach and input in intermediation approach, which is the major difference between these two approaches. Most of the DEA studies follow intermediation approach, (Sathye 2003). We apply intermediation approach for defining the inputs and outputs used in this study as this approach has been extensively used in banking literature for example Burki and Niazi (2003), Canhoto and Dermine (2003) Ketkar et al. (2003) Drake and Hall (2003) Tsionas et al. (2003). Accordingly we use three outputs variables: lending to financial institutions, investment and advances and five input variables are used namely operating fixed assets, deposits, number of employees, bills payable and borrowings from financial institutions. The table 2 summarizes the variables used in the study. The variables are measured in Pakistani rupees with the exception of number of employees. 5. Empirical Findings We construct a grand frontier of 285 bank/year observations and apply DEA to measure the technical efficiency of each observation in the sample. The efficiency analysis is conducted by minimizing the above mentioned linear programming problems. Efficiency score for each bank in each year is obtained by using software named MyDEA0.99. We calculate Technical Efficiency (TE) under constant returns to scale (CRS) and variable returns to scale (VRS) and then Scale Efficiency (SE) is estimated for all the banks in sample. The mean values of technical efficiency calculated under CRS by solving CCR DEA model are given in table 3. From the table 3, we can observe that technical efficiency over the entire period is 0.80, which indicates that banks could have saved 18% of inputs in order to produce the same level of output. Turning towards the ownership type, foreign owned commercial banks have achieved highest efficiency score (0.87) followed by the public owned banks (0.84) while the domestic private banks have been the least efficient (0.75). A possible reason for lower efficiency of domestic private banks is that several new private banks entered the market during the sample period, these banks are smaller in size and they are in expansion phase. These banks may have employed a higher amount of fixed assets, which will generate returns in future. A closer examination reveals that among ten top performing banks, there are seven foreign owned banks and three domestic private banks. It is noteworthy that mean efficiency score of state owned banks is higher than domestic private banks but none of the state owned banks is found among the ten top performing banks whereas three domestic banks are there among ten top performing banks along with seven foreign banks. It means all the state owned banks have performed, more or less, on average. Similarly, observing the ten least performing banks there is two foreign owned banks and remaining banks are domestic private banks, which contribute to overall lower efficiency of domestic private banks. One of the two foreign banks found among ten least performing banks entered the market in the last year of sample period, so we expect the efficiency of this bank to increase in future and the second one has already closed its operations in Pakistan. Note that state owned banks are neither found among ten top performing banks nor among ten least performing banks that indicate that in spite of variations in performance over time, state owned banks have been able to maintain an average performance over the whole sample period. From the results, one can observe that foreign owned banks show superior performance as compared to state owned banks and domestic private banks. It means foreign banks are most efficient in the use of inputs. We further observe that mean efficiency of all the banks has varied over the sample period form lowest (0.77) in 2001 to highest (0.83) in 2004 but almost no change in efficiency overtime. Figure 2 shows the trends in efficiency over the sample period. The efficiency of foreign owned banks was (0.92) in 2001 then it increased and reached at highest level (0.94) in 2002, afterwards it declined to 0.87 in 2003 and remained constant in 2004 then it decreased to 0.82 in 2005, later on we observe minor variations in last three years from 0.82 in 2005 to 0.83 in 2006, 0.84 in 2007 and 0.82 in 2008. While the efficiency of state owned banks was lowest (0.70) in 2001 and then it increased continuously and reached to 0.89 in 2004, a downward trend is observed then to 0.86 in 2005 and 0.80 in 2006 but a significant increase is noted from 0.80 in 2006 to 0.97 in 2007 and with a slight

International Journal of Business and Management www.ccsenet.org/ijbm
110
decline at the end of sample period to 0.94 in 2008. The efficiency of domestic private banks too was lowest (0.65) in 2001 and it increased continuously up to 2004 but more or less remained on average during the sample period with the exception of 2001. An interesting feature of DEA results is the identification of efficient units on the frontier. A total of 58 observations out of 285, about 20% of the sample, are found to be fully efficient. While breaking the analysis to ownership groups, we find that 11 out of 36 state owned bank/year observations are fully efficient, there are a total of 166 domestic private bank/year observations, out of which only 16 are found on frontier whereas 31 out of 83 foreign owned bank/year observations are found being fully efficient. It confirms the conclusion drawn above that foreign owned banks have outperformed their counterparts and state owned banks have performed better among domestic banks while domestic private banks have been the least efficient. Further, we break the technical efficiency into pure technical and scale components. Pure technical and scale efficiency scores are given in table 4 and 5 respectively. From the tables, we observe that mean pure technical efficiency and mean scale efficiency of all the banks over the entire sample period is 0.91 and 0.88 respectively. There is a clear indication that pure technical efficiency contributes more towards technical efficiency. Turning again towards ownership type, state owned banks show the highest (0.96) pure technical efficiency followed by the foreign banks (0.94) whereas domestic private banks are least efficient exhibiting a pure technical efficiency score of 0.87. As far scale efficiency is concerned, foreign banks are at top (0.92) followed by state owned banks (0.87) and domestic private banks are again the least efficient with a scale efficiency score of 0.86. The results reveal that pure technical efficiency of state owned banks is somehow satisfactory but they need to improve their scale efficiency. State owned banks are faced with severe scale inefficiency. Both the scale efficiency and pure technical efficiency of foreign banks are above 90% indicating that foreign banks are most efficient as a group in utilizing inputs as compared to their counterparts and also they are operating at right scale compared with domestic banks. Private Banks are least efficient in both pure technical and scale efficiency. So private banks need to improve both pure technical and scale efficiencies in order to compete with their counterparts. The main difference between the efficiency of state owned banks and domestic private banks comes from pure technical efficiency, the higher efficiency of state owned banks is due to pure technical efficiency whereas the difference between scale efficiency of state owned banks and domestic private banks is not significant. The mean pure technical efficiency of all the banks is lowest (0.85) in 2001 and shows a lot of variations throughout the sample period but it have been continuously increasing from 2004 to 2007 reaching the highest (0.95) in 2007 and remains constant in 2008. It indicates that average pure technical efficiency has shown an increasing trend. The trend in pure technical efficiency is shown in figure 3. The pure technical efficiency of state owned banks was lowest (0.88) in 2001 and showed slight variations from year to year but it remained above 90% throughout the sample period with the exception of 2001 and even reached maximum (1.00) in 2002 and 2008. Similarly, pure technical efficiency of foreign banks shows different variations throughout the sample period with a lowest of 0.91 in 2005 and 2008 and highest efficiency 0.99 achieved in 2002. Foreign banks also remained above 90% throughout the sample period in terms of pure technical efficiency. The pure technical efficiency of private banks was lowest (0.73) in 2001 and then we observe an increasing trend during the study period when it reached highest (0.95) in 2007 and 2008 which is positive sign indicating a substantial improvement from 0.73 in 2001, the beginning of study period, to 0.95 in 2008, the end of study period. The mean scale efficiency of all the banks first decreased from 0.90 in 2001 to 0.87 in 2002, then started increasing and reached highest (0.92) in 2004 but after that it is diminishing continuously and reached lowest (0.84) in 2007 and 2008. It confirms the finding that scale inefficiency contributes much more than pure technical inefficiency towards technical inefficiency. The commercial banks operating in Pakistan are faced with serious scale problems. The trends in scale efficiency by ownership type are shown in figure 4. Now, turning towards ownership type we find the mean scale efficiency of state owned banks is 0.87 whereas mean pure technical efficiency of state owned banks is 0.96, clearly indicating that state owned banks are facing serious scale problems and they really need to improve their scale efficiency. As far foreign banks are concerned their mean scale efficiency is 0.92 and mean pure technical efficiency is 0.94, both are above 90%. It proves our finding that foreign owned banks are most efficient as compared to state owned banks and domestic private banks. While observing the domestic private banks, we find their mean scale efficiency is 0.86 and mean pure technical efficiency is 0.87, both at the lowest compared with state owned and foreign banks. But in pure technical efficiency we do observe a significant improvement during the study period but no improvement in scale efficiency of domestic private banks. It is a sign that domestic private banks are also faced with serious scale problems just like state owned banks.
International Journal of Business and Management Vol. 5, No. 4; April 2010
111
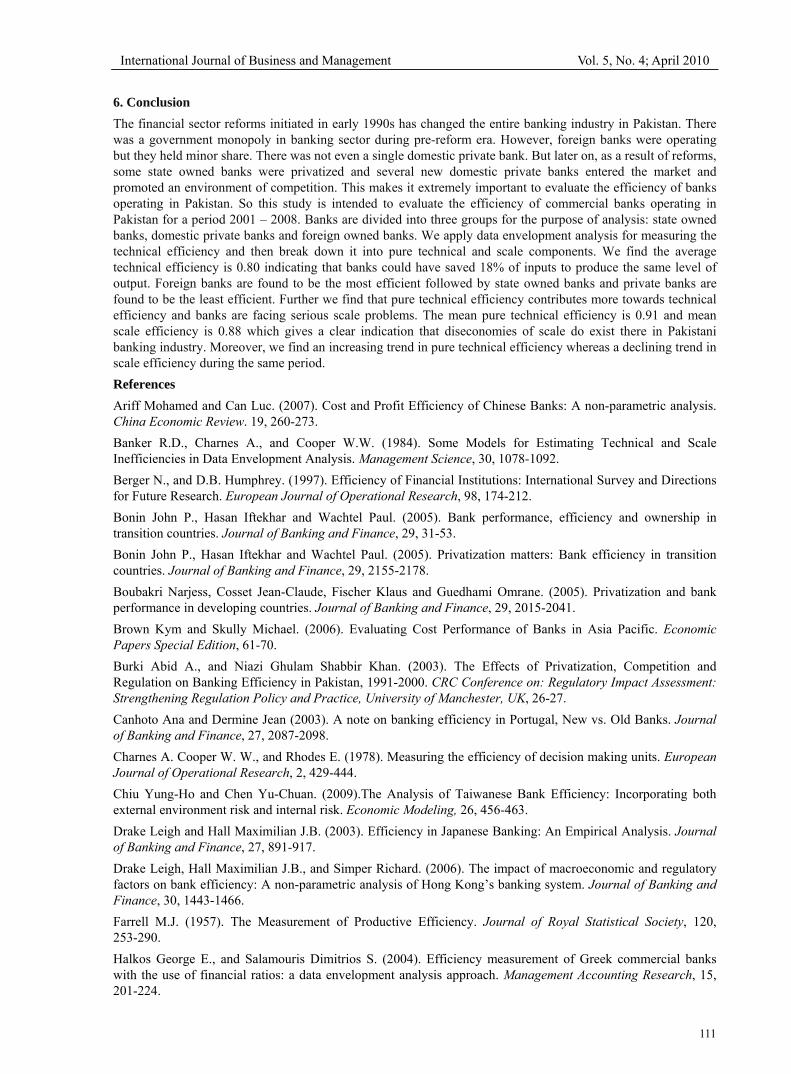
6. Conclusion The financial sector reforms initiated in early 1990s has changed the entire banking industry in Pakistan. There was a government monopoly in banking sector during pre-reform era. However, foreign banks were operating but they held minor share. There was not even a single domestic private bank. But later on, as a result of reforms, some state owned banks were privatized and several new domestic private banks entered the market and promoted an environment of competition. This makes it extremely important to evaluate the efficiency of banks operating in Pakistan. So this study is intended to evaluate the efficiency of commercial banks operating in Pakistan for a period 2001 – 2008. Banks are divided into three groups for the purpose of analysis: state owned banks, domestic private banks and foreign owned banks. We apply data envelopment analysis for measuring the technical efficiency and then break down it into pure technical and scale components. We find the average technical efficiency is 0.80 indicating that banks could have saved 18% of inputs to produce the same level of output. Foreign banks are found to be the most efficient followed by state owned banks and private banks are found to be the least efficient. Further we find that pure technical efficiency contributes more towards technical efficiency and banks are facing serious scale problems. The mean pure technical efficiency is 0.91 and mean scale efficiency is 0.88 which gives a clear indication that diseconomies of scale do exist there in Pakistani banking industry. Moreover, we find an increasing trend in pure technical efficiency whereas a declining trend in scale efficiency during the same period. References Ariff Mohamed and Can Luc. (2007). Cost and Profit Efficiency of Chinese Banks: A non-parametric analysis. China Economic Review. 19, 260-273. Banker R.D., Charnes A., and Cooper W.W. (1984). Some Models for Estimating Technical and Scale Inefficiencies in Data Envelopment Analysis. Management Science, 30, 1078-1092. Berger N., and D.B. Humphrey. (1997). Efficiency of Financial Institutions: International Survey and Directions for Future Research. European Journal of Operational Research, 98, 174-212. Bonin John P., Hasan Iftekhar and Wachtel Paul. (2005). Bank performance, efficiency and ownership in transition countries. Journal of Banking and Finance, 29, 31-53. Bonin John P., Hasan Iftekhar and Wachtel Paul. (2005). Privatization matters: Bank efficiency in transition countries. Journal of Banking and Finance, 29, 2155-2178. Boubakri Narjess, Cosset Jean-Claude, Fischer Klaus and Guedhami Omrane. (2005). Privatization and bank performance in developing countries. Journal of Banking and Finance, 29, 2015-2041. Brown Kym and Skully Michael. (2006). Evaluating Cost Performance of Banks in Asia Pacific. Economic Papers Special Edition, 61-70. Burki Abid A., and Niazi Ghulam Shabbir Khan. (2003). The Effects of Privatization, Competition and Regulation on Banking Efficiency in Pakistan, 1991-2000. CRC Conference on: Regulatory Impact Assessment: Strengthening Regulation Policy and Practice, University of Manchester, UK, 26-27. Canhoto Ana and Dermine Jean (2003). A note on banking efficiency in Portugal, New vs. Old Banks. Journal of Banking and Finance, 27, 2087-2098. Charnes A. Cooper W. W., and Rhodes E. (1978). Measuring the efficiency of decision making units. European Journal of Operational Research, 2, 429-444. Chiu Yung-Ho and Chen Yu-Chuan. (2009).The Analysis of Taiwanese Bank Efficiency: Incorporating both external environment risk and internal risk. Economic Modeling, 26, 456-463. Drake Leigh and Hall Maximilian J.B. (2003). Efficiency in Japanese Banking: An Empirical Analysis. Journal of Banking and Finance, 27, 891-917. Drake Leigh, Hall Maximilian J.B., and Simper Richard. (2006). The impact of macroeconomic and regulatory factors on bank efficiency: A non-parametric analysis of Hong Kong’s banking system. Journal of Banking and Finance, 30, 1443-1466. Farrell M.J. (1957). The Measurement of Productive Efficiency. Journal of Royal Statistical Society, 120, 253-290. Halkos George E., and Salamouris Dimitrios S. (2004). Efficiency measurement of Greek commercial banks with the use of financial ratios: a data envelopment analysis approach. Management Accounting Research, 15, 201-224.

International Journal of Business and Management www.ccsenet.org/ijbm
112
Havrylchyk Olena. (2006). Efficiency of Polish Banking Industry: Foreign versus domestic banks. Journal of Banking and Finance, 30, 1975-1996. Hu Jin-Li, Su Yi-Yuan and Chen Chiang-Ping. (2008). Efficiency of Nationwide Banks in China. The Journal of American Academy of Business, 13, 84-90. Isik Ihsan. (2008). Productivity, technology and efficiency of de novo banks: A counter evidence from Turkey. Journal of Multinational Financial Management, 18, 427-442. Jemric Igor and Vujcic Boris. (2002). Efficiency of Banks in Croatia: A DEA approach. Comparative Economic Studies, XLIV, 169-193. Ketkar Kusum W., Noulas Athanasios G., and Agarwal Manmohan. (2003). An analysis of Efficiency and Productivity Growth of The Indian Banking Sector. Finance India, XVII, 511-521. Lim Guan H., and Randhawa Dipinder S. (2005). Competition, Liberalization and Efficiency: Evidence from a Two stage Banking Model on Banks in Hong Kong and Singapore. Managerial Finance, 31, 52-77. Lin Ping-wen. (2002). The Efficiency of Commercial Bank Mergers in Taiwan: An Envelopment Analysis. International Journal of Management, 19. Mercan Muhammat, Reisman Arnold, Yulalan Reha and Emel B. Ahmet. (2003). The effect of scale and mode of ownership on the financial performance of the Turkish banking sector results of a DEA-based analysis. Socio Economic Planning Sciences, 37, (2003), 185-202. Omran Mohammed. (2007). Privatization, State Ownership and Bank Performance in Egypt. World Development, 35, 714-733. Ozkan-Gunay E. Nur and Tektas Arzu. (2006). Efficiency Analysis of Turkish Banking Sector in Pre-Crises and Crises Period: A DEA approach. Contemporary Economic Policy, 24, 418-431. Resti Andrea. (1998). Regulation can Foster Mergers, Can Mergers Foster Efficiency? The Italian Case. Journal of Economics and Business, 50, 157-169. Sathye Milind. (2003). Efficiency of Banks in a Developing Economy: The Case of India. European Journal of Operational Research, 148, 662-671. Sturm Jan-Egbert and Williams Barry. (2004). Foreign bank entry, deregulation and bank efficiency: Lessions from the Australian experience. Journal of Banking and Finance, 28, 1775-1799. Tsionas Efthymios G., Lolos Sarantis E.G., and Christopolous Dimitris K. (2003). The Performance of Greek Banking System in view of the EMU: results from a non-parametric approach. Economic Modeling, 20, 571-592. Table 1. Sample Data
2001 2002 2003 2004 2005 2006 2007 2008 State Owned Banks 6 5 5 4 4 4 4 4 Domestic Private Banks 14 16 18 20 21 25 26 26 Foreign Banks 14 14 13 11 11 7 6 7 Total 34 35 36 35 36 36 36 37

International Journal of Business and Management Vol. 5, No. 4; April 2010
113
Table 2. Descriptive Statistics of Variables (Thousand Rupees)
2001 2002 2003 2004 2005 2006 2007 2008
Outputs:
Lending to Financial Institutions:
Mean 3827455 4075075 5370463 4040692 5911048 5933947 5240151 5076056
S.D 5346854 6624311 7374085 4746226 6298734 7055544 6218288 7461932
Investment:
Mean 9571246 19392307 21221110 19168104 21792297 22840994 35191896 29174023
S.D 17251090 35695347 41190360 34433707 32669744 32274237 50835167 41960786
Advances:
Mean 23194283 23560246 28233782 43503463 53523334 65722685 73535691 86622807
S.D 41196039 37471876 42570208 60763433 75593540 89294581 100192535 120012904
Inputs:
Operating Fixed Assets:
Mean 876965 992430 1116465 1564702 1863033 2442115 4583669 4551649
S.D 1676335 1869612 2002926 2690068 2810552 3269085 7546343 6110237
Deposits:
Mean 41061775 46507463 52998006 68402539 78295805 90526836 107641183 114559009
S.D 77920307 84315134 91953722 107423286 113059170 126994373 149414733 163612376
Number of Employees:
Mean 2184 2065 2105 2339 3008 3513 3756 3835
S.D 4603 4204 4160 4246 4479 4777 4693 4652
Bills Payable:
Mean 695651 790174 1028127 1330164 1184726 1667661 2268463 1864206
S.D 1622605 1451648 1850205 2074249 1805572 2633672 3271951 2827915
Borrowing from Financial Institutions:
Mean 5015411 5839192 6192425 6180946 7289818 10156623 10368759 10300364
S.D 5197104 7466860 7852572 5882429 7331151 12157897 15198356 12948067

International Journal of Business and Management www.ccsenet.org/ijbm
114
Table 3. Mean Technical Efficiency score by ownership type and by year
State Owned Domestic Private Foreign All Banks
2001 Mean 0.70 0.65 0.92 0.77 S.D 0.15 0.15 0.12 0.19
2002 Mean 0.82 0.72 0.94 0.82 S.D 0.17 0.16 0.09 0.17
2003 Mean 0.83 0.77 0.87 0.81 S.D 0.11 0.15 0.17 0.14
2004 Mean 0.89 0.79 0.87 0.83 S.D 0.12 0.12 0.17 0.14
2005 Mean 0.86 0.79 0.82 0.81 S.D 0.12 0.12 0.17 0.14
2006 Mean 0.80 0.77 0.83 0.79 S.D 0.17 0.13 0.12 0.13
2007 Mean 0.97 0.76 0.84 0.80 S.D 0.06 0.11 0.22 0.14
2008 Mean 0.94 0.77 0.82 0.80 S.D 0.11 0.11 0.22 0.15
2001- 2008 Mean 0.84 0.75 0.87 0.80 S.D 0.12 0.11 0.12 0.15
Table 4. Mean pure technical efficiency by ownership type and year
State Owned Domestic Private Foreign All Banks
2001 Mean 0.88 0.73 0.96 0.85 S.D 0.13 0.14 0.08 0.16
2002 Mean 1.00 0.88 0.99 0.94 S.D 0.01 0.13 0.03 0.11
2003 Mean 0.99 0.88 0.93 0.91 S.D 0.03 0.13 0.00 0.14
2004 Mean 0.95 0.87 0.93 0.90 S.D 0.06 0.11 0.15 0.12
2005 Mean 0.98 0.90 0.91 0.91 S.D 0.04 0.12 0.09 0.11
2006 Mean 0.95 0.90 0.93 0.92 S.D 0.11 0.14 0.06 0.12
2007 Mean 0.99 0.95 0.92 0.95 S.D 0.02 0.06 0.14 0.08
2008 Mean 1.00 0.95 0.91 0.95 S.D 0.00 0.06 0.16 0.09
2001 -2008 Mean 0.96 0.87 0.94 0.91
S.D 0.12 0.10 0.07 0.12

International Journal of Business and Management Vol. 5, No. 4; April 2010
115
Table 5. Mean Scale efficiency scores by ownership type and year
State Owned Domestic Private Foreign All Banks
2001 Mean 0.81 0.88 0.95 0.90 S.D 0.15 0.08 0.06 0.10
2002 Mean 0.83 0.81 0.95 0.87 S.D 0.16 0.12 0.09 0.13
2003 Mean 0.84 0.87 0.93 0.90 S.D 0.10 0.09 0.12 0.11
2004 Mean 0.93 0.90 0.93 0.92 S.D 0.07 0.09 0.10 0.09
2005 Mean 0.88 0.89 0.90 0.89 S.D 0.12 0.07 0.13 0.09
2006 Mean 0.84 0.86 0.89 0.86 S.D 0.12 0.10 0.10 0.10
2007 Mean 0.98 0.80 0.89 0.84 S.D 0.05 0.11 0.12 0.12
2008 Mean 0.94 0.82 0.88 0.84 S.D 0.11 0.10 0.13 0.12
2001 - 2008 Mean 0.87 0.86 0.92 0.88
S.D 0.07 0.80 0.08 0.11
P
M
NPX1
X2O Figure 1. Technical Efficiency

International Journal of Business and Management www.ccsenet.org/ijbm
116
Figure 3. Trends in Pure Technical Efficiency
Figure 2. Trends in Technical Efficiency
Figure 4. Trends in Scale Efficiency