Firm Volatility and Banks: Evidence from U.S. Banking Deregulation
42
Finance and Economics Discussion Series Divisions of Research & Statistics and Monetary Affairs Federal Reserve Board, Washington, D.C. Firm Volatility and Banks: Evidence from U.S. Banking Deregulation Ricardo Correa and Gustavo A. Suarez 2009-46 NOTE: Staff working papers in the Finance and Economics Discussion Series (FEDS) are preliminary materials circulated to stimulate discussion and critical comment. The analysis and conclusions set forth are those of the authors and do not indicate concurrence by other members of the research staff or the Board of Governors. References in publications to the Finance and Economics Discussion Series (other than acknowledgement) should be cleared with the author(s) to protect the tentative character of these papers.
Transcript of Firm Volatility and Banks: Evidence from U.S. Banking Deregulation
Finance and Economics Discussion SeriesDivisions of Research & Statistics and Monetary Affairs
Federal Reserve Board, Washington, D.C.
Firm Volatility and Banks: Evidence from U.S. BankingDeregulation
Ricardo Correa and Gustavo A. Suarez
2009-46
NOTE: Staff working papers in the Finance and Economics Discussion Series (FEDS) are preliminarymaterials circulated to stimulate discussion and critical comment. The analysis and conclusions set forthare those of the authors and do not indicate concurrence by other members of the research staff or theBoard of Governors. References in publications to the Finance and Economics Discussion Series (other thanacknowledgement) should be cleared with the author(s) to protect the tentative character of these papers.

Firm Volatility and Banks:
Evidence from U.S. Banking Deregulation
Ricardo Correa Gustavo A. Suarez
Federal Reserve Board
September 23, 2009
Abstract
This paper exploits the staggered timing of state-level banking deregulation in the United
States during the 1980s to study the causal effect of banking integration on the volatility
of non-financial corporations. We find that firm-level employment, production, sales,
and cash flows are less volatile after interstate banking deregulation, particularly for
firms that have limited access to external finance. This finding suggests that bank-
dependent firms exploit wider access to finance after deregulation to smooth out
idiosyncratic shocks. In fact, short-term credit becomes less pro-cyclical after out-of-
state bank entry is permitted. Finally, lower volatility in real-side variables after
deregulation translates into lower idiosyncratic risk in stock returns.
JEL Classification Codes: G21, G32
Keywords: Bank deregulation, firm volatility, external finance, idiosyncratic volatility
Corresponding author: [email protected]. We thank Andres Almazan, Robert Avery, Allen Berger, Dan Covitz, Eric Engstrom, Arturo Galindo, Rocco Huang, Borja Larrain, Ugur Lel, Greg Nini, Andrew Powell, Rafael Repullo, and seminar participants at the Federal Reserve Board, the Latin American Finance Network, the AFA Annual meetings in San Francisco, and the MFA Annual meetings in San Antonio for valuable comments. The usual disclaimer applies. The authors’ views do not necessarily reflect those of the Board of Governors of the Federal Reserve or the Federal Reserve System.

A growing body of theoretical and empirical research indicates that the ability of firms to
access banking finance fosters average growth.1 For example, Rajan and Zingales (1998)
find that industries that depend on external financing for investment grow faster in
countries with larger banking systems. In addition to its positive effect on average
growth, access to banking finance may have an important effect on growth volatility.
The effect of financial markets—and banking finance in particular—on volatility is less
well understood. This paper studies the relationship between banking integration and the
volatility of the corporate sector using data on publicly-traded U.S. firms.
From a macroeconomic point of view, volatility is important because of the growth
benefits conferred by stability (Ramey and Ramey (1995), Aghion et al. (2005)). From
the point of individual corporations, volatility is important because stable firms face
lower expected costs from financial distress (Smith and Stulz (1985)), financial policies
are more effective for solving agency problems in stable firms (Stulz (1990)), and
investors value firms with smooth cash flows at a premium (Rountree, Weston, and
Allayannis (2008)).2
In theory, the direction of the effect of banking finance on firm volatility is
ambiguous. On the one hand, wider access to external finance may increase the ability of
firms to offset idiosyncratic shocks, thus reducing firm volatility. On the other hand,
wider access to external finance may promote specialization and allow firms to pursue
riskier and more profitable projects (Thesmar and Thoenig (2009)), thus increasing firm
volatility. As a consequence of mutually offsetting forces, the net effect of access to
banking finance on firm volatility is an empirical question.3
Recent papers in this area suggest that wider access to banking finance may lower
volatility in the corporate sector. Extending the methodology of Rajan and Zingales
(1998), Larrain (2006) finds that growth in industries that depend on external finance is
less volatile in countries with more bank credit relative to GDP. Using a similar cross-
country, cross-industry approach, Raddatz (2006) argues that the volatility-reducing
effect of more bank intermediation results partly from the role of the financial system in
1 See Levine (2005) for a survey. 2 The existence of corporate hedging activity suggests that firms try to mitigate some sources of risk and volatility. See, for example, Froot, Scharfstein, and Stein (1993). 3 In addition, the effect of wider access to banking finance on volatility may depend on the relative strength of credit supply and credit demand shocks (Morgan, Rime, and Strahan (2004)).

3
providing liquidity.4 Cross-country studies results may also be consistent with a reverse
causality interpretation, where a more stable corporate sector facilitates the expansion of
bank credit.
This paper complements and refines the findings in Larrain (2006) and Raddatz
(2006) by using a different identification strategy for isolating the effect of banking
finance on corporate volatility. In particular, we use a differences-in-differences
approach that exploits the staggered timing of interstate banking deregulation across U.S.
states during the 1980s and early 1990s to estimate the effect of banking integration on
firm-level volatility. After a state passed an interstate banking deregulation law, out-of-
state banks were allowed to acquire banks incorporated in that state, effectively
promoting the integration of banking markets. We interpret deregulation that facilitates
banking integration, starting from a situation with highly segmented markets, as
promoting wider access to banking finance and improving efficiency in intermediation,
possibly reflecting that financial institutions become more geographically diversified
(Jayaratne and Strahan (1996), Morgan, Rime, and Strahan (2004)). With this
interpretation, the results of this paper may inform the debate about the impact of access
to banking finance on firm-level volatility.
Our identification strategy is similar to Morgan, Rime, and Strahan’s (2004), but we
focus on firm volatility—as opposed to state volatility. Firm-level data help us in
identifying banking deregulation as the driving force behind our results, because we are
able to compare, within each state, the effect of deregulation on bank-dependent firms
with the effect on non-bank-dependent firms. Previous research suggests that small firms
and firms with limited access to corporate debt face significant asymmetries when
accessing credit markets (Almeida, Campello, and Weisbach (2004), Gilchrist and
Himmelberg (1995)). These types of firms tend to rely more heavily on banks for their
external financing needs and are defined as bank dependent in our regression analysis.
We expect bank-dependent firms to be more sensitive to changes in banking conditions
within a state.
We find that firms located in states that deregulate interstate banking exhibit a
4 In a related branch of the literature, Krozner, Laeven, and Klingebiel (2007) study the impact of banking crises across sectors depending on their degree of dependence on external finance.
4
reduction in the volatility of the growth rates of sales, production, cash flow, and
employment after deregulation. In our main result, the reduction in volatility is likely to
be associated with the changes in banking finance derived from deregulation, because it
is concentrated on firms that are more likely to rely on banks for external financing. For
example, firms without bond or commercial paper credit ratings or issues reduce their
volatility after deregulation by more than firms with credit ratings or issues. Further tests
suggest that firms exploit credit markets to smooth temporary cash-flow shocks, as short-
term credit becomes more countercyclical after deregulation (as in Larrain (2006)).
In addition, by using firm-level data we are able to examine the implications of
wider access to banking finance for the volatility of individual stock returns. We
document that the idiosyncratic volatility of stock returns falls after deregulation,
particularly for firms that are a priori more likely to rely on banking finance. The
residual variance of a market model of excess returns falls after deregulation for firms
located in states that open to interstate banking. This finding is robust to adding the size
and value factors of Fama and French (1993) and the momentum effect of Jegadeesh and
Titman (1993).
At first glance, our results might seem at odds both with the increase in volatility of
firm sales growth documented by Comin and Philippon (2005) and Comin and Mulani
(2006) and with the increase in the idiosyncratic volatility of individual stock returns
documented by Campbell et al. (2001). While these papers describe aggregate trends
over the second half of the twentieth century, we restrict our attention to the window of
years around deregulation of interstate banking. Importantly, the increasing trend in
volatility described by Comin and Philippon (2005) temporarily reverses during the
1980s—the years with the heaviest deregulation activity at the state level and, therefore,
the main part of our sample. Similarly, the increasing trend in idiosyncratic volatility
described by Campbell et al. (2001) does not apply to the 1980s.5 In this paper, we
abstract from aggregate trends in idiosyncratic volatility by controlling for year-fixed
effects. We argue that part of the remaining variation in firm-level volatility is explained
by interstate banking deregulation.
5 In fact, excluding the market crash of 1987 in Figure 4 of Campbell et al. (2001), idiosyncratic volatility trended down during the 1980s.
5
The rest of the paper is organized as follows. Section I briefly reviews the interstate
banking deregulation in the 1980s in the United States and summarizes some related
studies. Section II presents our empirical methodology and the data. Section III shows
the effect of banking deregulation on firm-level volatility and its differential impact on
those firms that are more likely users of banking finance. This section also links
volatility in operations and stock return volatility using multifactor models of stock
returns at the firm level to isolate the idiosyncratic component of returns. Section IV
concludes.
I. The Deregulation of Interstate Bank Entry
The Douglas Amendment to the Bank Holding Company Act of 1956 prohibited
Bank Holding Companies (BHCs) from establishing or purchasing bank subsidiaries
across state lines unless the state of the target bank authorized the transaction. These
restrictions remained in place until Maine passed a law allowing out-of-state BHCs to
purchase local banks if the “home” state of the BHC reciprocated. This did not happen
until 1982 when Alaska and New York passed similar laws. The same year, as part of the
Garn-St Germain Act, federal legislators amended the Bank Holding Company Act to
allow failed banks to be acquired by any BHC, regardless of origin and state laws. This
regulatory change, coupled with a series of bank and thrift failures during the eighties,
triggered a wave of interstate agreements that effectively permitted banking at the
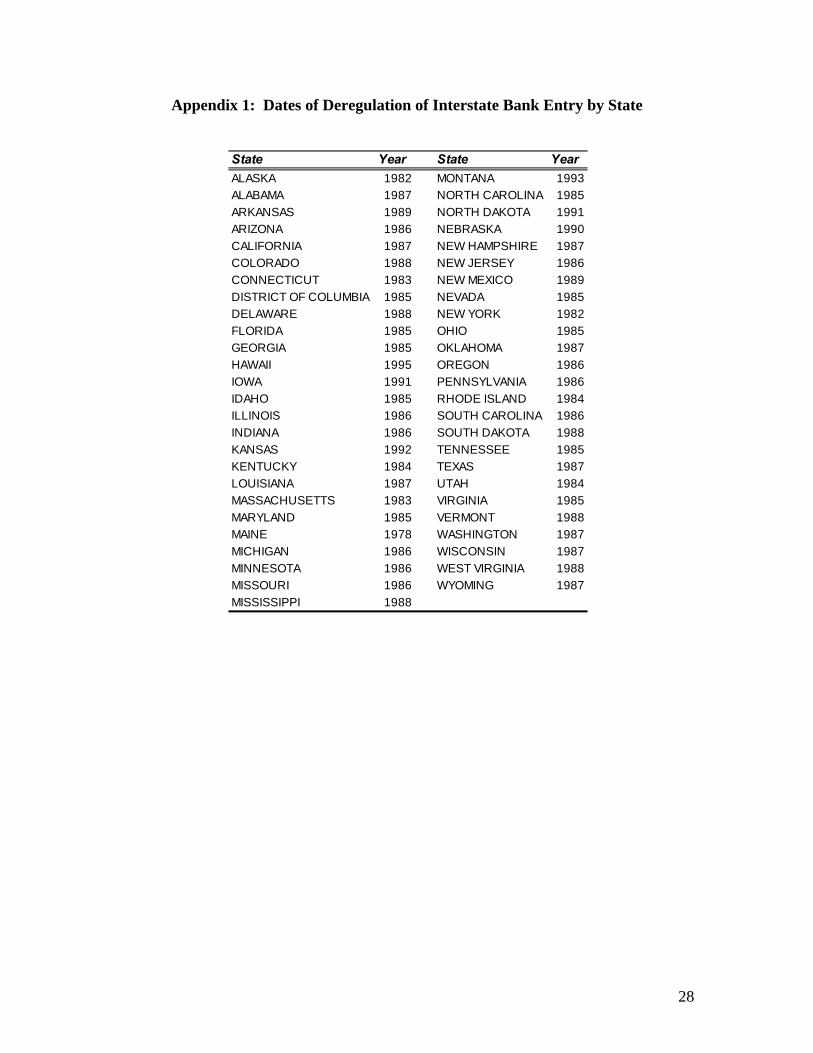
national level. By 1994, 49 states and the District of Columbia had deregulated their
banking markets allowing out-of-state entry.6
The episode of banking deregulation in the 1980s and early 1990s changed the terms
in which nonfinancial firms were able to access banking finance. In particular, Jayaratne
and Strahan (1998), Dick (2006), and Rice and Strahan (2009) find that loan prices and
spreads decrease after banking deregulation.
A series of studies have analyzed the effect of this episode of banking deregulation
on real economic activity. Strahan (2003) finds that interstate deregulation is associated
with an increase in incorporations by state and a reduction in the link between state
6 Interstate branching was permitted nationwide with the Riegle-Neal Interstate Banking and Branching Efficiency Act, which became effective in June 1997. Montana and Texas took advantage of a clause in the Act and opted out at an earlier date. The table in Appendix 1 lists deregulation dates by state.

6
growth and local bank performance.7 In a study on income insurance, Demyanyk,
Ostergaard, and Sorensen (2007) find that deregulation, measured as the combination of
intrastate and interstate deregulation, decreases the correlation between personal income
and state-specific shocks to output. Their result is stronger for proprietor income than for
wage income. The authors explain this effect by the closer relationship between banks
and small businesses. This result is connected to Morgan, Rime, and Strahan’s (2004)
finding that geographical bank integration reduces employment volatility within states.
This change is due to a decline in the impact of bank capital shocks on state activity.
A limited number of studies have examined the connection between deregulation
and firm-level dynamics. Correa (2007) finds that banking deregulation is associated
with a decrease in financing constraints for small publicly-traded firms, explained by
lower costs of financing after deregulation. From a theoretical perspective, Stebunovs
(2006) uses a stochastic general equilibrium model to assess the consequences of banking
deregulation on volatility. The author finds that deregulation increases firm entry by
reducing local bank monopoly power, thus dampening firm- and aggregate-level
fluctuations.
In this paper, we expand on these findings and analyze the empirical effect of
interstate bank-entry deregulation on firm volatility. Moreover, we test if changes in the
volatility of firm fundamentals are accompanied by changes in the volatility of individual
stock returns.
II. Data and Methodology
A. Data
In the empirical analysis of this paper, we use balance sheet and income statement
data extracted from the Compustat North-America database. The sample includes
observations for firms classified in the manufacturing (SICs 2000 to 3999), wholesale
(SICs 5000 to 5199), and retail trade (SIC 5200 to 5999) sectors. To focus on the episode
of interstate banking deregulation of the 1980s and early 1990s, our sample includes data
between 1976 and 1998. 7 Huang (2007) exploits the variation of neighboring counties across state borders to understand the effects of this episode of banking deregulation.
7
Compustat’s geographic information reports a firm’s headquarters location only for
the latest year available in the database. To determine whether a firm was affected by
bank entry deregulation, we need to find the actual historical location of its headquarters.
For this purpose, we collect data from Compact Disclosure between 1988 and 1998. This
source contains extracts from SEC filings updated every month, including the firm’s
address. Using this information, we determine the state where the firm was
headquartered during the deregulation period.8 A firm is excluded from the sample if it
changed its location between 1988 and 1998. In addition, we consider only firms with
non-missing information two years before and two years after interstate bank entry
deregulation in the state where headquarters are located.9
After applying these restrictions, the data consists of 39,624 observations for 2,272
firms in 45 states and the District of Columbia.10 Table I shows the distribution of firms
by state. Firms in New York and California account for one quarter of the sample; other
important states in the Northeast (Connecticut, Maryland, Massachusetts, New Jersey,
and Pennsylvania) account for about 20 percent of the sample; and large industrial states
in the Midwest (Illinois, Michigan, and Ohio) represent 13 percent of the firms covered.
Due to the sample selection criteria, an average firm stays in the sample for 17 years.11
[Table I]
Stock returns are collected from the Center for Research in Security Prices (CRSP)
dataset. Additionally, the one-month Treasury Bill rate and the Fama-French and
Jegadeesh-Titman factors are taken from Kenneth French’s Data Library at Dartmouth.
8 The earliest year for which we have location information comes after the first bank entry deregulation agreement was implemented (1982). Although, some firms might have changed their location between these dates, the number is likely to be small. Using information from Compact Disclosure, we determine that less than 10 percent of firms covered by this database changed the state where they were headquartered between 1988 and 2005. 9 Due to this selection criterion, our results are explained by changes in the volatility of existing firms rather than changes in the volatility of entering and exiting firms. All results are robust to include firms that exit before deregulation and enter after deregulation. 10 We exclude firms headquartered in Delaware and South Dakota due to their incorporation and consumer finance regulations, respectively. In addition, as Hawaii did not deregulate before 1994, we also exclude firms located in that state. 11 The discontinuity at deregulation of our empirical design suggests that our results are not simply a reflection of firms becoming more stable as they age, and we conduct additional checks of our baseline results.

8
B. Firm Volatility
The effect of bank entry deregulation on firm volatility is ambiguous from a
theoretical standpoint (Larrain (2006), Morgan, Rime, and Strahan (2004)). On the one
hand, wider availability of bank credit may dampen the effect of idiosyncratic shocks on
productive activities, making firms more stable. On the other hand, improved access to
bank financing may increase volatility by allowing firms to undertake riskier and more
profitable projects (e.g., adopting new technologies). Hence, we adopt an empirical
approach to study the relationship between firm volatility and access to bank credit.
To estimate the effect of interstate bank entry deregulation on volatility we follow
Morgan, Rime, and Strahan (2004) and use a two-stage procedure. In the first stage we
calculate a time-varying measure of firm volatility. In the second stage we use this
measure to determine whether interstate bank entry deregulation had an effect on the
volatility of non-financial corporations.
Let i, j, k, and t index firm, state, industry, and year, respectively, and Yijt be a
generic variable. We define the volatility of Yijt as the deviations in absolute value of Yijt
from its predicted conditional mean. Formally, we estimate the following equation:
1ijt i t jt ijt jt kt ijtY Integration X Z W (1)
where i are firm-fixed effects; t are time effects; Integrationjt is an indicator variable
that equals one if state j permits out-of-state bank entry through acquisitions in year t; Xijt
are firm-specific controls; Zjt represents the growth rate of state per capita income; and
Wkt is the growth rate in real sales at the industry level (3-digit SIC). We consider three
firm-level controls: the log of real sales (log(Sales)), tangible assets divided by total
assets (Tangible/Assets), and earnings before taxes, depreciation, and amortization
divided by total assets (EBITDA/Assets).12 These measures are associated with firm-
leverage (Rajan and Zingales (1995)), and reflect, respectively, the size of the firm, its
collateral, and profitability.
12 Following Almeida and Campello (2007), tangible assets are defined as:
0.715 Re 0.547 0.535Tangible ceivables Inventory Capital , where Receivables is Compustat item
#2, Inventory is item #3, and Capital is item #8. EBITDA is defined as Compustat item #13.

9
After estimating equation (1), the volatility for variable Yijt, Vol(Yijt), is defined as
ˆijt . Notice that this measure of volatility is the absolute deviation of the firm’s
indicators from the overall trends in the economy, from the state where its headquarters
are located, and from the industrial sector that represents its main activity. In addition,
we allow for changes in the firms’ growth rate after interstate bank entry is permitted.
The measure estimated from this empirical equation captures the idiosyncratic component
of firms’ volatility. Measuring volatility using absolute deviation (as opposed to squared
deviations) implies that volatility and growth are conveniently expressed in the same
units.
As part of their intermediation function, banks have a comparative advantage in
providing liquidity to firms, particularly if the demand for funds is related to individual
projects (Larrain (2006)). Therefore, to analyze the effect of banking deregulation on
firm volatility, we will focus on its idiosyncratic component. In the second stage of our
estimating procedure, we use the volatility measures defined in equation (1) and estimate
the following equation:
1ijt i t jt ijt jt kt ijtVol Y Integration X Vol Z Vol W (2)
We add two regressors, in addition to the set included in equation (1), to control for
fluctuation at the state and industry level. Vol(Zjt) and Vol(Wkt) are volatility proxies for
the states’ per capita income growth and real sales growth at the industry level,
respectively.
In our baseline regressions, Yijt is the growth rate of production, sales, cash flow, and
employment, indicators of real corporate activity. These measures allow us to determine
if output fluctuations changed after banking deregulation.13 As in Larrain (2006), firm
production is measured by inventory investments plus sales. In addition to this set of
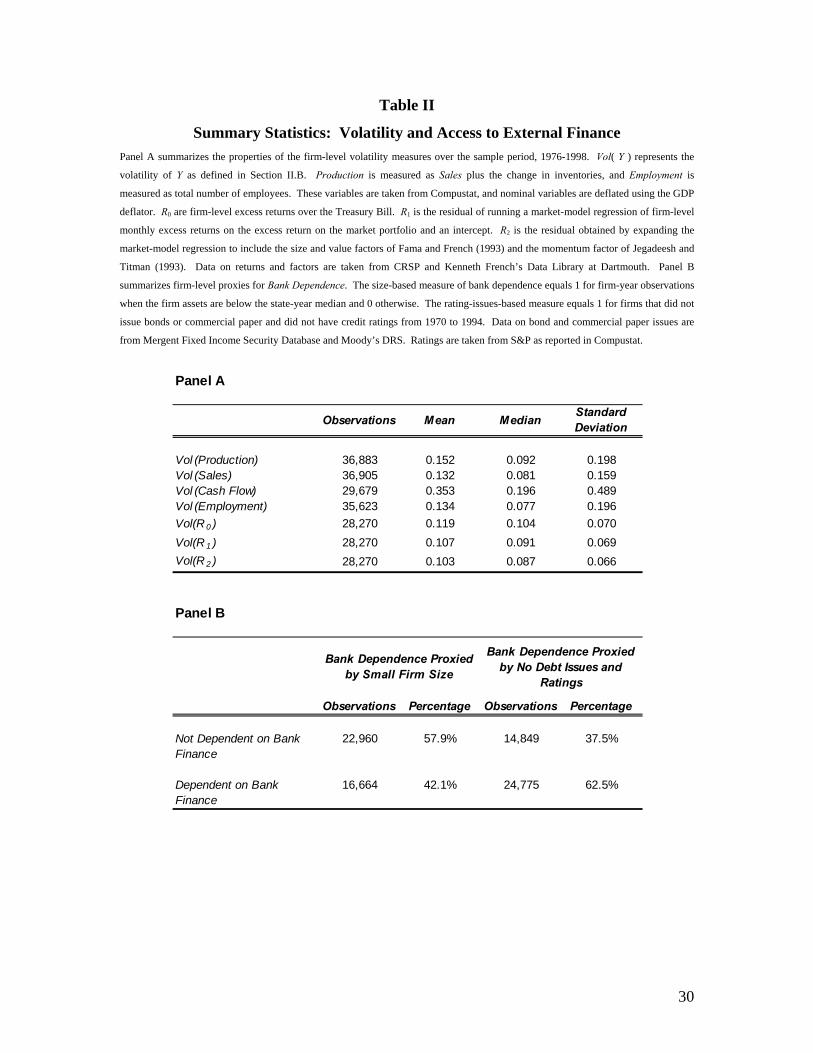
variables, we analyze the evolution of the firms’ internal cash flow. Panel A in Table II
shows summary statistics for the measures of volatility associated with these variables.14
13 Nominal variables are deflated using the GDP deflator. Comin and Mulani (2005) test different price deflators, and do not find any significant differences in their volatility measures. 14 Sales is Compustat item #12, employment is item #29, cash flow equals item #18 plus item #14, and inventories is item #3.
10
[Table II]
To test whether firm volatility decreases after interstate bank entry deregulation, we
examine the sign of δ in equation (2). As documented by Comin and Mulani (2005), the
volatility of publicly-traded firms increased over the last five decades. The inclusion of
time-fixed effects captures this secular trend. Therefore, a negative sign on the
Integration coefficient is interpreted as a decrease in the upward trend in volatility.
We control for variation at the industry (Wkt) and state level (Zjt) to isolate the effect
of deregulation on the idiosyncratic component of firm-specific volatility. The former is
measured by the absolute value of deviations of the log change in sales at the 3-digit SIC
level, Vol(Industry Sales).15 The state-level component is proxied by the volatility of log
changes in per capita income, Vol(Per Capita Income).16 Finally, selecting firms with
observations before and after deregulation and controlling for firm-fixed effects alleviates
sample biases in which firms that enter after deregulation exhibit a systematically
different volatility than firms that exit before deregulation.
C. Firm Volatility and Bank Dependence
The baseline empirical estimation described in the previous section takes advantage
of the staggered deregulation dates across states to identify whether there was a change in
the firms’ volatility measures explained by lower restrictions on out-of-state bank entry.
However, this strategy does not fully control for other potential shocks that might have
had an effect on firms headquartered within the state at the time of banking deregulation.
We take this problem into account by using another layer of differentiation. In particular,
we test whether the effects of bank entry deregulation is stronger for bank-dependent
firms, as opposed to firms with access to other sources of external financing, within each
state.
We define two proxies for firms’ Bank Dependence: one based on size and the other 15 Formally, 2
kt kt kVol Y Y Y represents the volatility of the log change in Industry Sales, for each 3-
digit SIC sector k. kY is computed separately for the periods before and after bank entry deregulation. 16 This measure is computed using the absolute value of the error term, after estimating equation (1) for the log changes in per capita income at the state level.
11
based on the use of public corporate debt. These variables have been widely used in the
financing constraints literature (e.g., Almeida, Campello, and Weisbach (2004)).
Empirical studies typically find that small firms and firms with limited access to
corporate debt face significant information asymmetries when accessing credit markets,17
and thus rely more on the use of internal funds or on credit from banks to finance their
operations. Dependence on internal funds and bank credit makes these firms more likely
to experience a change in financing conditions due to interstate bank entry deregulation.
Formally, the following equation is estimated using volatility in production, sales, cash
flow, and employment as dependent variables:
1
( ) ( )
ijt i t jt ijt
jt ijt ijt jt kt ijt
Vol Y Integration Bank Dependence
Integration Bank Dependence X Vol Z Vol W
(3)
where the right-hand side variables are the same as in equation (2), with the exception of
Bank Dependence and its interaction with the dummy for bank integration. It is worth
stressing that our two measures of Bank Dependence—the one based on firm size and the
one based on access to public debt markets—are constructed so that larger values of the
variable reflect a heavier dependence on banking finance. If bank-dependent firms
benefit more from interstate deregulation, we would expect to have a negative sign.
This implies that volatility decreases after deregulation for those firms that rely more
heavily on banks for their external financing needs.
In the empirical estimations, the size-based measure of bank dependence is an
indicator variable that equals one if the firm’s assets are below median assets in a given
year and state. Panel B in Table II shows that, according to this criterion, 42.1 percent of
firm-year observations in our sample are classified as bank-dependent because of their
small size. The second measure, based on the use of corporate debt, is defined through
the firm’s history of credit ratings and issues between 1970 and 1994. A firm is
classified as being bank-dependent if it did not issue debt nor had any credit ratings in
17 Gilchrist and Himmelberg (1995) use size to define financially constrained firms. These authors and Kashyap, Lamont, and Stein (1994) also use access to the bond market to define firms that face greater informational asymmetries in the financial markets. Calomiris, Himmelberg, and Wachtel (1995) describe the characteristics of commercial paper issuers.
12
this period. Bond and commercial paper credit rating information is retrieved from
Compustat. Bond and commercial paper issues are obtained from the Mergent Fixed
Income Security Database (FISD) and Moody’s Default Risk Service (DRS) Database.
Out of the 2,272 firms included in the sample, 1,516 are classified as bank-dependent
because they did not have any issues or credit ratings for this period. As shown in Panel
B of Table II, this group of firms accounts for 62.5 percent of firm-year observations.
D. Deregulation and the Cyclicality of Short-Term Borrowing
If bank lending availability is enhanced by deregulation, bank-dependent firms faced
with idiosyncratic shocks would be able to borrow during periods of output contraction.
Hence, bank credit becomes less pro-cyclical and bank entry deregulation would lead to
smaller firm volatility. The next step in our analysis is to test whether bank credit
became less pro-cyclical for bank-dependent firms after bank entry deregulation. For this
purpose, we estimate the following equation:
1
log
ijt i t jt t
ijt jt ijt
jt ijt t
ijt ijt
Notes Payable Integration Cyclicality
Bank Dependence Integration Bank Dependence
Integration Bank Dependence Cyclicality
X
(4)
where log ijtNotes Payable is the log change in notes payable for firm i in state j and
year t. Although loans from banks are not reported in Compustat, Notes Payable
approximate access to credit from financial institutions.18 We consider two alternative
measures of the cycle: the first is firm sales scaled by lagged assets, Salesijt/Assetsijt-1,
and the second is the growth rate in real per capita GDP in the United States.
The coefficient on the cyclicality variables measures the co-movement of short-term
borrowing with business conditions. In these estimations, we test if is negative and
significant. When this coefficient is negative, cyclicality decreases after banking
18 Notes payable is Compustat item #206.

13
deregulation for the set of firms that most likely use bank credit. This would be evidence
that bank entry deregulation reduced the pro-cyclicality of lending to bank-dependent
firms.
E. Equity Return Volatility
In addition to real variables, we study the effect of deregulation on equity return
volatility. A change in firms’ volatility, both of production and profitability, would likely
have an effect on stock returns. As shown by Pastor and Veronesi (2003), idiosyncratic
return volatility increases with the volatility of profitability. This is particularly relevant
for financially constrained firms. A decrease in the volatility of financially constrained
firms after bank entry deregulation should also reduce stock return volatility. To test this
hypothesis, we measure stock return volatility in our baseline specifications as the
standard deviation of the residuals from the following market model estimated with
monthly observations:
f vw fijt t i i t t ijtR R R R (5)
where Rijt is the return to shareholders of firm i in period t, which in our stock return
regressions represents months instead of years. ftR is the risk-free return rate proxied by
Ibbotson’s one-month Treasury Bill rate; VWtR is the value-weighted return on all NYSE,
NASDAQ, and AMEX stocks; and ijt is the idiosyncratic component of excess returns.
The market model in equation (5) is estimated for each firm before and after interstate
entry deregulation, which allows for different coefficients in the two periods of interest.
We also estimate (5) adding the Fama-French size and value factors, and the Jegadeesh-
Titman momentum factor. Lastly, we analyze raw excess returns computed as the
residuals in (5), without controlling for the excess returns on the market portfolio.
We define idiosyncratic stock return volatility as the standard deviation of residuals
in (5) for each firm and year. Figures 1 and 2 show the evolution of these residual returns
before and after deregulation. Following banking deregulation, the median idiosyncratic
component of stock return volatility declines for three years. Campbell et al. (2001) and
14
Pastor and Veronesi (2003) document a long-term increase in firm volatility starting in
the 1960s. This trend temporarily reverses in the years after deregulation in the 1980s,
consistent with the drop in idiosyncratic stock return volatility in Figures 1 and 2.
[Figure 1]
[Figure 2]
Figure 3 shows the evolution of median stock return volatility before and after
deregulation splitting the sample by bank dependence. Compared to the group of firms
with access to public debt markets, excess return volatility is higher for firms that are
bank-dependent and experiences a steeper decline after banking deregulation. This
evidence suggests that the stabilizing effects from banking deregulation may have
benefited more those firms that depend to a greater extent on banks for their financing
needs. The next section presents the statistical analysis behind this graphical evidence.
[Figure 3]
III. Results
A. Firm Volatility
In this section we analyze the effect of interstate bank entry deregulation on firm
volatility. The focus is on variables that account for firm output and performance. Table
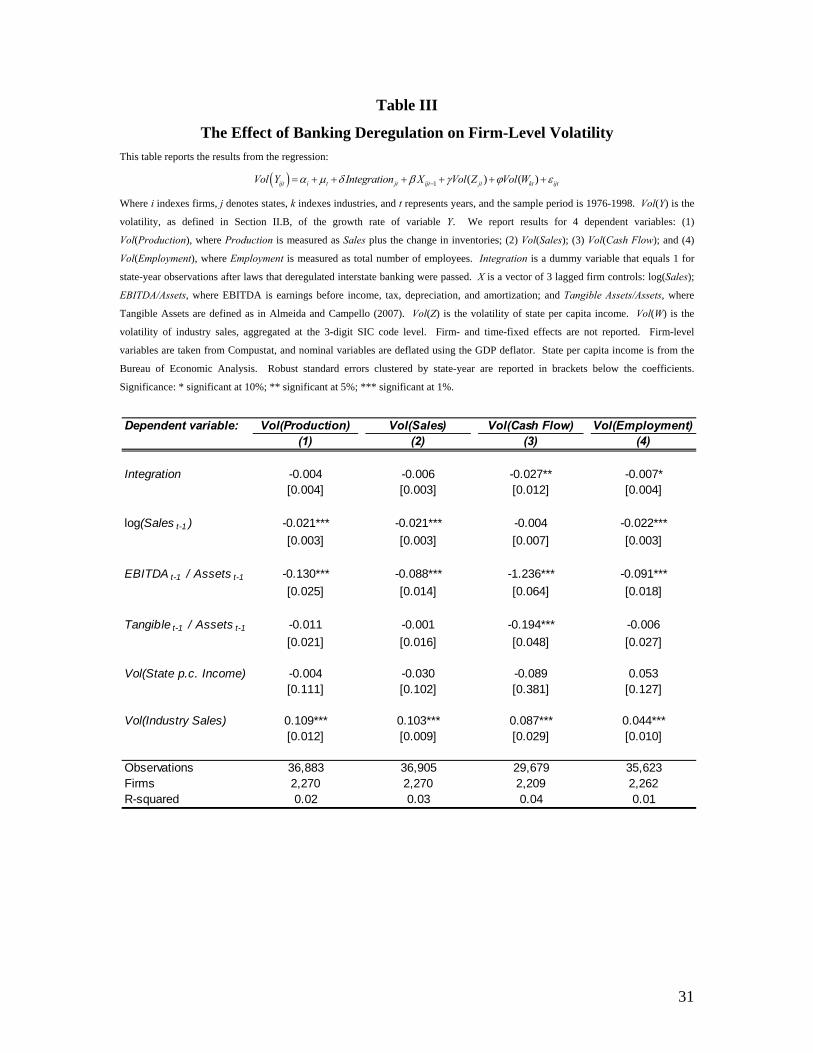
III presents the results of estimating equation (2) with the volatility of production, sales,
cash flow, and employment as dependent variables. The coefficient on Integration is
negative in all columns and statistically significant in the estimations for the volatility of
cash flow and employment. To illustrate the economic magnitudes involved: after
deregulation, the volatility of cash flow decreases by roughly 14 percent of the median
volatility of cash flow in the sample. These results signal a sizeable decrease in volatility
after out-of-state banks were permitted to enter local markets.
15
[Table III]
The findings in Table III also suggest that smaller and less profitable firms tend to be
more volatile. Firm-specific volatility is not significantly correlated with state-level
fluctuations. By contrast, industry-wide fluctuations appear to be an important
component of firm volatility, as noted by the positive and significant coefficient on
Vol(Industry Sales).
The results in this section are consistent with those in Morgan, Rime, and Strahan
(2004), who find a decrease in the volatility of the growth of state-level employment due
to banking deregulation. This decrease in volatility is associated with bank geographical
diversification, and, therefore, less vulnerability to state-specific shocks. In the following
sections, we study the mechanism that triggers the reduction in volatility at the firm level.
But first we establish if bank-dependent firms are the ones that benefited the most from
banking deregulation.
B. Firm Volatility and Bank Dependence
Small firms and firms without access to public debt markets are more likely to use
bank credit to finance their operations. In the next set of tests, we compare the volatility
of bank-dependent firms with the volatility of firms with access to other sources of
finance, before and after the state deregulation of bank entry. These estimations allow us
to control for changes in firm volatility within a state that are unrelated to decreases in
out-of-state bank entry restrictions. Formally, we test whether volatility for bank-
dependent firms decreased by more after interstate banking deregulation.
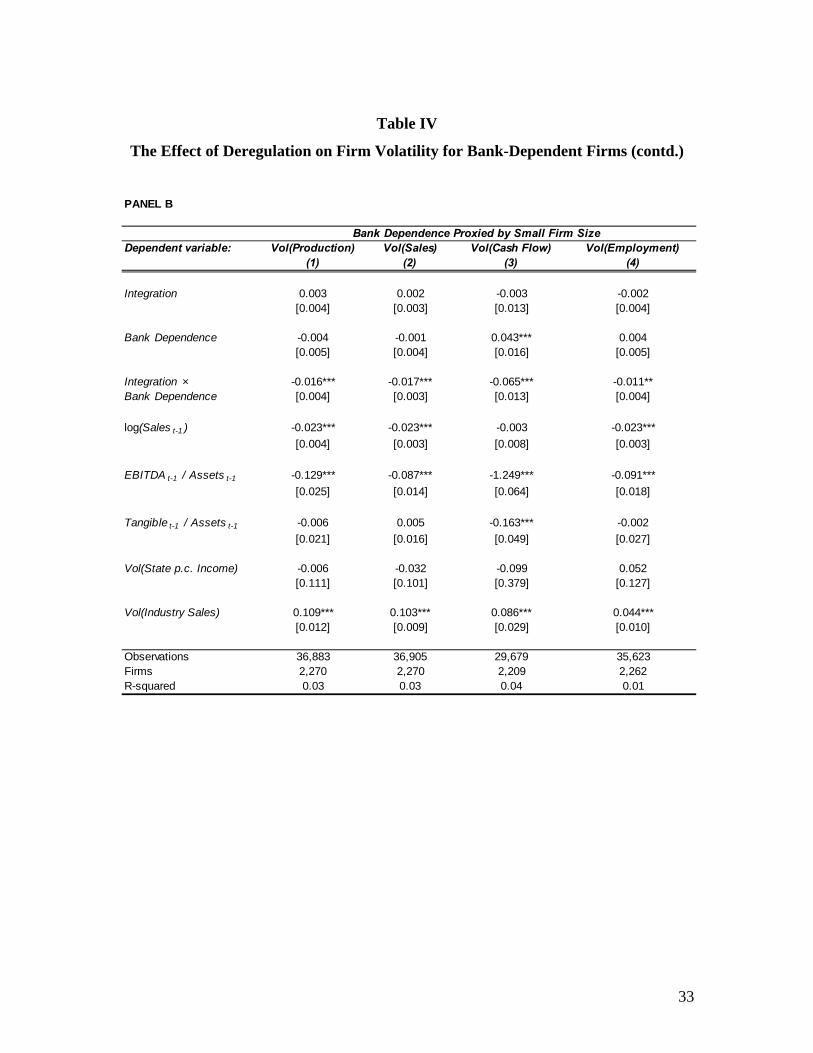
Table IV reports the results of estimating equation (3). In the regressions in Panel A,
bank dependence is measured as lack of access to public debt markets, while, in Panel B,
bank dependence is proxied by small firm size.19 The coefficient on the interaction
between bank dependence and the deregulation dummy is negative and significant in all
specifications. This finding reflects the importance of deregulation on the observed
decrease in volatility for the sample of bank-dependent firms. Bank deregulation makes
19 Since the external finance proxy for debt issues and ratings is time-invariant, it drops from estimating equation (3) using firm-fixed effects.
16
bank-dependent firms more stable, but does not significantly alter the volatility of those
firms that have ample access to non-bank sources of funding. The results in Table IV
suggest that the effect of bank deregulation on firm volatility operates through direct
relationship between firms and banks.
[Table IV]
The differential effect of deregulation on bank-dependent firms is substantial in most
specifications, but it is particularly sizeable for cash-flow volatility. After deregulation,
the reduction in the volatility of cash flow for small firms or for firms without access to
public debt markets is about 27 percent relative to the median volatility of firm cash flow
in the sample. The magnitude of the decrease in volatility of bank-dependent firms is
somewhat smaller but still substantial when considering production, sales, and
employment. As discussed by Booth and Cleary (2008), firms with more volatile cash
flows hold larger amounts of financial slack to finance their investment. Lower volatility
of output and cash flow and better access to external finance should decrease the need for
cash holdings and increase their profitability.
The results outlined in this section confirm the significant effect of bank entry
deregulation on the volatility of bank-dependent firms. After checking the robustness of
our main results to different specifications, sample restrictions, and controls in the next
section, we will assess whether the reduction in firm volatility is explained by a decrease
in the pro-cyclicality of bank credit.
C. Robustness Checks
This section tests the sensitivity of our basic results in equations (2) and (3) to
different specifications. In particular, Table V considers alternative volatility and
deregulation measures, different sample selection criteria, and additional control
variables. For the sake of compactness, Table V only reports the coefficients on the
interstate deregulation dummy and its interaction with the bank dependence proxy (as
measured by the firm’s access to commercial paper and bond markets).20
20 Results are very similar when we measure bank-dependence using a proxy related to firm size.
17
[Table V]
Panels A and B of Table V consider volatility measures alternative to the one
defined in equation (1). Panel A reports estimates of regressions (2) and (3) computing
the volatility of a generic variable Yijt as squared (instead of absolute) deviations of the
variable from its conditional mean. Using the notation of equation (1), we use 2ˆijt
instead of ˆijt . Panel A suggests that giving a heavier weight to larger deviations in
computing volatility does not affect qualitatively our basic results.
Panel B compares, for each firm, the five years before deregulation to the five years
after deregulation, collapsing all observations into two periods. The dependent variables
are the standard deviations of production, sales, cash flow, and employment in each
period. Similarly, control variables are included in the regression as period averages.
The results in Panel B show that the standard deviation of production, sales, and
employment is lower in the five-year period after deregulation with respect to the five-
year period after deregulation. The measure of volatility in Panel B is less noisy than the
one we use in our baseline regressions, but it also makes hard to distinguish a causal
effect of banking deregulation on firm volatility from an aggregate trend towards stability
over the sample period.
Panel C replaces the banking deregulation dummy with a continuous measure of
interstate banking integration: the share of deposits held by multi-state banks in each
state and year. We instrument this continuous variable using the banking deregulation
dummy. The results in Panel C indicate that firms become more stable when the fraction
of deposits held by multi-state banks increases for the state where firms are located. In
other words, actual integration of banks across states—the goal of deregulation—reduces
volatility in non-financial firms, particularly for bank-dependent firms. The results in
Panel C suggest that as the lending capacity of a state’s “financial system” becomes more
diversified through the participation of out-of-state banks, firms located in the state
become more stable.
Panels D and E explore alternative sample selection criteria for regressions (2) and

18
(3). Some states deregulated intrastate banking around the same time they deregulated
interstate banking. In order to isolate the effect interstate deregulation, Panel D excludes
observations in states where intrastate banking was deregulated within a year of interstate
bank-entry deregulation. Excluding these observations reduces the sample by about a
sixth. Panel E exclude observations from the two states with the highest number of firms,
California and New York, which account for about a quarter of the sample. The baseline
results are insensitive to applying the more restrictive selection criteria of Panels D and
E.
Panel F includes all available firm-year observations, unlike our baseline
regressions, which include only firms with non-missing observations two years before
and two years after deregulation. The results in Panel F are very similar to our baseline
results. Hence, our finding that bank-dependent firms become more stable after
deregulation is dominated by the decrease in volatility for surviving firms, leaving only a
relatively small role for differences in across firms that entered after deregulation and
those that exited before deregulation.
Panels G and H expand the set of control variables of the baseline regressions. In
Panel G, we add a proxy for banking concentration to the right-hand side of equations (2)
and (3). We measure banking concentration using the Herfindahl-Hirshman index of
demand deposits by state. Panel H considers a larger set of firm-control variables. First,
it includes leverage as measured by total debt scaled by assets. Second, it substitutes firm
age, measured as time from IPO, for log sales. (Age and log-sales are not included
simultaneously, as they are highly correlated.) The results from panel H suggest that the
reduction in volatility after deregulation in previous sections is not explained by firms
becoming more stable as they mature. Furthermore, in results not reported here, we
estimate equations (2) and (3) replacing the actual banking deregulation dummy with a
“placebo” deregulation dummy, constructed as an indicator that equals one starting two
and four years after the actual deregulation took place in each state. We find that the
effect of this “placebo” banking deregulation on the volatility of bank-dependent firms is
not statistically significant.
The results summarized in Table V suggest that our main findings are robust to
different volatility and deregulation measures, to alternative sample selection criteria, and

19
to the inclusion of additional controls. In practically all regressions reported in Table V,
the interaction between the interstate deregulation dummy and the bank dependence
proxy is negative and significant. This evidence suggests that firms that are more likely
to rely on bank credit tend to be more stable, on average, after interstate banking
deregulation.21
D. Cyclicality of Short-Term Borrowing
In this section we explore the channel that leads to the decrease in real volatility for
our sample of publicly-traded firms. As Larrain (2006) points out, lower volatility has to
be accompanied by increased countercyclical borrowing. As banks become more
geographically diversified through deregulation, the correlation between bank capital and
economic growth at the state level decreases (Morgan, Rime, and Strahan (2004)).
Therefore, firms exploit bank credit to buffer from negative shocks.
We test the link between deregulation and firm volatility by checking the cyclicality
of short-term borrowing. Table VI summarizes the results of estimating equation (4)
using notes payable as the measure for short-term borrowing. Column (1) shows that
notes payable is pro-cyclical on average. The coefficient on the interaction between the
cyclicality variables and the deregulation dummy is negative but statistically
insignificant. As expected, more profitable firms and with larger shares of tangible assets
have higher borrowing growth rates.
[Table VI]
Columns (2) and (3) add proxies for bank dependence: public debt access and size. In
both columns, the coefficient on the triple interaction between cyclicality, bank-
dependence, and deregulation is negative and significant. Hence, short-term borrowing
for small firms becomes less pro-cyclical after deregulation. The same pattern is
observed for firms that do not use bonds or commercial paper to finance their operation.
21 In other results not reported here, we replace for each state the actual deregulation date with a randomly generated date. The bank integration proxy and its interaction with the bank dependence measure become not significant.
20
This result is consistent with the decrease in the volatility of firm output and short-term
credit described above. Geographically diversified banks are likely able to buffer firms
from state-specific shocks by smoothing the credit they provide over the cycle.
E. Stock Return Volatility
In previous sections, we determined that output and cash flow volatility decreased
after banking deregulation, especially for bank-dependent firms. This effect was
accompanied by a reduction in the pro-cyclicality of credit. Based on our previous
findings, we expect that lower volatility in real and financial variables after deregulation
translates into less volatile stock returns. To test this hypothesis, we estimate the
following equation:
1
ijt i t jt ijt
jt ijt ijt ijt
Vol R Integration Bank Dependence
Integration Bank Dependence X
(6)
where Vol(Rijt) is the standard deviation of idiosyncratic returns as defined in Section
II.B. Our focus is on , the coefficient on the interaction between access to external
finance and banking deregulation.
Table VII presents the result of estimating equation (6). The dependent variable in
columns (1) through (3) is a measure of idiosyncratic stock return volatility computed as
the standard deviations of excess returns on the firm stock (over the market return). The
dependent variable in columns (4) through (6) measures idiosyncratic stock return
volatility as the standard deviations of the residuals after estimating the market model for
each firm. Idiosyncratic volatility in columns (7) through (8) is derived by adding the
size and value factors from Fama and French, and the momentum factor from Jegadeesh
and Titman (1993).
[Table VII]
In columns (1), (4), and (7) the coefficient on the deregulation indicator is negative
but not statistically significant. On average, the decrease in idiosyncratic return volatility

21
is minimal. On the contrary, if we focus on bank-dependent firms, we find a considerable
decrease in idiosyncratic return volatility after deregulation. These findings confirm the
results in Pastor and Veronesi (2003) in a dynamic setting. As uncertainty about bank-
dependent firms’ future profitability decreases due to better access to external financing,
stock return volatility for these firms also declines. In sum, the financing environment
has a significant effect on a firm’s real and financial volatility.
IV. Conclusion
The empirical methodology of this paper exploits the staggered timing of state
deregulation of interstate banking in the United States in the 1980s and early 1990s. In
previous decades, bank acquisition activity across state lines was generally very
restricted. Deregulation of interstate banking promoted integration of state banking
markets and enhanced banking competition. Part of the initial benefits of deregulation
accrued to firms that relied on banks for funding, by improving the terms in which they
were able to access banking finance. For example, Jayaratne and Strahan (1998), Dick
(2006), and Rice and Strahan (2009) find that loan prices and spreads decrease after
banking deregulation.
In our first set of results, we find that firms located in states that experienced
interstate banking deregulation become more stable after deregulation. In particular, the
growth rates of sales, production, cash flow, and employment become more stable for
firms located in states that opened to interstate banking. Since the effect is stronger for
those firms that depend on banks for external finance (because they are either small or
have no credit ratings or issues), the stabilization is likely to be explained by the changes
in the banking system induced by deregulation. When we exclude the proxies for bank
dependence, the control group is the set of firms located in states that are yet to pass
deregulation laws. When we include the proxies for bank dependence, we refine our
control group to those firms that depend less on banks, because they can access external
finance through public markets.
Our second set of results suggests that the stabilizing effects of banking deregulation
are connected to the ability of firms to exploit credit to smooth out idiosyncratic shocks.
In particular, short-term credit becomes more countercyclical after deregulation. Firms
22
may benefit from stability by smoothing investment when external financing is costly
(Froot, Scharfstein, and Stein (1993)), reducing expected costs of financial distress, and
lowering expected tax liabilities (Smith and Stulz (1985)). The concern for stability may
be more pronounced for publicly traded firms, as Rountree, Weston, and Allayanis
(2008) find that cash-flow volatility is negatively valued by investors.
In our third set of results, using a multifactor model of stock returns, we find that the
idiosyncratic component of stock return volatility falls after deregulation. This finding
suggests that the increased stability in operations (employment and production) and
financial statements (cash flows) after deregulation translates into greater stock market
stability. A reduction in idiosyncratic volatility may have an important impact on returns,
because higher idiosyncratic volatility is associated with lower average returns (Ang et al.
(2006a) and (2006b)).
Interpreting bank integration as a proxy for wider access to bank finance, the
findings of this paper bridge two sets of results arguing that banking finance may have a
stabilizing effect on the corporate sector. On the one hand, Larrain (2006) and Raddatz
(2006) argue that industries that depend on banks are more stable in countries with more
developed banking systems. On the other hand, Morgan, Rime, and Strahan (2004) show
that banking deregulation had a stabilizing effect on state-level business cycles in the
United States. Similar to Morgan, Rime, and Strahan (2004), we exploit interstate
banking deregulation in the United States during the 1980s and early 1990s. This quasi-
experiment addresses some potential concerns of using cross-country data. Similar to
Larrain (2006) and Raddatz (2006), we exploit cross-sectional differences in the intensity
of banking dependence. Unlike Larrain (2006), Raddatz (2006), and Morgan, Rime, and
Strahan (2004), we are able to study the effect of banking development on individual
stock returns, because we focus on firm-level data.
Recent research suggests that the reduction in macroeconomic volatility (the “Great
Moderation” documented, for example, by McConnell and Perez-Quiroz (2000) and
Stock and Watson (2002)) occurred despite an increase in volatility for publicly-traded
firms over the second half of the 20th century.22 Our results do not run against the long-
22 In contrast to the publicly-traded firms’ evidence, Davies et al. (2006), find a 23 percent decrease in employment growth volatility for privately held firms between 1978 and 2001.

23
term increase in firm-level volatility documented by Campbell et al. (2001), Comin and
Philippon (2005), and Comin and Mulani (2006). In fact, the upward trend in volatility
of those papers is temporarily halted or even reversed during the deregulation years we
study in this paper. Our results do suggest, however, that the increase in firm volatility
may have been steeper without interstate banking deregulation. In other words, firm-
level volatility has increased despite of—not because of—banking deregulation.
Naturally, the link between firm-level volatility and aggregate volatility deserves further
attention.23
In our paper, the stabilizing effects of interstate banking deregulation were obtained
starting from a situation where banking markets were highly fragmented across states.
For those initial conditions, interstate banking deregulation likely generated efficiency
gains that improved access to banking finance for the corporate sector. A deregulatory
experiment starting from different conditions may not produce the same effects we find
in this paper. Similarly, other forms of deregulation may trigger a different response on
banks and, thus, on nonfinancial firms.
While the development of some financial institutions, like banks, may promote
stability in the corporate sector, the development of other institutions, like equity
markets, may have different effects. For example, Thesmar and Thoenig (2009) use a
theoretical model to study the effect of international capital integration on the volatility of
publicly-traded and privately-held firms. Similarly, using a panel of countries, Bekaert,
Harvey, and Lundblad (2006) show that macroeconomic volatility falls after equity
market liberalizations. Understanding the role of different institutions and their
interaction is an interesting area for further research.24
23 This paper complements existing evidence on the link between financial markets and financial innovation, on the one hand, and volatility, on the other. In the case of the United States, for example, Dynan, Elmendorf, and Sichel (2006) argue that financial innovation may help explain the stabilization of economic activity in the mid 1980s. An interesting avenue for exploration consists of studying the interaction between banking deregulation and financial innovation (in the form of more efficient pricing of risk, for example). 24 See, for example, Acemoglu et al. (2003).
24
References
Acemoglu, Daron, Simon Johnson, James A. Robinson, and Yunyong Thaicharoen, 2003,
Institutional causes, macroeconomic symptoms: Volatility, crises, and growth,
Journal of Monetary Economics 50, 49-123.
Aghion, Philippe, George-Marios Angeletos, Abhijit Banerjee, and Kalina Manova,
2005, Volatility and growth: Financial development and the cyclical composition of
investment, NBER Working paper No. 11349.
Almeida, Heitor, and Murillo Campello, 2007, Financial constraints, asset tangibility, and
corporate investment, Review of Financial Studies 20, 1429-1429.
Almeida, Heitor, Murillo Campello, and Michael S. Weisbach, 2004, The cash flow
sensitivity of cash, Journal of Finance 59, 1777-1804.
Ang, Andrew, Robert J. Hodrick, Yuhang Xing, and Xiaoyan Zhang, 2006a, The cross-
section of volatility and expected returns, Journal of Finance 61, 259-299.
Ang, Andrew, Robert J. Hodrick, Yuhang Xing, and Xiaoyan Zhang, 2006b, High
idiosyncratic volatility and low returns: International and further U.S. Evidence,
Mimeo, Columbia University.
Bekaert, Geert, Campbell R. Harvey, and Christian Lundblad, 2006, Growth volatility
and financial liberalization, Journal of International Money and Finance 25, 370-403.
Booth, Laurence, and Sean Cleary, 2008, Cash flow volatility, financial slack, and
investment decisions, China Finance Review 2, 63-86.
Calomiris, Charles W., Charles P. Himmelberg, and Paul Wachtel, 1995, Commercial
paper, corporate finance, and business cycle: A microeconomic perspective,
Carnegie-Rochester Series on Public Policy 42, 203-250.
Campbell, John Y., Martin Lettau, Burton G. Malkiel, and Yexiao Xu, 2001, Have
individual stock returns become more volatile? An empirical exploration of
idiosyncratic risk, Journal of Finance 56, 1-43.
Comin, Diego, and Sunil Mulani, 2006, Diverging trends in aggregate and firm volatility,
Review of Economics and Statistics 88, 374-383.
Comin, Diego, and Thomas Philippon, 2005, The rise in firm-level volatility: Causes and
consequences, in Mark Gertler and Kenneth Rogoff, eds.: NBER Macroeconomics

25
Annual (MIT Press, Cambridge, MA).
Correa, Ricardo, 2007, Bank integration and financial constraints: Evidence from U.S.
firms, Working paper, Board of Governors of the Federal Reserve System.
Davies, Steven J., John Haltiwanger, Ron Jarmin, and Javier Miranda, 2006, Volatility
and dispersion in business growth rates: Publicly traded versus privately held firms,
in Daron Acemoglu, Kenneth Rogoff, and Michael Woodford, eds.: NBER
Macroeconomics Annual (MIT Press, Cambridge, MA).
Demyanyk, Yuliya, Charlotte Ostergaard, and Bent E. Sorensen, 2007, U.S. banking
deregulation, small business, and interstate insurance of personal income, Journal of
Finance 62, 2763-2801.
Dick, Astrid A., 2006, Nationwide branching and its impact on market structure, quality,
and bank performance, Journal of Business 79, 567-592.
Dynan, Karen E., Douglas W. Elmendorf, and Daniel E. Sichel, 2006, Can financial
innovation help to explain the reduced volatility of economic activity? Journal of
Monetary Economics 53, 123-150.
Fama, Eugene F., and Kenneth R. French, 1993, Common risk factors in the returns on
stocks and bonds, Journal of Financial Economics 33, 3-56.
Froot, Kenneth A., David S. Scharfstein, and Jeremy C. Stein, 1993, Risk Management:
Coordinating corporate investment and financing policies, Journal of Finance 48,
1629-1658.
Gilchrist, Simon, and Charles Himmelberg, 1995, Evidence on the role of cash flow for
investment, Journal of Monetary Economics 36, 541-572.
Huang, Rocco, 2008, Evaluating the real effect of bank branching deregulation:
Comparing contiguous counties across US state borders, Journal of Financial
Economics 87, 678-705.
Jayaratne, Jith, and Philip E. Strahan, 1996, The finance-growth nexus: Evidence from
bank branch deregulation, Quarterly Journal of Economics 111, 639–670.
Jayaratne, Jith, and Philip E. Strahan, 1998, Entry restrictions, industry evolution, and
dynamic efficiency: Evidence from commercial banking, Journal of Law and
Economics 41, 239-274.
Jegadeesh, Narasimhan, and Shreidan Titman, 1993, Returns to buying winners and

26
selling losers: Implications for stock market efficiency, Journal of Finance 48, 65-
92.
Kashyap, Anil, Owen Lamont, and Jeremy C. Stein, 1994, Credit conditions and the
cyclical behavior of inventories, Quarterly Journal of Economics 109, 565-592.
Krozner, Randall S., Luc Laeven, and Daniela Klingebiel, 2007, Banking crises, financial
dependence, and growth, Journal of Financial Economics 84, 187-228.
Larrain, Borja, 2006, Do banks affect the level and composition of industrial volatility?
Journal of Finance 61, 1897-1925.
Levine, Ross, 2005, Finance and growth: Theory and evidence, in Philippe Aghion and
Steven N. Durlauf, eds.: Handbook of Economic Growth, Vol. 1A (Elsevier,
Amsterdam).
McConnell, Margaret M., and Gabriel Perez-Quiros, 2000, Output fluctuations in the
United States: What has changed since the early 1980s? American Economic Review
90, 1464-1476.
Morgan, Donald P., Bertrand Rime, Philip E. Strahan, 2004, Bank integration and state
business cycles, Quarterly Journal of Economics 119, 1555-1584.
Pastor, Lubos, and Pietro Veronesi, 2003, Stock valuation and learning about
profitability, Journal of Finance 58, 1749-1789.
Raddatz, Claudio, 2006, Liquidity needs and vulnerability to financial underdevelopment,
Journal of Financial Economics 80, 677-722.
Rajan, Raghuram G., and Luigi Zingales, 1995, What do we know about capital
structure? Some evidence from international data, Journal of Finance 50, 1421-1460.
Rajan, Raghuram G., and Luigi Zingales, 1998, Finance dependence and growth,
American Economic Review 88, 559-586.
Ramey, Garey, and Valerie A. Ramey, 1995, Cross-country evidence on the link between
volatility and growth, American Economic Review 85, 1138-1151.
Rice, Tara, and Philip E. Strahan, 2009, Does credit competition affect small-firm
finance? Journal of Finance, forthcoming.
Rountree, Brian, James P. Weston, and George Allayannis, 2008, Do investors value
smooth performance? Journal of Financial Economics 90, 237-251.
Smith, Clifford W., and René Stulz, 1985, The determinants of firms’ hedging policies,

27
Journal of Financial and Quantitative Analysis 20, 391-405.
Stebunovs, Viktors, 2006, Finance as a barrier to entry: U.S. bank deregulation and
volatility, Working paper, Boston College.
Stock, James H., and Mark W. Watson, 2002, Has the business cycle changed and why?
in Mark Gertler and Kenneth Rogoff, eds.: NBER Macroeconomics Annual 2002
(MIT Press, Cambridge, MA).
Stulz, René, 1990, Managerial discretion and optimal financing policies, Journal of
Financial Economics 32, 263-292.
Strahan, Philip E., 2003, The real effects of U.S. banking deregulation, Federal Reserve
Bank of St. Louis Review 85, 111-128.
Thesmar, David, and Mathias Thoenig, 2009, Contrasting trends in firm volatility:
Theory and evidence, Working paper, CEPR.
28
Appendix 1: Dates of Deregulation of Interstate Bank Entry by State
State Year State Year
ALASKA 1982 MONTANA 1993
ALABAMA 1987 NORTH CAROLINA 1985
ARKANSAS 1989 NORTH DAKOTA 1991
ARIZONA 1986 NEBRASKA 1990
CALIFORNIA 1987 NEW HAMPSHIRE 1987
COLORADO 1988 NEW JERSEY 1986
CONNECTICUT 1983 NEW MEXICO 1989
DISTRICT OF COLUMBIA 1985 NEVADA 1985
DELAWARE 1988 NEW YORK 1982
FLORIDA 1985 OHIO 1985
GEORGIA 1985 OKLAHOMA 1987
HAWAII 1995 OREGON 1986
IOWA 1991 PENNSYLVANIA 1986
IDAHO 1985 RHODE ISLAND 1984
ILLINOIS 1986 SOUTH CAROLINA 1986
INDIANA 1986 SOUTH DAKOTA 1988
KANSAS 1992 TENNESSEE 1985
KENTUCKY 1984 TEXAS 1987
LOUISIANA 1987 UTAH 1984
MASSACHUSETTS 1983 VIRGINIA 1985
MARYLAND 1985 VERMONT 1988
MAINE 1978 WASHINGTON 1987
MICHIGAN 1986 WISCONSIN 1987
MINNESOTA 1986 WEST VIRGINIA 1988
MISSOURI 1986 WYOMING 1987
MISSISSIPPI 1988

29
Table I
Firm Distribution across States
The sample includes annual observations between 1976 and 1998 of Compustat firms classified in the manufacturing (SIC codes 2000
to 3999), wholesale (SIC codes 5000 to 5199), and retail trade (SIC codes 5200 to 5999) sectors. We consider only firms with non-
missing information 2 years prior and 2 years after deregulation of interstate bank entry in the state where firms are headquartered.
StateNumber of
firmsPct. of total
firmsNumber of
observationsPct. of total
observations
Average years per
firm
ALABAMA 13 0.6% 239 0.6% 18.4
ARKANSAS 8 0.4% 155 0.4% 19.4
ARIZONA 18 0.8% 284 0.7% 15.8
CALIFORNIA 312 13.7% 5,011 12.6% 16.1
COLORADO 41 1.8% 664 1.7% 16.2
CONNECTICUT 96 4.2% 1,585 4.0% 16.5
DISTRICT OF COLUMBIA 2 0.1% 46 0.1% 23.0
FLORIDA 84 3.7% 1,467 3.7% 17.5
GEORGIA 35 1.5% 661 1.7% 18.9
IOWA 14 0.6% 288 0.7% 20.6
IDAHO 3 0.1% 69 0.2% 23.0
ILLINOIS 137 6.0% 2,575 6.5% 18.8
INDIANA 42 1.8% 785 2.0% 18.7
KANSAS 13 0.6% 210 0.5% 16.2
KENTUCKY 12 0.5% 180 0.5% 15.0
LOUISIANA 8 0.4% 144 0.4% 18.0
MASSACHUSETTS 106 4.7% 1,809 4.6% 17.1
MARYLAND 34 1.5% 547 1.4% 16.1
MAINE 4 0.2% 59 0.1% 14.8
MICHIGAN 76 3.3% 1,449 3.7% 19.1
MINNESOTA 87 3.8% 1,574 4.0% 18.1
MISSOURI 46 2.0% 874 2.2% 19.0
MISSISSIPPI 2 0.1% 46 0.1% 23.0
MONTANA 1 0.0% 17 0.0% 17.0
NORTH CAROLINA 46 2.0% 845 2.1% 18.4
NEBRASKA 5 0.2% 98 0.2% 19.6
NEW HAMPSHIRE 9 0.4% 144 0.4% 16.0
NEW JERSEY 139 6.1% 2,379 6.0% 17.1
NEW MEXICO 2 0.1% 28 0.1% 14.0
NEVADA 5 0.2% 35 0.1% 7.0
NEW YORK 315 13.9% 5,104 12.9% 16.2
OHIO 122 5.4% 2,294 5.8% 18.8
OKLAHOMA 13 0.6% 244 0.6% 18.8
OREGON 15 0.7% 279 0.7% 18.6
PENNSYLVANIA 108 4.8% 2,065 5.2% 19.1
RHODE ISLAND 11 0.5% 183 0.5% 16.6
SOUTH CAROLINA 10 0.4% 179 0.5% 17.9
TENNESSEE 20 0.9% 380 1.0% 19.0
TEXAS 125 5.5% 2,179 5.5% 17.4
UTAH 15 0.7% 232 0.6% 15.5
VIRGINIA 43 1.9% 819 2.1% 19.0
VERMONT 3 0.1% 47 0.1% 15.7
WASHINGTON 31 1.4% 538 1.4% 17.4
WISCONSIN 39 1.7% 785 2.0% 20.1
WEST VIRGINIA 1 0.0% 15 0.0% 15.0
WYOMING 1 0.0% 14 0.0% 14.0
Total 2,272 39,624 17.4
30
Table II
Summary Statistics: Volatility and Access to External Finance
Panel A summarizes the properties of the firm-level volatility measures over the sample period, 1976-1998. Vol( Y ) represents the
volatility of Y as defined in Section II.B. Production is measured as Sales plus the change in inventories, and Employment is
measured as total number of employees. These variables are taken from Compustat, and nominal variables are deflated using the GDP
deflator. R0 are firm-level excess returns over the Treasury Bill. R1 is the residual of running a market-model regression of firm-level
monthly excess returns on the excess return on the market portfolio and an intercept. R2 is the residual obtained by expanding the
market-model regression to include the size and value factors of Fama and French (1993) and the momentum factor of Jegadeesh and
Titman (1993). Data on returns and factors are taken from CRSP and Kenneth French’s Data Library at Dartmouth. Panel B
summarizes firm-level proxies for Bank Dependence. The size-based measure of bank dependence equals 1 for firm-year observations
when the firm assets are below the state-year median and 0 otherwise. The rating-issues-based measure equals 1 for firms that did not
issue bonds or commercial paper and did not have credit ratings from 1970 to 1994. Data on bond and commercial paper issues are
from Mergent Fixed Income Security Database and Moody’s DRS. Ratings are taken from S&P as reported in Compustat.
Panel A
Observations Mean MedianStandard Deviation
Vol (Production) 36,883 0.152 0.092 0.198Vol (Sales) 36,905 0.132 0.081 0.159Vol (Cash Flow) 29,679 0.353 0.196 0.489Vol (Employment) 35,623 0.134 0.077 0.196
Vol(R 0 ) 28,270 0.119 0.104 0.070
Vol(R 1 ) 28,270 0.107 0.091 0.069
Vol(R 2 ) 28,270 0.103 0.087 0.066
Panel B
Observations Percentage Observations Percentage
Not Dependent on Bank 22,960 57.9% 14,849 37.5%Finance
Dependent on Bank 16,664 42.1% 24,775 62.5%Finance
Bank Dependence Proxied by Small Firm Size
Bank Dependence Proxied by No Debt Issues and
Ratings
31
Table III
The Effect of Banking Deregulation on Firm-Level Volatility
This table reports the results from the regression:
1 ( ) ( )ijt i t jt ijt jt kt ijtVol Y Integration X Vol Z Vol W
Where i indexes firms, j denotes states, k indexes industries, and t represents years, and the sample period is 1976-1998. Vol(Y) is the
volatility, as defined in Section II.B, of the growth rate of variable Y. We report results for 4 dependent variables: (1)
Vol(Production), where Production is measured as Sales plus the change in inventories; (2) Vol(Sales); (3) Vol(Cash Flow); and (4)
Vol(Employment), where Employment is measured as total number of employees. Integration is a dummy variable that equals 1 for
state-year observations after laws that deregulated interstate banking were passed. X is a vector of 3 lagged firm controls: log(Sales);
EBITDA/Assets, where EBITDA is earnings before income, tax, depreciation, and amortization; and Tangible Assets/Assets, where
Tangible Assets are defined as in Almeida and Campello (2007). Vol(Z) is the volatility of state per capita income. Vol(W) is the
volatility of industry sales, aggregated at the 3-digit SIC code level. Firm- and time-fixed effects are not reported. Firm-level
variables are taken from Compustat, and nominal variables are deflated using the GDP deflator. State per capita income is from the
Bureau of Economic Analysis. Robust standard errors clustered by state-year are reported in brackets below the coefficients.
Significance: * significant at 10%; ** significant at 5%; *** significant at 1%.
Dependent variable: Vol(Production) Vol(Sales) Vol(Cash Flow) Vol(Employment)(1) (2) (3) (4)
Integration -0.004 -0.006 -0.027** -0.007*[0.004] [0.003] [0.012] [0.004]
log(Sales t-1 ) -0.021*** -0.021*** -0.004 -0.022***
[0.003] [0.003] [0.007] [0.003]
EBITDA t-1 / Assets t-1 -0.130*** -0.088*** -1.236*** -0.091***
[0.025] [0.014] [0.064] [0.018]
Tangible t-1 / Assets t-1 -0.011 -0.001 -0.194*** -0.006
[0.021] [0.016] [0.048] [0.027]
Vol(State p.c. Income) -0.004 -0.030 -0.089 0.053[0.111] [0.102] [0.381] [0.127]
Vol(Industry Sales) 0.109*** 0.103*** 0.087*** 0.044***[0.012] [0.009] [0.029] [0.010]
Observations 36,883 36,905 29,679 35,623Firms 2,270 2,270 2,209 2,262R-squared 0.02 0.03 0.04 0.01

32
Table IV
The Effect of Deregulation on Firm Volatility for Bank-Dependent Firms
This table reports the results from the regression:
1 ( ) ( )ijt i t jt ijt jt ijt ijt jt kt ijtVol Y Integration Bank Dependence Integration Bank Dependence X Vol Z Vol W
Where i indexes firms, j denotes states, k indexes industries, and t denotes years, and the sample period is 1976-1998. Vol(Y) is the
volatility, as defined in Section II.B, of the growth rate of a generic variable Y. We report results for 4 dependent variables: (1)
Vol(Production), where Production is measured as Sales plus the change in inventories; (2) Vol(Sales); (3) Vol(Cash Flow); and (4)
Vol(Employment), where Employment is measured as total number of employees. Integration is a dummy variable that equals 1 for
state-year observations after laws that deregulated interstate banking were passed. In Panel A, Bank Dependence equals 1 for firm-
year observations when the firm assets are below the state-year median and 0 otherwise. In Panel B, Bank Dependence equals 1 for
firms that did not issue bonds or commercial paper and did not have credit ratings from 1970 to 1994. X represents lagged firm
controls: log(Sales); EBITDA/Assets and Tangible Assets/Assets. Vol(Z) is the volatility of state per capita income. Vol(W) is the
volatility of industry sales, aggregated at the 3-digit SIC code level. Firm- and time-fixed effects are not reported. Firm-level
variables are taken from Compustat, except for bond and commercial paper issues, which are from FISD and Moody’s DRS. State per
capita income is from the Bureau of Economic Analysis. Nominal variables are deflated using the GDP deflator. Robust standard
errors clustered by state-year are reported in brackets below the coefficients. Significance: * significant at 10%; ** significant at 5%;
*** significant at 1%.
PANEL A
Dependent variable: Vol(Production) Vol(Sales) Vol(Cash Flow) Vol(Employment)(1) (2) (3) (4)
Integration 0.004 0.003 0.016 0.002[0.005] [0.004] [0.013] [0.005]
Bank Dependence - - - -
Integration × -0.013*** -0.013*** -0.069*** -0.013***Bank Dependence [0.004] [0.003] [0.011] [0.004]
log(Sales t-1 ) -0.021*** -0.021*** -0.006 -0.023***
[0.003] [0.003] [0.007] [0.003]
EBITDA t-1 / Assets t-1 -0.130*** -0.088*** -1.245*** -0.091***
[0.025] [0.014] [0.064] [0.018]
Tangible t-1 / Assets t-1 -0.007 0.004 -0.157*** -0.001
[0.021] [0.016] [0.050] [0.027]
Vol(State p.c. Income) 0.000 -0.026 -0.080 0.057[0.112] [0.102] [0.377] [0.128]
Vol(Industry Sales) 0.109*** 0.103*** 0.088*** 0.044***[0.012] [0.009] [0.029] [0.010]
Observations 36,883 36,905 29,679 35,623Firms 2,270 2,270 2,209 2,262R-squared 0.02 0.03 0.04 0.01
Bank Dependence Proxied by No Debt Issues and Ratings
33
Table IV
The Effect of Deregulation on Firm Volatility for Bank-Dependent Firms (contd.)
PANEL B
Dependent variable: Vol(Production) Vol(Sales) Vol(Cash Flow) Vol(Employment)(1) (2) (3) (4)
Integration 0.003 0.002 -0.003 -0.002[0.004] [0.003] [0.013] [0.004]
Bank Dependence -0.004 -0.001 0.043*** 0.004[0.005] [0.004] [0.016] [0.005]
Integration × -0.016*** -0.017*** -0.065*** -0.011**Bank Dependence [0.004] [0.003] [0.013] [0.004]
log(Sales t-1 ) -0.023*** -0.023*** -0.003 -0.023***
[0.004] [0.003] [0.008] [0.003]
EBITDA t-1 / Assets t-1 -0.129*** -0.087*** -1.249*** -0.091***
[0.025] [0.014] [0.064] [0.018]
Tangible t-1 / Assets t-1 -0.006 0.005 -0.163*** -0.002
[0.021] [0.016] [0.049] [0.027]
Vol(State p.c. Income) -0.006 -0.032 -0.099 0.052[0.111] [0.101] [0.379] [0.127]
Vol(Industry Sales) 0.109*** 0.103*** 0.086*** 0.044***[0.012] [0.009] [0.029] [0.010]
Observations 36,883 36,905 29,679 35,623Firms 2,270 2,270 2,209 2,262R-squared 0.03 0.03 0.04 0.01
Bank Dependence Proxied by Small Firm Size

34
Table V
Robustness Checks
This table reports the results from the following two regressions:
1 ( ) ( )ijt i t jt ijt jt kt ijtVol Y Integration X Vol Z Vol W
1 ( ) ( )ijt i t jt ijt jt ijt ijt jt kt ijtVol Y Integration Bank Dependence Integration Bank Dependence X Vol Z Vol W
Where i indexes firms, j denotes states, k indexes industries, and t denotes years, and the sample period is 1976-1998. Vol(Y) is the
volatility, as defined in Section II.B, of the growth rate of a generic variable Y. We report results for 4 dependent variables: (1)
Vol(Production), where Production is measured as Sales plus the change in inventories; (2) Vol(Sales); (3) Vol(Cash Flow); and (4)
Vol(Employment), where Employment is measured as total number of employees. αi denotes firm-fixed effects and μt denotes year-
fixed effects. All regressions include year-fixed effects, except for Panel B. Integration is a dummy variable that equals 1 for state-
year observations after laws that deregulated interstate banking were passed. Bank Dependence equals 1 for firms that did not issue
bonds or commercial paper and did not have credit ratings from 1970 to 1994. Data on debt issues are from FISD and Moody’s DRS.
X represents lagged firm controls: log(Sales); EBITDA/Assets and Tangible Assets/Assets. Vol(Z) is the volatility of state per capita
income. Vol(W) is the volatility of industry sales, aggregated at the 3-digit SIC code level. Firm-level variables are taken from
Compustat, except for bond and commercial paper issues, which are from FISD and Moody’s DRS. State per capita income is from
the Bureau of Economic Analysis. Nominal variables are deflated using the GDP deflator. Robust standard errors clustered by state-
year are reported in brackets below the coefficients. Significance: * significant at 10%; ** significant at 5%; *** significant at 1%.
Panel A - Dependent variable is volatility, measured by the squared value of deviations from the firm-level conditional mean
Dependent var.:(1) (2) (3) (4) (5) (6) (7) (8)
Integration 0.003 0.010 -0.005 0.003 -0.062* 0.002 -0.006 0.005[0.008] [0.008] [0.003] [0.003] [0.033] [0.037] [0.007] [0.010]
Integration × -0.011* -0.011*** -0.104*** -0.016*Bank Dependence [0.006] [0.003] [0.033] [0.010]
Observations 36,883 36,883 36,905 36,905 29,679 29,679 35,623 35,623Firms 2,270 2,270 2,270 2,270 2,209 2,209 2,262 2,262R-squared 0.01 0.01 0.02 0.02 0.02 0.02 0.00 0.00
Panel B - Dependent variable is volatility, measured as the standard deviation five years before and five yearsafter banking deregulation
Dependent var.:(1) (2) (3) (4) (5) (6) (7) (8)
Integration -0.007 0.005 -0.005 0.010* 0.051*** 0.048*** 0.004 0.015[0.007] [0.007] [0.006] [0.005] [0.013] [0.015] [0.007] [0.009]
Integration × -0.017*** -0.024*** 0.005 -0.017**Bank Dependence [0.006] [0.005] [0.023] [0.008]
Observations 2,929 2,929 2,929 2,929 2,649 2,649 2,868 2,868Firms 1,469 1,469 1,469 1,469 1,420 1,420 1,454 1,454R-squared 0.03 0.03 0.04 0.05 0.08 0.08 0.04 0.04
Vol(Cash Flow) Vol(Employment)Bank Dependence Proxied by No Debt Issues and Ratings
Vol(Production) Vol(Sales)
Bank Dependence Proxied by No Debt Issues and RatingsVol(Production) Vol(Sales) Vol(Cash Flow) Vol(Employment)
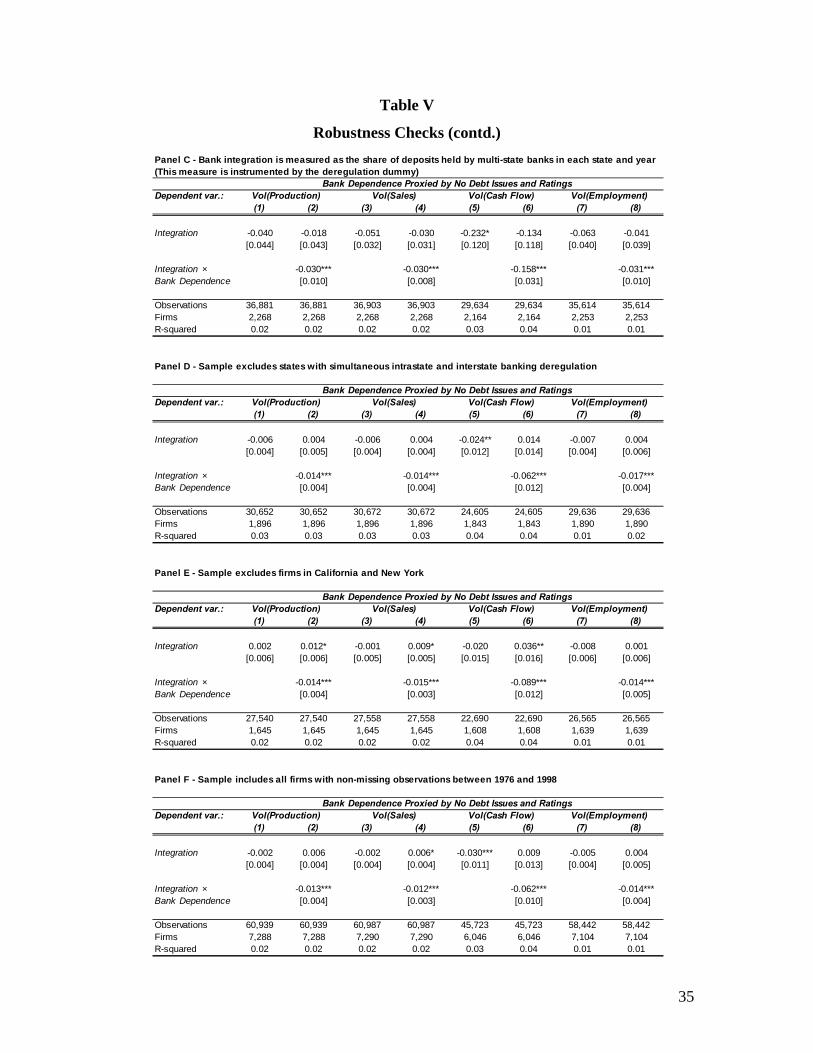
35
Table V
Robustness Checks (contd.)
Panel C - Bank integration is measured as the share of deposits held by multi-state banks in each state and year(This measure is instrumented by the deregulation dummy)
Dependent var.:(1) (2) (3) (4) (5) (6) (7) (8)
Integration -0.040 -0.018 -0.051 -0.030 -0.232* -0.134 -0.063 -0.041[0.044] [0.043] [0.032] [0.031] [0.120] [0.118] [0.040] [0.039]
Integration × -0.030*** -0.030*** -0.158*** -0.031***Bank Dependence [0.010] [0.008] [0.031] [0.010]
Observations 36,881 36,881 36,903 36,903 29,634 29,634 35,614 35,614Firms 2,268 2,268 2,268 2,268 2,164 2,164 2,253 2,253R-squared 0.02 0.02 0.02 0.02 0.03 0.04 0.01 0.01
Panel D - Sample excludes states with simultaneous intrastate and interstate banking deregulation
Dependent var.:(1) (2) (3) (4) (5) (6) (7) (8)
Integration -0.006 0.004 -0.006 0.004 -0.024** 0.014 -0.007 0.004[0.004] [0.005] [0.004] [0.004] [0.012] [0.014] [0.004] [0.006]
Integration × -0.014*** -0.014*** -0.062*** -0.017***Bank Dependence [0.004] [0.004] [0.012] [0.004]
Observations 30,652 30,652 30,672 30,672 24,605 24,605 29,636 29,636Firms 1,896 1,896 1,896 1,896 1,843 1,843 1,890 1,890R-squared 0.03 0.03 0.03 0.03 0.04 0.04 0.01 0.02
Panel E - Sample excludes firms in California and New York
Dependent var.:(1) (2) (3) (4) (5) (6) (7) (8)
Integration 0.002 0.012* -0.001 0.009* -0.020 0.036** -0.008 0.001[0.006] [0.006] [0.005] [0.005] [0.015] [0.016] [0.006] [0.006]
Integration × -0.014*** -0.015*** -0.089*** -0.014***Bank Dependence [0.004] [0.003] [0.012] [0.005]
Observations 27,540 27,540 27,558 27,558 22,690 22,690 26,565 26,565Firms 1,645 1,645 1,645 1,645 1,608 1,608 1,639 1,639R-squared 0.02 0.02 0.02 0.02 0.04 0.04 0.01 0.01
Panel F - Sample includes all firms with non-missing observations between 1976 and 1998
Dependent var.:(1) (2) (3) (4) (5) (6) (7) (8)
Integration -0.002 0.006 -0.002 0.006* -0.030*** 0.009 -0.005 0.004[0.004] [0.004] [0.004] [0.004] [0.011] [0.013] [0.004] [0.005]
Integration × -0.013*** -0.012*** -0.062*** -0.014***Bank Dependence [0.004] [0.003] [0.010] [0.004]
Observations 60,939 60,939 60,987 60,987 45,723 45,723 58,442 58,442Firms 7,288 7,288 7,290 7,290 6,046 6,046 7,104 7,104R-squared 0.02 0.02 0.02 0.02 0.03 0.04 0.01 0.01
Bank Dependence Proxied by No Debt Issues and RatingsVol(Production) Vol(Sales) Vol(Cash Flow) Vol(Employment)
Vol(Employment)
Bank Dependence Proxied by No Debt Issues and RatingsVol(Production) Vol(Sales) Vol(Cash Flow) Vol(Employment)
Bank Dependence Proxied by No Debt Issues and RatingsVol(Production) Vol(Sales) Vol(Cash Flow)
Bank Dependence Proxied by No Debt Issues and RatingsVol(Production) Vol(Sales) Vol(Cash Flow) Vol(Employment)
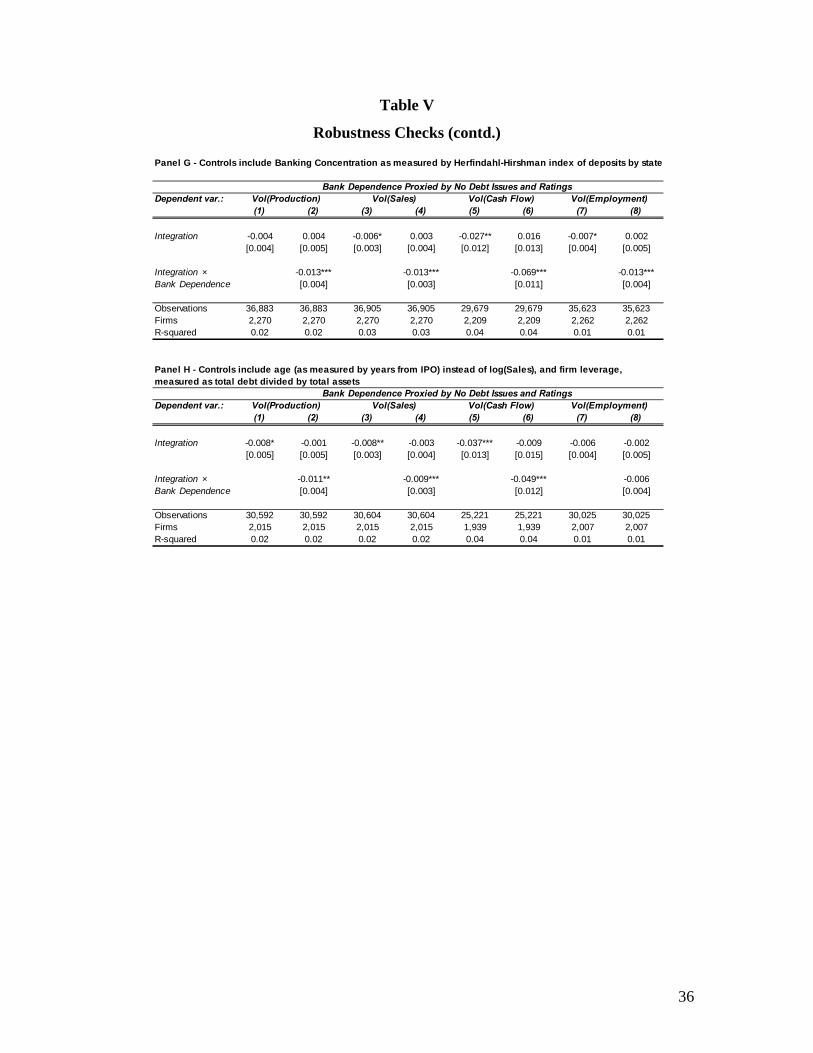
36
Table V
Robustness Checks (contd.)
Panel G - Controls include Banking Concentration as measured by Herfindahl-Hirshman index of deposits by state
Dependent var.:(1) (2) (3) (4) (5) (6) (7) (8)
Integration -0.004 0.004 -0.006* 0.003 -0.027** 0.016 -0.007* 0.002[0.004] [0.005] [0.003] [0.004] [0.012] [0.013] [0.004] [0.005]
Integration × -0.013*** -0.013*** -0.069*** -0.013***Bank Dependence [0.004] [0.003] [0.011] [0.004]
Observations 36,883 36,883 36,905 36,905 29,679 29,679 35,623 35,623Firms 2,270 2,270 2,270 2,270 2,209 2,209 2,262 2,262R-squared 0.02 0.02 0.03 0.03 0.04 0.04 0.01 0.01
Panel H - Controls include age (as measured by years from IPO) instead of log(Sales), and firm leverage,measured as total debt divided by total assets
Dependent var.:(1) (2) (3) (4) (5) (6) (7) (8)
Integration -0.008* -0.001 -0.008** -0.003 -0.037*** -0.009 -0.006 -0.002[0.005] [0.005] [0.003] [0.004] [0.013] [0.015] [0.004] [0.005]
Integration × -0.011** -0.009*** -0.049*** -0.006Bank Dependence [0.004] [0.003] [0.012] [0.004]
Observations 30,592 30,592 30,604 30,604 25,221 25,221 30,025 30,025Firms 2,015 2,015 2,015 2,015 1,939 1,939 2,007 2,007R-squared 0.02 0.02 0.02 0.02 0.04 0.04 0.01 0.01
Bank Dependence Proxied by No Debt Issues and RatingsVol(Production) Vol(Sales) Vol(Cash Flow) Vol(Employment)
Bank Dependence Proxied by No Debt Issues and RatingsVol(Production) Vol(Sales) Vol(Cash Flow) Vol(Employment)
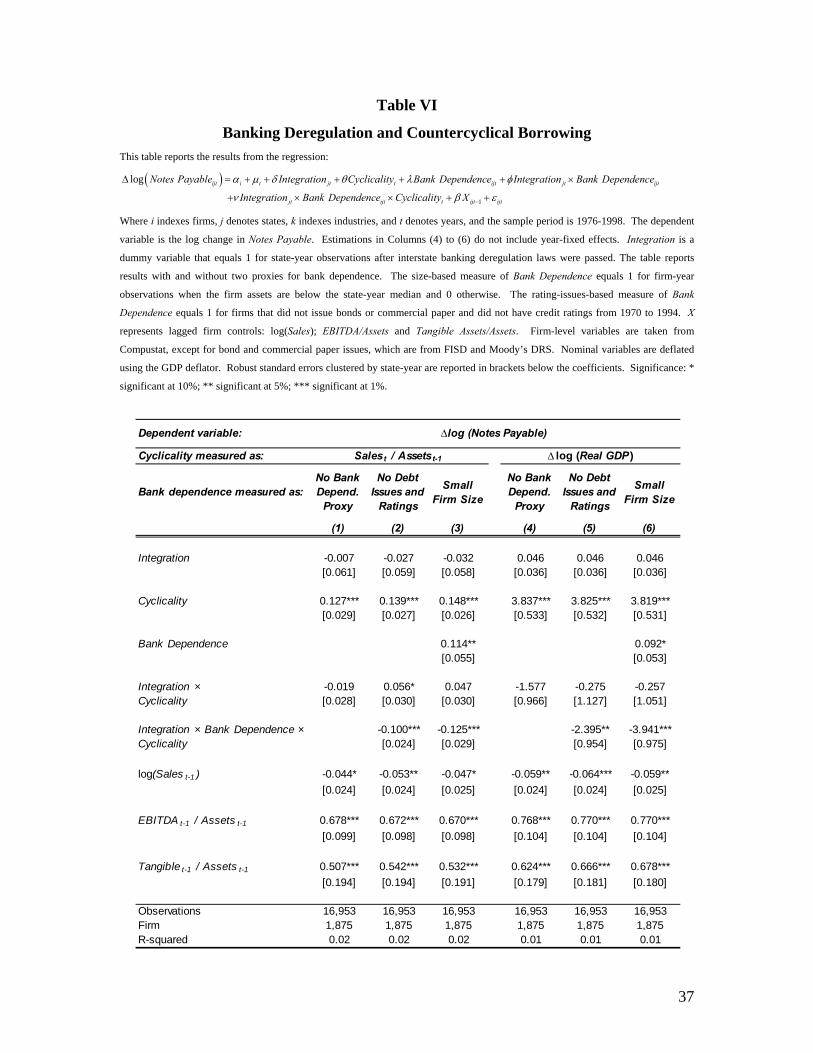
37
Table VI
Banking Deregulation and Countercyclical Borrowing
This table reports the results from the regression:
1
log
ijt i t jt t ijt jt ijt
jt ijt t ijt ijt
Notes Payable Integration Cyclicality Bank Dependence Integration Bank Dependence
Integration Bank Dependence Cyclicality X
Where i indexes firms, j denotes states, k indexes industries, and t denotes years, and the sample period is 1976-1998. The dependent
variable is the log change in Notes Payable. Estimations in Columns (4) to (6) do not include year-fixed effects. Integration is a
dummy variable that equals 1 for state-year observations after interstate banking deregulation laws were passed. The table reports
results with and without two proxies for bank dependence. The size-based measure of Bank Dependence equals 1 for firm-year
observations when the firm assets are below the state-year median and 0 otherwise. The rating-issues-based measure of Bank
Dependence equals 1 for firms that did not issue bonds or commercial paper and did not have credit ratings from 1970 to 1994. X
represents lagged firm controls: log(Sales); EBITDA/Assets and Tangible Assets/Assets. Firm-level variables are taken from
Compustat, except for bond and commercial paper issues, which are from FISD and Moody’s DRS. Nominal variables are deflated
using the GDP deflator. Robust standard errors clustered by state-year are reported in brackets below the coefficients. Significance: *
significant at 10%; ** significant at 5%; *** significant at 1%.
Cyclicality measured as:
Bank dependence measured as:No Bank Depend.
Proxy
No Debt Issues and
Ratings
Small Firm Size
No Bank Depend.
Proxy
No Debt Issues and
Ratings
Small Firm Size
(1) (2) (3) (4) (5) (6)
Integration -0.007 -0.027 -0.032 0.046 0.046 0.046[0.061] [0.059] [0.058] [0.036] [0.036] [0.036]
Cyclicality 0.127*** 0.139*** 0.148*** 3.837*** 3.825*** 3.819***[0.029] [0.027] [0.026] [0.533] [0.532] [0.531]
Bank Dependence 0.114** 0.092*[0.055] [0.053]
Integration × -0.019 0.056* 0.047 -1.577 -0.275 -0.257Cyclicality [0.028] [0.030] [0.030] [0.966] [1.127] [1.051]
Integration × Bank Dependence × -0.100*** -0.125*** -2.395** -3.941***Cyclicality [0.024] [0.029] [0.954] [0.975]
log(Sales t-1 ) -0.044* -0.053** -0.047* -0.059** -0.064*** -0.059**
[0.024] [0.024] [0.025] [0.024] [0.024] [0.025]
EBITDA t-1 / Assets t-1 0.678*** 0.672*** 0.670*** 0.768*** 0.770*** 0.770***
[0.099] [0.098] [0.098] [0.104] [0.104] [0.104]
Tangible t-1 / Assets t-1 0.507*** 0.542*** 0.532*** 0.624*** 0.666*** 0.678***
[0.194] [0.194] [0.191] [0.179] [0.181] [0.180]
Observations 16,953 16,953 16,953 16,953 16,953 16,953Firm 1,875 1,875 1,875 1,875 1,875 1,875R-squared 0.02 0.02 0.02 0.01 0.01 0.01
Dependent variable: ∆log (Notes Payable)
Salest / Assetst-1 ∆ log (Real GDP)

38
Table VII
Banking Deregulation and Idiosyncratic Stock Return Volatility
This table presents the results from the following regression:
1 it i t jt ijt jt ijt ijt ijtVol R Integration Bank Dependence Integration Bank Dependence X
Where i indexes firms, j denotes states, and t denotes year, and the sample period is 1976-1998. R0 are firm-level raw excess returns
over the Treasury Bill. R1 is the residual of running a firm-level market-model regression of monthly excess returns on the excess
return on the market portfolio and an intercept. R2 is the residual obtained by expanding the market model regression to include the
size and value factors of Fama and French (1993) and the momentum factor of Jegadeesh and Titman (1993). Vol( Rit ) is the
volatility of Rit, measured as its standard deviation in year t. Integration is a dummy variable that equals 1 for state-year observations
after interstate banking deregulation laws were passed. The size-based measure of Bank Dependence equals 1 for firm-year
observations when the firm assets are below the state-year median and 0 otherwise. The rating-issues-based measure of Bank
Dependence equals 1 for firms that did not issue bonds and commercial paper and did not have credit ratings from 1970 to 1994. X
represents lagged firm controls: log(Sales); EBITDA/Assets and Tangible Assets/Assets. Firm-level variables are taken from
Compustat, except for bond and commercial paper issues, which are from FISD and Moody’s DRS. Nominal variables are deflated
using the GDP deflator. Robust standard errors clustered by state-year are reported in brackets below the coefficients. Significance: *
significant at 10%; ** significant at 5%; *** significant at 1%.
Dependent variable:
Bank dependence measured as:
No Bank Depend.
Proxy
No Debt Issues and
Ratings
Small Firm Size
No Bank Depend.
Proxy
No Debt Issues and
Ratings
Small Firm Size
No Bank Depend.
Proxy
No Debt Issues and
Ratings
Small Firm Size
(1) (2) (3) (4) (5) (6) (7) (8) (9)
Integration -0.001 0.005*** 0.002 -0.001 0.003* 0.001 -0.001 0.002 0.001[0.001] [0.002] [0.001] [0.001] [0.002] [0.001] [0.001] [0.002] [0.001]
Bank Dependence 0.011*** 0.011*** 0.010***[0.002] [0.002] [0.002]
Integration × -0.008*** -0.006*** -0.006*** -0.006*** -0.005*** -0.005**Bank Dependence [0.002] [0.002] [0.001] [0.002] [0.001] [0.002]
log(Sales t-1 ) -0.013*** -0.013*** -0.011*** -0.013*** -0.013*** -0.012*** -0.013*** -0.013*** -0.011***
[0.001] [0.001] [0.001] [0.001] [0.001] [0.001] [0.001] [0.001] [0.001]
EBITDA t-1 / Assets t-1 -0.071*** -0.071*** -0.073*** -0.081*** -0.081*** -0.083*** -0.076*** -0.076*** -0.078***
[0.009] [0.009] [0.009] [0.008] [0.008] [0.008] [0.008] [0.008] [0.008]
Tangible t-1 / Assets t-1 -0.047*** -0.044*** -0.045*** -0.049*** -0.047*** -0.047*** -0.045*** -0.043*** -0.044***
[0.007] [0.007] [0.007] [0.007] [0.007] [0.007] [0.007] [0.007] [0.007]
Observations 28,167 28,167 28,167 28,167 28,167 28,167 28,167 28,167 28,167Firms 1,637 1,637 1,637 1,637 1,637 1,637 1,637 1,637 1,637R-squared 0.09 0.10 0.10 0.07 0.07 0.07 0.06 0.06 0.06
Vol (R 0 ) Vol (R 1 ) Vol (R 2)
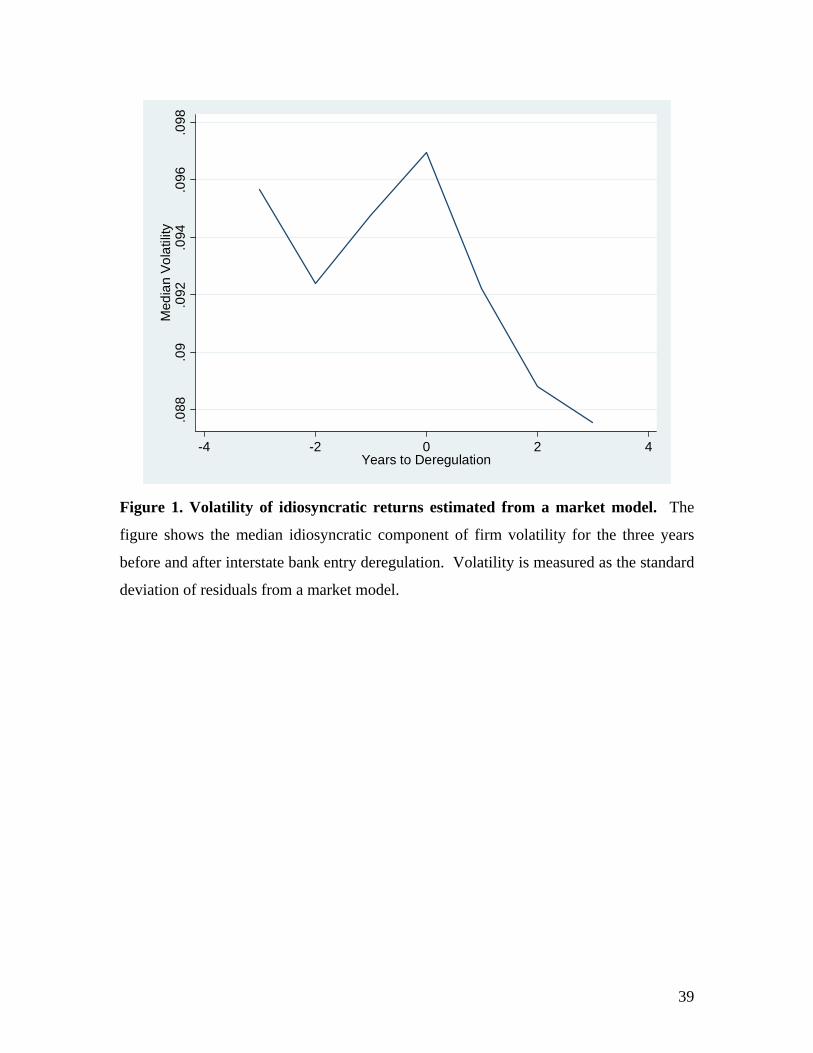
39
Figure 1. Volatility of idiosyncratic returns estimated from a market model. The
figure shows the median idiosyncratic component of firm volatility for the three years
before and after interstate bank entry deregulation. Volatility is measured as the standard
deviation of residuals from a market model.
.088
.09
.092
.094
.096
.098
Med
ian
Vo
latil
ity
-4 -2 0 2 4Years to Deregulation

40
Figure 2. Volatility of idiosyncratic returns estimated from a four-factor model. The
figure shows the median idiosyncratic component of firm volatility for the three years
before and after interstate bank entry deregulation. Volatility is measured as the standard
deviation of residuals from a four-factor model.
.086
.088
.09
.092
.094
Med
ian
Vo
latil
ity
-4 -2 0 2 4Years to Deregulation
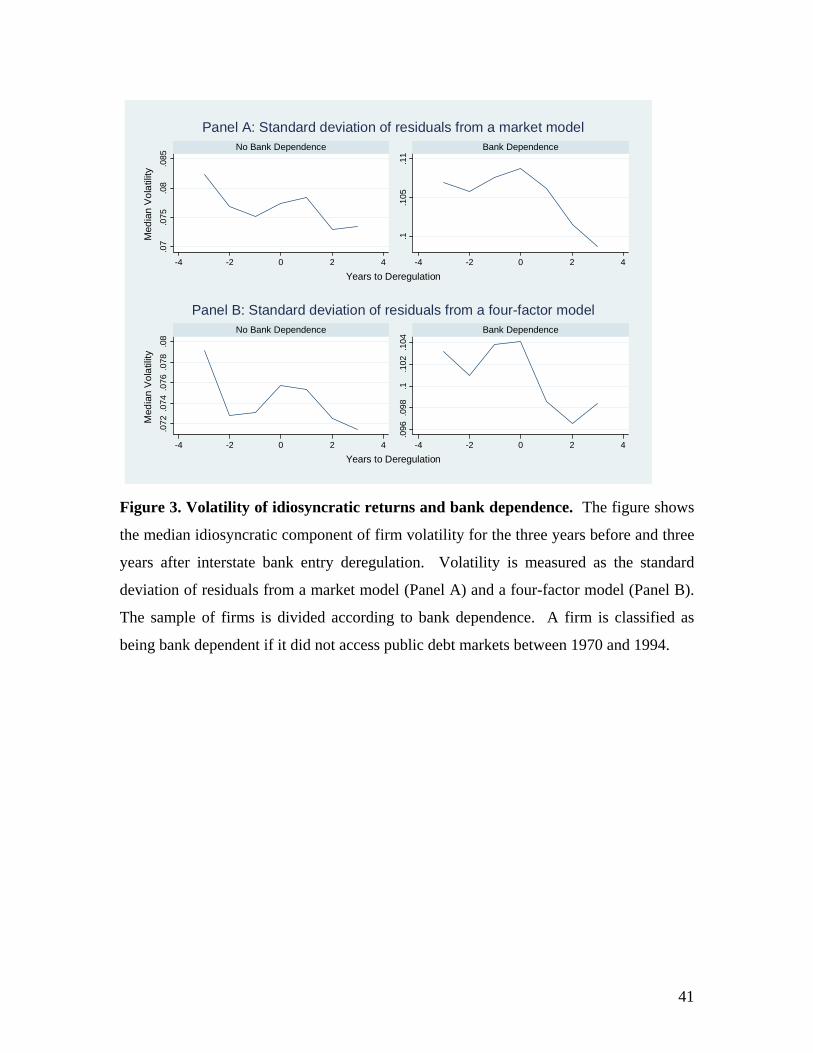
41
Figure 3. Volatility of idiosyncratic returns and bank dependence. The figure shows
the median idiosyncratic component of firm volatility for the three years before and three
years after interstate bank entry deregulation. Volatility is measured as the standard
deviation of residuals from a market model (Panel A) and a four-factor model (Panel B).
The sample of firms is divided according to bank dependence. A firm is classified as
being bank dependent if it did not access public debt markets between 1970 and 1994.
.07
.075
.08
.085
.1.1
05.1
1
-4 -2 0 2 4 -4 -2 0 2 4
No Bank Dependence Bank DependenceM
edia
n V
ola
tility
Years to Deregulation
Panel A: Standard deviation of residuals from a market model
.072
.074
.076
.078
.08
.096
.098
.1.1
02.1
04
-4 -2 0 2 4 -4 -2 0 2 4
No Bank Dependence Bank Dependence
Med
ian
Vo
latil
ity
Years to Deregulation
Panel B: Standard deviation of residuals from a four-factor model