SCA Presentation - Interim report for Q2 2013
12
1 January – 30 June 2013 SCA Interim Report July 18, 2013 SCA Interim Report Q2 2013 1
-
Upload
sca-svenska-cellulosa-aktiebolaget -
Category
Investor Relations
-
view
1.107 -
download
0
Transcript of SCA Presentation - Interim report for Q2 2013

1 January – 30 June 2013
SCA Interim Report
July 18, 2013 SCA Interim Report Q2 2013 1

Weak global growth Weak Western Europe Increased confidence in some recovery in the US
Tissue Some growth in Europe and North America High growth in Emerging markets
Personal Care Good demand for incontinence products in Europe Stable demand for baby diapers and feminine care in Western Europe Good growth in Emerging markets
Forest Products Improved global market for solid-wood products Improved European market for kraftliner Decreased demand for publication paper
July 18, 2013 SCA Interim Report Q2 2013 2
Macro update

Sales growth 18%* Hygiene business, 21%**
• Acquisitions• Higher volumes• Good growth in Emerging markets
Forest Products, -4%***• Lower prices including currency effects• Higher volumes
EBIT increased 5%**** Acquisitions Higher volumes Cost savings
Operating cash flow decreased 37%
July 18, 2013 SCA Interim Report Q2 2013 3
SummaryQ2 2013 vs. Q2 2012
* Excluding exchange rate effects and divestments** Excluding exchange rate effects*** Excluding divestments**** Excluding items affecting comparability and exchange rate effects

Efficiency programs Hygiene business cost and productivity program
Achieved cost savings Q2 2013: SEK 231m Annualized cost savings in Q2 2013: EUR 110m Total annual cost savings of EUR 300m, full effect in 2015
Georgia-Pacific synergies Achieved cost savings Q2 2013: SEK 87m Annualized cost savings in Q2 2013: EUR 40m Total annual cost savings of EUR 125m, full effect in 2016
Forest Products efficiency program Achieved earnings improvement Q2 2013: SEK 110m Annualized earnings improvement in Q2 2013: SEK 440m Total annual earnings improvement of SEK 1,300m, full effect in
2015
July 18, 2013 SCA Interim Report Q2 2013 4
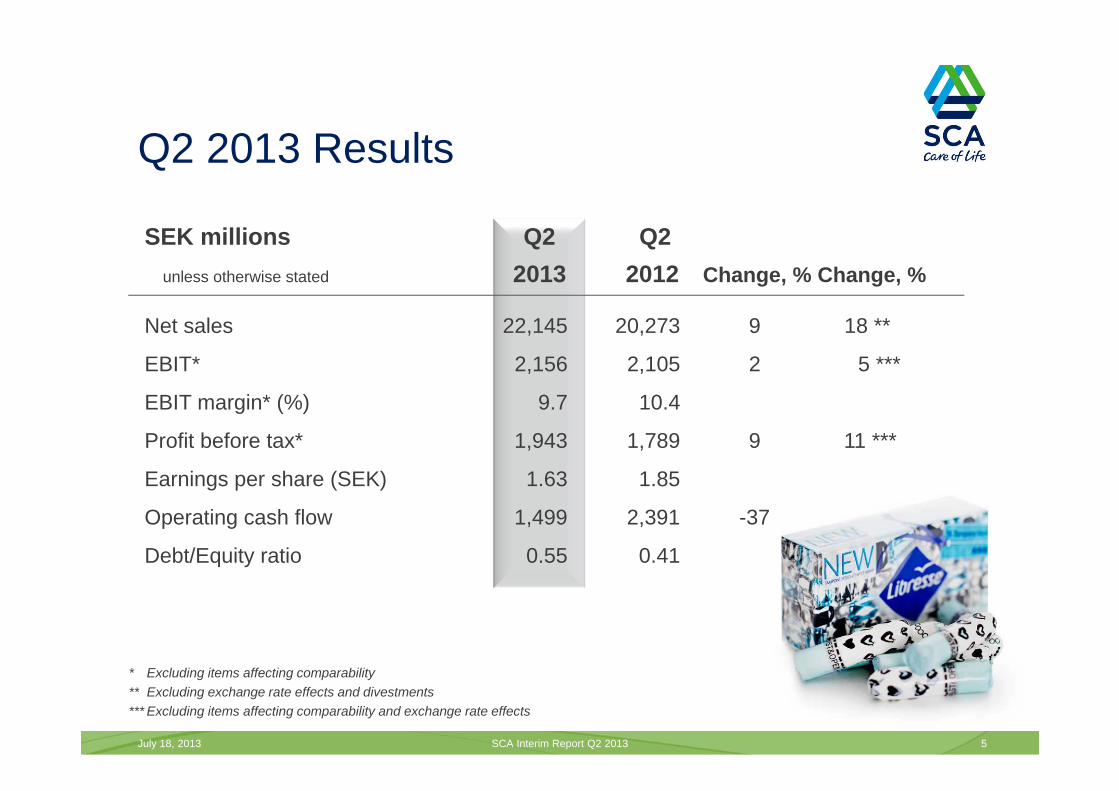
Q2 2013 Results
July 18, 2013 SCA Interim Report Q2 2013 5
SEK millions Q2 Q2unless otherwise stated 2013 2012 Change, % Change, %
Net sales 22,145 20,273 9 18 **
EBIT* 2,156 2,105 2 5 ***
EBIT margin* (%) 9.7 10.4
Profit before tax* 1,943 1,789 9 11 ***
Earnings per share (SEK) 1.63 1.85
Operating cash flow 1,499 2,391 -37
Debt/Equity ratio 0.55 0.41
* Excluding items affecting comparability** Excluding exchange rate effects and divestments*** Excluding items affecting comparability and exchange rate effects

Group Sales increased 4%* EBIT increased 3%**
Business areas Personal Care, EBIT flat*** Higher volumes Cost savings Higher raw material costs
Tissue, EBIT increased 11%** Higher volumes Cost savings Higher raw material costs
Forest Products, EBIT increased 9%** Higher prices Cost savings Costs for maintenance stops
July 18, 2013 SCA Interim Report Q2 2013 6
Q2 2013 vs. Q1 2013Summary
* Excluding divestments** Excluding items affecting comparability and divestments*** Excluding items affecting comparability

July 18, 2013 SCA Interim Report Q2 2013 7
Personal CareQ2 2013 vs. Q2 2012
Q2 2012 Q2 2013
EBIT margin** 12.0%
EBIT** SEKm Q2 2012 Q2 2013
* Excluding exchange rate effects** Excluding items affecting comparability*** Excluding items affecting comparability and exchange rate effects
4%6,7646,530
3%**806781
11.9%
SALES SEKm
Sales growth 4% (10%*) Incontinence products increased 6%* Baby diapers increased 7%* Feminine care increased 8%* Emerging markets increased 16%*
EBIT increased 3%** (3%***) Higher volumes Acquisitions Cost savings Increased marketing activities Higher raw material costs

July 18, 2013 SCA Interim Report Q2 2013 8
TissueQ2 2013 vs. Q2 2012
EBIT margin**EBIT** SEKm
11.1%10.8 %
SALES SEKm Q2 2012 Q2 2013
Q2 2012 Q2 2013
27%**1,0211,295
* Excluding exchange rate effects** Excluding items affecting comparability*** Excluding items affecting comparability and exchange rate effects
Sales growth 23% (28%*) Consumer tissue increased 30%* AFH tissue increased 26%* Emerging markets increased 14%*
EBIT increased by 27%** (33%***) Acquisitions Cost savings Higher volumes
23%11,650
9,461

July 18, 2013 SCA Interim Report Q2 2013 9
Forest ProductsQ2 2013 vs. Q2 2012
‐22%
EBIT margin** 6.6%8.9%
‐42%**
3,788
4,868
250
433
SALES SEKm Q2 2012 Q2 2013
Q2 2012 Q2 2013EBIT** SEKm
* Excluding divestment** Excluding items affecting comparability
Sales decreased 22% (-4%*) Publication papers, decreased sales
• Lower prices • Divestments
Solid-wood products, increased sales• Higher volumes
Kraftliner, decreased sales• Lower volumes• Higher prices
Pulp, decreased sales• Lower prices
EBIT decreased 42%** Lower prices Negative currency effects Costs for maintenance stops Cost savings Lower raw material costs
Summary
July 18, 2013 SCA Interim Report Q2 2013 10
Higher sales and profit for the hygiene businesses
Good growth rates in Emerging markets
Lower profit in Forest Products
Efficiency programs delivering according to plan

July 18, 2013 SCA Interim Report Q2 2013 11
Q&A