SCA interim report Q1 2012
10
Interim Report 1 January – 31 March 2012
-
Upload
sca-svenska-cellulosa-aktiebolaget -
Category
Investor Relations
-
view
7.095 -
download
0
Transcript of SCA interim report Q1 2012
Interim Report1 January – 31 March 2012
2
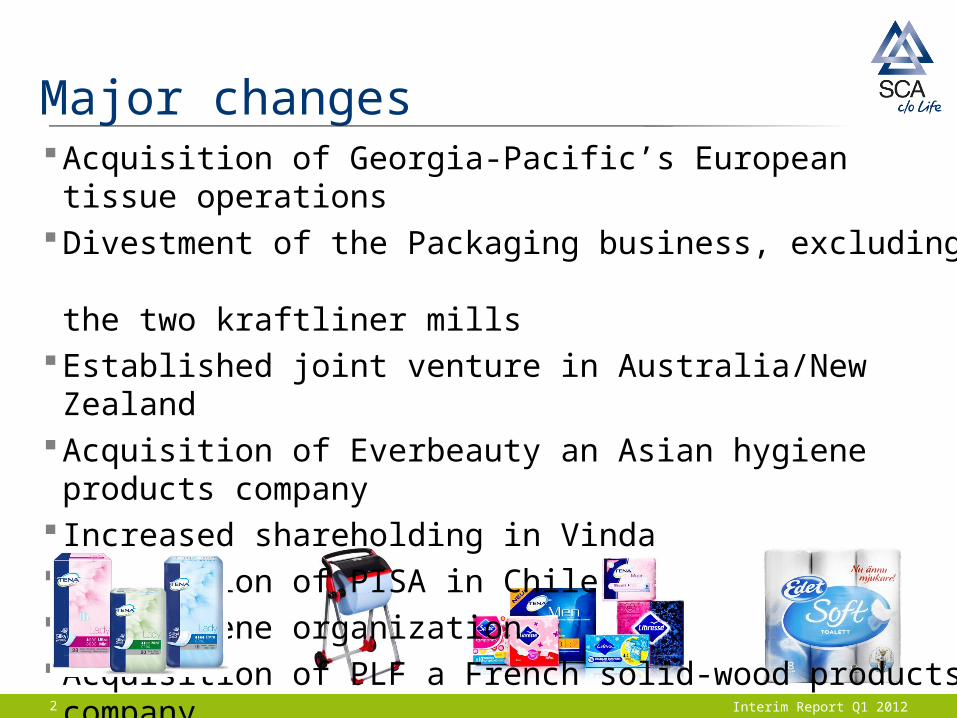
Major changesAcquisition of Georgia-Pacific’s European tissue operationsDivestment of the Packaging business, excluding
the two kraftliner millsEstablished joint venture in Australia/New ZealandAcquisition of Everbeauty an Asian hygiene products company Increased shareholding in VindaAcquisition of PISA in ChileNew hygiene organizationAcquisition of PLF a French solid-wood products company
Interim Report Q1 2012
3 Interim Report Q1 2012
Sales increased 4%* Hygiene business
Higher volumes Higher prices Good growth in emerging markets
• Personal Care, 23%**• Tissue, 14%**
Forest Products Higher volumes Lower prices
EBIT increased 7%*** Higher volumes Lower raw material cost Cost savings
SummaryQ1 2012 vs Q1 2011
* Adjusted for exchange rate movements and divestments** Adjusted for exchange rate movements*** Excluding items affecting comparability and divestments
4
Q1 2012 results
Interim Report Q1 2012
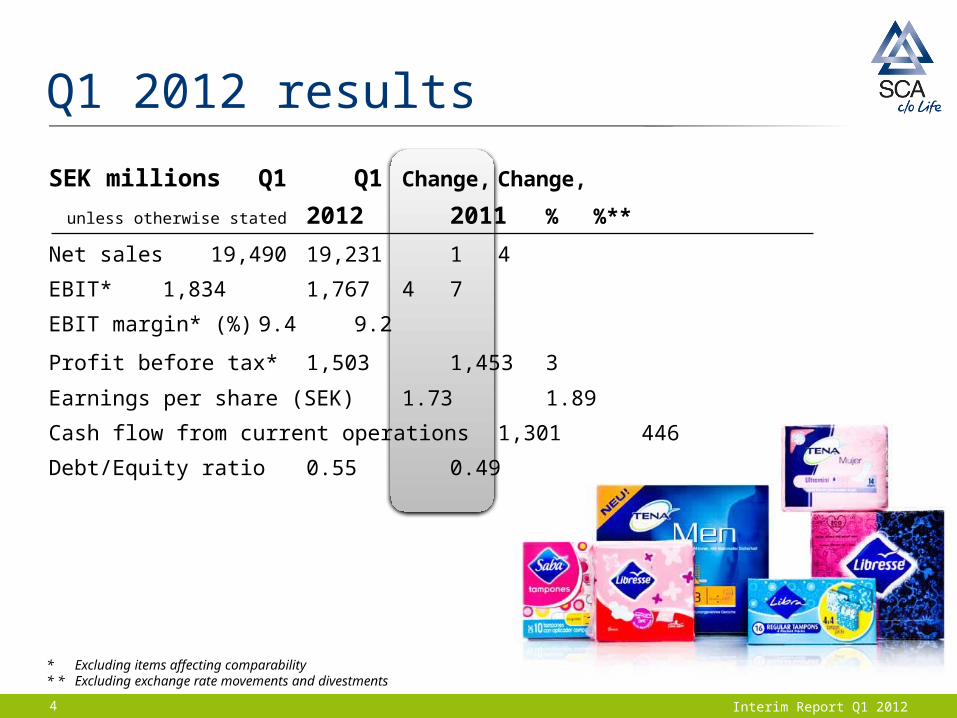
SEK millions Q1 Q1 Change, Change,
unless otherwise stated 2012 2011 % %**
Net sales 19,490 19,231 1 4
EBIT* 1,834 1,767 4 7
EBIT margin* (%) 9.4 9.2
Profit before tax* 1,503 1,453 3
Earnings per share (SEK) 1.73 1.89
Cash flow from current operations 1,301 446
Debt/Equity ratio 0.55 0.49
* Excluding items affecting comparability* * Excluding exchange rate movements and divestments
5 Interim Report Q1 2012
Q1 2012 vs. Q4 2011Summary
Group Sales decreased 2%* EBIT decreased 7%**
Business areas Personal Care, EBIT decreased 5%***
• Seasonality impact• Lower raw material costs
Tissue, EBIT decreased 6 %**• Increased marketing activities• Seasonality impact• Lower raw material costs
Forest Products, EBIT decreased 31%****• Lower prices• Higher raw material costs
* Excluding divestments** Excluding items affecting comparability, exchange rate movements and divestments*** Excluding items affecting comparability and divestments**** Excluding items affecting comparability
6 Interim Report Q1 2012
Personal CareQ1 2012 vs. Q1 2011
7%
SALES SEKm
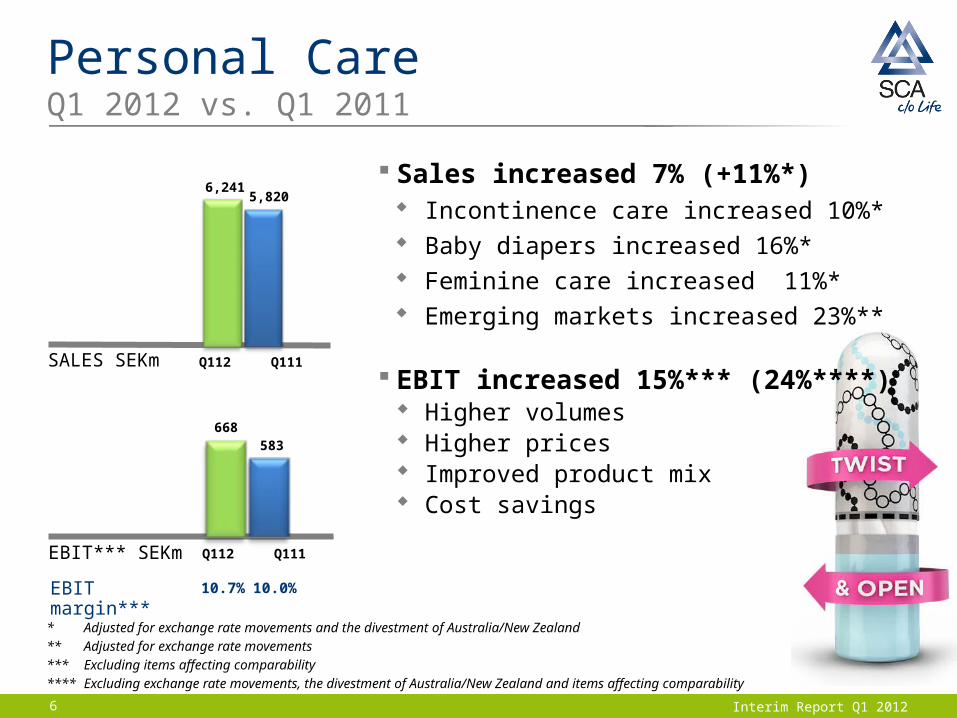
5,8206,241
Q112 Q111
EBIT margin*** 10.0%10.7%
15%583
668
EBIT*** SEKm Q112 Q111
Sales increased 7% (+11%*) Incontinence care increased 10%* Baby diapers increased 16%* Feminine care increased 11%* Emerging markets increased 23%**
EBIT increased 15%*** (24%****) Higher volumes Higher prices Improved product mix Cost savings
* Adjusted for exchange rate movements and the divestment of Australia/New Zealand
** Adjusted for exchange rate movements
*** Excluding items affecting comparability
**** Excluding exchange rate movements, the divestment of Australia/New Zealand and items affecting comparability
7 Interim Report Q1 2012
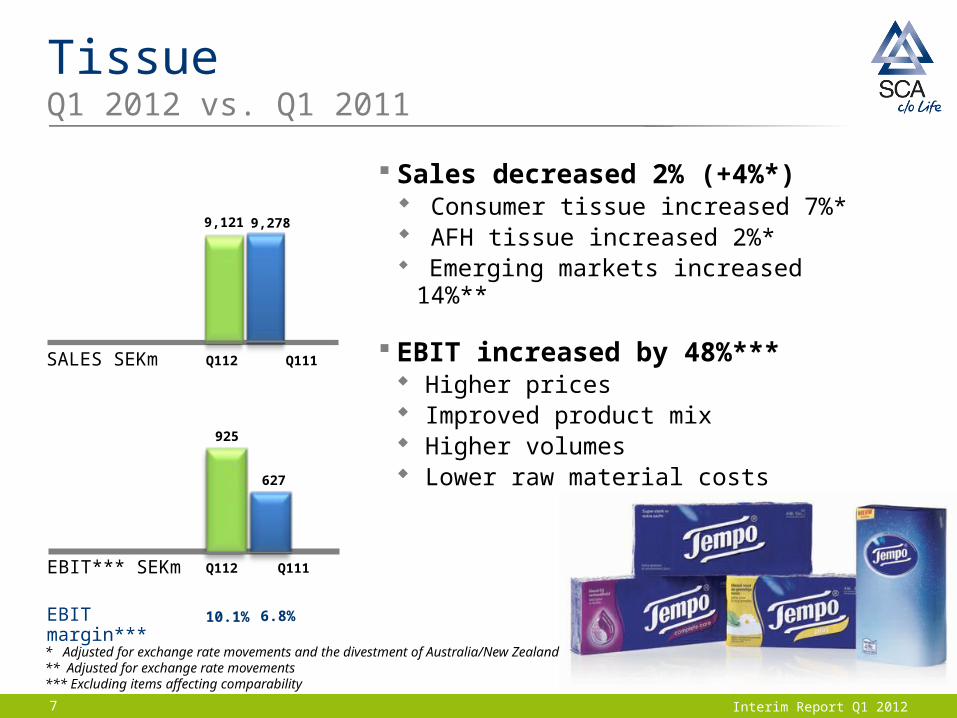
TissueQ1 2012 vs. Q1 2011
-2%
EBIT margin***
48%
9,2789,121
627
925
EBIT*** SEKm
6.8%10.1%
SALES SEKm
Sales decreased 2% (+4%*) Consumer tissue increased 7%* AFH tissue increased 2%* Emerging markets increased 14%**
EBIT increased by 48%*** Higher prices Improved product mix Higher volumes Lower raw material costs
* Adjusted for exchange rate movements and the divestment of Australia/New Zealand** Adjusted for exchange rate movements*** Excluding items affecting comparability
Q112 Q111
Q112 Q111
8 Interim Report Q1 2012
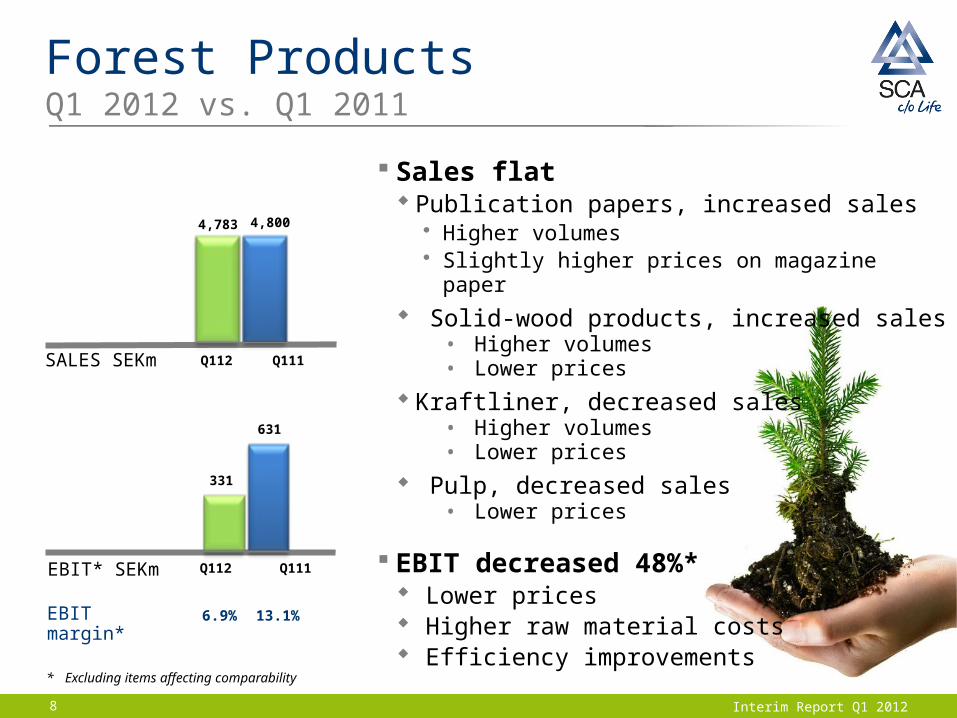
Forest ProductsQ1 2012 vs. Q1 2011
0%
EBIT margin* 13.1%6.9%
-48%
4,8004,783
631
331
SALES SEKm
EBIT* SEKm
Sales flat Publication papers, increased sales
• Higher volumes • Slightly higher prices on magazine paper
Solid-wood products, increased sales• Higher volumes• Lower prices
Kraftliner, decreased sales• Higher volumes• Lower prices
Pulp, decreased sales• Lower prices
EBIT decreased 48%* Lower prices Higher raw material costs Efficiency improvements
Q112 Q111
Q112 Q111
* Excluding items affecting comparability
9
Q&A
Interim Report Q1 2012