SC MTP Strategic Corridors Plan · SOUTH CAROLINA MULTIMODAL TRANSPORTATION PLAN i ... South...
90
SOUTH CAROLINA STRATEGIC CORRIDORS PLAN Prepared for: Prepared by: August 2014
Transcript of SC MTP Strategic Corridors Plan · SOUTH CAROLINA MULTIMODAL TRANSPORTATION PLAN i ... South...
SOUTH CAROLINA STRATEGIC CORRIDORS PLAN
Prepared for:
Prepared by:
August 2014
SOUTH CAROLINA MULTIMODAL TRANSPORTATION PLAN
i
TABLE OF CONTENTS
1. Introduction .......................................................................................................................................... 1
2. Vision, Goals, Objectives & Performance Measures ............................................................................ 2
2.1 Vision ......................................................................................................................................... 2
2.2 Goals ......................................................................................................................................... 2
2.3 Objectives and Performance Measures .................................................................................... 5
3. Strategic Corridor Network Update Process ........................................................................................ 6
3.1 Methodology ............................................................................................................................. 6
3.2 Technical Analysis ..................................................................................................................... 6 3.2.1 Step 1: Assessing the Roadways ................................................................................. 7 3.2.2 Step 2: Develop Tiered Corridors ............................................................................... 10
3.3 System Refinements and Stakeholder Input .......................................................................... 11
4. Multimodal Needs Identified by MPOs and COGs .............................................................................. 13
4.1 Methodology ........................................................................................................................... 13
4.2 MPO/COG Needs .................................................................................................................... 13 4.3.1 Methodology .............................................................................................................. 41 4.3.2 Data and Calculations ................................................................................................ 42 4.3.3 Results ........................................................................................................................ 43
4.4 Existing and Future Strategic Corridor Level of Service (LOS) ................................................ 49
4.5 Congestion Management Strategies ....................................................................................... 53 4.5.1 Roadway Operational Improvements ........................................................................ 54 4.5.2 Alternative Mode Support Strategies ........................................................................ 57 4.5.3 Demand Management Strategies .............................................................................. 58
5. Conclusions ......................................................................................................................................... 60
5.1 Implementation ...................................................................................................................... 60
APPENDIX A: Environmental Screening ................................................................................................... 62
APPENDIX B: Detailed Results of Congestion Analysis on Strategic Corridors ........................................ 69
South Carolina Strategic Corridors Plan
Table of Contents
SOUTH CAROLINA MULTIMODAL TRANSPORTATION PLAN
ii
LIST OF TABLES
Table 2‐1: 2040 Multimodal Transportation Plan Goals Compared to MAP‐21 National Goals ................ 4
Table 2‐2: Objectives for Mobility and System Reliability Goal ................................................................. 5
Table 2‐3: Objectives for Safety Goal ......................................................................................................... 5
Table 2‐4: Objectives for Infrastructure Condition Goal ............................................................................ 5
Table 2‐5: Objectives for Economic and Community Vitality Goal ............................................................ 5
Table 3‐1: Criteria for Assessing South Carolina Roadway Network .......................................................... 8
Table 3‐2: Summary of Strategic Corridor Network ................................................................................. 11
Table 4‐1: Needs Identification: Berkeley‐Dorchester‐Charleston Council of Governments .................. 15
Table 4‐2: Needs Identification: Catawba Council of Governments ........................................................ 17
Table 4‐3: Needs Identification: Central Midlands Council of Governments ........................................... 21
Table 4‐4: Needs Identification: Lower Savannah Council of Governments ............................................ 24
Table 4‐5: Needs Identification: Pee Dee Council of Governments ......................................................... 28
Table 4‐6: Needs Identification: South Carolina Appalachian Council of Governments .......................... 30
Table 4‐7: Needs Identification: Upper Savannah Council of Governments ............................................ 32
Table 4‐8: Needs Identification: Waccamaw Council of Governments .................................................... 35
Table 4‐9: MPO and COG Transportation Needs Costs ............................................................................ 41
Table 4‐10: Top 20 Congested Strategic Corridor Segments .................................................................... 43
Table 4‐11: Strategic Corridor Lane Miles with LOS Information ............................................................. 49
South Carolina Strategic Corridors Plan
Table of Contents
SOUTH CAROLINA MULTIMODAL TRANSPORTATION PLAN
iii
LIST OF FIGURES
Figure 3‐1: Methodology to develop Statewide Strategic Corridors ......................................................... 6
Figure 3‐2: South Carolina Statewide Strategic Corridor Network .......................................................... 12
Figure 4‐1: Statewide Multimodal Needs on the Strategic Highway Network ........................................ 14
Figure 4‐2: Multimodal Needs for Berkeley‐Dorchester‐Charleston COG ............................................... 16
Figure 4‐3: Multimodal Needs for Catawba COG ..................................................................................... 20
Figure 4‐4: Multimodal Needs for Central Midlands COG ....................................................................... 23
Figure 4‐5: Multimodal Needs for Lower Savannah COG ......................................................................... 27
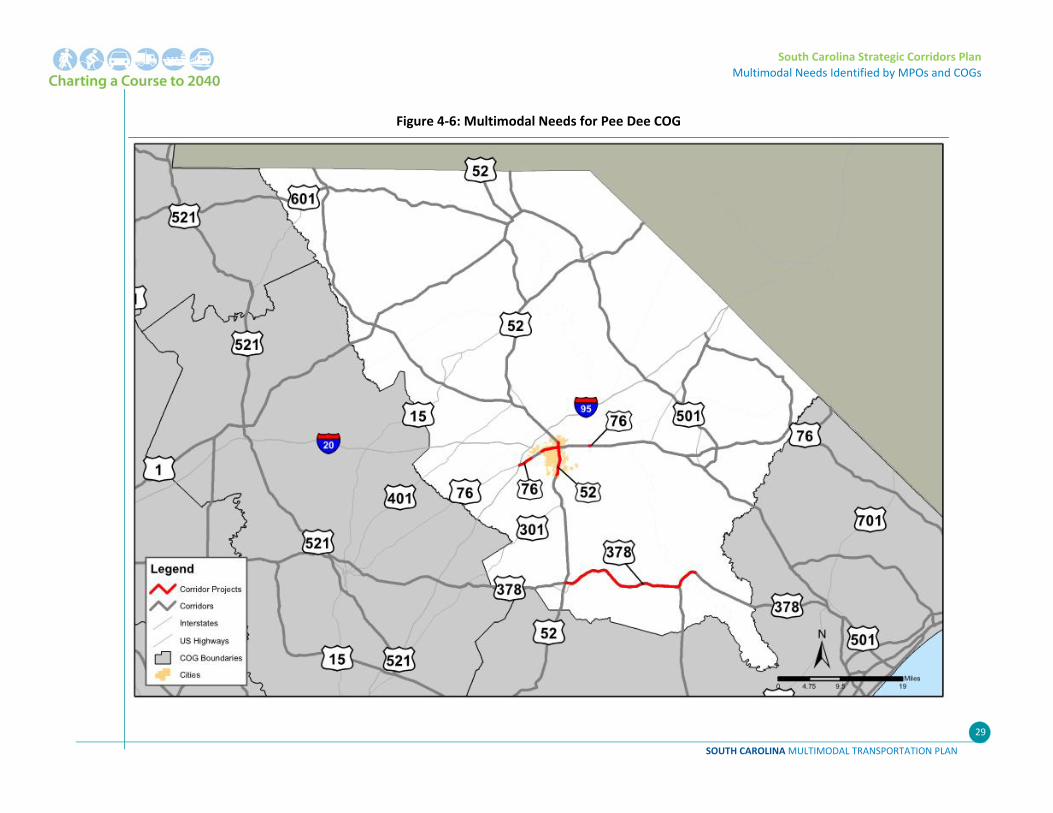
Figure 4‐6: Multimodal Needs for Pee Dee COG ...................................................................................... 29
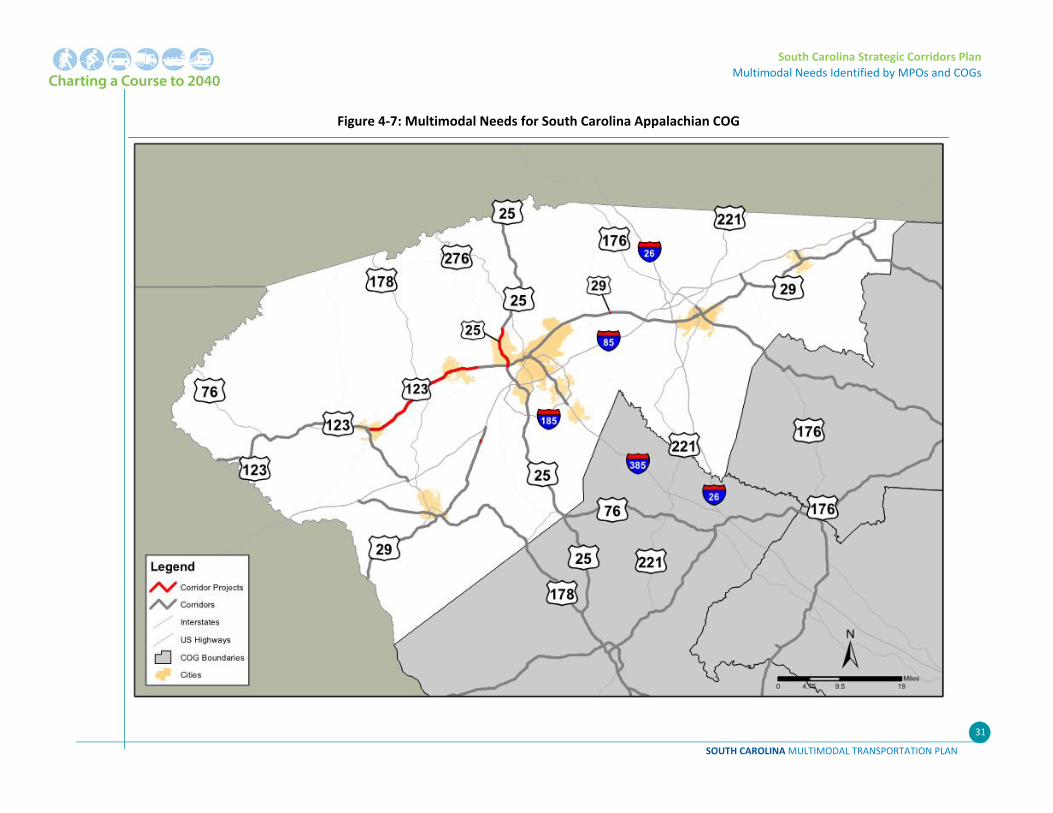
Figure 4‐7: Multimodal Needs for South Carolina Appalachian COG ....................................................... 31
Figure 4‐8: Multimodal Needs for Upper Savannah COG ........................................................................ 34
Figure 4‐9: Multimodal Needs for Waccamaw COG ................................................................................ 40
Figure 4‐10: Top 100 Congested Strategic Corridor Segment Locations .................................................. 44
Figure 4‐11: Top 100 Congested Strategic Corridor Segments – Charleston Area................................... 45
Figure 4‐12: Top 100 Congested Strategic Corridor Segments – Columbia Area ..................................... 46
Figure 4‐13: Top 100 Congested Strategic Corridor Segments – Greenville/Spartanburg Area .............. 47
Figure 4‐14: Top 100 Congested Strategic Corridor Segments – Myrtle Beach Area .............................. 48
Figure 4‐15: Existing 2010 Conditions – Strategic Corridors .................................................................... 50
Figure 4‐16: Future 2040 Conditions – Strategic Corridors ...................................................................... 51
Figure 4‐17: Current Congestion, 2040 V/C and Identified Projects – Strategic Corridors ...................... 52
Figure 4‐18: Causes of Congestion in the United States .......................................................................... 53
SOUTH CAROLINA MULTIMODAL TRANSPORTATION PLAN
1
1. INTRODUCTION
As a part of the 2040 South Carolina Multimodal Transportation Plan (2040 MTP), the existing
Statewide Strategic Corridor Network Plan was updated. This updated plan focuses on maximizing
South Carolina’s limited funding resources, maintaining the State’s position in the global marketplace
and efficiently moving both people and goods.
The purpose of the Statewide Strategic Corridor Network is to provide a connected, continuous
network that serves the traveling public and movement of freight. The benefit for having the
Statewide Strategic Corridor Network is to develop a focused strategic system which will provide the
needed connectivity to allow South Carolina to maintain and enhance its economic vitality.
The first step in the Statewide Strategic Corridor Network plan was to update the goals, objectives,
and performance measures based on the work completed in the 2040 MTP. The identification of what
the system is designed to accomplish is critical in the further development of implementation
processes, procedures, corridor identification and ultimately the development of needs. The 2040
MTP vision, goals, objectives, and performance measures were coordinated and consistent with the
overall strategic goals of SCDOT and were developed in conjunction with SCDOT management, staff
and transportation partners and stakeholders.
As a part of the 2040 MTP, a system of roadways identified as Statewide Strategic Corridor Network
has been updated to support the movement of people and goods throughout South Carolina. The
methodology employed to develop these corridors updates the existing Statewide Strategic Corridor
Network developed in the 2030 MTP.
SOUTH CAROLINA MULTIMODAL TRANSPORTATION PLAN
2
2. VISION, GOALS, OBJECTIVES & PERFORMANCE MEASURES
This chapter summarizes the vision and goals as well as the objectives and performance measures
that guided and directed the development of the Strategic Corridor Plan and the overall 2040 South
Carolina Multimodal Transportation Plan.
2.1 Vision The development of 2040 South Carolina Multimodal Transportation Plan began with a Baseline
Understanding task to examine the strategic direction that is currently guiding South Carolina
Department of Transportation (SCDOT). As a part of this task, SCDOT’s current plans were analyzed,
input from stakeholders was reviewed, workshops with SCDOT executives were conducted, and the
draft SCDOT Strategic Plan was analyzed. These activities provided the information needed for the
development of the 2040 Multimodal Transportation Plan’s vision and goals. Concurrent to this
analysis, the MAP‐211 performance goal language and supporting documentation was reviewed and
analyzed to identify areas of consistency and inconsistency with the SCDOT plan analysis. The plan
analysis and the MAP‐21 comparison were critical inputs used to develop the 2040 Multimodal
Transportation Plan goals.
The following vision for the 2040 Multimodal Transportation Plan was adopted by the Executive
Team:
Safe, reliable surface transportation and infrastructure that effectively supports a healthy
economy for South Carolina.
2.2 Goals Upon adoption of the vision, a set of goals were developed to help achieve the vision. The Baseline
Understanding task provided a strong foundation for the development of the 2040 Multimodal
Transportation Plan goals. The over‐arching principle in developing the goals was that they should not
be just a trend on the past, but should reflect the new challenges the state is facing. The goals should
also articulate SCDOT’s support for a more multimodal transportation system as well as communicate
SCDOT’s responsibility of managing and maintaining the current state transportation system.
Using the information gathered during the baseline understanding task, a set of 2040 Multimodal
Transportation Plan goals were developed. These preliminary goal statements were then compared to
the 2030 Multimodal Transportation Plan goals and the national goal areas included in MAP‐21;
adjustments in both goal categories and content were made based on this initial cross‐referencing.
1 Federal legislation: Moving Ahead for Progress in the 21st Century (July 6, 2012).
South Carolina Strategic Corridors Plan
Vision, Goals, Objectives and Performance Measures
SOUTH CAROLINA MULTIMODAL TRANSPORTATION PLAN
3
The goals identified for 2040 Multimodal Transportation Plan are:
Mobility and System Reliability – Provide surface transportation infrastructure and services that will advance the efficient and reliable movement of people and goods throughout the state.
– Improved mobility and reliable travel times on South Carolina’s transportation system are vital to the state’s economic competitiveness and quality of life. National MAP‐21 legislation makes highway system performance a national goal and requires states to report on system performance. SCDOT uses a combination of capital improvements and operations strategies to accommodate demand for travel. Data on congestion is rapidly becoming more sophisticated, but estimating needs based on this data and linking investment strategies to congestion outcomes remains a challenge.
Safety and Security – Improve the safety and security of the transportation system by implementing transportation improvements that reduce fatalities and serious injuries as well as enabling effective emergency management operations.
– Safe travel conditions are essential to South Carolina’s health, quality of life and economic prosperity. SCDOT partners with other safety on the state’s transportation system. SCDOT maintains extensive data on safety; however, even state‐of‐the‐art planning practices often cannot connect investment scenarios with safety outcomes.
Infrastructure Condition – Maintain surface transportation infrastructure assets in a state of good repair.
– Preserving South Carolina’s transportation infrastructure is a primary element of SCDOT’s mission. This goal promotes public sector fiscal health by minimizing life‐cycle infrastructure costs, while helping keep users’ direct transportation costs low. Maintaining highway assets in a state of good repair is one of the national MAP‐21 goals and requires states and transit agencies to report on asset conditions. SCDOT maintains fairly extensive data and analytical capabilities associated with monitoring and predicting infrastructure condition.
Economic and Community Vitality – Provide an efficient and effective interconnected transportation system that is coordinated with state and local planning efforts to support thriving communities and South Carolina’s economic competitiveness in global markets.
– Transportation infrastructure is vital to the economic prosperity of South Carolina. Good road, rail, transit and air connections across the state help businesses get goods and services to markets and workers get to jobs. Communities often cite desire for economic growth as a reason for seeking additional transportation improvements. In addition, public officials frequently justify transportation spending on a project’s economic merits. State‐of‐the‐art planning practices, however, offer limited potential for connecting investment scenarios with travel choices outcomes.
Environment – Partner to sustain South Carolina’s natural and cultural resources by avoiding, minimizing and mitigating the impacts of state transportation improvements.
South Carolina Strategic Corridors Plan
Vision, Goals, Objectives and Performance Measures
SOUTH CAROLINA MULTIMODAL TRANSPORTATION PLAN
4
– Strengthening environment stewardship is consistent with SCDOT current environmental policies and procedures. MAP‐21 includes an Environmental Sustainability goal which requires states “to enhance the performance of the transportation system while protecting and enhancing the environment.” The environmental goal is inherent at the project level, with consideration of statewide mitigation activities that have the greatest opportunity to restore and maintain environmental functions potentially affected by the projects and programs included in the Statewide Multimodal Transportation Plan.
Equity – Manage a transportation system that recognizes the diversity of the state and strives to accommodate the mobility needs of all of South Carolina’s citizens. Transportation is essential to support individual and community quality of life. As a public agency SCDOT has a public stewardship responsibility that requires it to evaluate needs and priorities in a way that recognizes the diversity of the state’s geographic regions and traveling public. There are no quantitative measures identified to evaluate the Equity goal.
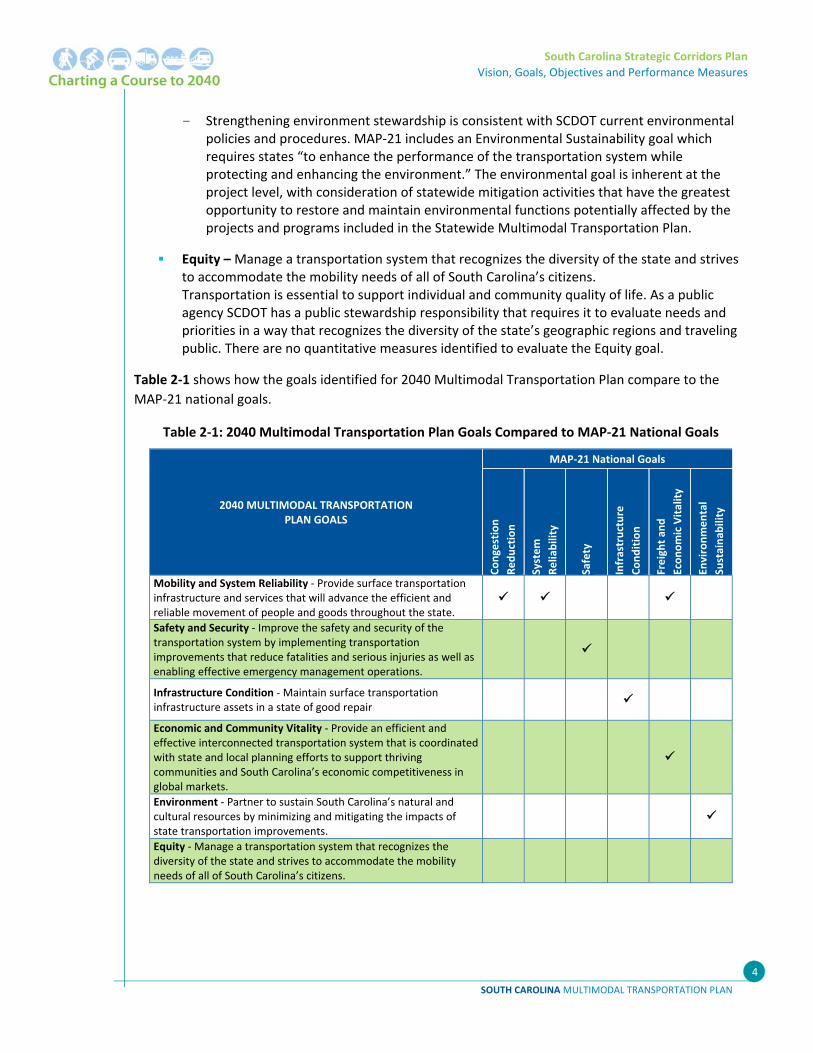
Table 2‐1 shows how the goals identified for 2040 Multimodal Transportation Plan compare to the
MAP‐21 national goals.
Table 2‐1: 2040 Multimodal Transportation Plan Goals Compared to MAP‐21 National Goals
2040 MULTIMODAL TRANSPORTATION PLAN GOALS
MAP‐21 National Goals
Congestion
Reduction
System
Reliability
Safety
Infrastructure
Condition
Freight an
d
Economic Vitality
Environmental
Sustainab
ility
Mobility and System Reliability ‐ Provide surface transportation infrastructure and services that will advance the efficient and reliable movement of people and goods throughout the state.
Safety and Security ‐ Improve the safety and security of the transportation system by implementing transportation improvements that reduce fatalities and serious injuries as well as enabling effective emergency management operations.
Infrastructure Condition ‐ Maintain surface transportation infrastructure assets in a state of good repair
Economic and Community Vitality ‐ Provide an efficient and effective interconnected transportation system that is coordinated with state and local planning efforts to support thriving communities and South Carolina’s economic competitiveness in global markets.
Environment ‐ Partner to sustain South Carolina’s natural and cultural resources by minimizing and mitigating the impacts of state transportation improvements.
Equity ‐ Manage a transportation system that recognizes the diversity of the state and strives to accommodate the mobility needs of all of South Carolina’s citizens.
South Carolina Strategic Corridors Plan
Vision, Goals, Objectives and Performance Measures
SOUTH CAROLINA MULTIMODAL TRANSPORTATION PLAN
5
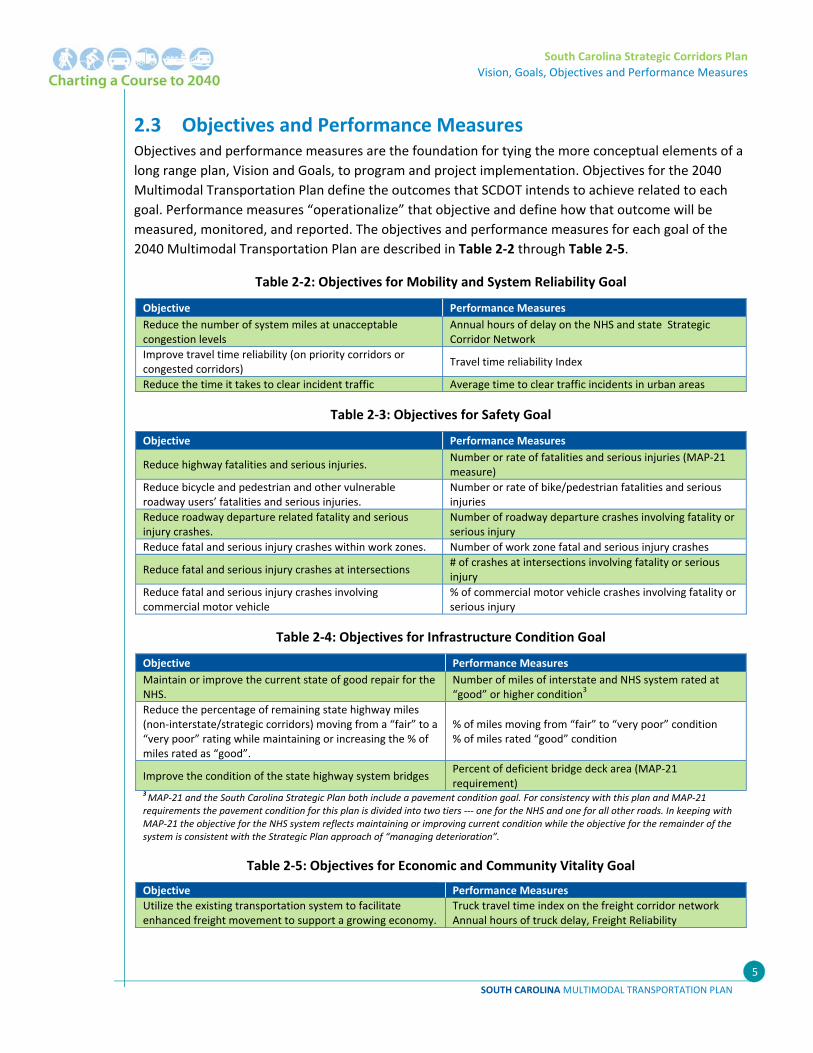
2.3 Objectives and Performance Measures Objectives and performance measures are the foundation for tying the more conceptual elements of a
long range plan, Vision and Goals, to program and project implementation. Objectives for the 2040
Multimodal Transportation Plan define the outcomes that SCDOT intends to achieve related to each
goal. Performance measures “operationalize” that objective and define how that outcome will be
measured, monitored, and reported. The objectives and performance measures for each goal of the
2040 Multimodal Transportation Plan are described in Table 2‐2 through Table 2‐5.
Table 2‐2: Objectives for Mobility and System Reliability Goal
Objective Performance Measures
Reduce the number of system miles at unacceptable congestion levels
Annual hours of delay on the NHS and state Strategic Corridor Network
Improve travel time reliability (on priority corridors or congested corridors)
Travel time reliability Index
Reduce the time it takes to clear incident traffic Average time to clear traffic incidents in urban areas
Table 2‐3: Objectives for Safety Goal
Objective Performance Measures
Reduce highway fatalities and serious injuries. Number or rate of fatalities and serious injuries (MAP‐21 measure)
Reduce bicycle and pedestrian and other vulnerable roadway users’ fatalities and serious injuries.
Number or rate of bike/pedestrian fatalities and serious injuries
Reduce roadway departure related fatality and serious injury crashes.
Number of roadway departure crashes involving fatality or serious injury
Reduce fatal and serious injury crashes within work zones. Number of work zone fatal and serious injury crashes
Reduce fatal and serious injury crashes at intersections # of crashes at intersections involving fatality or serious injury
Reduce fatal and serious injury crashes involving commercial motor vehicle
% of commercial motor vehicle crashes involving fatality or serious injury
Table 2‐4: Objectives for Infrastructure Condition Goal
Objective Performance Measures
Maintain or improve the current state of good repair for the NHS.
Number of miles of interstate and NHS system rated at “good” or higher condition3
Reduce the percentage of remaining state highway miles (non‐interstate/strategic corridors) moving from a “fair” to a “very poor” rating while maintaining or increasing the % of miles rated as “good”.
% of miles moving from “fair” to “very poor” condition % of miles rated “good” condition
Improve the condition of the state highway system bridges Percent of deficient bridge deck area (MAP‐21 requirement)
3 MAP‐21 and the South Carolina Strategic Plan both include a pavement condition goal. For consistency with this plan and MAP‐21 requirements the pavement condition for this plan is divided into two tiers ‐‐‐ one for the NHS and one for all other roads. In keeping with MAP‐21 the objective for the NHS system reflects maintaining or improving current condition while the objective for the remainder of the system is consistent with the Strategic Plan approach of “managing deterioration”.
Table 2‐5: Objectives for Economic and Community Vitality Goal
Objective Performance Measures
Utilize the existing transportation system to facilitate enhanced freight movement to support a growing economy.
Truck travel time index on the freight corridor network Annual hours of truck delay, Freight Reliability
SOUTH CAROLINA MULTIMODAL TRANSPORTATION PLAN
6
3. STRATEGIC CORRIDOR NETWORK UPDATE PROCESS
As a part of the 2040 MTP, a system of roadways identified as Statewide Strategic Corridor Network
was updated. The methodology employed to develop these corridors updates the existing Statewide
Strategic Corridors Network developed in the 2030 MTP. The Statewide Strategic Corridor Network
enhances the economic vitality of the state by providing safe, timely, and efficient movement of
goods and people. The corridors tie the state together by connecting people with jobs, distributors
with manufacturers, shoppers with retailers and tourists with recreational opportunities.
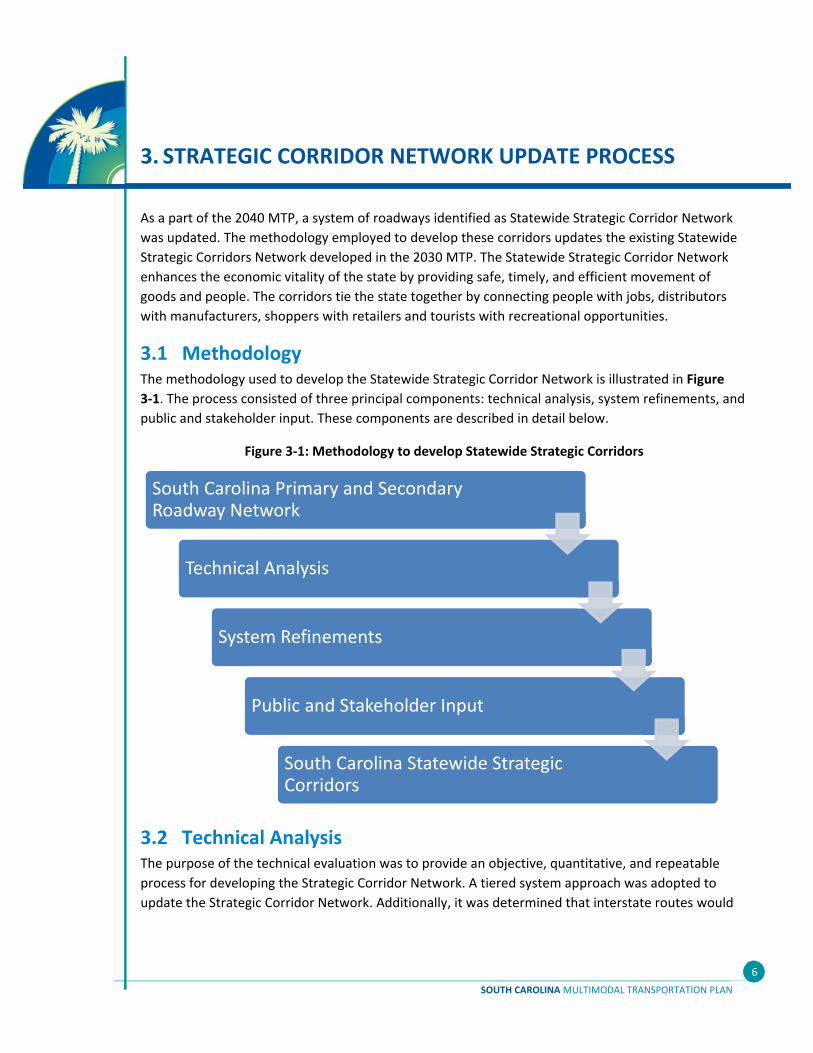
3.1 Methodology The methodology used to develop the Statewide Strategic Corridor Network is illustrated in Figure
3‐1. The process consisted of three principal components: technical analysis, system refinements, and
public and stakeholder input. These components are described in detail below.
Figure 3‐1: Methodology to develop Statewide Strategic Corridors
3.2 Technical Analysis The purpose of the technical evaluation was to provide an objective, quantitative, and repeatable
process for developing the Strategic Corridor Network. A tiered system approach was adopted to
update the Strategic Corridor Network. Additionally, it was determined that interstate routes would
South Carolina Primary and Secondary Roadway Network
Technical Analysis
System Refinements
Public and Stakeholder Input
South Carolina Statewide Strategic Corridors
South Carolina Strategic Corridors Plan
Strategic Corridor Network Update Process
SOUTH CAROLINA MULTIMODAL TRANSPORTATION PLAN
7
not be included in the technical analysis as they are part of the national transportation system and only
the primary and secondary roadway network would be analyzed.
The technical evaluation of the South Carolina primary and secondary roadway network was
conducted using a two‐step process. In the first step, the roadway network was assessed using a set of
evaluation criteria established in association with SCDOT staff. In the second step, a set of baseline
criteria were established and roadways were categorized into three tiers using the baseline criteria and
the rankings developed in the first step.
3.2.1 Step 1: Assessing the Roadways
South Carolina primary and secondary roadway network was evaluated and ranked using a set of
eleven (11) criteria grouped broadly into two groups: Intrastate Mobility Criteria and Economic and
Community Vitality/Equity Criteria. These evaluation criteria were identified early in the study process
and discussed with the SCDOT staff. These criteria were developed within the framework of the
identified goals and guiding principles of the 2040 MTP and adhered to the following three guidelines:
The criteria were developed to be appropriate to the study in terms of coverage, complexity, and public concern.
The criteria are capable of being measured (quantitatively or qualitatively) with current technology, process limitations, and resources available.
The evaluation process would result in producing objective and fair analyses and conclusions.
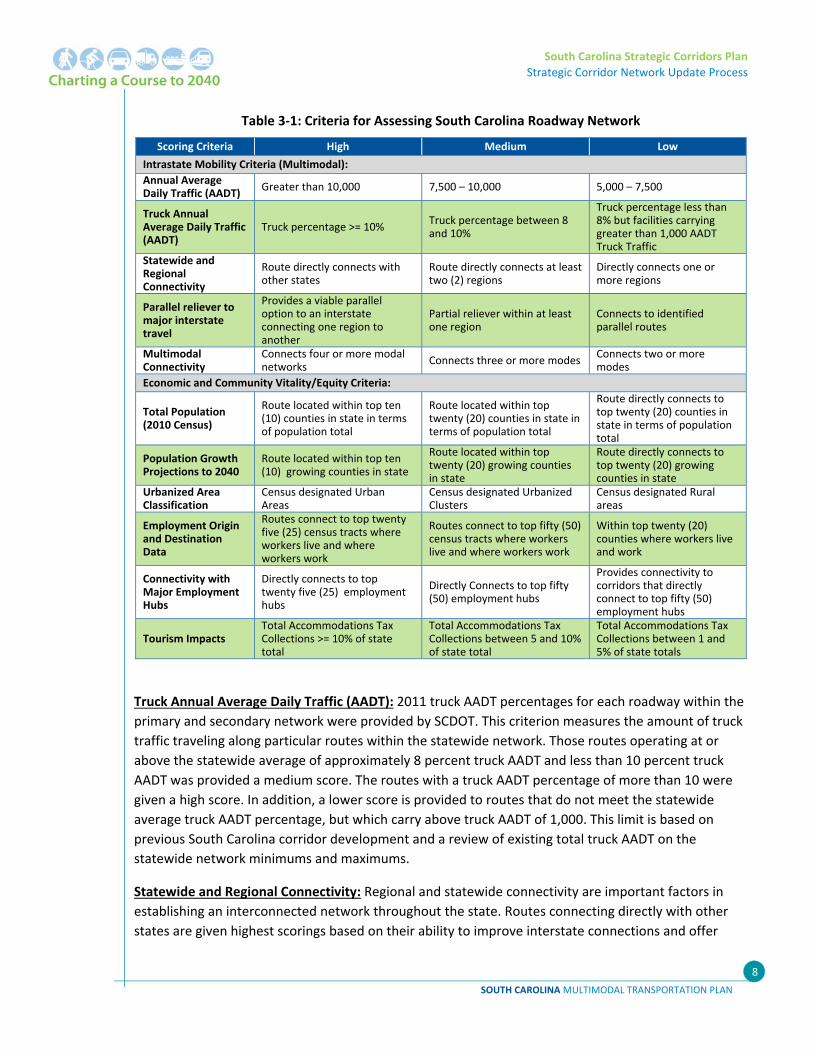
For each of the criteria, the roadways were categorized on a three scale rating – Low (1), Medium (2)
and High (3). The thresholds for determining the three scale ratings for each of the criteria are
summarized in Table 3‐1 and explained below. After assessing the roadway network for each criterion,
a cumulative score for the roadway network was developed by adding the individual values of each
criterion. This cumulative scoring is utilized in the second step and is explained in the subsequent
section.
The following sections describe sources of the data for each criterion described in Table 3‐1 and how
the high, medium and low categories were determined.
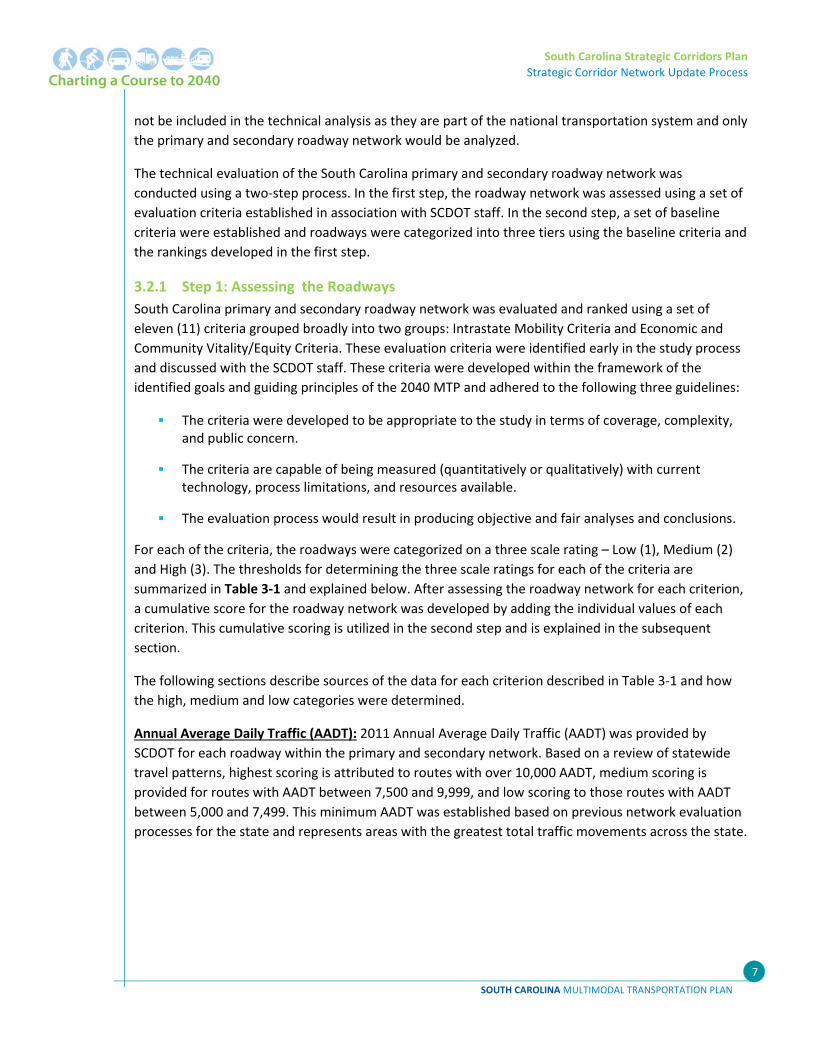
Annual Average Daily Traffic (AADT): 2011 Annual Average Daily Traffic (AADT) was provided by
SCDOT for each roadway within the primary and secondary network. Based on a review of statewide
travel patterns, highest scoring is attributed to routes with over 10,000 AADT, medium scoring is
provided for routes with AADT between 7,500 and 9,999, and low scoring to those routes with AADT
between 5,000 and 7,499. This minimum AADT was established based on previous network evaluation
processes for the state and represents areas with the greatest total traffic movements across the state.
South Carolina Strategic Corridors Plan
Strategic Corridor Network Update Process
SOUTH CAROLINA MULTIMODAL TRANSPORTATION PLAN
8
Table 3‐1: Criteria for Assessing South Carolina Roadway Network
Scoring Criteria High Medium Low
Intrastate Mobility Criteria (Multimodal):
Annual Average Daily Traffic (AADT)
Greater than 10,000 7,500 – 10,000 5,000 – 7,500
Truck Annual Average Daily Traffic (AADT)
Truck percentage >= 10% Truck percentage between 8 and 10%
Truck percentage less than 8% but facilities carrying greater than 1,000 AADT Truck Traffic
Statewide and Regional Connectivity
Route directly connects with other states
Route directly connects at least two (2) regions
Directly connects one or more regions
Parallel reliever to major interstate travel
Provides a viable parallel option to an interstate connecting one region to another
Partial reliever within at least one region
Connects to identified parallel routes
Multimodal Connectivity
Connects four or more modal networks
Connects three or more modes Connects two or more modes
Economic and Community Vitality/Equity Criteria:
Total Population (2010 Census)
Route located within top ten (10) counties in state in terms of population total
Route located within top twenty (20) counties in state in terms of population total
Route directly connects to top twenty (20) counties in state in terms of population total
Population Growth Projections to 2040
Route located within top ten (10) growing counties in state
Route located within top twenty (20) growing counties in state
Route directly connects to top twenty (20) growing counties in state
Urbanized Area Classification
Census designated Urban Areas
Census designated Urbanized Clusters
Census designated Rural areas
Employment Origin and Destination Data
Routes connect to top twenty five (25) census tracts where workers live and where workers work
Routes connect to top fifty (50) census tracts where workers live and where workers work
Within top twenty (20) counties where workers live and work
Connectivity with Major Employment Hubs
Directly connects to top twenty five (25) employment hubs
Directly Connects to top fifty (50) employment hubs
Provides connectivity to corridors that directly connect to top fifty (50) employment hubs
Tourism Impacts Total Accommodations Tax Collections >= 10% of state total
Total Accommodations Tax Collections between 5 and 10% of state total
Total Accommodations Tax Collections between 1 and 5% of state totals
Truck Annual Average Daily Traffic (AADT): 2011 truck AADT percentages for each roadway within the
primary and secondary network were provided by SCDOT. This criterion measures the amount of truck
traffic traveling along particular routes within the statewide network. Those routes operating at or
above the statewide average of approximately 8 percent truck AADT and less than 10 percent truck
AADT was provided a medium score. The routes with a truck AADT percentage of more than 10 were
given a high score. In addition, a lower score is provided to routes that do not meet the statewide
average truck AADT percentage, but which carry above truck AADT of 1,000. This limit is based on
previous South Carolina corridor development and a review of existing total truck AADT on the
statewide network minimums and maximums.
Statewide and Regional Connectivity: Regional and statewide connectivity are important factors in
establishing an interconnected network throughout the state. Routes connecting directly with other
states are given highest scorings based on their ability to improve interstate connections and offer
South Carolina Strategic Corridors Plan
Strategic Corridor Network Update Process
SOUTH CAROLINA MULTIMODAL TRANSPORTATION PLAN
9
viable alternatives to congested interstate corridors. In addition, those routes connecting multiple
regions within the state are given medium scorings due to their ability to improve mobility within and
throughout the state. Minimum criteria to be eligible for meeting statewide and regional connectivity
needs require consideration to routes that connect to at least one other region within the statewide
network. These connectivity scores assist in providing the greatest emphasis on routes that facilitate
high capacity through movements within and outside of the state.
Parallel Reliever Potential: Given the substantial amount of rural and urban clusters within the state,
local travel within and connecting to adjacent regions are often accomplished by utilizing the interstate
network rather than other roadway networks. This can often result in premature degradation of the
interstate roadway and increased capacity and maintenance costs to the state. Providing reliable
parallel facilities to meet local and regional travel demands are therefore important to maintaining and
enhancing the interstate and statewide mobility. Scoring was established to provide the highest
scoring for potential parallel relievers to the interstate that could serve to better connect multiple
regions and medium scores to those routes that provide parallel routes within one region or more.
Additional, but lower scoring is provided to account for routes connecting to these identified potential
relievers which could be used to enhance parallel reliever potential within and throughout regions.
Multimodal Connectivity: Multimodal connectivity is recognized as a way to enhance the efficiency of
statewide and interregional travel by providing greater options for moving people and goods in an
intermodal network. These routes are important to the state in terms of their ability to impact modal
shifts for both people and freight movements. Multimodal criteria considered includes route
connectivity to adjacent interstates, ports, airports, freight rail, passenger rail, interregional transit,
and the statewide bicycle network. Greatest rankings for these criteria are given to corridors with the
greatest number of connections to other modes. At a minimum, to qualify as a statewide strategic
corridor, the corridor must provide connectivity between at least two modes.
Population Totals and Population Growth to 2040: One measure of equity in the statewide strategic
corridor identification process is to provide the greatest mobility for the greatest number of people. As
such, two separate population criteria have been provided. Population totals in counties with the
largest number of people, based on 2010 Census data, is one factor to consider and has been scored
based on how many people are served. In addition, population growth is equally important in
understanding the top growing areas regardless of actual size of the population. These areas are
expected to place increasing demands on statewide transportation resources over the 2040 horizon,
and represent most recent population projection data provided by SCDOT. Connections to these routes
that serve major population clusters and growing areas are also important to provide a complete
network to serve people now and into the future, and are therefore attributed a smaller portion of
scoring for these criteria.
Census Urbanized Area Classifications: Another measure of equity in serving the greatest number of
people in the state are designated urban and rural boundaries. These are established by the U.S.
Census Bureau every ten (10) years, with the most recent designations in 2010. Rankings of high,
medium, and low rankings have been assigned to account for areas designated by the Census as
South Carolina Strategic Corridors Plan
Strategic Corridor Network Update Process
SOUTH CAROLINA MULTIMODAL TRANSPORTATION PLAN
10
urbanized areas of 50,000 or more people, urban clusters consisting of at least 2,500 people but less
than 50,000, and rural areas that encompass all population, housing and territory outside of an urban
area. These boundaries are established without regard to local or regional boundaries and are instead
based on urban density and growth patterns. Highest scores are provided to urban areas and urban
clusters; however, rural areas have also been identified in this scoring system due to the large
population within the state that is located in designated rural areas.
Employment Impacts: Providing greater connectivity to employment hubs in the state and areas
where concentrations of workers live and work not only provides a way to measure and evaluate
mobility, but is also an indicator for establishing strategic corridors that serve to improve the economic
vitality of the state. Major employment hubs, measured in terms of total employment in 2012, were
provided by the Department of Commerce. In addition, 2011 U.S. Census Longitudinal Employee‐
Household Dynamics (LEHD) data is used to evaluate locations with the greatest concentrations of
employment in the state as well as the greatest concentrations of places where workers live. Scoring
was attributed to routes directly connecting to the largest employers in the state or to routes
connecting these direct routes, as well as to routes connecting to the greatest concentrations of
worker origins and destinations.
Tourism Impacts: Tourism is a major source for economic development in the state. Developing a safe,
connected and easily accessible transportation network is important for maintaining and enhancing
economic development opportunities for tourism within the state. Ultimately, these transportation
investments equate to a greater return on investment for the state in that they translate directly into
the state’s tax base. Total accommodations tax collections for 2011 for counties within the state
obtained from SCDOT were used to score routes within concentrated tourism counties. The greatest
number of points is attributed to routes within counties that contribute the greatest amount in these
accommodations taxes.
3.2.2 Step 2: Develop Tiered Corridors
In the second step, corridor baseline criteria which represent factors that are expected to provide the
greatest benefit to statewide and national goals of safety, security and supporting interstate mobility
were established. These criteria along with the ranking developed from step 1 were used to establish a
three‐tiered corridor system for the state. The baseline criteria included the following routes and
connectors:
Non‐Interstate Designated National Highway System Route Designated South Carolina Strategic Freight Network Designated STRAHNET (Military) or STRAHNET Connector Designated Statewide Evacuation Route Federally Approved Intermodal Connector
A three‐tiered Statewide Strategic Corridor Network was developed as a part of the 2040 MTP. The
South Carolina primary and secondary roadway network is classified into three tiers using the following
conditions:
South Carolina Strategic Corridors Plan
Strategic Corridor Network Update Process
SOUTH CAROLINA MULTIMODAL TRANSPORTATION PLAN
11
Tier 1: The Tier 1 Corridors include roadways that meet any of the baseline criteria AND receive a high cumulative score for the evaluation criteria in step 1.
Tier 2: The Tier 2 Corridors include roadways that meet any of the baseline criteria AND receive a medium cumulative score for the evaluation criteria in step 1.
Tier 3: The Tier 3 Corridors include roadways that meet any of the baseline criteria AND receive a low cumulative score for the evaluation criteria in step 1. In addition, the Tier 3 corridors also include roadways that do not meet any of the baseline criteria AND receive a high cumulative score for the evaluation criteria in step 1.
The clustering of the roadways into the three tiers was achieved through a Geographic Information
System (GIS) feature called “natural breaks.” The natural breaks function divided the segments into
three groups by minimizing the variance in each of the groups. The technical analysis forms a solid
basis from which refinements were made based on a number of supplementary factors and public and
stakeholder input.
3.3 System Refinements and Stakeholder Input The technical analysis identified high‐activity highway segments; however, these individual segments
required refinement into longer corridors. This was accomplished through an iterative process so as to
ensure that the Statewide Strategic Corridor Network connects to an existing National or State
Highway or terminate at the state border.
Public and stakeholder input were solicited on the Statewide Strategic Corridor Network during a
series of meetings to be held in April 2013. The comments received from the representatives of
Metropolitan Planning Organizations (MPOs) and Council of Governments (COGs) was addressed and a
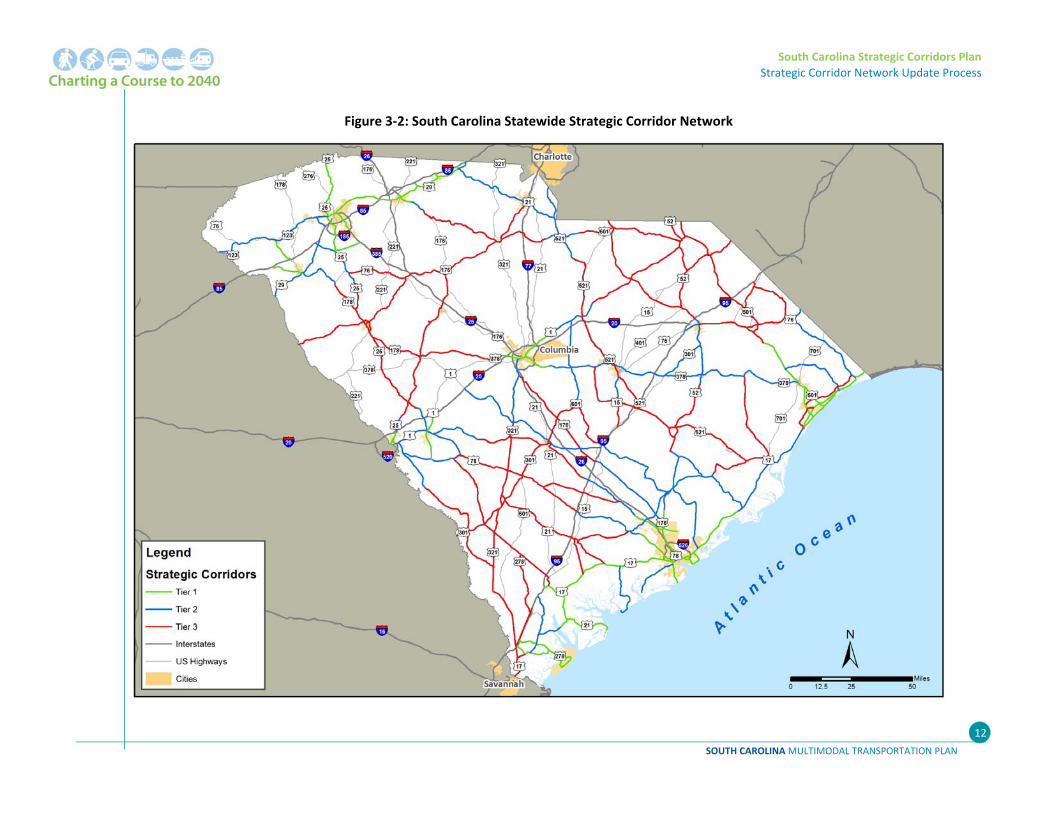
final version of the Statewide Strategic Corridor was developed as shown in Figure 3‐2. The Statewide
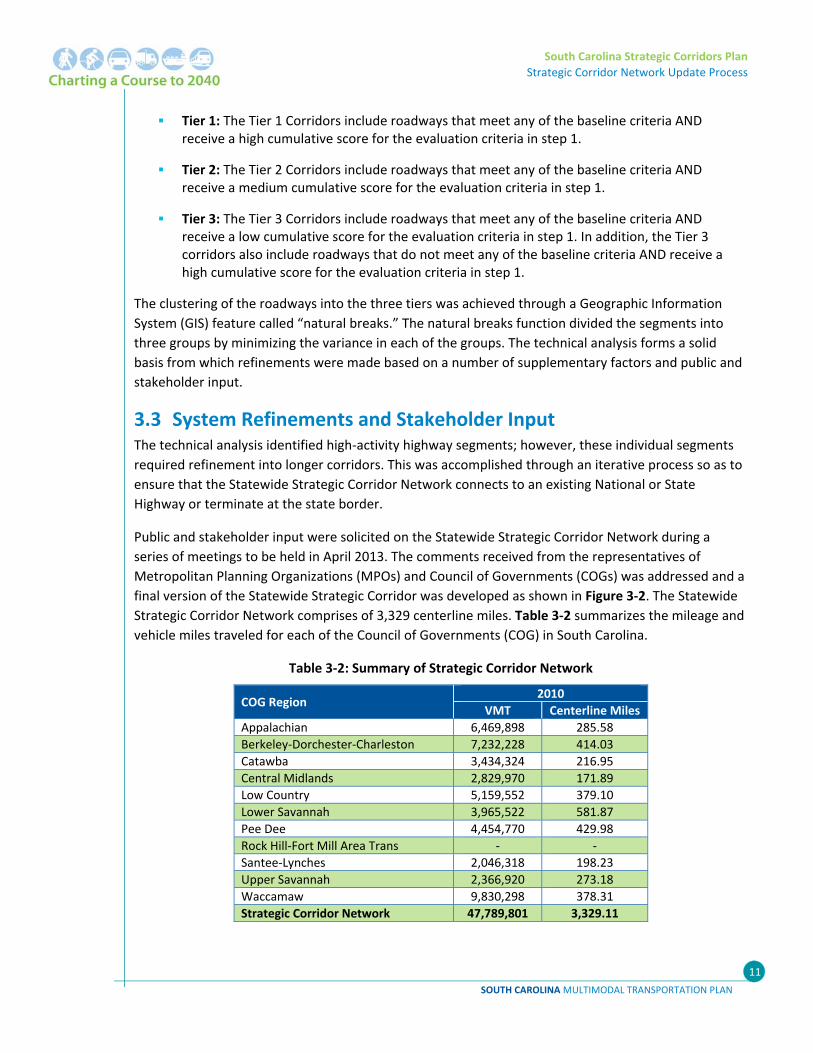
Strategic Corridor Network comprises of 3,329 centerline miles. Table 3‐2 summarizes the mileage and
vehicle miles traveled for each of the Council of Governments (COG) in South Carolina.
Table 3‐2: Summary of Strategic Corridor Network
COG Region 2010
VMT Centerline Miles
Appalachian 6,469,898 285.58
Berkeley‐Dorchester‐Charleston 7,232,228 414.03
Catawba 3,434,324 216.95
Central Midlands 2,829,970 171.89
Low Country 5,159,552 379.10
Lower Savannah 3,965,522 581.87
Pee Dee 4,454,770 429.98
Rock Hill‐Fort Mill Area Trans ‐ ‐
Santee‐Lynches 2,046,318 198.23
Upper Savannah 2,366,920 273.18
Waccamaw 9,830,298 378.31
Strategic Corridor Network 47,789,801 3,329.11
South Carolina Strategic Corridors Plan
Strategic Corridor Network Update Process
SOUTH CAROLINA MULTIMODAL TRANSPORTATION PLAN
12
Figure 3‐2: South Carolina Statewide Strategic Corridor Network
SOUTH CAROLINA MULTIMODAL TRANSPORTATION PLAN
13
4. MULTIMODAL NEEDS IDENTIFIED BY MPOS AND COGS
This chapter identifies the multimodal needs on the Statewide Strategic Corridor Network.
4.1 Methodology After the Statewide Strategic Corridor Network was updated, a methodology for identifying the
multimodal needs on the corridors was developed. The following topics formed the basis for
identifying the multimodal needs.
Review of MPO/COG Plans: MPO/COG plans along the Statewide Strategic Corridors were reviewed to identify improvements that have already been identified to address corridor needs.
Corridor Delay and Deficiencies: Corridor delay and deficiencies was identified using INRIX vehicle probe data.
Level of Service (LOS): LOS for rural and urban sections is an output of the statewide travel demand model.
Multimodal Criteria: Multimodal criteria detailing areas where shoulders, corridors with existing or planned public transit routes and other criteria to help capture other modes.
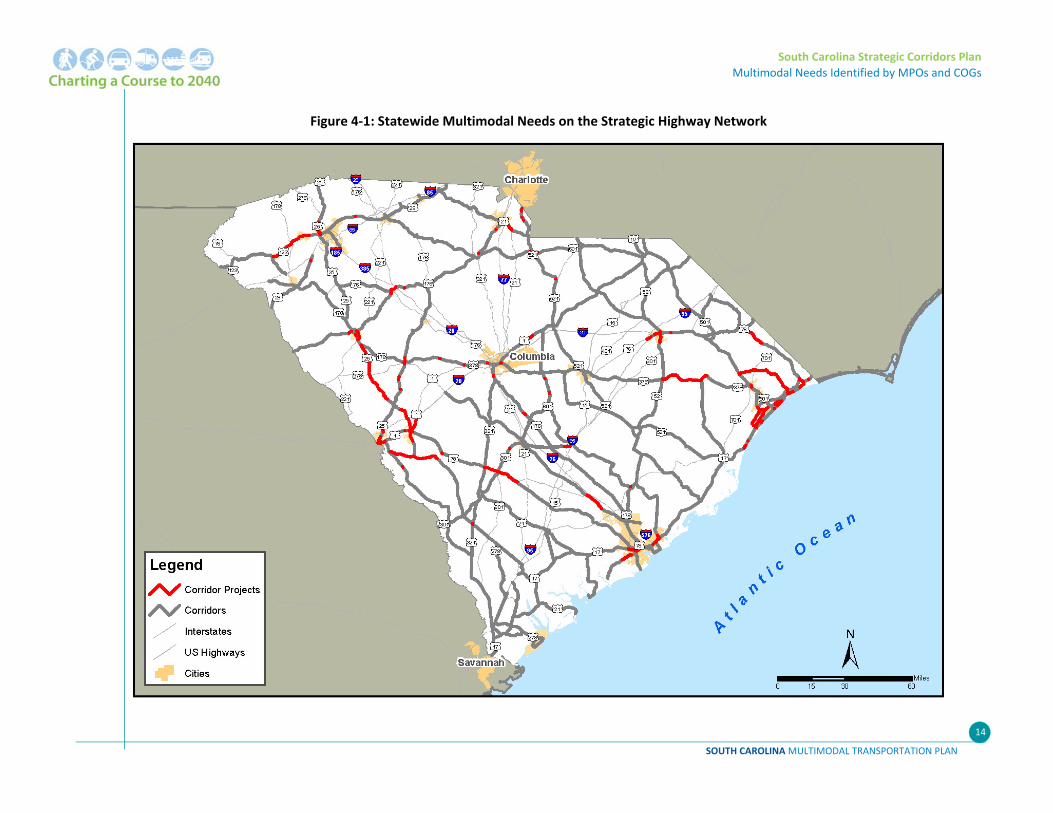
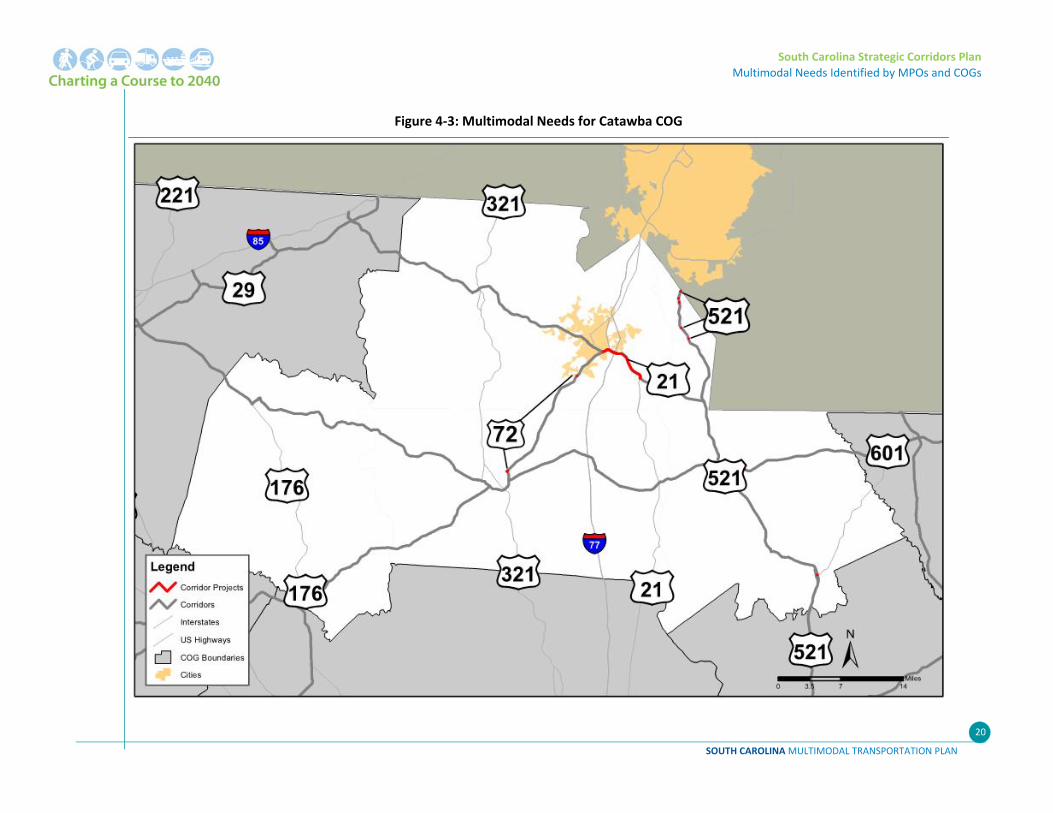
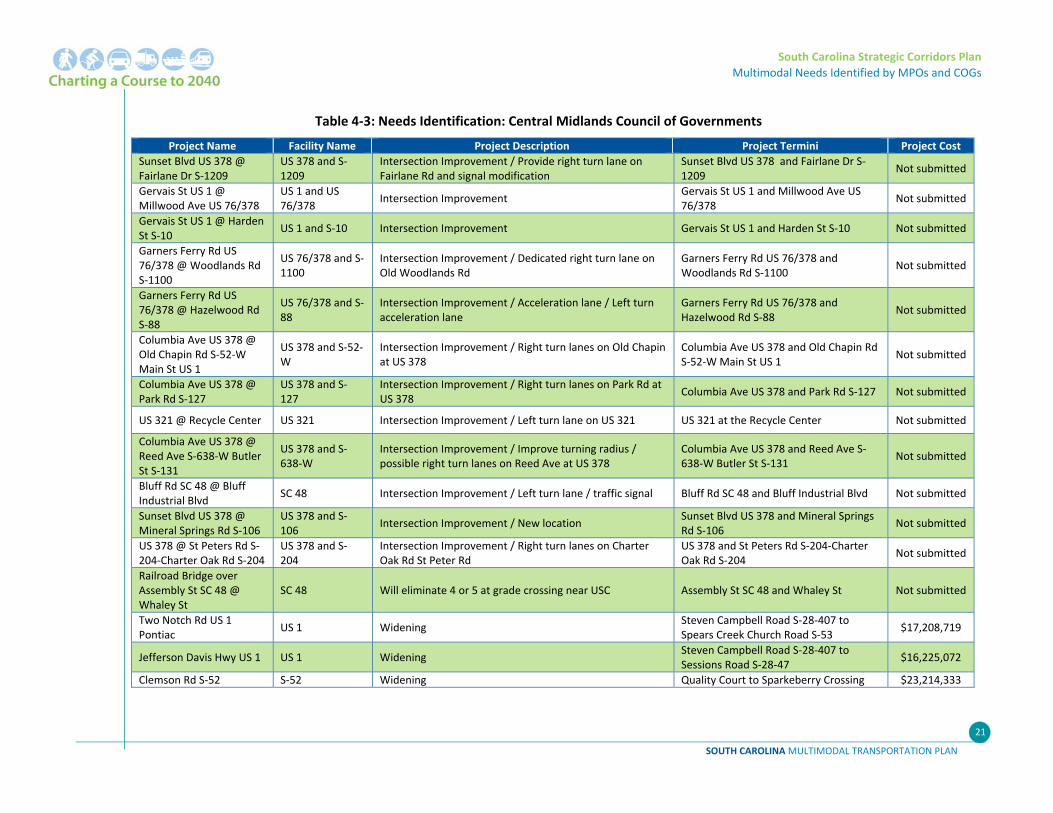
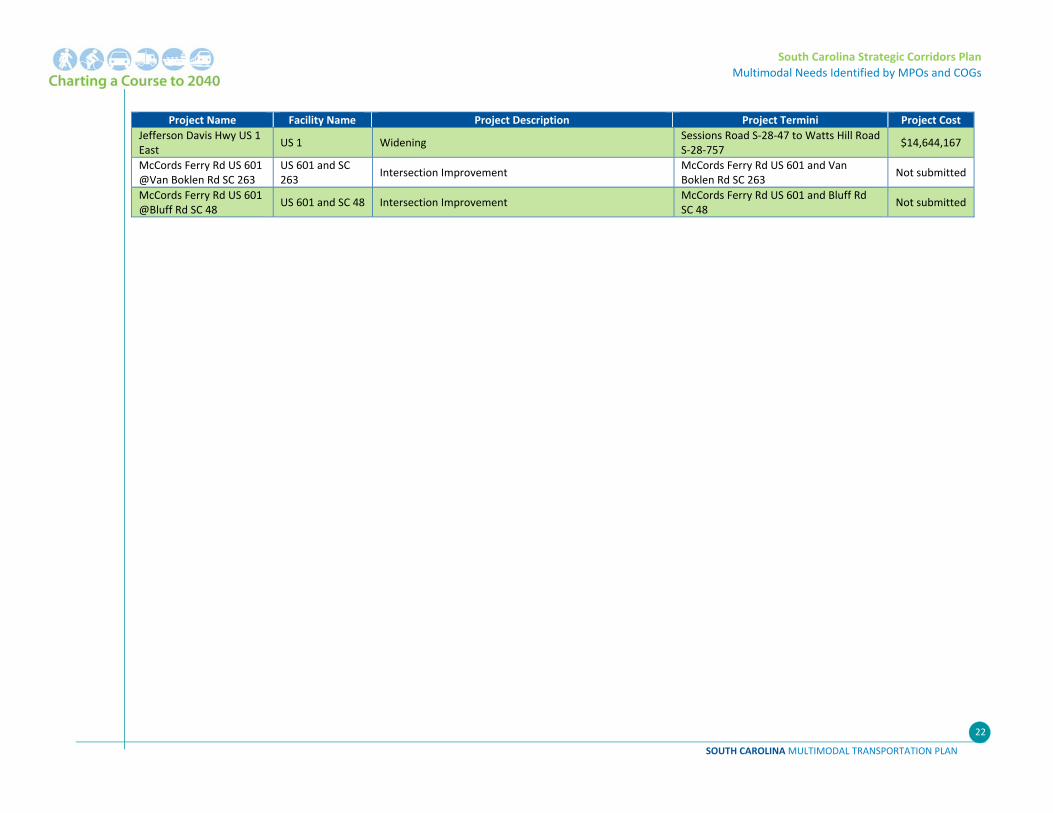
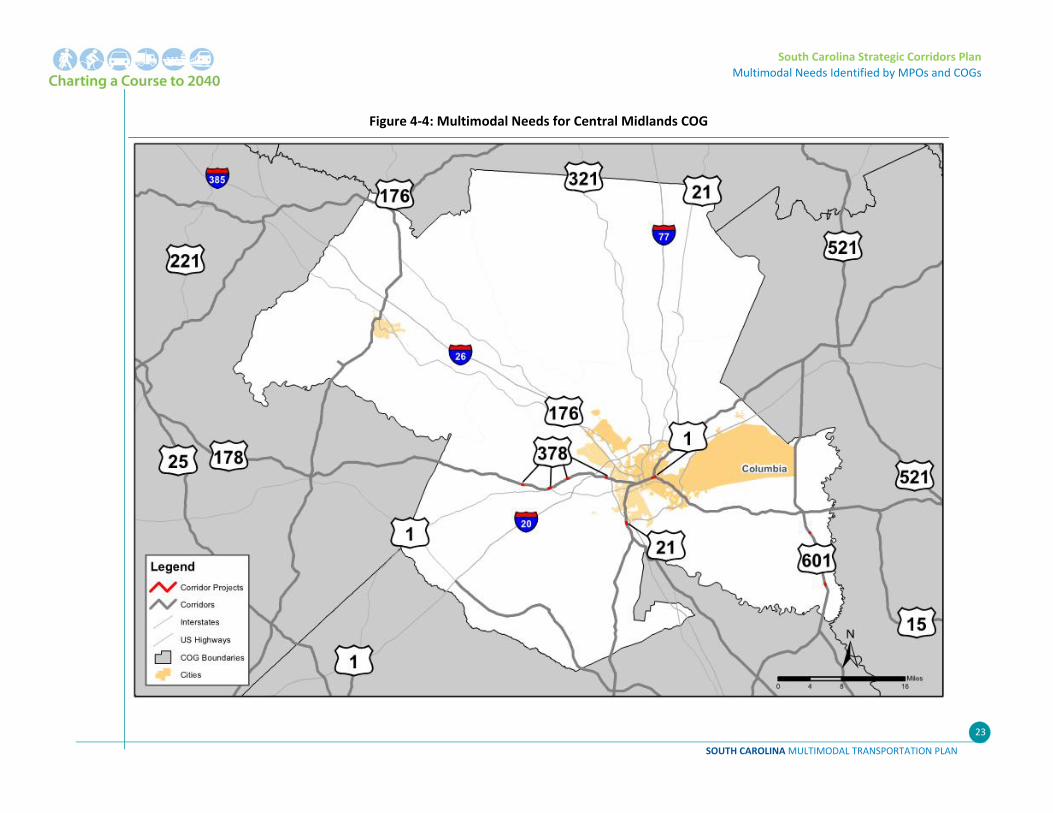
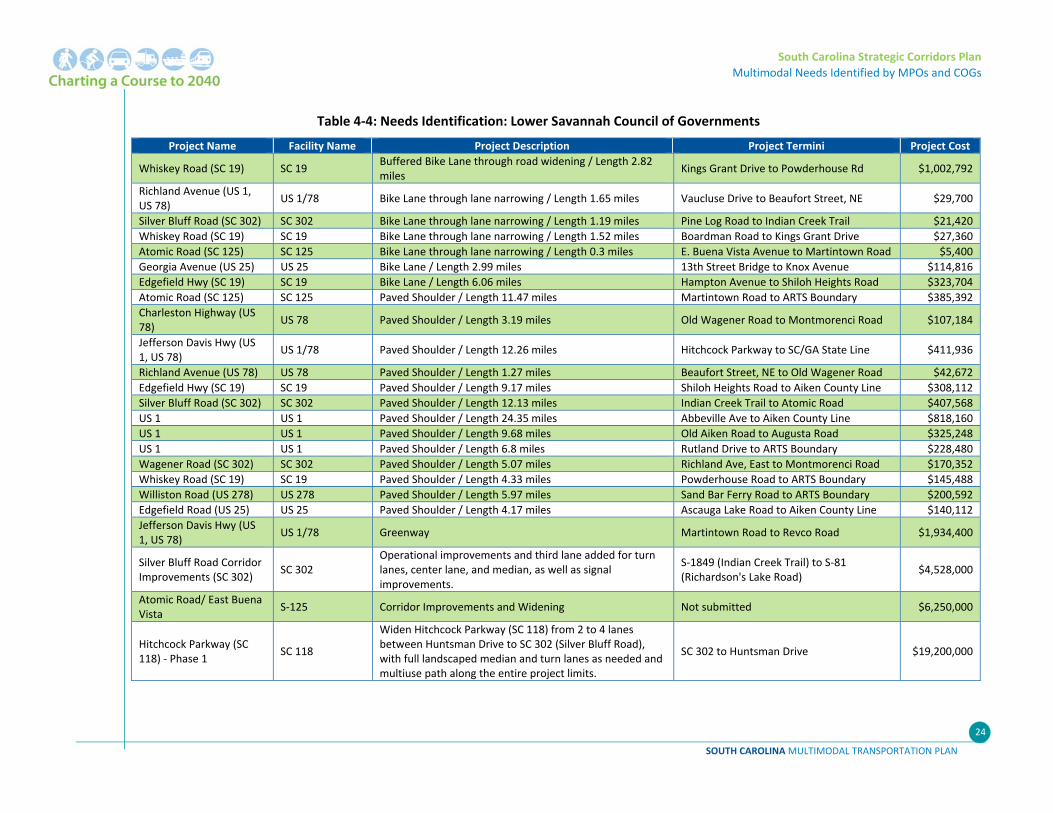
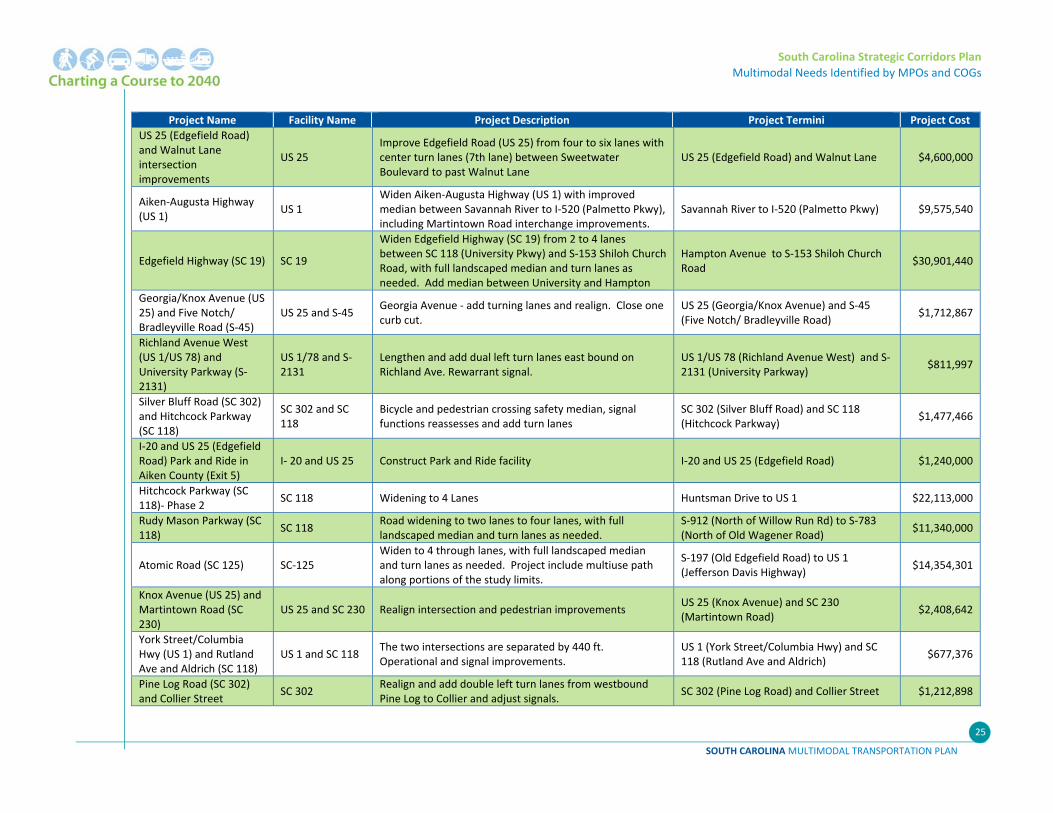
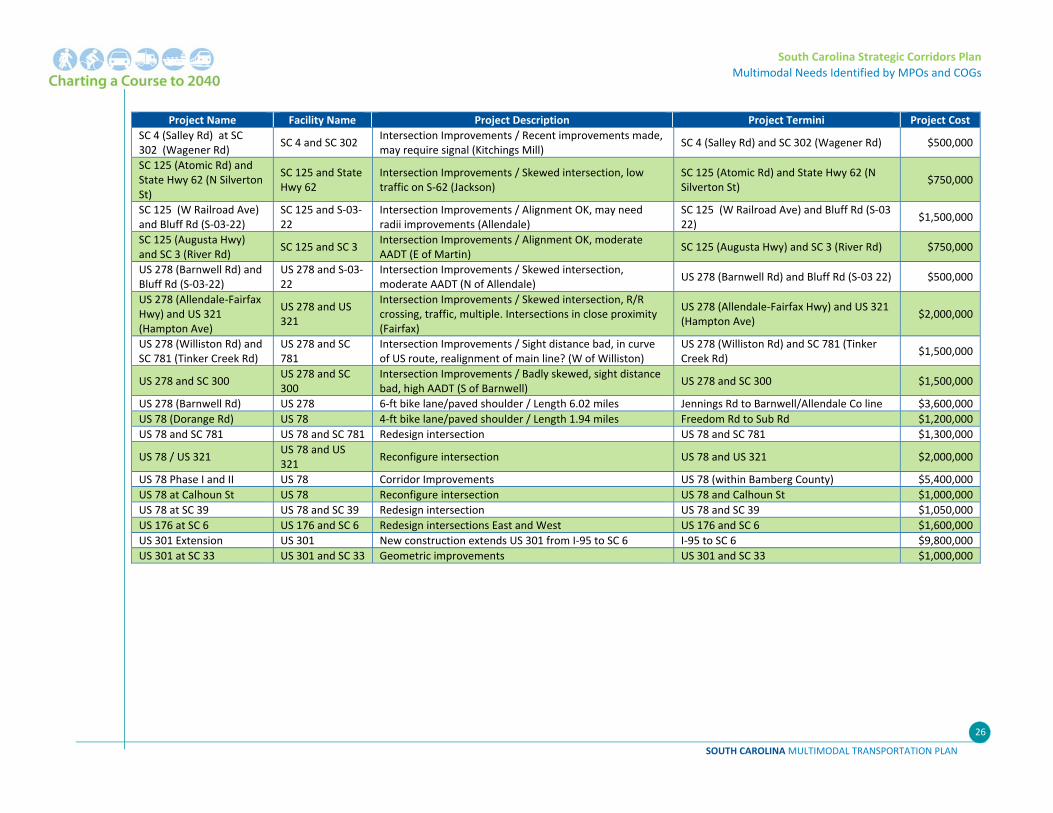
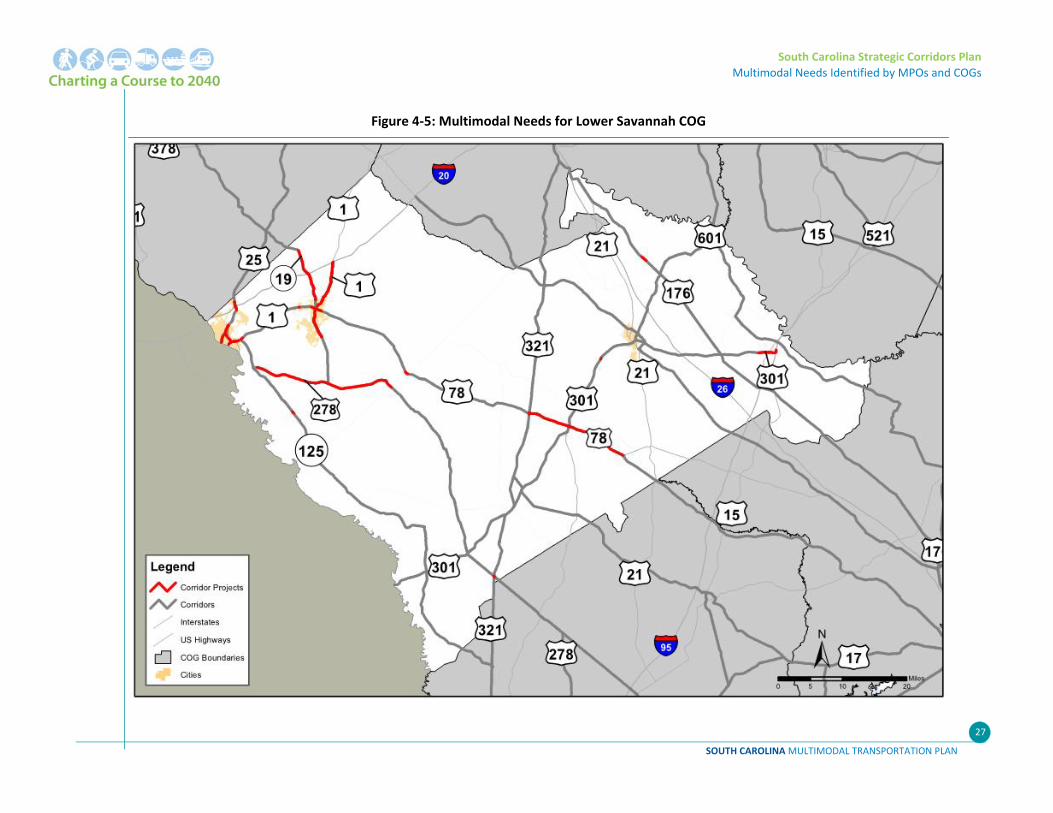
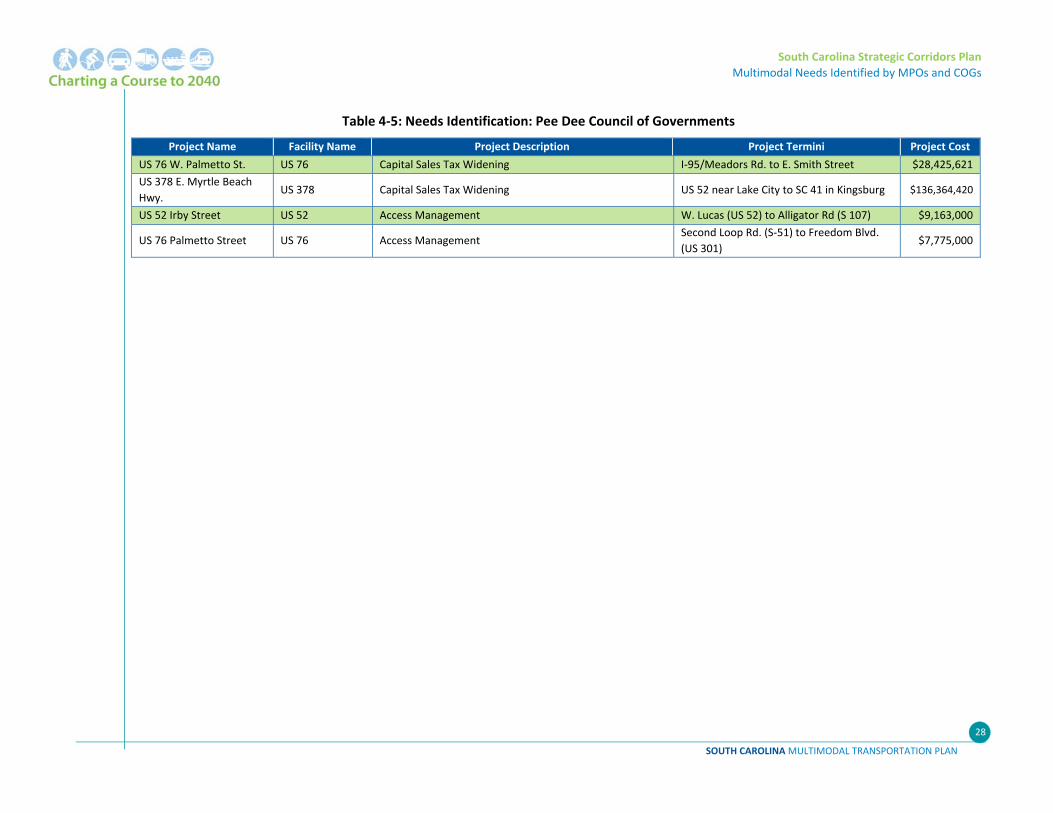
4.2 MPO/COG Needs Local MPOs and COGs provided transportation needs and associated costs along the Statewide
Strategic Corridor network within their jurisdictions. The transportation needs identified include
intersection improvements, roadway widening, alternative transportation improvements, and other
forms of enhancement projects. The transportation needs were used to develop the following map
series (Figure 4‐1 through Figure 4‐9), presented statewide and by COG area. Table 4‐1 through Table
4‐8 provide a detailed list of the transportation needs identified by the MPOs and COGs on the
Statewide Strategic Corridor Network, with needs organized by COG area.
South Carolina Strategic Corridors Plan
Multimodal Needs Identified by MPOs and COGs
SOUTH CAROLINA MULTIMODAL TRANSPORTATION PLAN
14
Figure 4‐1: Statewide Multimodal Needs on the Strategic Highway Network
South Carolina Strategic Corridors Plan
Multimodal Needs Identified by MPOs and COGs
SOUTH CAROLINA MULTIMODAL TRANSPORTATION PLAN
15
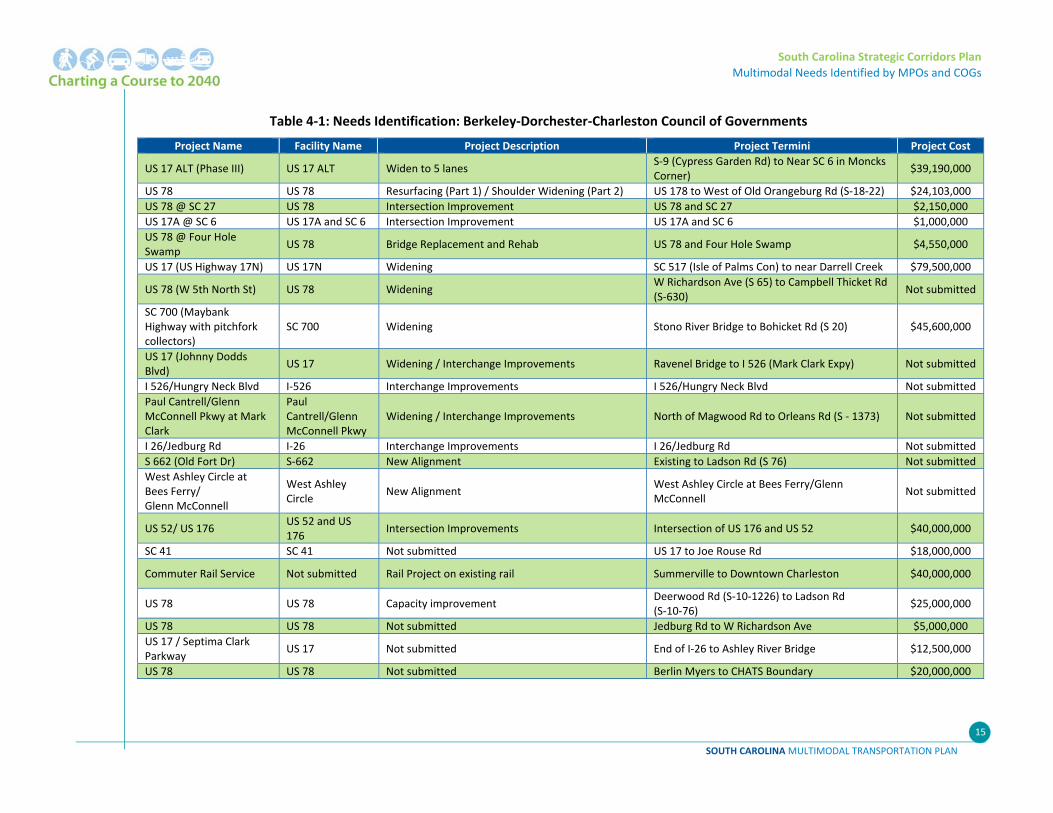
Table 4‐1: Needs Identification: Berkeley‐Dorchester‐Charleston Council of Governments
Project Name Facility Name Project Description Project Termini Project Cost
US 17 ALT (Phase III) US 17 ALT Widen to 5 lanes S‐9 (Cypress Garden Rd) to Near SC 6 in Moncks Corner)
$39,190,000
US 78 US 78 Resurfacing (Part 1) / Shoulder Widening (Part 2) US 178 to West of Old Orangeburg Rd (S‐18‐22) $24,103,000
US 78 @ SC 27 US 78 Intersection Improvement US 78 and SC 27 $2,150,000
US 17A @ SC 6 US 17A and SC 6 Intersection Improvement US 17A and SC 6 $1,000,000
US 78 @ Four Hole Swamp
US 78 Bridge Replacement and Rehab US 78 and Four Hole Swamp $4,550,000
US 17 (US Highway 17N) US 17N Widening SC 517 (Isle of Palms Con) to near Darrell Creek $79,500,000
US 78 (W 5th North St) US 78 Widening W Richardson Ave (S 65) to Campbell Thicket Rd (S‐630)
Not submitted
SC 700 (Maybank Highway with pitchfork collectors)
SC 700 Widening Stono River Bridge to Bohicket Rd (S 20) $45,600,000
US 17 (Johnny Dodds Blvd)
US 17 Widening / Interchange Improvements Ravenel Bridge to I 526 (Mark Clark Expy) Not submitted
I 526/Hungry Neck Blvd I‐526 Interchange Improvements I 526/Hungry Neck Blvd Not submitted
Paul Cantrell/Glenn McConnell Pkwy at Mark Clark
Paul Cantrell/Glenn McConnell Pkwy
Widening / Interchange Improvements North of Magwood Rd to Orleans Rd (S ‐ 1373) Not submitted
I 26/Jedburg Rd I‐26 Interchange Improvements I 26/Jedburg Rd Not submitted
S 662 (Old Fort Dr) S‐662 New Alignment Existing to Ladson Rd (S 76) Not submitted
West Ashley Circle at Bees Ferry/ Glenn McConnell
West Ashley Circle
New Alignment West Ashley Circle at Bees Ferry/Glenn McConnell
Not submitted
US 52/ US 176 US 52 and US 176
Intersection Improvements Intersection of US 176 and US 52 $40,000,000
SC 41 SC 41 Not submitted US 17 to Joe Rouse Rd $18,000,000
Commuter Rail Service Not submitted Rail Project on existing rail Summerville to Downtown Charleston $40,000,000
US 78 US 78 Capacity improvement Deerwood Rd (S‐10‐1226) to Ladson Rd (S‐10‐76)
$25,000,000
US 78 US 78 Not submitted Jedburg Rd to W Richardson Ave $5,000,000
US 17 / Septima Clark Parkway
US 17 Not submitted End of I‐26 to Ashley River Bridge $12,500,000
US 78 US 78 Not submitted Berlin Myers to CHATS Boundary $20,000,000
South Carolina Strategic Corridors Plan
Multimodal Needs Identified by MPOs and COGs
SOUTH CAROLINA MULTIMODAL TRANSPORTATION PLAN
16
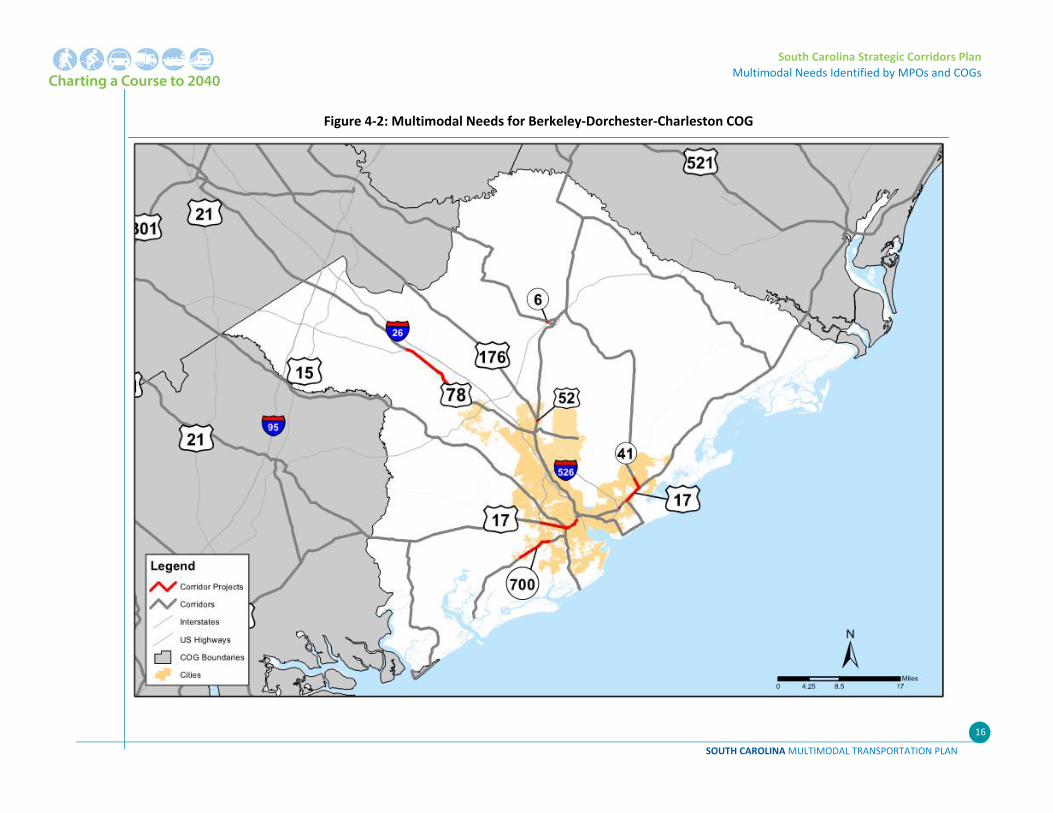
Figure 4‐2: Multimodal Needs for Berkeley‐Dorchester‐Charleston COG
South Carolina Strategic Corridors Plan
Multimodal Needs Identified by MPOs and COGs
SOUTH CAROLINA MULTIMODAL TRANSPORTATION PLAN
17
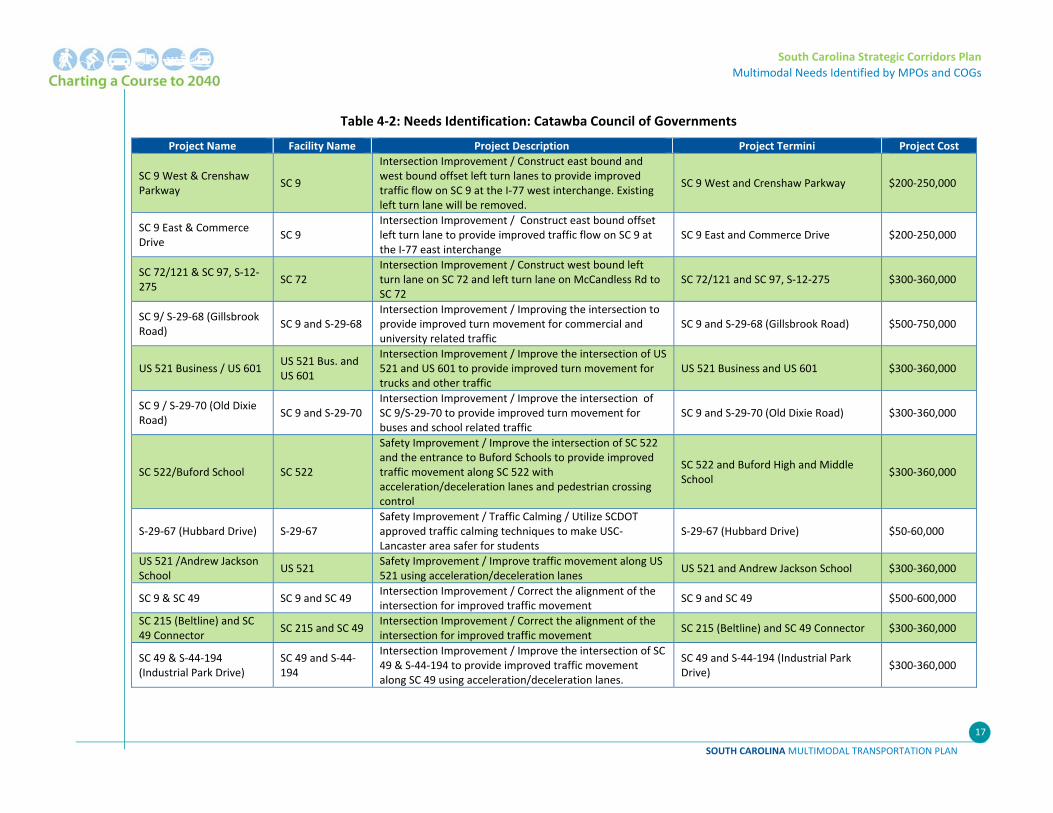
Table 4‐2: Needs Identification: Catawba Council of Governments
Project Name Facility Name Project Description Project Termini Project Cost
SC 9 West & Crenshaw Parkway
SC 9
Intersection Improvement / Construct east bound and west bound offset left turn lanes to provide improved traffic flow on SC 9 at the I‐77 west interchange. Existing left turn lane will be removed.
SC 9 West and Crenshaw Parkway $200‐250,000
SC 9 East & Commerce Drive
SC 9 Intersection Improvement / Construct east bound offset left turn lane to provide improved traffic flow on SC 9 at the I‐77 east interchange
SC 9 East and Commerce Drive $200‐250,000
SC 72/121 & SC 97, S‐12‐275
SC 72 Intersection Improvement / Construct west bound left turn lane on SC 72 and left turn lane on McCandless Rd to SC 72
SC 72/121 and SC 97, S‐12‐275 $300‐360,000
SC 9/ S‐29‐68 (Gillsbrook Road)
SC 9 and S‐29‐68 Intersection Improvement / Improving the intersection to provide improved turn movement for commercial and university related traffic
SC 9 and S‐29‐68 (Gillsbrook Road) $500‐750,000
US 521 Business / US 601 US 521 Bus. and US 601
Intersection Improvement / Improve the intersection of US 521 and US 601 to provide improved turn movement for trucks and other traffic
US 521 Business and US 601 $300‐360,000
SC 9 / S‐29‐70 (Old Dixie Road)
SC 9 and S‐29‐70 Intersection Improvement / Improve the intersection of SC 9/S‐29‐70 to provide improved turn movement for buses and school related traffic
SC 9 and S‐29‐70 (Old Dixie Road) $300‐360,000
SC 522/Buford School SC 522
Safety Improvement / Improve the intersection of SC 522 and the entrance to Buford Schools to provide improved traffic movement along SC 522 with acceleration/deceleration lanes and pedestrian crossing control
SC 522 and Buford High and Middle School
$300‐360,000
S‐29‐67 (Hubbard Drive) S‐29‐67 Safety Improvement / Traffic Calming / Utilize SCDOT approved traffic calming techniques to make USC‐Lancaster area safer for students
S‐29‐67 (Hubbard Drive) $50‐60,000
US 521 /Andrew Jackson School
US 521 Safety Improvement / Improve traffic movement along US 521 using acceleration/deceleration lanes
US 521 and Andrew Jackson School $300‐360,000
SC 9 & SC 49 SC 9 and SC 49 Intersection Improvement / Correct the alignment of the intersection for improved traffic movement
SC 9 and SC 49 $500‐600,000
SC 215 (Beltline) and SC 49 Connector
SC 215 and SC 49 Intersection Improvement / Correct the alignment of the intersection for improved traffic movement
SC 215 (Beltline) and SC 49 Connector $300‐360,000
SC 49 & S‐44‐194 (Industrial Park Drive)
SC 49 and S‐44‐194
Intersection Improvement / Improve the intersection of SC 49 & S‐44‐194 to provide improved traffic movement along SC 49 using acceleration/deceleration lanes.
SC 49 and S‐44‐194 (Industrial Park Drive)
$300‐360,000
South Carolina Strategic Corridors Plan
Multimodal Needs Identified by MPOs and COGs
SOUTH CAROLINA MULTIMODAL TRANSPORTATION PLAN
18
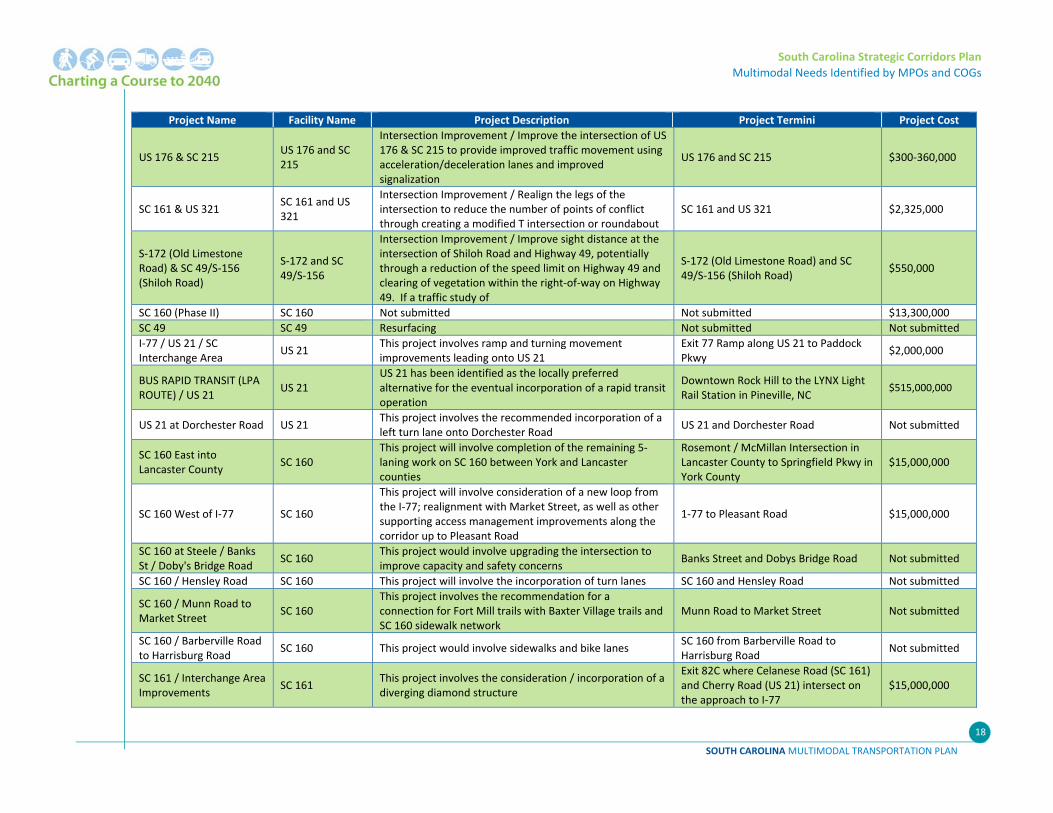
Project Name Facility Name Project Description Project Termini Project Cost
US 176 & SC 215 US 176 and SC 215
Intersection Improvement / Improve the intersection of US 176 & SC 215 to provide improved traffic movement using acceleration/deceleration lanes and improved signalization
US 176 and SC 215 $300‐360,000
SC 161 & US 321 SC 161 and US 321
Intersection Improvement / Realign the legs of the intersection to reduce the number of points of conflict through creating a modified T intersection or roundabout
SC 161 and US 321 $2,325,000
S‐172 (Old Limestone Road) & SC 49/S‐156 (Shiloh Road)
S‐172 and SC 49/S‐156
Intersection Improvement / Improve sight distance at the intersection of Shiloh Road and Highway 49, potentially through a reduction of the speed limit on Highway 49 and clearing of vegetation within the right‐of‐way on Highway 49. If a traffic study of
S‐172 (Old Limestone Road) and SC 49/S‐156 (Shiloh Road)
$550,000
SC 160 (Phase II) SC 160 Not submitted Not submitted $13,300,000
SC 49 SC 49 Resurfacing Not submitted Not submitted
I‐77 / US 21 / SC Interchange Area
US 21 This project involves ramp and turning movement improvements leading onto US 21
Exit 77 Ramp along US 21 to Paddock Pkwy
$2,000,000
BUS RAPID TRANSIT (LPA ROUTE) / US 21
US 21 US 21 has been identified as the locally preferred alternative for the eventual incorporation of a rapid transit operation
Downtown Rock Hill to the LYNX Light Rail Station in Pineville, NC
$515,000,000
US 21 at Dorchester Road US 21 This project involves the recommended incorporation of a left turn lane onto Dorchester Road
US 21 and Dorchester Road Not submitted
SC 160 East into Lancaster County
SC 160 This project will involve completion of the remaining 5‐laning work on SC 160 between York and Lancaster counties
Rosemont / McMillan Intersection in Lancaster County to Springfield Pkwy in York County
$15,000,000
SC 160 West of I‐77 SC 160
This project will involve consideration of a new loop from the I‐77; realignment with Market Street, as well as other supporting access management improvements along the corridor up to Pleasant Road
1‐77 to Pleasant Road $15,000,000
SC 160 at Steele / Banks St / Doby's Bridge Road
SC 160 This project would involve upgrading the intersection to improve capacity and safety concerns
Banks Street and Dobys Bridge Road Not submitted
SC 160 / Hensley Road SC 160 This project will involve the incorporation of turn lanes SC 160 and Hensley Road Not submitted
SC 160 / Munn Road to Market Street
SC 160 This project involves the recommendation for a connection for Fort Mill trails with Baxter Village trails and SC 160 sidewalk network
Munn Road to Market Street Not submitted
SC 160 / Barberville Road to Harrisburg Road
SC 160 This project would involve sidewalks and bike lanes SC 160 from Barberville Road to Harrisburg Road
Not submitted
SC 161 / Interchange Area Improvements
SC 161 This project involves the consideration / incorporation of a diverging diamond structure
Exit 82C where Celanese Road (SC 161) and Cherry Road (US 21) intersect on the approach to I‐77
$15,000,000
South Carolina Strategic Corridors Plan
Multimodal Needs Identified by MPOs and COGs
SOUTH CAROLINA MULTIMODAL TRANSPORTATION PLAN
19
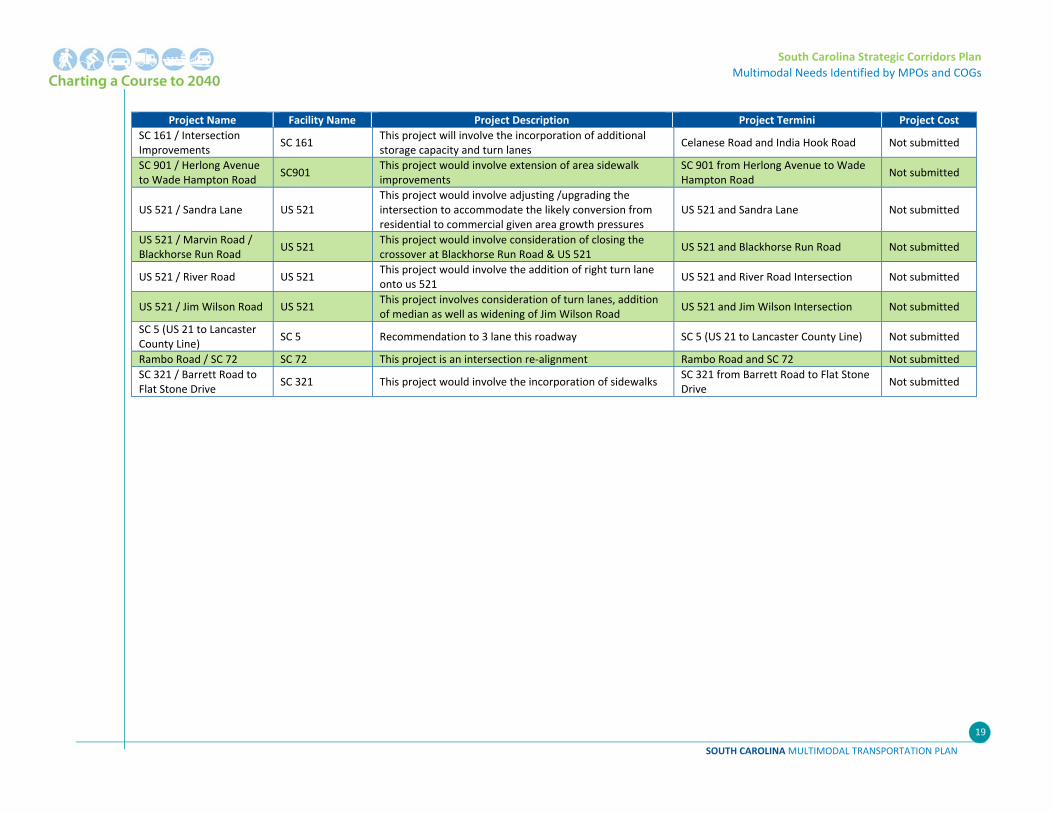
Project Name Facility Name Project Description Project Termini Project Cost
SC 161 / Intersection Improvements
SC 161 This project will involve the incorporation of additional storage capacity and turn lanes
Celanese Road and India Hook Road Not submitted
SC 901 / Herlong Avenue to Wade Hampton Road
SC901 This project would involve extension of area sidewalk improvements
SC 901 from Herlong Avenue to Wade Hampton Road
Not submitted
US 521 / Sandra Lane US 521 This project would involve adjusting /upgrading the intersection to accommodate the likely conversion from residential to commercial given area growth pressures
US 521 and Sandra Lane Not submitted
US 521 / Marvin Road / Blackhorse Run Road
US 521 This project would involve consideration of closing the crossover at Blackhorse Run Road & US 521
US 521 and Blackhorse Run Road Not submitted
US 521 / River Road US 521 This project would involve the addition of right turn lane onto us 521
US 521 and River Road Intersection Not submitted
US 521 / Jim Wilson Road US 521 This project involves consideration of turn lanes, addition of median as well as widening of Jim Wilson Road
US 521 and Jim Wilson Intersection Not submitted
SC 5 (US 21 to Lancaster County Line)
SC 5 Recommendation to 3 lane this roadway SC 5 (US 21 to Lancaster County Line) Not submitted
Rambo Road / SC 72 SC 72 This project is an intersection re‐alignment Rambo Road and SC 72 Not submitted
SC 321 / Barrett Road to Flat Stone Drive
SC 321 This project would involve the incorporation of sidewalks SC 321 from Barrett Road to Flat Stone Drive
Not submitted
South Carolina Strategic Corridors Plan
Multimodal Needs Identified by MPOs and COGs
SOUTH CAROLINA MULTIMODAL TRANSPORTATION PLAN
20
Figure 4‐3: Multimodal Needs for Catawba COG
South Carolina Strategic Corridors Plan
Multimodal Needs Identified by MPOs and COGs
SOUTH CAROLINA MULTIMODAL TRANSPORTATION PLAN
21
Table 4‐3: Needs Identification: Central Midlands Council of Governments
Project Name Facility Name Project Description Project Termini Project Cost
Sunset Blvd US 378 @ Fairlane Dr S‐1209
US 378 and S‐1209
Intersection Improvement / Provide right turn lane on Fairlane Rd and signal modification
Sunset Blvd US 378 and Fairlane Dr S‐1209
Not submitted
Gervais St US 1 @ Millwood Ave US 76/378
US 1 and US 76/378
Intersection Improvement Gervais St US 1 and Millwood Ave US 76/378
Not submitted
Gervais St US 1 @ Harden St S‐10
US 1 and S‐10 Intersection Improvement Gervais St US 1 and Harden St S‐10 Not submitted
Garners Ferry Rd US 76/378 @ Woodlands Rd S‐1100
US 76/378 and S‐1100
Intersection Improvement / Dedicated right turn lane on Old Woodlands Rd
Garners Ferry Rd US 76/378 and Woodlands Rd S‐1100
Not submitted
Garners Ferry Rd US 76/378 @ Hazelwood Rd S‐88
US 76/378 and S‐88
Intersection Improvement / Acceleration lane / Left turn acceleration lane
Garners Ferry Rd US 76/378 and Hazelwood Rd S‐88
Not submitted
Columbia Ave US 378 @ Old Chapin Rd S‐52‐W Main St US 1
US 378 and S‐52‐W
Intersection Improvement / Right turn lanes on Old Chapin at US 378
Columbia Ave US 378 and Old Chapin Rd S‐52‐W Main St US 1
Not submitted
Columbia Ave US 378 @ Park Rd S‐127
US 378 and S‐127
Intersection Improvement / Right turn lanes on Park Rd at US 378
Columbia Ave US 378 and Park Rd S‐127 Not submitted
US 321 @ Recycle Center US 321 Intersection Improvement / Left turn lane on US 321 US 321 at the Recycle Center Not submitted
Columbia Ave US 378 @ Reed Ave S‐638‐W Butler St S‐131
US 378 and S‐638‐W
Intersection Improvement / Improve turning radius / possible right turn lanes on Reed Ave at US 378
Columbia Ave US 378 and Reed Ave S‐638‐W Butler St S‐131
Not submitted
Bluff Rd SC 48 @ Bluff Industrial Blvd
SC 48 Intersection Improvement / Left turn lane / traffic signal Bluff Rd SC 48 and Bluff Industrial Blvd Not submitted
Sunset Blvd US 378 @ Mineral Springs Rd S‐106
US 378 and S‐106
Intersection Improvement / New location Sunset Blvd US 378 and Mineral Springs Rd S‐106
Not submitted
US 378 @ St Peters Rd S‐204‐Charter Oak Rd S‐204
US 378 and S‐204
Intersection Improvement / Right turn lanes on Charter Oak Rd St Peter Rd
US 378 and St Peters Rd S‐204‐Charter Oak Rd S‐204
Not submitted
Railroad Bridge over Assembly St SC 48 @ Whaley St
SC 48 Will eliminate 4 or 5 at grade crossing near USC Assembly St SC 48 and Whaley St Not submitted
Two Notch Rd US 1 Pontiac
US 1 Widening Steven Campbell Road S‐28‐407 to Spears Creek Church Road S‐53
$17,208,719
Jefferson Davis Hwy US 1 US 1 Widening Steven Campbell Road S‐28‐407 to Sessions Road S‐28‐47
$16,225,072
Clemson Rd S‐52 S‐52 Widening Quality Court to Sparkeberry Crossing $23,214,333
South Carolina Strategic Corridors Plan
Multimodal Needs Identified by MPOs and COGs
SOUTH CAROLINA MULTIMODAL TRANSPORTATION PLAN
22
Project Name Facility Name Project Description Project Termini Project Cost
Jefferson Davis Hwy US 1 East
US 1 Widening Sessions Road S‐28‐47 to Watts Hill Road S‐28‐757
$14,644,167
McCords Ferry Rd US 601 @Van Boklen Rd SC 263
US 601 and SC 263
Intersection Improvement McCords Ferry Rd US 601 and Van Boklen Rd SC 263
Not submitted
McCords Ferry Rd US 601 @Bluff Rd SC 48
US 601 and SC 48 Intersection Improvement McCords Ferry Rd US 601 and Bluff Rd SC 48
Not submitted
South Carolina Strategic Corridors Plan
Multimodal Needs Identified by MPOs and COGs
SOUTH CAROLINA MULTIMODAL TRANSPORTATION PLAN
23
Figure 4‐4: Multimodal Needs for Central Midlands COG
South Carolina Strategic Corridors Plan
Multimodal Needs Identified by MPOs and COGs
SOUTH CAROLINA MULTIMODAL TRANSPORTATION PLAN
24
Table 4‐4: Needs Identification: Lower Savannah Council of Governments
Project Name Facility Name Project Description Project Termini Project Cost
Whiskey Road (SC 19) SC 19 Buffered Bike Lane through road widening / Length 2.82 miles
Kings Grant Drive to Powderhouse Rd $1,002,792
Richland Avenue (US 1, US 78)
US 1/78 Bike Lane through lane narrowing / Length 1.65 miles Vaucluse Drive to Beaufort Street, NE $29,700
Silver Bluff Road (SC 302) SC 302 Bike Lane through lane narrowing / Length 1.19 miles Pine Log Road to Indian Creek Trail $21,420
Whiskey Road (SC 19) SC 19 Bike Lane through lane narrowing / Length 1.52 miles Boardman Road to Kings Grant Drive $27,360
Atomic Road (SC 125) SC 125 Bike Lane through lane narrowing / Length 0.3 miles E. Buena Vista Avenue to Martintown Road $5,400
Georgia Avenue (US 25) US 25 Bike Lane / Length 2.99 miles 13th Street Bridge to Knox Avenue $114,816
Edgefield Hwy (SC 19) SC 19 Bike Lane / Length 6.06 miles Hampton Avenue to Shiloh Heights Road $323,704
Atomic Road (SC 125) SC 125 Paved Shoulder / Length 11.47 miles Martintown Road to ARTS Boundary $385,392
Charleston Highway (US 78)
US 78 Paved Shoulder / Length 3.19 miles Old Wagener Road to Montmorenci Road $107,184
Jefferson Davis Hwy (US 1, US 78)
US 1/78 Paved Shoulder / Length 12.26 miles Hitchcock Parkway to SC/GA State Line $411,936
Richland Avenue (US 78) US 78 Paved Shoulder / Length 1.27 miles Beaufort Street, NE to Old Wagener Road $42,672
Edgefield Hwy (SC 19) SC 19 Paved Shoulder / Length 9.17 miles Shiloh Heights Road to Aiken County Line $308,112
Silver Bluff Road (SC 302) SC 302 Paved Shoulder / Length 12.13 miles Indian Creek Trail to Atomic Road $407,568
US 1 US 1 Paved Shoulder / Length 24.35 miles Abbeville Ave to Aiken County Line $818,160
US 1 US 1 Paved Shoulder / Length 9.68 miles Old Aiken Road to Augusta Road $325,248
US 1 US 1 Paved Shoulder / Length 6.8 miles Rutland Drive to ARTS Boundary $228,480
Wagener Road (SC 302) SC 302 Paved Shoulder / Length 5.07 miles Richland Ave, East to Montmorenci Road $170,352
Whiskey Road (SC 19) SC 19 Paved Shoulder / Length 4.33 miles Powderhouse Road to ARTS Boundary $145,488
Williston Road (US 278) US 278 Paved Shoulder / Length 5.97 miles Sand Bar Ferry Road to ARTS Boundary $200,592
Edgefield Road (US 25) US 25 Paved Shoulder / Length 4.17 miles Ascauga Lake Road to Aiken County Line $140,112
Jefferson Davis Hwy (US 1, US 78)
US 1/78 Greenway Martintown Road to Revco Road $1,934,400
Silver Bluff Road Corridor Improvements (SC 302)
SC 302 Operational improvements and third lane added for turn lanes, center lane, and median, as well as signal improvements.
S‐1849 (Indian Creek Trail) to S‐81 (Richardson's Lake Road)
$4,528,000
Atomic Road/ East Buena Vista
S‐125 Corridor Improvements and Widening Not submitted $6,250,000
Hitchcock Parkway (SC 118) ‐ Phase 1
SC 118
Widen Hitchcock Parkway (SC 118) from 2 to 4 lanes between Huntsman Drive to SC 302 (Silver Bluff Road), with full landscaped median and turn lanes as needed and multiuse path along the entire project limits.
SC 302 to Huntsman Drive $19,200,000
South Carolina Strategic Corridors Plan
Multimodal Needs Identified by MPOs and COGs
SOUTH CAROLINA MULTIMODAL TRANSPORTATION PLAN
25
Project Name Facility Name Project Description Project Termini Project Cost
US 25 (Edgefield Road) and Walnut Lane intersection improvements
US 25 Improve Edgefield Road (US 25) from four to six lanes with center turn lanes (7th lane) between Sweetwater Boulevard to past Walnut Lane
US 25 (Edgefield Road) and Walnut Lane $4,600,000
Aiken‐Augusta Highway (US 1)
US 1 Widen Aiken‐Augusta Highway (US 1) with improved median between Savannah River to I‐520 (Palmetto Pkwy), including Martintown Road interchange improvements.
Savannah River to I‐520 (Palmetto Pkwy) $9,575,540
Edgefield Highway (SC 19) SC 19
Widen Edgefield Highway (SC 19) from 2 to 4 lanes between SC 118 (University Pkwy) and S‐153 Shiloh Church Road, with full landscaped median and turn lanes as needed. Add median between University and Hampton
Hampton Avenue to S‐153 Shiloh Church Road
$30,901,440
Georgia/Knox Avenue (US 25) and Five Notch/ Bradleyville Road (S‐45)
US 25 and S‐45 Georgia Avenue ‐ add turning lanes and realign. Close one curb cut.
US 25 (Georgia/Knox Avenue) and S‐45 (Five Notch/ Bradleyville Road)
$1,712,867
Richland Avenue West (US 1/US 78) and University Parkway (S‐2131)
US 1/78 and S‐2131
Lengthen and add dual left turn lanes east bound on Richland Ave. Rewarrant signal.
US 1/US 78 (Richland Avenue West) and S‐2131 (University Parkway)
$811,997
Silver Bluff Road (SC 302) and Hitchcock Parkway (SC 118)
SC 302 and SC 118
Bicycle and pedestrian crossing safety median, signal functions reassesses and add turn lanes
SC 302 (Silver Bluff Road) and SC 118 (Hitchcock Parkway)
$1,477,466
I‐20 and US 25 (Edgefield Road) Park and Ride in Aiken County (Exit 5)
I‐ 20 and US 25 Construct Park and Ride facility I‐20 and US 25 (Edgefield Road) $1,240,000
Hitchcock Parkway (SC 118)‐ Phase 2
SC 118 Widening to 4 Lanes Huntsman Drive to US 1 $22,113,000
Rudy Mason Parkway (SC 118)
SC 118 Road widening to two lanes to four lanes, with full landscaped median and turn lanes as needed.
S‐912 (North of Willow Run Rd) to S‐783 (North of Old Wagener Road)
$11,340,000
Atomic Road (SC 125) SC‐125 Widen to 4 through lanes, with full landscaped median and turn lanes as needed. Project include multiuse path along portions of the study limits.
S‐197 (Old Edgefield Road) to US 1 (Jefferson Davis Highway)
$14,354,301
Knox Avenue (US 25) and Martintown Road (SC 230)
US 25 and SC 230 Realign intersection and pedestrian improvements US 25 (Knox Avenue) and SC 230 (Martintown Road)
$2,408,642
York Street/Columbia Hwy (US 1) and Rutland Ave and Aldrich (SC 118)
US 1 and SC 118 The two intersections are separated by 440 ft. Operational and signal improvements.
US 1 (York Street/Columbia Hwy) and SC 118 (Rutland Ave and Aldrich)
$677,376
Pine Log Road (SC 302) and Collier Street
SC 302 Realign and add double left turn lanes from westbound Pine Log to Collier and adjust signals.
SC 302 (Pine Log Road) and Collier Street $1,212,898
South Carolina Strategic Corridors Plan
Multimodal Needs Identified by MPOs and COGs
SOUTH CAROLINA MULTIMODAL TRANSPORTATION PLAN
26
Project Name Facility Name Project Description Project Termini Project Cost
SC 4 (Salley Rd) at SC 302 (Wagener Rd)
SC 4 and SC 302 Intersection Improvements / Recent improvements made, may require signal (Kitchings Mill)
SC 4 (Salley Rd) and SC 302 (Wagener Rd) $500,000
SC 125 (Atomic Rd) and State Hwy 62 (N Silverton St)
SC 125 and State Hwy 62
Intersection Improvements / Skewed intersection, low traffic on S‐62 (Jackson)
SC 125 (Atomic Rd) and State Hwy 62 (N Silverton St)
$750,000
SC 125 (W Railroad Ave) and Bluff Rd (S‐03‐22)
SC 125 and S‐03‐22
Intersection Improvements / Alignment OK, may need radii improvements (Allendale)
SC 125 (W Railroad Ave) and Bluff Rd (S‐03 22)
$1,500,000
SC 125 (Augusta Hwy) and SC 3 (River Rd)
SC 125 and SC 3 Intersection Improvements / Alignment OK, moderate AADT (E of Martin)
SC 125 (Augusta Hwy) and SC 3 (River Rd) $750,000
US 278 (Barnwell Rd) and Bluff Rd (S‐03‐22)
US 278 and S‐03‐22
Intersection Improvements / Skewed intersection, moderate AADT (N of Allendale)
US 278 (Barnwell Rd) and Bluff Rd (S‐03 22) $500,000
US 278 (Allendale‐Fairfax Hwy) and US 321 (Hampton Ave)
US 278 and US 321
Intersection Improvements / Skewed intersection, R/R crossing, traffic, multiple. Intersections in close proximity (Fairfax)
US 278 (Allendale‐Fairfax Hwy) and US 321 (Hampton Ave)
$2,000,000
US 278 (Williston Rd) and SC 781 (Tinker Creek Rd)
US 278 and SC 781
Intersection Improvements / Sight distance bad, in curve of US route, realignment of main line? (W of Williston)
US 278 (Williston Rd) and SC 781 (Tinker Creek Rd)
$1,500,000
US 278 and SC 300 US 278 and SC 300
Intersection Improvements / Badly skewed, sight distance bad, high AADT (S of Barnwell)
US 278 and SC 300 $1,500,000
US 278 (Barnwell Rd) US 278 6‐ft bike lane/paved shoulder / Length 6.02 miles Jennings Rd to Barnwell/Allendale Co line $3,600,000
US 78 (Dorange Rd) US 78 4‐ft bike lane/paved shoulder / Length 1.94 miles Freedom Rd to Sub Rd $1,200,000
US 78 and SC 781 US 78 and SC 781 Redesign intersection US 78 and SC 781 $1,300,000
US 78 / US 321 US 78 and US 321
Reconfigure intersection US 78 and US 321 $2,000,000
US 78 Phase I and II US 78 Corridor Improvements US 78 (within Bamberg County) $5,400,000
US 78 at Calhoun St US 78 Reconfigure intersection US 78 and Calhoun St $1,000,000
US 78 at SC 39 US 78 and SC 39 Redesign intersection US 78 and SC 39 $1,050,000
US 176 at SC 6 US 176 and SC 6 Redesign intersections East and West US 176 and SC 6 $1,600,000
US 301 Extension US 301 New construction extends US 301 from I‐95 to SC 6 I‐95 to SC 6 $9,800,000
US 301 at SC 33 US 301 and SC 33 Geometric improvements US 301 and SC 33 $1,000,000
South Carolina Strategic Corridors Plan
Multimodal Needs Identified by MPOs and COGs
SOUTH CAROLINA MULTIMODAL TRANSPORTATION PLAN
27
Figure 4‐5: Multimodal Needs for Lower Savannah COG
South Carolina Strategic Corridors Plan
Multimodal Needs Identified by MPOs and COGs
SOUTH CAROLINA MULTIMODAL TRANSPORTATION PLAN
28
Table 4‐5: Needs Identification: Pee Dee Council of Governments
Project Name Facility Name Project Description Project Termini Project Cost
US 76 W. Palmetto St. US 76 Capital Sales Tax Widening I‐95/Meadors Rd. to E. Smith Street $28,425,621
US 378 E. Myrtle Beach
Hwy. US 378 Capital Sales Tax Widening US 52 near Lake City to SC 41 in Kingsburg $136,364,420
US 52 Irby Street US 52 Access Management W. Lucas (US 52) to Alligator Rd (S 107) $9,163,000
US 76 Palmetto Street US 76 Access Management Second Loop Rd. (S‐51) to Freedom Blvd.
(US 301) $7,775,000
South Carolina Strategic Corridors Plan
Multimodal Needs Identified by MPOs and COGs
SOUTH CAROLINA MULTIMODAL TRANSPORTATION PLAN
29
Figure 4‐6: Multimodal Needs for Pee Dee COG
South Carolina Strategic Corridors Plan
Multimodal Needs Identified by MPOs and COGs
SOUTH CAROLINA MULTIMODAL TRANSPORTATION PLAN
30
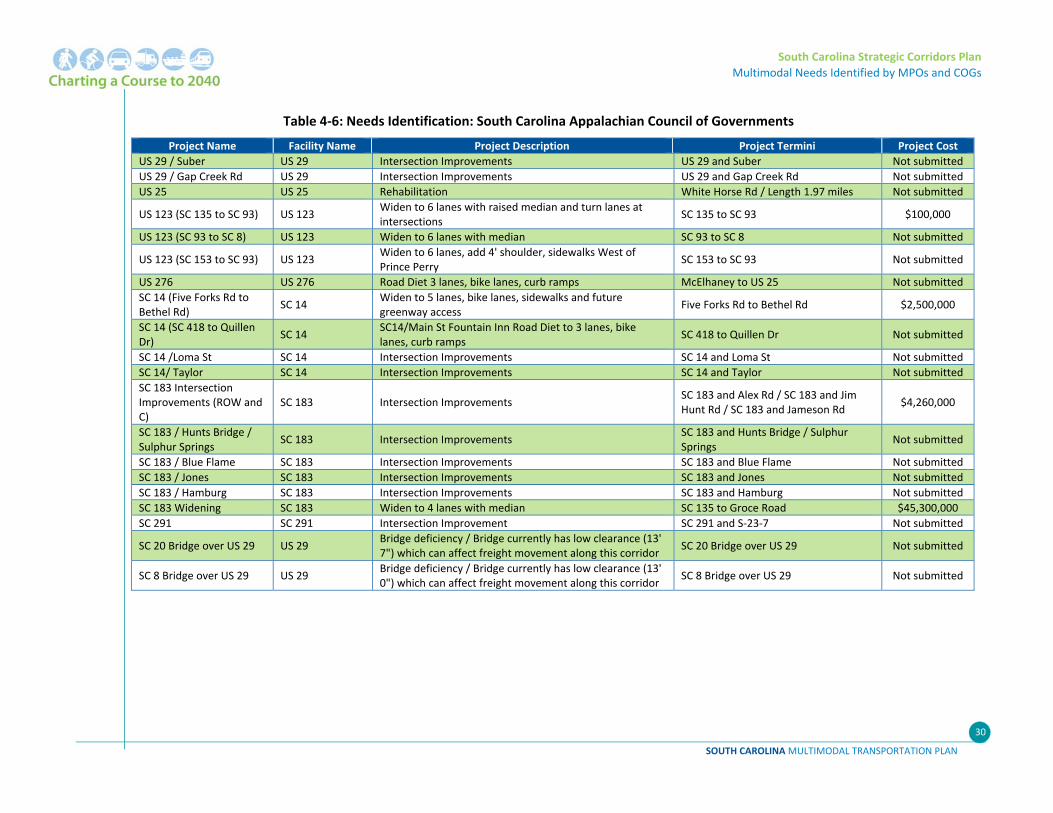
Table 4‐6: Needs Identification: South Carolina Appalachian Council of Governments
Project Name Facility Name Project Description Project Termini Project Cost
US 29 / Suber US 29 Intersection Improvements US 29 and Suber Not submitted
US 29 / Gap Creek Rd US 29 Intersection Improvements US 29 and Gap Creek Rd Not submitted
US 25 US 25 Rehabilitation White Horse Rd / Length 1.97 miles Not submitted
US 123 (SC 135 to SC 93) US 123 Widen to 6 lanes with raised median and turn lanes at intersections
SC 135 to SC 93 $100,000
US 123 (SC 93 to SC 8) US 123 Widen to 6 lanes with median SC 93 to SC 8 Not submitted
US 123 (SC 153 to SC 93) US 123 Widen to 6 lanes, add 4' shoulder, sidewalks West of Prince Perry
SC 153 to SC 93 Not submitted
US 276 US 276 Road Diet 3 lanes, bike lanes, curb ramps McElhaney to US 25 Not submitted
SC 14 (Five Forks Rd to Bethel Rd)
SC 14 Widen to 5 lanes, bike lanes, sidewalks and future greenway access
Five Forks Rd to Bethel Rd $2,500,000
SC 14 (SC 418 to Quillen Dr)
SC 14 SC14/Main St Fountain Inn Road Diet to 3 lanes, bike lanes, curb ramps
SC 418 to Quillen Dr Not submitted
SC 14 /Loma St SC 14 Intersection Improvements SC 14 and Loma St Not submitted
SC 14/ Taylor SC 14 Intersection Improvements SC 14 and Taylor Not submitted
SC 183 Intersection Improvements (ROW and C)
SC 183 Intersection Improvements SC 183 and Alex Rd / SC 183 and Jim Hunt Rd / SC 183 and Jameson Rd
$4,260,000
SC 183 / Hunts Bridge / Sulphur Springs
SC 183 Intersection Improvements SC 183 and Hunts Bridge / Sulphur Springs
Not submitted
SC 183 / Blue Flame SC 183 Intersection Improvements SC 183 and Blue Flame Not submitted
SC 183 / Jones SC 183 Intersection Improvements SC 183 and Jones Not submitted
SC 183 / Hamburg SC 183 Intersection Improvements SC 183 and Hamburg Not submitted
SC 183 Widening SC 183 Widen to 4 lanes with median SC 135 to Groce Road $45,300,000
SC 291 SC 291 Intersection Improvement SC 291 and S‐23‐7 Not submitted
SC 20 Bridge over US 29 US 29 Bridge deficiency / Bridge currently has low clearance (13' 7") which can affect freight movement along this corridor
SC 20 Bridge over US 29 Not submitted
SC 8 Bridge over US 29 US 29 Bridge deficiency / Bridge currently has low clearance (13' 0") which can affect freight movement along this corridor
SC 8 Bridge over US 29 Not submitted
South Carolina Strategic Corridors Plan
Multimodal Needs Identified by MPOs and COGs
SOUTH CAROLINA MULTIMODAL TRANSPORTATION PLAN
31
Figure 4‐7: Multimodal Needs for South Carolina Appalachian COG
South Carolina Strategic Corridors Plan
Multimodal Needs Identified by MPOs and COGs
SOUTH CAROLINA MULTIMODAL TRANSPORTATION PLAN
32
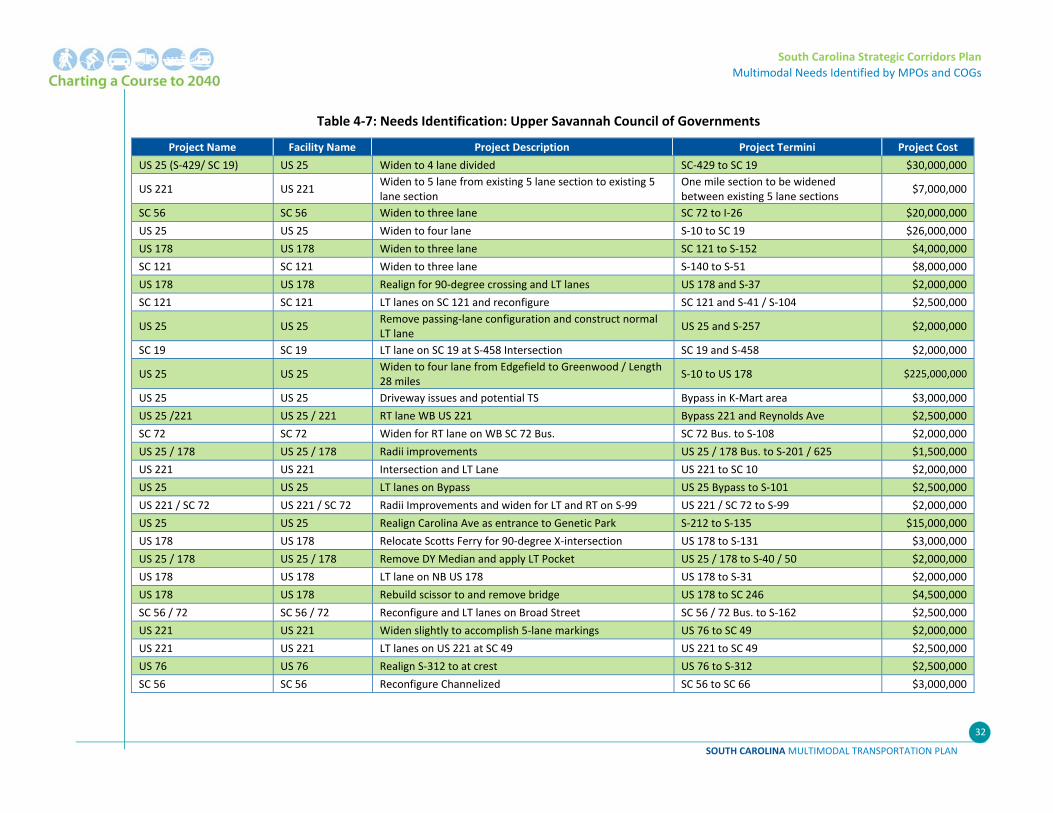
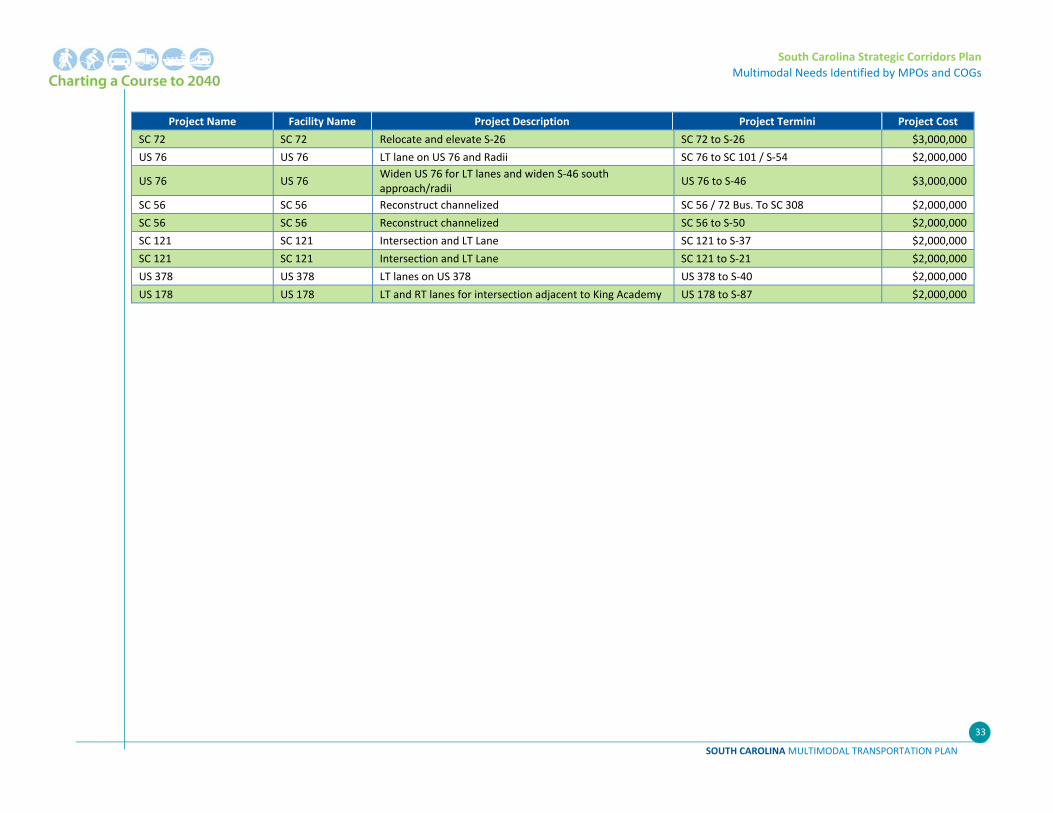
Table 4‐7: Needs Identification: Upper Savannah Council of Governments
Project Name Facility Name Project Description Project Termini Project Cost
US 25 (S‐429/ SC 19) US 25 Widen to 4 lane divided SC‐429 to SC 19 $30,000,000
US 221 US 221 Widen to 5 lane from existing 5 lane section to existing 5 lane section
One mile section to be widened between existing 5 lane sections
$7,000,000
SC 56 SC 56 Widen to three lane SC 72 to I‐26 $20,000,000
US 25 US 25 Widen to four lane S‐10 to SC 19 $26,000,000
US 178 US 178 Widen to three lane SC 121 to S‐152 $4,000,000
SC 121 SC 121 Widen to three lane S‐140 to S‐51 $8,000,000
US 178 US 178 Realign for 90‐degree crossing and LT lanes US 178 and S‐37 $2,000,000
SC 121 SC 121 LT lanes on SC 121 and reconfigure SC 121 and S‐41 / S‐104 $2,500,000
US 25 US 25 Remove passing‐lane configuration and construct normal LT lane
US 25 and S‐257 $2,000,000
SC 19 SC 19 LT lane on SC 19 at S‐458 Intersection SC 19 and S‐458 $2,000,000
US 25 US 25 Widen to four lane from Edgefield to Greenwood / Length 28 miles
S‐10 to US 178 $225,000,000
US 25 US 25 Driveway issues and potential TS Bypass in K‐Mart area $3,000,000
US 25 /221 US 25 / 221 RT lane WB US 221 Bypass 221 and Reynolds Ave $2,500,000
SC 72 SC 72 Widen for RT lane on WB SC 72 Bus. SC 72 Bus. to S‐108 $2,000,000
US 25 / 178 US 25 / 178 Radii improvements US 25 / 178 Bus. to S‐201 / 625 $1,500,000
US 221 US 221 Intersection and LT Lane US 221 to SC 10 $2,000,000
US 25 US 25 LT lanes on Bypass US 25 Bypass to S‐101 $2,500,000
US 221 / SC 72 US 221 / SC 72 Radii Improvements and widen for LT and RT on S‐99 US 221 / SC 72 to S‐99 $2,000,000
US 25 US 25 Realign Carolina Ave as entrance to Genetic Park S‐212 to S‐135 $15,000,000
US 178 US 178 Relocate Scotts Ferry for 90‐degree X‐intersection US 178 to S‐131 $3,000,000
US 25 / 178 US 25 / 178 Remove DY Median and apply LT Pocket US 25 / 178 to S‐40 / 50 $2,000,000
US 178 US 178 LT lane on NB US 178 US 178 to S‐31 $2,000,000
US 178 US 178 Rebuild scissor to and remove bridge US 178 to SC 246 $4,500,000
SC 56 / 72 SC 56 / 72 Reconfigure and LT lanes on Broad Street SC 56 / 72 Bus. to S‐162 $2,500,000
US 221 US 221 Widen slightly to accomplish 5‐lane markings US 76 to SC 49 $2,000,000
US 221 US 221 LT lanes on US 221 at SC 49 US 221 to SC 49 $2,500,000
US 76 US 76 Realign S‐312 to at crest US 76 to S‐312 $2,500,000
SC 56 SC 56 Reconfigure Channelized SC 56 to SC 66 $3,000,000
South Carolina Strategic Corridors Plan
Multimodal Needs Identified by MPOs and COGs
SOUTH CAROLINA MULTIMODAL TRANSPORTATION PLAN
33
Project Name Facility Name Project Description Project Termini Project Cost
SC 72 SC 72 Relocate and elevate S‐26 SC 72 to S‐26 $3,000,000
US 76 US 76 LT lane on US 76 and Radii SC 76 to SC 101 / S‐54 $2,000,000
US 76 US 76 Widen US 76 for LT lanes and widen S‐46 south approach/radii
US 76 to S‐46 $3,000,000
SC 56 SC 56 Reconstruct channelized SC 56 / 72 Bus. To SC 308 $2,000,000
SC 56 SC 56 Reconstruct channelized SC 56 to S‐50 $2,000,000
SC 121 SC 121 Intersection and LT Lane SC 121 to S‐37 $2,000,000
SC 121 SC 121 Intersection and LT Lane SC 121 to S‐21 $2,000,000
US 378 US 378 LT lanes on US 378 US 378 to S‐40 $2,000,000
US 178 US 178 LT and RT lanes for intersection adjacent to King Academy US 178 to S‐87 $2,000,000
South Carolina Strategic Corridors Plan
Multimodal Needs Identified by MPOs and COGs
SOUTH CAROLINA MULTIMODAL TRANSPORTATION PLAN
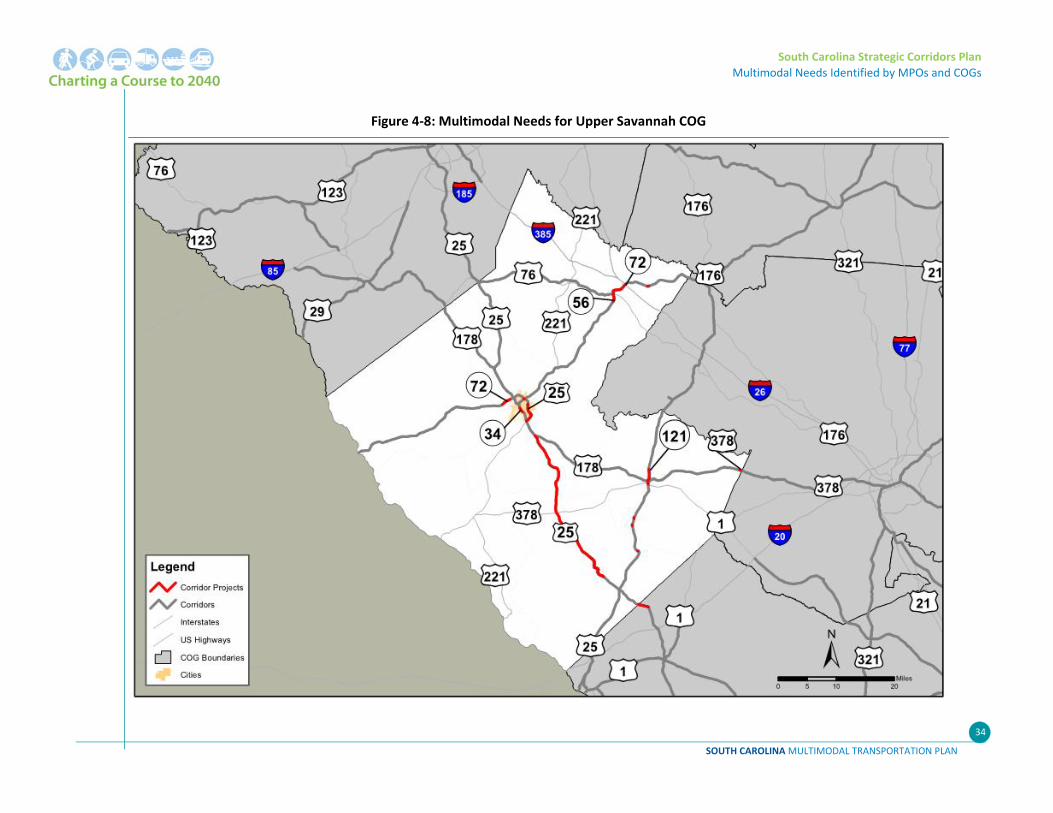
34
Figure 4‐8: Multimodal Needs for Upper Savannah COG
South Carolina Strategic Corridors Plan
Multimodal Needs Identified by MPOs and COGs
SOUTH CAROLINA MULTIMODAL TRANSPORTATION PLAN
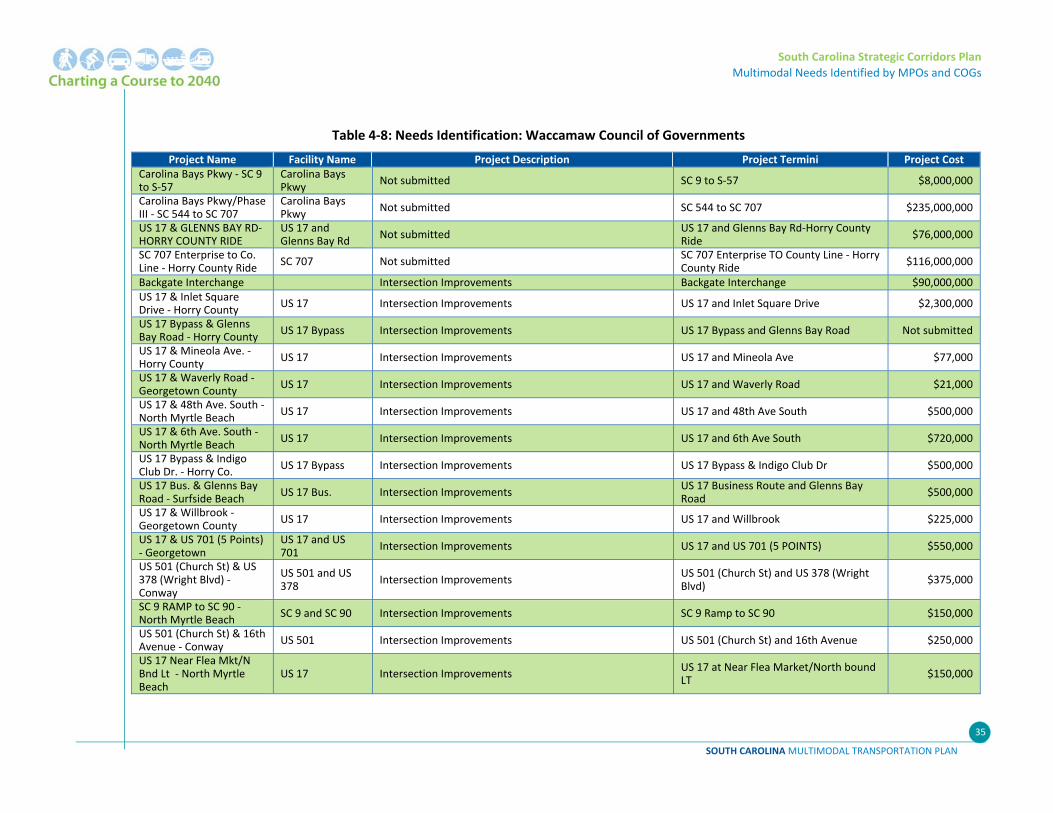
35
Table 4‐8: Needs Identification: Waccamaw Council of Governments
Project Name Facility Name Project Description Project Termini Project CostCarolina Bays Pkwy ‐ SC 9 to S‐57
Carolina Bays Pkwy
Not submitted SC 9 to S‐57 $8,000,000
Carolina Bays Pkwy/Phase III ‐ SC 544 to SC 707
Carolina Bays Pkwy
Not submitted SC 544 to SC 707 $235,000,000
US 17 & GLENNS BAY RD‐HORRY COUNTY RIDE
US 17 and Glenns Bay Rd
Not submitted US 17 and Glenns Bay Rd‐Horry County Ride
$76,000,000
SC 707 Enterprise to Co. Line ‐ Horry County Ride
SC 707 Not submitted SC 707 Enterprise TO County Line ‐ Horry County Ride
$116,000,000
Backgate Interchange Intersection Improvements Backgate Interchange $90,000,000US 17 & Inlet Square Drive ‐ Horry County
US 17 Intersection Improvements US 17 and Inlet Square Drive $2,300,000
US 17 Bypass & Glenns Bay Road ‐ Horry County
US 17 Bypass Intersection Improvements US 17 Bypass and Glenns Bay Road Not submitted
US 17 & Mineola Ave. ‐ Horry County
US 17 Intersection Improvements US 17 and Mineola Ave $77,000
US 17 & Waverly Road ‐ Georgetown County
US 17 Intersection Improvements US 17 and Waverly Road $21,000
US 17 & 48th Ave. South ‐ North Myrtle Beach
US 17 Intersection Improvements US 17 and 48th Ave South $500,000
US 17 & 6th Ave. South ‐ North Myrtle Beach
US 17 Intersection Improvements US 17 and 6th Ave South $720,000
US 17 Bypass & Indigo Club Dr. ‐ Horry Co.
US 17 Bypass Intersection Improvements US 17 Bypass & Indigo Club Dr $500,000
US 17 Bus. & Glenns Bay Road ‐ Surfside Beach
US 17 Bus. Intersection Improvements US 17 Business Route and Glenns Bay Road
$500,000
US 17 & Willbrook ‐ Georgetown County
US 17 Intersection Improvements US 17 and Willbrook $225,000
US 17 & US 701 (5 Points) ‐ Georgetown
US 17 and US 701
Intersection Improvements US 17 and US 701 (5 POINTS) $550,000
US 501 (Church St) & US 378 (Wright Blvd) ‐ Conway
US 501 and US 378
Intersection Improvements US 501 (Church St) and US 378 (Wright Blvd)
$375,000
SC 9 RAMP to SC 90 ‐ North Myrtle Beach
SC 9 and SC 90 Intersection Improvements SC 9 Ramp to SC 90 $150,000
US 501 (Church St) & 16th Avenue ‐ Conway
US 501 Intersection Improvements US 501 (Church St) and 16th Avenue $250,000
US 17 Near Flea Mkt/N Bnd Lt ‐ North Myrtle Beach
US 17 Intersection Improvements US 17 at Near Flea Market/North bound LT
$150,000
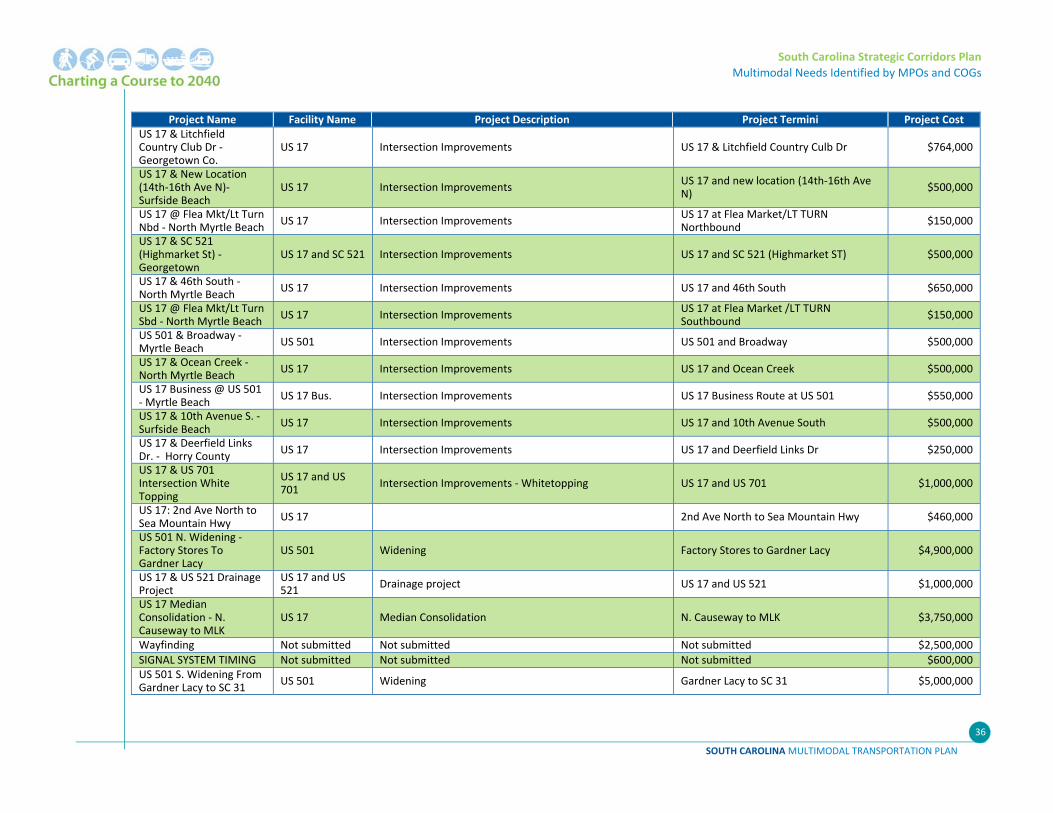
South Carolina Strategic Corridors Plan
Multimodal Needs Identified by MPOs and COGs
SOUTH CAROLINA MULTIMODAL TRANSPORTATION PLAN
36
Project Name Facility Name Project Description Project Termini Project CostUS 17 & Litchfield Country Club Dr ‐ Georgetown Co.
US 17 Intersection Improvements US 17 & Litchfield Country Culb Dr $764,000
US 17 & New Location (14th‐16th Ave N)‐ Surfside Beach
US 17 Intersection Improvements US 17 and new location (14th‐16th Ave N)
$500,000
US 17 @ Flea Mkt/Lt Turn Nbd ‐ North Myrtle Beach
US 17 Intersection Improvements US 17 at Flea Market/LT TURN Northbound
$150,000
US 17 & SC 521 (Highmarket St) ‐ Georgetown
US 17 and SC 521 Intersection Improvements US 17 and SC 521 (Highmarket ST) $500,000
US 17 & 46th South ‐ North Myrtle Beach
US 17 Intersection Improvements US 17 and 46th South $650,000
US 17 @ Flea Mkt/Lt Turn Sbd ‐ North Myrtle Beach
US 17 Intersection Improvements US 17 at Flea Market /LT TURN Southbound
$150,000
US 501 & Broadway ‐ Myrtle Beach
US 501 Intersection Improvements US 501 and Broadway $500,000
US 17 & Ocean Creek ‐ North Myrtle Beach
US 17 Intersection Improvements US 17 and Ocean Creek $500,000
US 17 Business @ US 501 ‐ Myrtle Beach
US 17 Bus. Intersection Improvements US 17 Business Route at US 501 $550,000
US 17 & 10th Avenue S. ‐ Surfside Beach
US 17 Intersection Improvements US 17 and 10th Avenue South $500,000
US 17 & Deerfield Links Dr. ‐ Horry County
US 17 Intersection Improvements US 17 and Deerfield Links Dr $250,000
US 17 & US 701 Intersection White Topping
US 17 and US 701
Intersection Improvements ‐ Whitetopping US 17 and US 701 $1,000,000
US 17: 2nd Ave North to Sea Mountain Hwy
US 17 2nd Ave North to Sea Mountain Hwy $460,000
US 501 N. Widening ‐ Factory Stores To Gardner Lacy
US 501 Widening Factory Stores to Gardner Lacy $4,900,000
US 17 & US 521 Drainage Project
US 17 and US 521
Drainage project US 17 and US 521 $1,000,000
US 17 Median Consolidation ‐ N. Causeway to MLK
US 17 Median Consolidation N. Causeway to MLK $3,750,000
Wayfinding Not submitted Not submitted Not submitted $2,500,000
SIGNAL SYSTEM TIMING Not submitted Not submitted Not submitted $600,000US 501 S. Widening From Gardner Lacy to SC 31
US 501 Widening Gardner Lacy to SC 31 $5,000,000
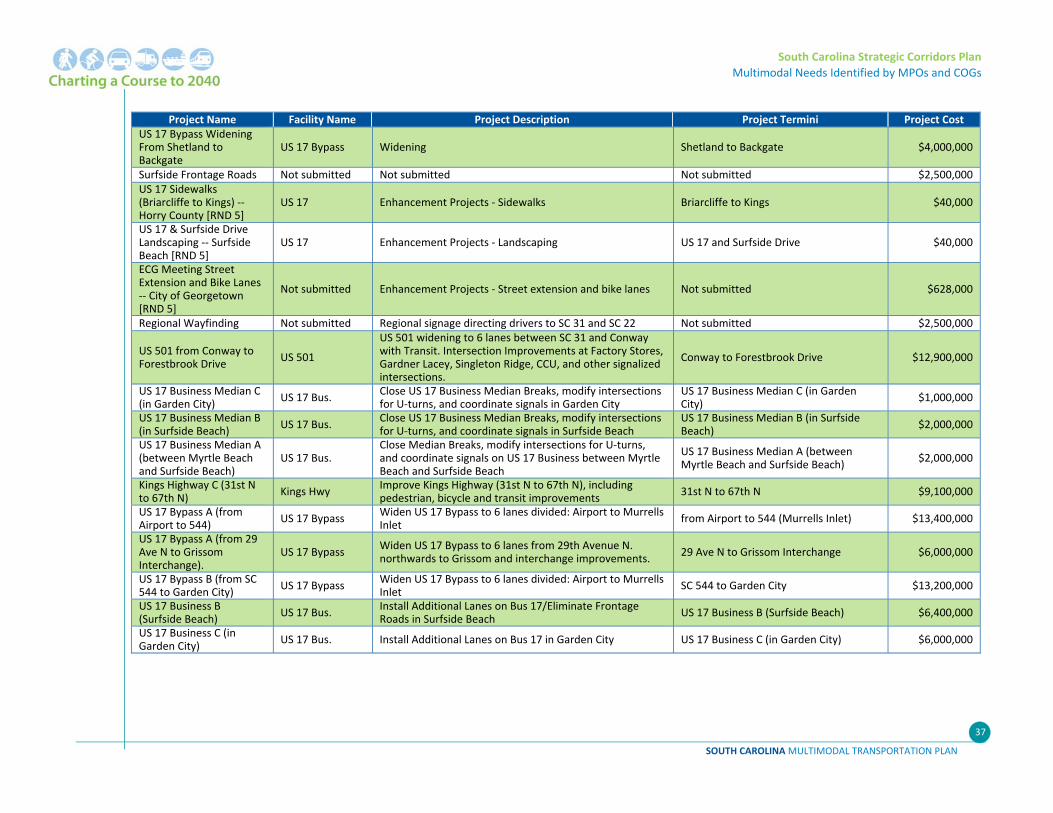
South Carolina Strategic Corridors Plan
Multimodal Needs Identified by MPOs and COGs
SOUTH CAROLINA MULTIMODAL TRANSPORTATION PLAN
37
Project Name Facility Name Project Description Project Termini Project CostUS 17 Bypass Widening From Shetland to Backgate
US 17 Bypass Widening Shetland to Backgate $4,000,000
Surfside Frontage Roads Not submitted Not submitted Not submitted $2,500,000US 17 Sidewalks (Briarcliffe to Kings) ‐‐ Horry County [RND 5]
US 17 Enhancement Projects ‐ Sidewalks Briarcliffe to Kings $40,000
US 17 & Surfside Drive Landscaping ‐‐ Surfside Beach [RND 5]
US 17 Enhancement Projects ‐ Landscaping US 17 and Surfside Drive $40,000
ECG Meeting Street Extension and Bike Lanes ‐‐ City of Georgetown [RND 5]
Not submitted Enhancement Projects ‐ Street extension and bike lanes Not submitted $628,000
Regional Wayfinding Not submitted Regional signage directing drivers to SC 31 and SC 22 Not submitted $2,500,000
US 501 from Conway to Forestbrook Drive
US 501
US 501 widening to 6 lanes between SC 31 and Conway with Transit. Intersection Improvements at Factory Stores, Gardner Lacey, Singleton Ridge, CCU, and other signalized intersections.
Conway to Forestbrook Drive $12,900,000
US 17 Business Median C (in Garden City)
US 17 Bus. Close US 17 Business Median Breaks, modify intersections for U‐turns, and coordinate signals in Garden City
US 17 Business Median C (in Garden City)
$1,000,000
US 17 Business Median B (in Surfside Beach)
US 17 Bus. Close US 17 Business Median Breaks, modify intersections for U‐turns, and coordinate signals in Surfside Beach
US 17 Business Median B (in Surfside Beach)
$2,000,000
US 17 Business Median A (between Myrtle Beach and Surfside Beach)
US 17 Bus. Close Median Breaks, modify intersections for U‐turns, and coordinate signals on US 17 Business between Myrtle Beach and Surfside Beach
US 17 Business Median A (between Myrtle Beach and Surfside Beach)
$2,000,000
Kings Highway C (31st N to 67th N)
Kings Hwy Improve Kings Highway (31st N to 67th N), including pedestrian, bicycle and transit improvements
31st N to 67th N $9,100,000
US 17 Bypass A (from Airport to 544)
US 17 Bypass Widen US 17 Bypass to 6 lanes divided: Airport to Murrells Inlet
from Airport to 544 (Murrells Inlet) $13,400,000
US 17 Bypass A (from 29 Ave N to Grissom Interchange).
US 17 Bypass Widen US 17 Bypass to 6 lanes from 29th Avenue N. northwards to Grissom and interchange improvements.
29 Ave N to Grissom Interchange $6,000,000
US 17 Bypass B (from SC 544 to Garden City)
US 17 Bypass Widen US 17 Bypass to 6 lanes divided: Airport to Murrells Inlet
SC 544 to Garden City $13,200,000
US 17 Business B (Surfside Beach)
US 17 Bus. Install Additional Lanes on Bus 17/Eliminate Frontage Roads in Surfside Beach
US 17 Business B (Surfside Beach) $6,400,000
US 17 Business C (in Garden City)
US 17 Bus. Install Additional Lanes on Bus 17 in Garden City US 17 Business C (in Garden City) $6,000,000
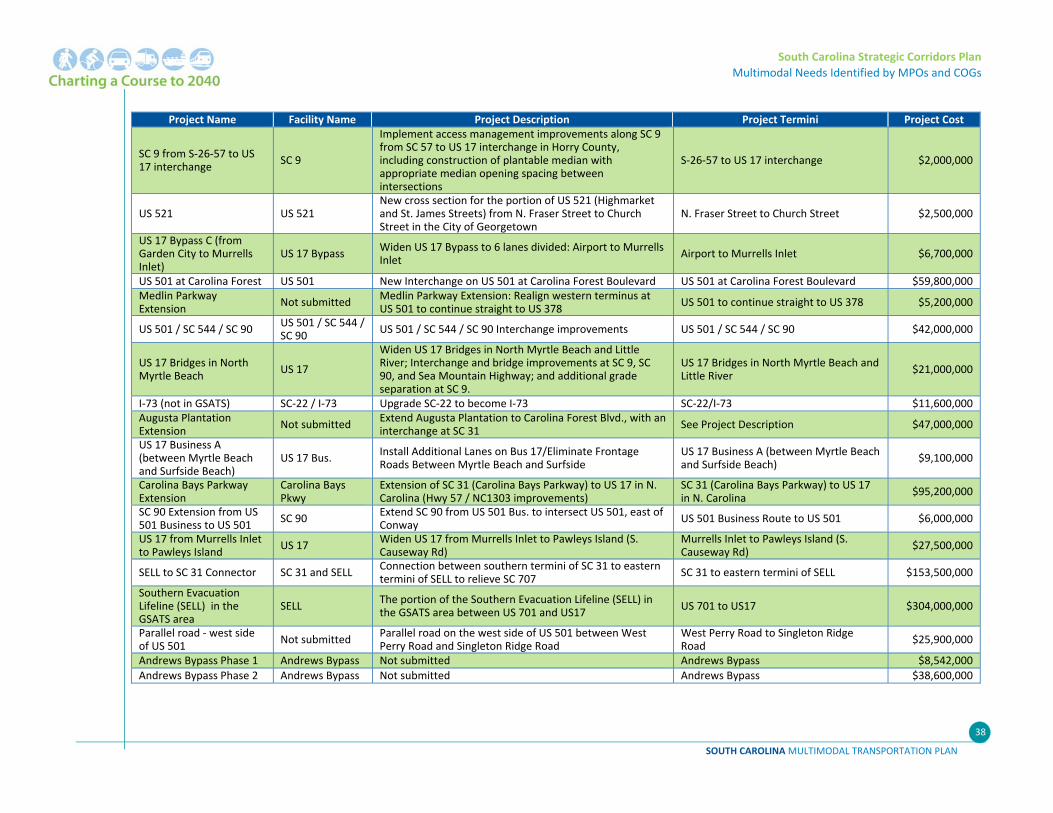
South Carolina Strategic Corridors Plan
Multimodal Needs Identified by MPOs and COGs
SOUTH CAROLINA MULTIMODAL TRANSPORTATION PLAN
38
Project Name Facility Name Project Description Project Termini Project Cost
SC 9 from S‐26‐57 to US 17 interchange
SC 9
Implement access management improvements along SC 9 from SC 57 to US 17 interchange in Horry County, including construction of plantable median with appropriate median opening spacing between intersections
S‐26‐57 to US 17 interchange $2,000,000
US 521 US 521 New cross section for the portion of US 521 (Highmarket and St. James Streets) from N. Fraser Street to Church Street in the City of Georgetown
N. Fraser Street to Church Street $2,500,000
US 17 Bypass C (from Garden City to Murrells Inlet)
US 17 Bypass Widen US 17 Bypass to 6 lanes divided: Airport to Murrells Inlet
Airport to Murrells Inlet $6,700,000
US 501 at Carolina Forest US 501 New Interchange on US 501 at Carolina Forest Boulevard US 501 at Carolina Forest Boulevard $59,800,000Medlin Parkway Extension
Not submitted Medlin Parkway Extension: Realign western terminus at US 501 to continue straight to US 378
US 501 to continue straight to US 378 $5,200,000
US 501 / SC 544 / SC 90 US 501 / SC 544 / SC 90
US 501 / SC 544 / SC 90 Interchange improvements US 501 / SC 544 / SC 90 $42,000,000
US 17 Bridges in North Myrtle Beach
US 17
Widen US 17 Bridges in North Myrtle Beach and Little River; Interchange and bridge improvements at SC 9, SC 90, and Sea Mountain Highway; and additional grade separation at SC 9.
US 17 Bridges in North Myrtle Beach and Little River
$21,000,000
I‐73 (not in GSATS) SC‐22 / I‐73 Upgrade SC‐22 to become I‐73 SC‐22/I‐73 $11,600,000Augusta Plantation Extension
Not submitted Extend Augusta Plantation to Carolina Forest Blvd., with an interchange at SC 31
See Project Description $47,000,000
US 17 Business A (between Myrtle Beach and Surfside Beach)
US 17 Bus. Install Additional Lanes on Bus 17/Eliminate Frontage Roads Between Myrtle Beach and Surfside
US 17 Business A (between Myrtle Beach and Surfside Beach)
$9,100,000
Carolina Bays Parkway Extension
Carolina Bays Pkwy
Extension of SC 31 (Carolina Bays Parkway) to US 17 in N. Carolina (Hwy 57 / NC1303 improvements)
SC 31 (Carolina Bays Parkway) to US 17 in N. Carolina
$95,200,000
SC 90 Extension from US 501 Business to US 501
SC 90 Extend SC 90 from US 501 Bus. to intersect US 501, east of Conway
US 501 Business Route to US 501 $6,000,000
US 17 from Murrells Inlet to Pawleys Island
US 17 Widen US 17 from Murrells Inlet to Pawleys Island (S. Causeway Rd)
Murrells Inlet to Pawleys Island (S.Causeway Rd)
$27,500,000
SELL to SC 31 Connector SC 31 and SELL Connection between southern termini of SC 31 to eastern termini of SELL to relieve SC 707
SC 31 to eastern termini of SELL $153,500,000
Southern Evacuation Lifeline (SELL) in the GSATS area
SELL The portion of the Southern Evacuation Lifeline (SELL) in the GSATS area between US 701 and US17
US 701 to US17 $304,000,000
Parallel road ‐ west side of US 501
Not submitted Parallel road on the west side of US 501 between West Perry Road and Singleton Ridge Road
West Perry Road to Singleton Ridge Road
$25,900,000
Andrews Bypass Phase 1 Andrews Bypass Not submitted Andrews Bypass $8,542,000
Andrews Bypass Phase 2 Andrews Bypass Not submitted Andrews Bypass $38,600,000
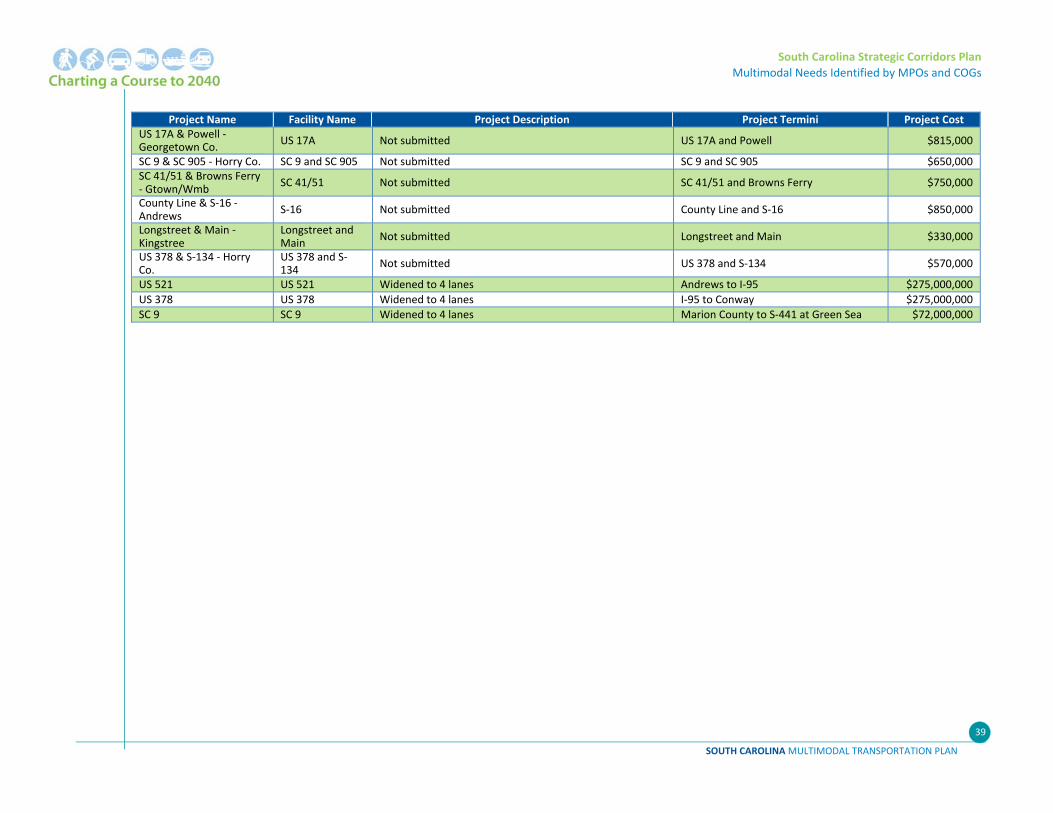
South Carolina Strategic Corridors Plan
Multimodal Needs Identified by MPOs and COGs
SOUTH CAROLINA MULTIMODAL TRANSPORTATION PLAN
39
Project Name Facility Name Project Description Project Termini Project CostUS 17A & Powell ‐ Georgetown Co.
US 17A Not submitted US 17A and Powell $815,000
SC 9 & SC 905 ‐ Horry Co. SC 9 and SC 905 Not submitted SC 9 and SC 905 $650,000SC 41/51 & Browns Ferry ‐ Gtown/Wmb
SC 41/51 Not submitted SC 41/51 and Browns Ferry $750,000
County Line & S‐16 ‐ Andrews
S‐16 Not submitted County Line and S‐16 $850,000
Longstreet & Main ‐ Kingstree
Longstreet and Main
Not submitted Longstreet and Main $330,000
US 378 & S‐134 ‐ Horry Co.
US 378 and S‐134
Not submitted US 378 and S‐134 $570,000
US 521 US 521 Widened to 4 lanes Andrews to I‐95 $275,000,000
US 378 US 378 Widened to 4 lanes I‐95 to Conway $275,000,000
SC 9 SC 9 Widened to 4 lanes Marion County to S‐441 at Green Sea $72,000,000
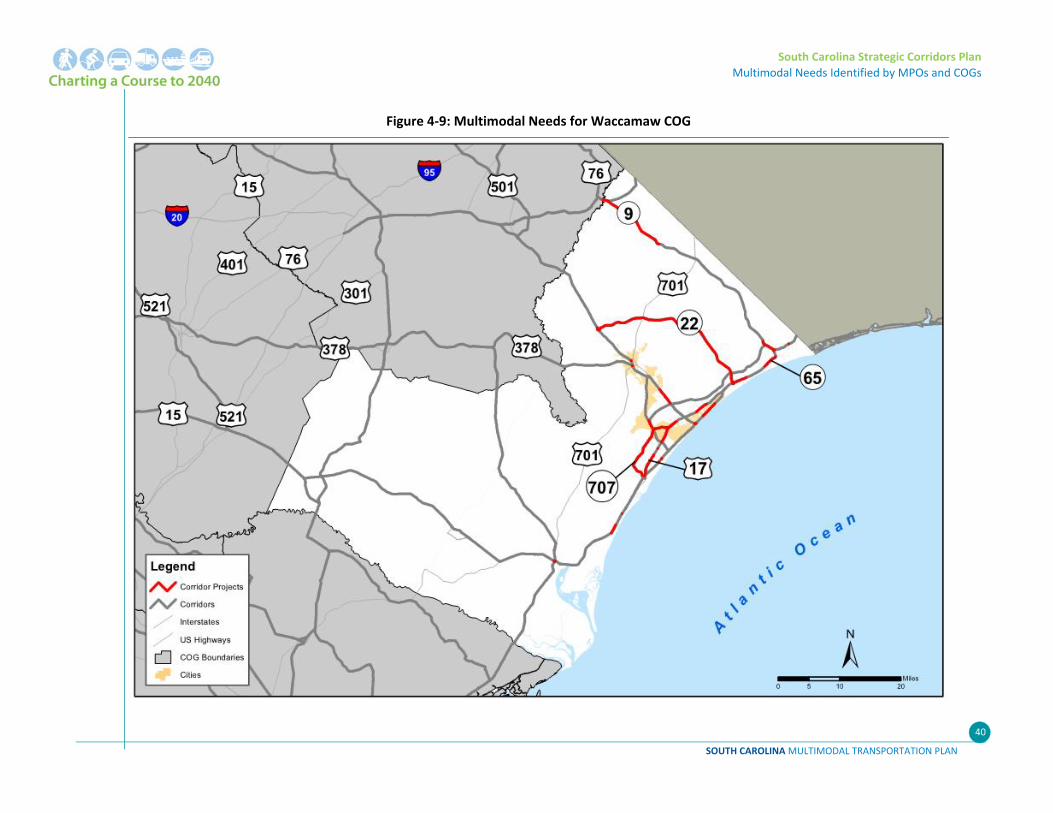
South Carolina Strategic Corridors Plan
Multimodal Needs Identified by MPOs and COGs
SOUTH CAROLINA MULTIMODAL TRANSPORTATION PLAN
40
Figure 4‐9: Multimodal Needs for Waccamaw COG
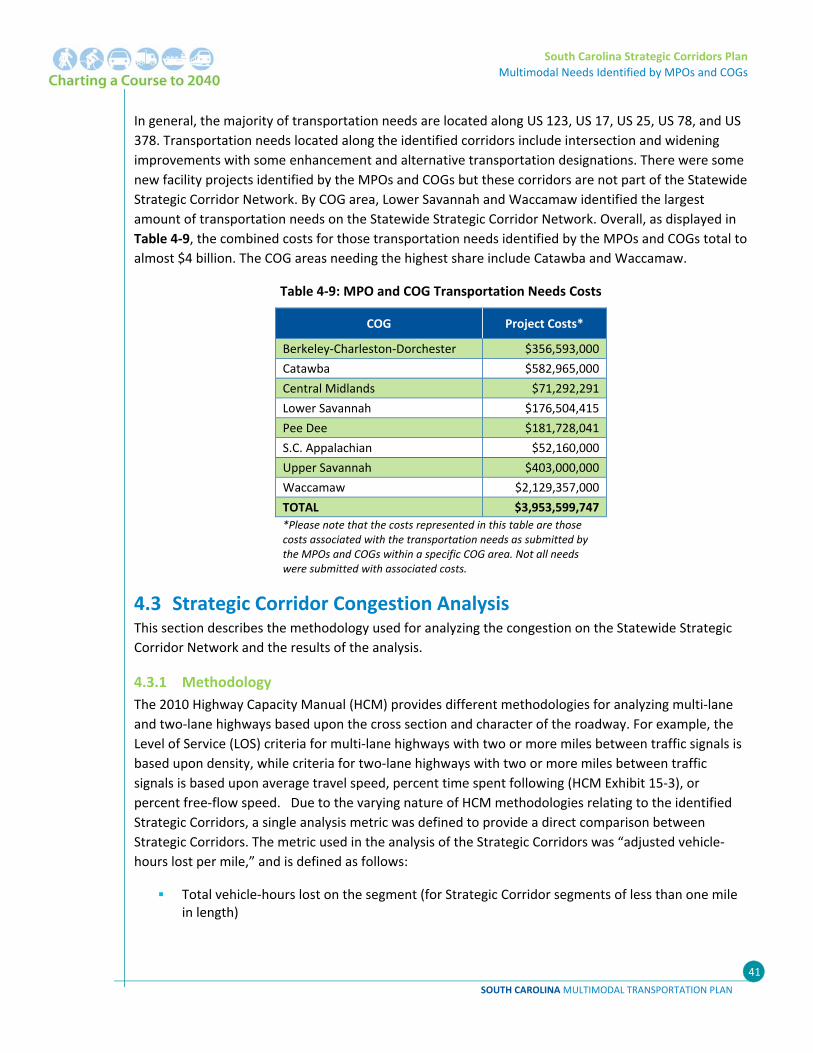
South Carolina Strategic Corridors Plan
Multimodal Needs Identified by MPOs and COGs
SOUTH CAROLINA MULTIMODAL TRANSPORTATION PLAN
41
In general, the majority of transportation needs are located along US 123, US 17, US 25, US 78, and US
378. Transportation needs located along the identified corridors include intersection and widening
improvements with some enhancement and alternative transportation designations. There were some
new facility projects identified by the MPOs and COGs but these corridors are not part of the Statewide
Strategic Corridor Network. By COG area, Lower Savannah and Waccamaw identified the largest
amount of transportation needs on the Statewide Strategic Corridor Network. Overall, as displayed in
Table 4‐9, the combined costs for those transportation needs identified by the MPOs and COGs total to
almost $4 billion. The COG areas needing the highest share include Catawba and Waccamaw.
Table 4‐9: MPO and COG Transportation Needs Costs
COG Project Costs*
Berkeley‐Charleston‐Dorchester $356,593,000
Catawba $582,965,000
Central Midlands $71,292,291
Lower Savannah $176,504,415
Pee Dee $181,728,041
S.C. Appalachian $52,160,000
Upper Savannah $403,000,000
Waccamaw $2,129,357,000
TOTAL $3,953,599,747
*Please note that the costs represented in this table are those costs associated with the transportation needs as submitted by the MPOs and COGs within a specific COG area. Not all needs were submitted with associated costs.
4.3 Strategic Corridor Congestion Analysis This section describes the methodology used for analyzing the congestion on the Statewide Strategic
Corridor Network and the results of the analysis.
4.3.1 Methodology
The 2010 Highway Capacity Manual (HCM) provides different methodologies for analyzing multi‐lane
and two‐lane highways based upon the cross section and character of the roadway. For example, the
Level of Service (LOS) criteria for multi‐lane highways with two or more miles between traffic signals is
based upon density, while criteria for two‐lane highways with two or more miles between traffic
signals is based upon average travel speed, percent time spent following (HCM Exhibit 15‐3), or
percent free‐flow speed. Due to the varying nature of HCM methodologies relating to the identified
Strategic Corridors, a single analysis metric was defined to provide a direct comparison between
Strategic Corridors. The metric used in the analysis of the Strategic Corridors was “adjusted vehicle‐
hours lost per mile,” and is defined as follows:
Total vehicle‐hours lost on the segment (for Strategic Corridor segments of less than one mile in length)
South Carolina Strategic Corridors Plan
Multimodal Needs Identified by MPOs and COGs
SOUTH CAROLINA MULTIMODAL TRANSPORTATION PLAN
42
Vehicle‐hours lost on the segment divided by the segment length (for Strategic Corridor segments of one mile or greater)
Vehicle‐hours lost (VHL) is defined as the total time lost by all drivers traveling a roadway segment
between the hours of 7 AM and 7 PM on the average day, and is calculated by the following formula:
7 7
0.8
The data utilized and calculations implemented to determine the vehicle‐hours lost are discussed in
detail below.
4.3.2 Data and Calculations
4.3.2.1 Probe Speed Data
The speed information on South Carolina’s Strategic Corridors was obtained from historical probe
speed data. Probe speed data sources collect speed information along roadway segments in South
Carolina every few seconds from millions of anonymous GPS‐enabled vehicles and mobile devices, as
well as traditional road sensors, which provide SCDOT with accurate real‐time and historical traffic
speed information. For roadways where probe speed data was not available, a constant was
determined for urban and rural segments representing the average hours lost.
The average speed variable for each Strategic Corridor segment was derived from the probe speed
information averaged over all Tuesdays, Wednesdays, and Thursdays from September 2012 to
September 2013 for the 12 study hours. The Free‐Flow Speed (FFS) for each Strategic Corridor segment
was derived from the maximum average speed on the segment over all Tuesdays, Wednesdays, and
Thursdays from September 2012 to September 2013.
In addition to the speed data, the Strategic Corridor segment length, in miles, was derived from the
probe speed data.
4.3.2.2 Average Annual Daily Traffic (AADT)
The AADT used in the VHL calculation was determined from the SCDOT count stations along the
Strategic Corridors in 2012. For Strategic Corridor segments without SCDOT count stations, substitute
traffic volume data was derived from adjacent count stations.
Because the time period being analyzed to determine VHL was between 7 AM and 7 PM, a factor of 0.8
was used to represent the percentage of AADT on the roadway segment between 7 AM and 7 PM.
4.3.2.3 Adjusted Vehicle‐Hours Lost per Mile
An adjusted VHL per mile metric was used to compare and rank the respective levels of congestion for
the individual Strategic Corridor segments. The raw VHL value was adjusted based upon segment
length, as previously discussed, because some Strategic Corridor segments with extremely short
lengths were artificially being represented as causing exceedingly high VHL per mile. Therefore,
Strategic Corridors with a segment length of less than one mile were not analyzed on a per‐mile basis.
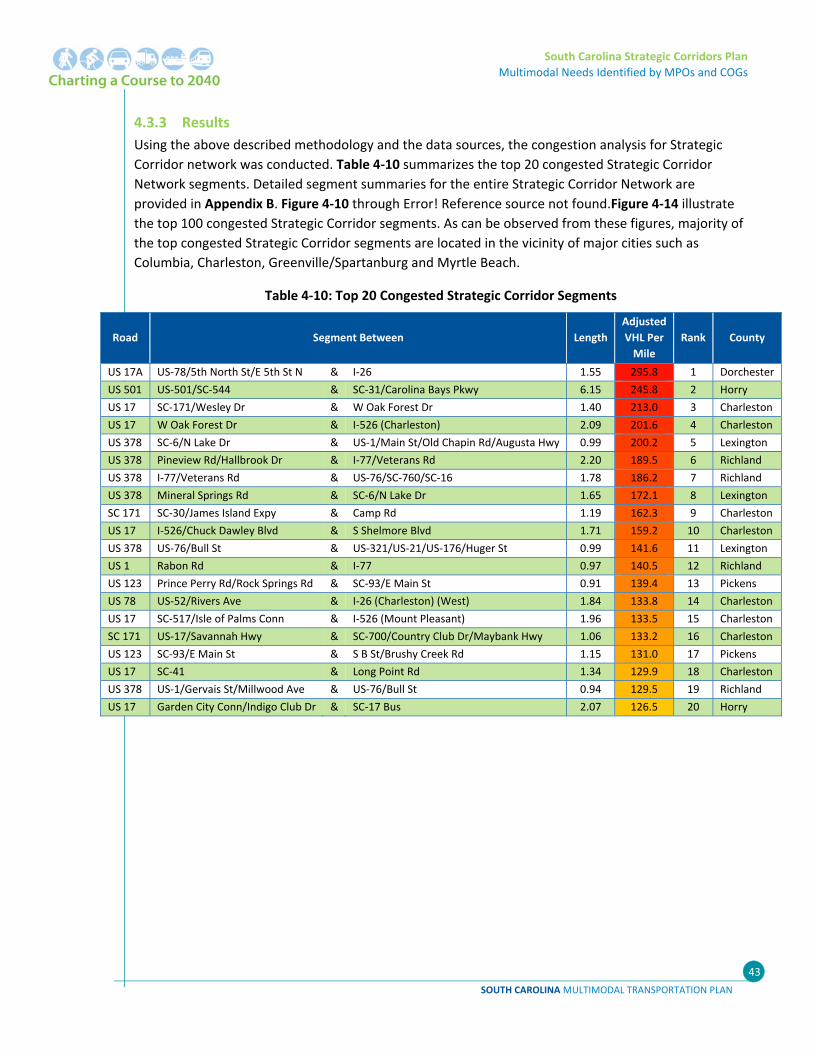
South Carolina Strategic Corridors Plan
Multimodal Needs Identified by MPOs and COGs
SOUTH CAROLINA MULTIMODAL TRANSPORTATION PLAN
43
4.3.3 Results
Using the above described methodology and the data sources, the congestion analysis for Strategic
Corridor network was conducted. Table 4‐10 summarizes the top 20 congested Strategic Corridor
Network segments. Detailed segment summaries for the entire Strategic Corridor Network are
provided in Appendix B. Figure 4‐10 through Error! Reference source not found.Figure 4‐14 illustrate
the top 100 congested Strategic Corridor segments. As can be observed from these figures, majority of
the top congested Strategic Corridor segments are located in the vicinity of major cities such as
Columbia, Charleston, Greenville/Spartanburg and Myrtle Beach.
Table 4‐10: Top 20 Congested Strategic Corridor Segments
Road Segment Between Length
Adjusted
VHL Per
Mile
Rank County
US 17A US‐78/5th North St/E 5th St N & I‐26 1.55 295.8 1 Dorchester
US 501 US‐501/SC‐544 & SC‐31/Carolina Bays Pkwy 6.15 245.8 2 Horry
US 17 SC‐171/Wesley Dr & W Oak Forest Dr 1.40 213.0 3 Charleston
US 17 W Oak Forest Dr & I‐526 (Charleston) 2.09 201.6 4 Charleston
US 378 SC‐6/N Lake Dr & US‐1/Main St/Old Chapin Rd/Augusta Hwy 0.99 200.2 5 Lexington
US 378 Pineview Rd/Hallbrook Dr & I‐77/Veterans Rd 2.20 189.5 6 Richland
US 378 I‐77/Veterans Rd & US‐76/SC‐760/SC‐16 1.78 186.2 7 Richland
US 378 Mineral Springs Rd & SC‐6/N Lake Dr 1.65 172.1 8 Lexington
SC 171 SC‐30/James Island Expy & Camp Rd 1.19 162.3 9 Charleston
US 17 I‐526/Chuck Dawley Blvd & S Shelmore Blvd 1.71 159.2 10 Charleston
US 378 US‐76/Bull St & US‐321/US‐21/US‐176/Huger St 0.99 141.6 11 Lexington
US 1 Rabon Rd & I‐77 0.97 140.5 12 Richland
US 123 Prince Perry Rd/Rock Springs Rd & SC‐93/E Main St 0.91 139.4 13 Pickens
US 78 US‐52/Rivers Ave & I‐26 (Charleston) (West) 1.84 133.8 14 Charleston
US 17 SC‐517/Isle of Palms Conn & I‐526 (Mount Pleasant) 1.96 133.5 15 Charleston
SC 171 US‐17/Savannah Hwy & SC‐700/Country Club Dr/Maybank Hwy 1.06 133.2 16 Charleston
US 123 SC‐93/E Main St & S B St/Brushy Creek Rd 1.15 131.0 17 Pickens
US 17 SC‐41 & Long Point Rd 1.34 129.9 18 Charleston
US 378 US‐1/Gervais St/Millwood Ave & US‐76/Bull St 0.94 129.5 19 Richland
US 17 Garden City Conn/Indigo Club Dr & SC‐17 Bus 2.07 126.5 20 Horry
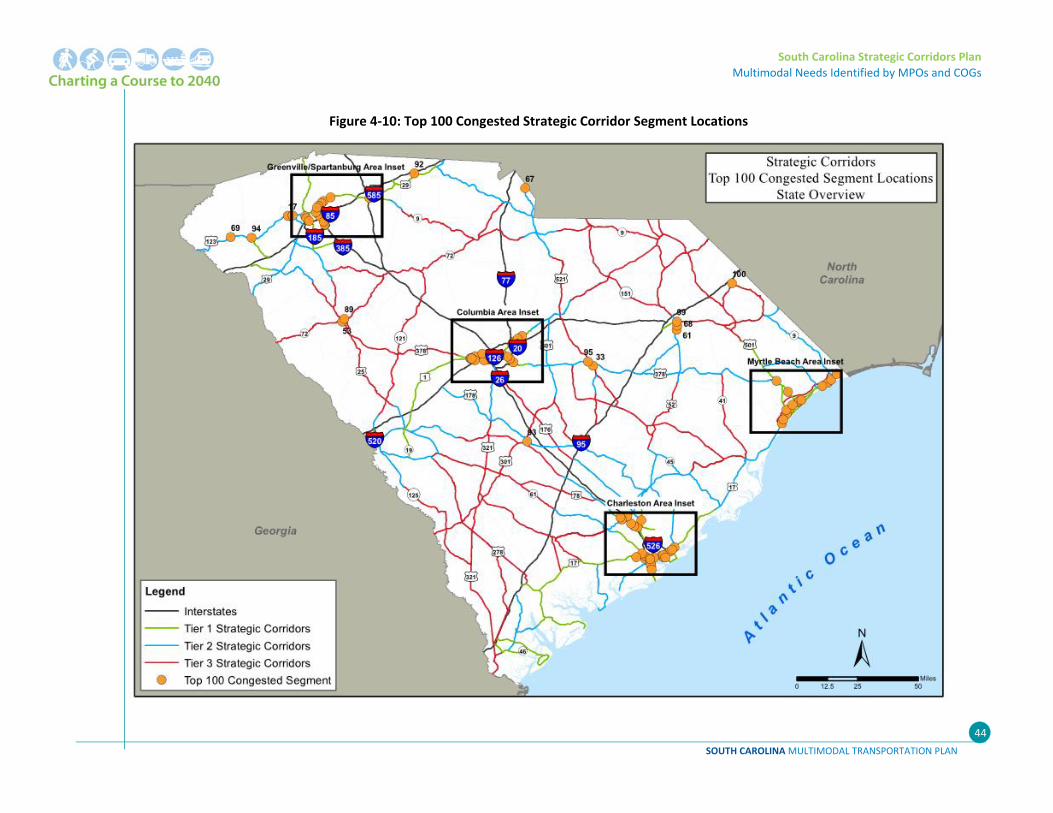
South Carolina Strategic Corridors Plan
Multimodal Needs Identified by MPOs and COGs
SOUTH CAROLINA MULTIMODAL TRANSPORTATION PLAN
44
Figure 4‐10: Top 100 Congested Strategic Corridor Segment Locations
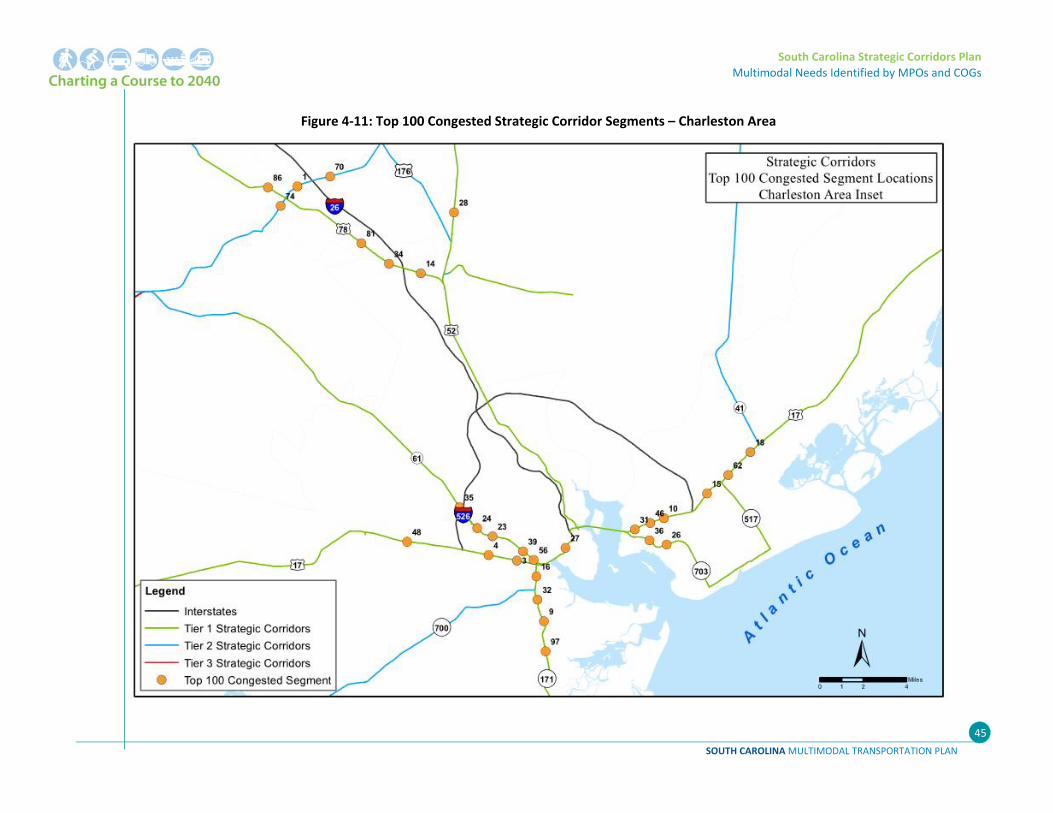
South Carolina Strategic Corridors Plan
Multimodal Needs Identified by MPOs and COGs
SOUTH CAROLINA MULTIMODAL TRANSPORTATION PLAN
45
Figure 4‐11: Top 100 Congested Strategic Corridor Segments – Charleston Area
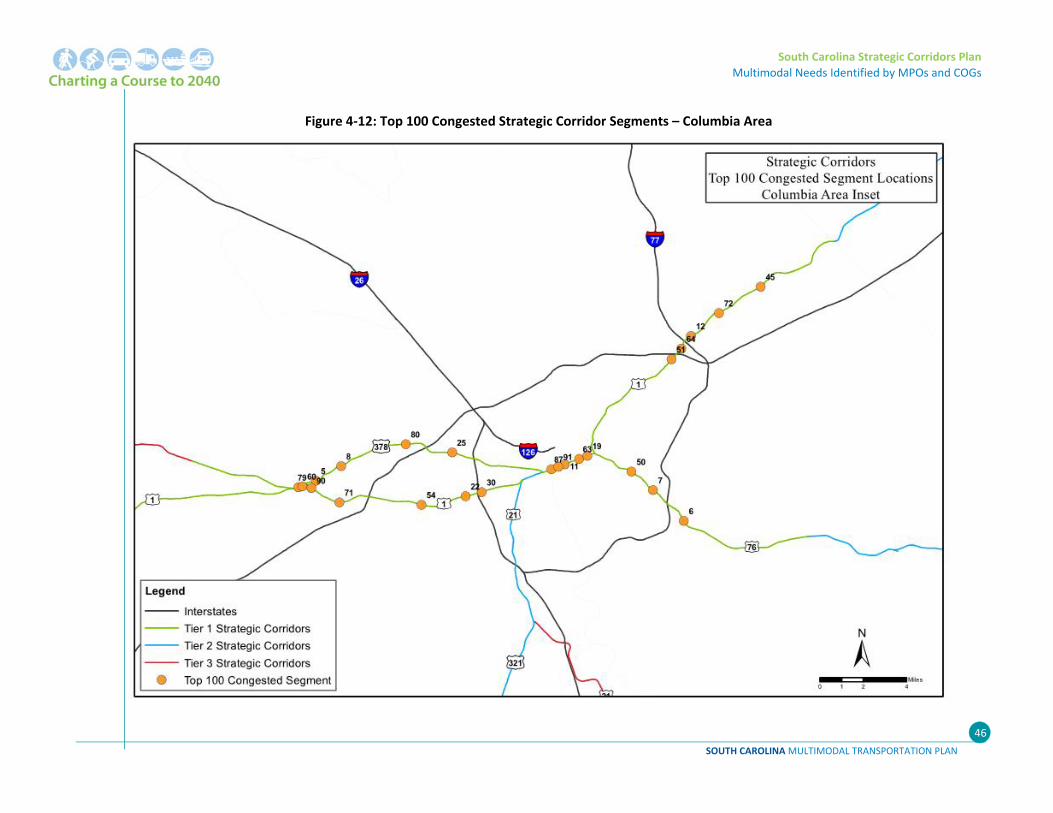
South Carolina Strategic Corridors Plan
Multimodal Needs Identified by MPOs and COGs
SOUTH CAROLINA MULTIMODAL TRANSPORTATION PLAN
46
Figure 4‐12: Top 100 Congested Strategic Corridor Segments – Columbia Area
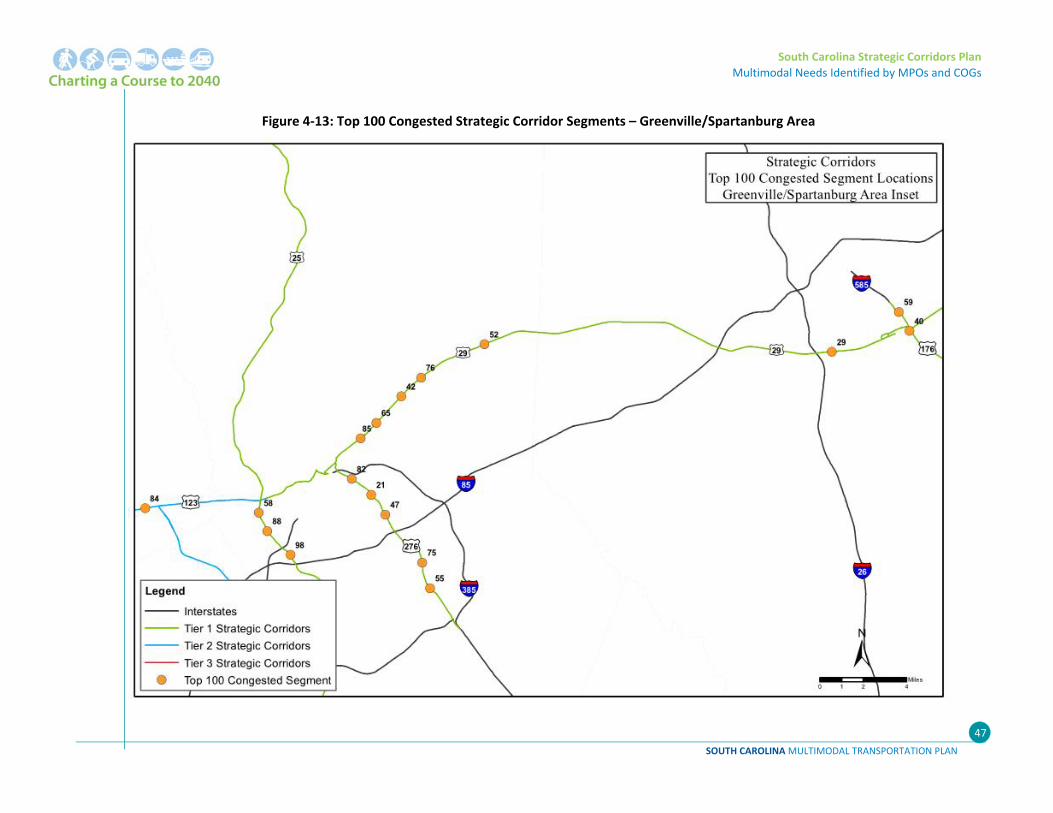
South Carolina Strategic Corridors Plan
Multimodal Needs Identified by MPOs and COGs
SOUTH CAROLINA MULTIMODAL TRANSPORTATION PLAN
47
Figure 4‐13: Top 100 Congested Strategic Corridor Segments – Greenville/Spartanburg Area
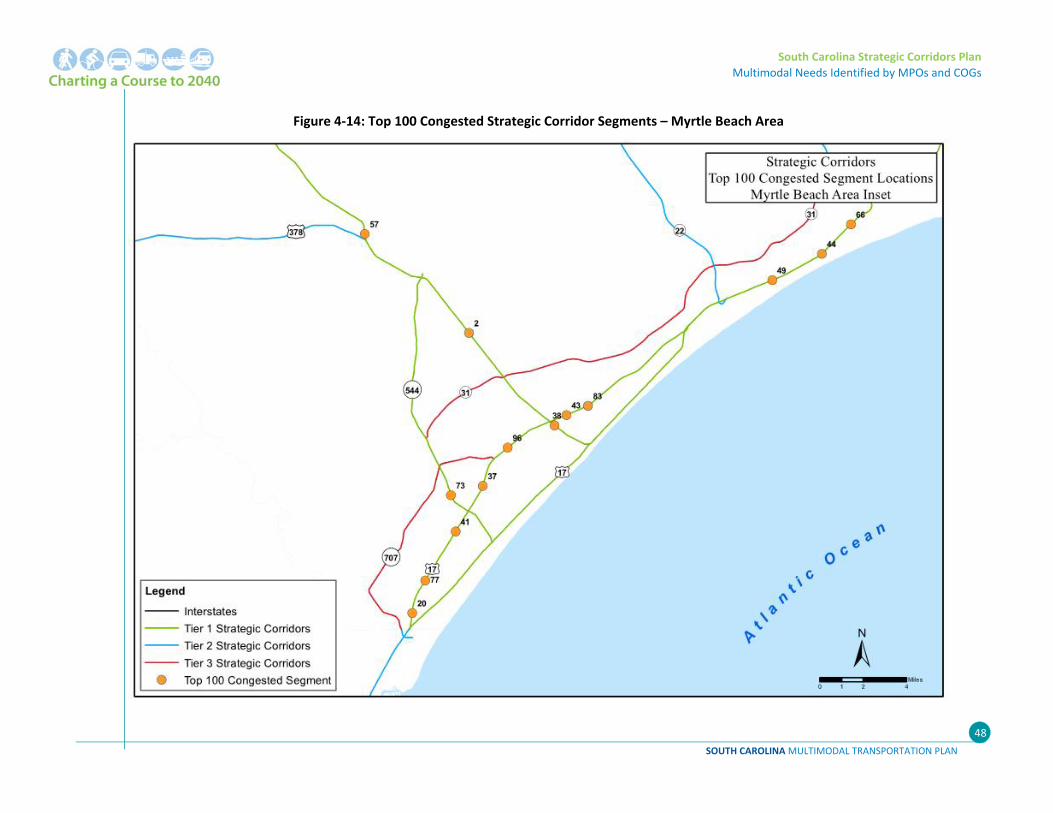
South Carolina Strategic Corridors Plan
Multimodal Needs Identified by MPOs and COGs
SOUTH CAROLINA MULTIMODAL TRANSPORTATION PLAN
48
Figure 4‐14: Top 100 Congested Strategic Corridor Segments – Myrtle Beach Area
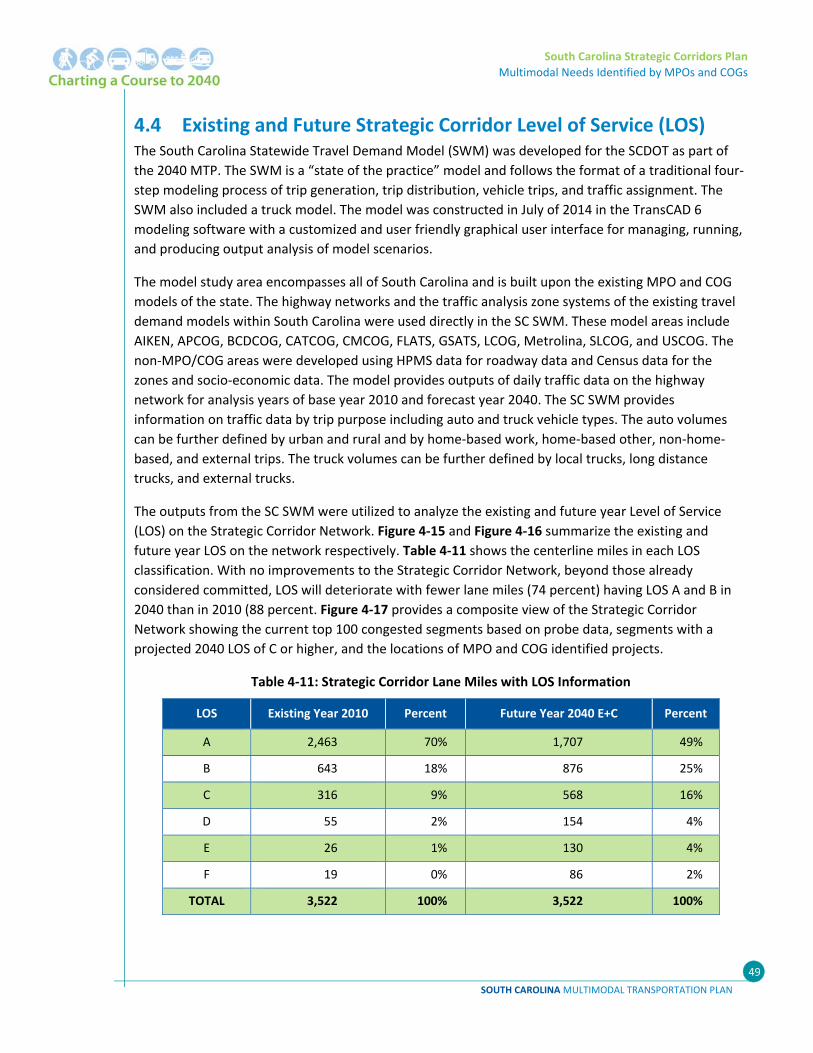
South Carolina Strategic Corridors Plan
Multimodal Needs Identified by MPOs and COGs
SOUTH CAROLINA MULTIMODAL TRANSPORTATION PLAN
49
4.4 Existing and Future Strategic Corridor Level of Service (LOS) The South Carolina Statewide Travel Demand Model (SWM) was developed for the SCDOT as part of
the 2040 MTP. The SWM is a “state of the practice” model and follows the format of a traditional four‐
step modeling process of trip generation, trip distribution, vehicle trips, and traffic assignment. The
SWM also included a truck model. The model was constructed in July of 2014 in the TransCAD 6
modeling software with a customized and user friendly graphical user interface for managing, running,
and producing output analysis of model scenarios.
The model study area encompasses all of South Carolina and is built upon the existing MPO and COG
models of the state. The highway networks and the traffic analysis zone systems of the existing travel
demand models within South Carolina were used directly in the SC SWM. These model areas include
AIKEN, APCOG, BCDCOG, CATCOG, CMCOG, FLATS, GSATS, LCOG, Metrolina, SLCOG, and USCOG. The
non‐MPO/COG areas were developed using HPMS data for roadway data and Census data for the
zones and socio‐economic data. The model provides outputs of daily traffic data on the highway
network for analysis years of base year 2010 and forecast year 2040. The SC SWM provides
information on traffic data by trip purpose including auto and truck vehicle types. The auto volumes
can be further defined by urban and rural and by home‐based work, home‐based other, non‐home‐
based, and external trips. The truck volumes can be further defined by local trucks, long distance
trucks, and external trucks.
The outputs from the SC SWM were utilized to analyze the existing and future year Level of Service
(LOS) on the Strategic Corridor Network. Figure 4‐15 and Figure 4‐16 summarize the existing and
future year LOS on the network respectively. Table 4‐11 shows the centerline miles in each LOS
classification. With no improvements to the Strategic Corridor Network, beyond those already
considered committed, LOS will deteriorate with fewer lane miles (74 percent) having LOS A and B in
2040 than in 2010 (88 percent. Figure 4‐17 provides a composite view of the Strategic Corridor
Network showing the current top 100 congested segments based on probe data, segments with a
projected 2040 LOS of C or higher, and the locations of MPO and COG identified projects.
Table 4‐11: Strategic Corridor Lane Miles with LOS Information
LOS Existing Year 2010 Percent Future Year 2040 E+C Percent
A 2,463 70% 1,707 49%
B 643 18% 876 25%
C 316 9% 568 16%
D 55 2% 154 4%
E 26 1% 130 4%
F 19 0% 86 2%
TOTAL 3,522 100% 3,522 100%
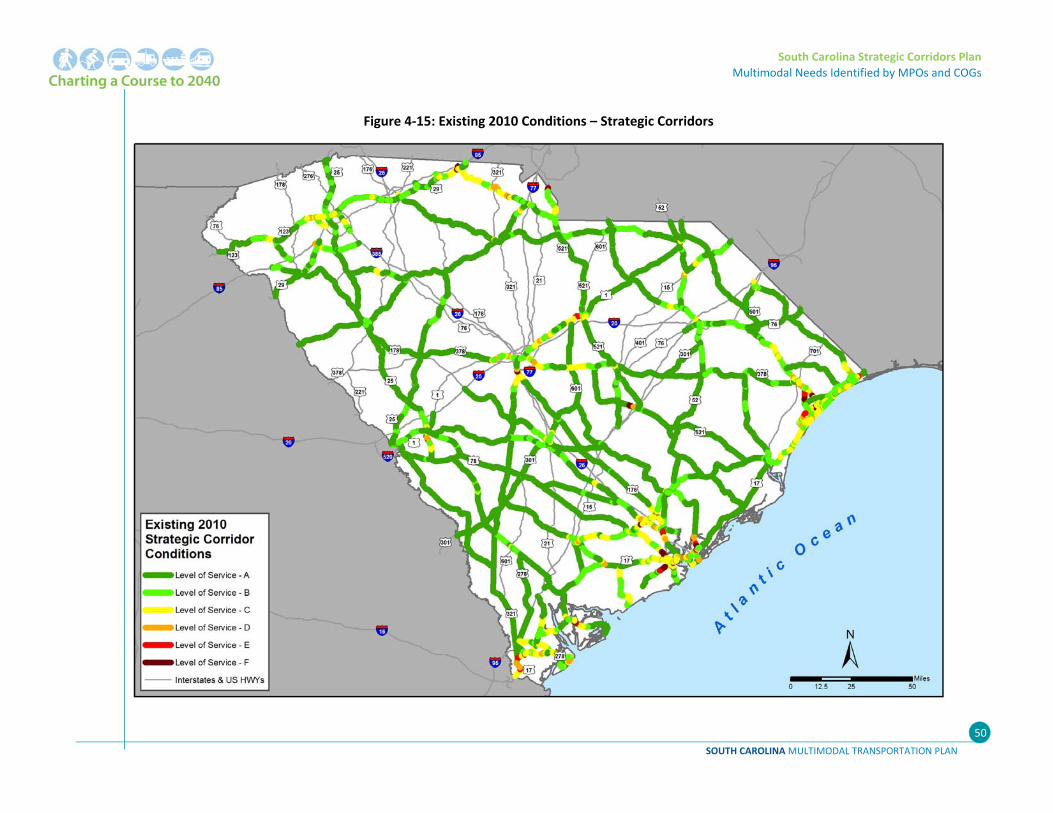
South Carolina Strategic Corridors Plan
Multimodal Needs Identified by MPOs and COGs
SOUTH CAROLINA MULTIMODAL TRANSPORTATION PLAN
50
Figure 4‐15: Existing 2010 Conditions – Strategic Corridors

South Carolina Strategic Corridors Plan
Multimodal Needs Identified by MPOs and COGs
SOUTH CAROLINA MULTIMODAL TRANSPORTATION PLAN
51
Figure 4‐16: Future 2040 Conditions – Strategic Corridors
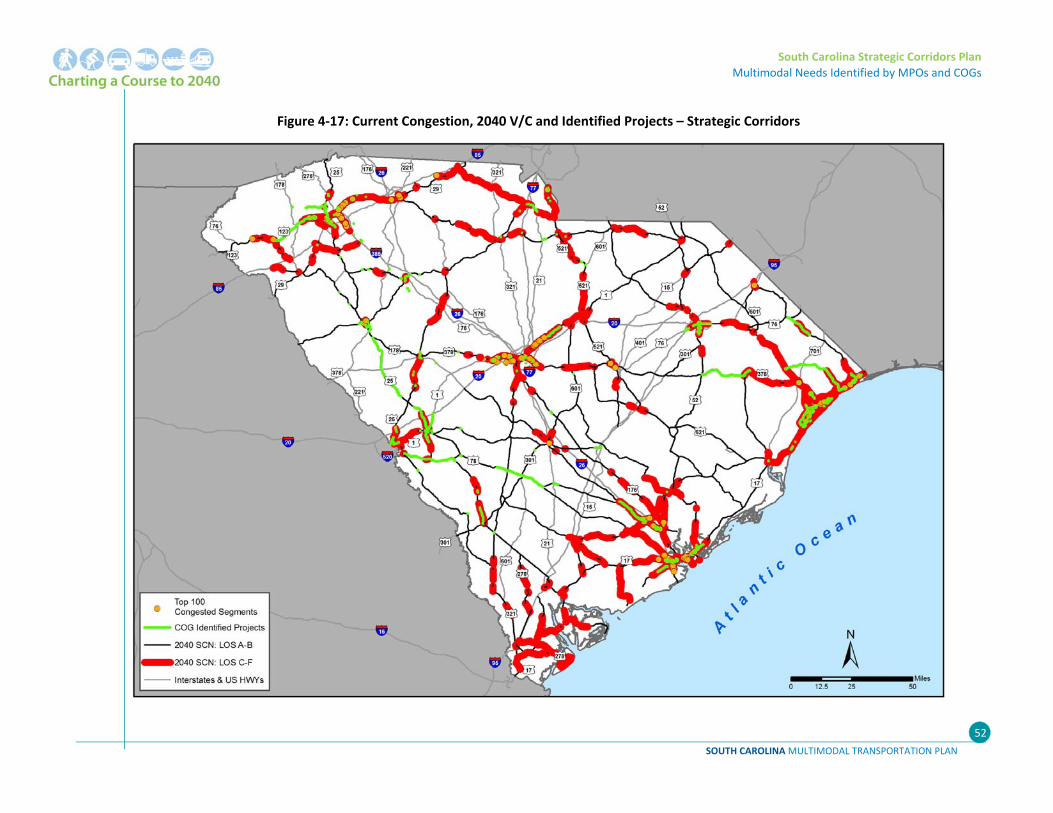
South Carolina Strategic Corridors Plan
Multimodal Needs Identified by MPOs and COGs
SOUTH CAROLINA MULTIMODAL TRANSPORTATION PLAN
52
Figure 4‐17: Current Congestion, 2040 V/C and Identified Projects – Strategic Corridors
South Carolina Strategic Corridors Plan
Multimodal Needs Identified by MPOs and COGs
SOUTH CAROLINA MULTIMODAL TRANSPORTATION PLAN
53
4.5 Congestion Management Strategies In addition to developing the Statewide Strategic Corridors Network, SCDOT recognizes the importance
of identifying potential congestion management strategies currently being promoted or which can be
implemented throughout the state especially on the Statewide Strategic Corridors Network.
The continued growth in travel along with limited funding for roadway expansion and improvement
projects is exceeding South Carolina’s ability to provide sufficient roadway capacity in critical areas. In
addition, high construction costs, constrained right‐of‐way, and environmental factors are leading to
context‐sensitive solutions to mitigate the detrimental effects of congestion while optimizing the use
of limited public funding.
“Congestion management is the application of strategies to improve transportation
system performance and reliability by reducing the adverse impacts of congestion on the
movement of people and goods.”
Federal Highway Administration, Congestion Management Process: A Guidebook, 2011
According to Federal Highway Administration (FHWA), congestion management is a primary strategy
agencies use to operate facilities. Figure 4‐18 illustrates a variety of factors, both recurring and
nonrecurring, which cause congestion. Nationally, non‐recurrent congestion totals 55 percent and
includes traffic incidents, bad weather, work zones, and special events. Recurrent congestion totals 45
percent and includes bottlenecks, and poor signal timing.
Figure 4‐18: Causes of Congestion in the United States
Source: FHWA, Office of Operations
Special Events5%
Work Zones10%
Bad Weather15%
Traffic Incidents25%
Bottlenecks40%
Poor Signal Timing5%
RecurrentCongestion = 45% Non‐recurrent
Congestion = 55%
South Carolina Strategic Corridors Plan
Multimodal Needs Identified by MPOs and COGs
SOUTH CAROLINA MULTIMODAL TRANSPORTATION PLAN
54
Example Projects
COG: Waccamaw
Location: SC 9 from S‐26‐57 to the US 17 Interchange
Description: Construct plantable median with appropriate median opening spacing between full movement signalized intersections and partial movement left turns
FHWA has designated congestion mitigation as one of its "vital few" priorities and is targeting
resources to develop and sustain regional partnerships to address all aspects of congestion. Various
operational and management strategies and methods exist for mitigating congestion and its impact on
roadway users. For example, to combat recurring congestion in the freeway environment, SCDOT
undertakes freeway management and traffic operations through policies, strategies, and actions to
enhance mobility. These strategies include roadway improvements such as widening and bottleneck
removal, operational improvements, ramp management and control,
and managed lanes. Mitigation techniques for nonrecurring congestion
include management of incidents, work zones, road weather, and
planned special events. All of these strategies center on promoting
efficiency, streamlining the movement of people and goods, and
“getting more out of facilities already in place.”2
SCDOT, MPOs and COGs can use a “toolbox” of many congestion
management strategies. Listed below are a few potential Congestion
Management strategies that will help alleviate congestion on the
Strategic Corridor network. These sample strategies have been
organized into three categories including: Roadway Operational
Improvements; Alternative Mode Support Strategies; and Demand Management Strategies. Each
strategy includes a brief description.
4.5.1 Roadway Operational Improvements
These strategies focus on improving traffic operation by getting more out of South Carolina’s current
infrastructure rather than building new infrastructure. Many of these operations‐based strategies are
supported by the use of enhanced technologies or Intelligent Transportation Systems (ITS).
4.5.1.1 Access Management
Access management is the planning and coordination of the location, number, spacing, and design of
access points such as driveways and street connections, medians and median openings, traffic signals,
and intersections. It includes policies, design criteria, and facilities that minimize the number of
driveways and intersecting roads accessing a main road.
Impact on Congestion — Access management results in fewer crashes, higher average vehicle speeds,
and more vehicle throughput. In addition, access management strategies complement the needs of
pedestrians and bicyclists, such as reducing the number of driveways across a sidewalk. In other
situations, access management could have negative consequences for these modes by reducing the
number of signalized crossings and increasing exposure to higher‐speed traffic, so analysis is required
to understand the impacts. Conventional access management strategies do nothing to encourage
higher vehicle occupancy or to discourage peak‐hour vehicle use. The ability to effectively manage
2 "Congestion Mitigation." Federal Highway Administration Web site, http://ops.fhwa.dot.gov/congestionmitigation/congestionmitigation.cfm.
South Carolina Strategic Corridors Plan
Multimodal Needs Identified by MPOs and COGs
SOUTH CAROLINA MULTIMODAL TRANSPORTATION PLAN
55
Example Projects
COG: Waccamaw
Location: US 17
Description: Improved coordination of traffic signals within Garden City, Myrtle Beach and Surfside Beach
Example Projects
COG: Lower Savannah
Location: US 25 and S‐45
Description: Addition of turn lanes and intersection realignment
access on and off the Strategic Corridor network could increase roadway capacity, improve safety by
reducing crashes, and decrease travel times.
4.5.1.2 Improving Traffic Signalization
Optimizing traffic signal timing can improve travel times along congested corridors. However, control
systems vary in the extent which they adapt to current conditions and in the extent that they
synchronize with a larger signalized network. For instance, signals may be pre‐timed and isolated, pre‐
timed and synchronized, actuated by events such as the arrival of a vehicle, pedestrian, bus, or
emergency vehicle. Signals may also be set to adopt one of several pre‐defined phasing plans based on
current traffic conditions, or set to calculate an optimal phasing plan based on current conditions.
Traffic signalization or Transportation Systems Management (TSM) offers lower cost techniques and
encourages coordination of transportation improvements, and represent another performance‐driven
approach for addressing congestion and safety issues.
Impact on Congestion — Good signal timing can greatly reduce delay at intersections, travel time, and
stop time. However, more complex systems do not always produce better results. Systems with transit
signal priority have reduced transit travel times although sometimes at the expense of other vehicles.
Signals can also be used to better accommodate pedestrian and cyclists
at intersections, but signal phasing that maximizes vehicle throughput
may do so at the expense of these other modes. In general, signal
phasing that reduces vehicle delay does nothing to discourage peak‐
hour vehicle use.
4.5.1.3 One‐Way Streets
Converting streets to one‐way operations establishes or removes pairs
of one‐way streets in place of a standard two‐way street. This could
include modifying the one‐way or two‐way nature of side streets in order to impact traffic patterns on
a mainline corridor. Systems of one‐way streets facilitate signal synchronization and can reduce the
need for disruptive right‐ and left‐hand turns, thus enabling higher
speeds and more capacity along arterials.
Impact on Congestion —While there are generally fewer crashes on
one‐way streets (including those involving pedestrians), seemingly due
to simpler intersection designs, it is also possible that higher volumes of
faster traffic make streets more dangerous for pedestrians and cyclists.
In addition, one‐way streets do nothing to encourage higher vehicle
occupancy and to discourage peak‐hour vehicle use.
4.5.1.4 Geometric Improvements to Roads and Intersections
Such strategies include the addition or reconfiguration of turning lanes, lane widening, realignment of
intersecting streets, and improved acceleration or deceleration lanes at interchange ramps. Removal of
a physical constriction that delays travel, such as widening an underpass, providing lane continuity (i.e.,
replacing a two‐lane bridge that connects pieces of four‐lane roadway), or eliminating a sight barrier.
Such strategies may be applied to highways, arterials, or local streets.
South Carolina Strategic Corridors Plan
Multimodal Needs Identified by MPOs and COGs
SOUTH CAROLINA MULTIMODAL TRANSPORTATION PLAN
56
Impact on Congestion — These strategies are most able to make a difference for congestion caused by
physical bottlenecks. Remedying these problem situations can help make the most of existing road
capacity and improve overall traffic flow. However, geometric changes to promote vehicle flow on
arterials and local streets can potentially have negative consequences for alternative modes competing
for the same space. Furthermore, none of these sorts of strategies encourage higher vehicle occupancy
nor discourage peak‐hour vehicle use.
4.5.1.5 Advanced Parking Systems
Advanced parking systems help drivers find or reserve parking, automatically store cars within the
facility, enable wireless and/or electronic payment, and/or convey real‐time information regarding the
status of a lot or metered space. Such systems are thought to decrease congestion both on local
streets, by reducing the need to circle in search of parking, and within parking facilities, by helping
motorists find and pay for parking more quickly. In some situations, real‐time information about
downstream parking sites can also help motorists make more informed mode‐choice or route
decisions.
Impact on Congestion — Traffic flow impacts in a downtown urban area with real‐time parking
availability signs include reduction in travel time, vehicle delay, and provide an intersection volume
increase.
4.5.1.6 Dynamic Messaging
Traveler information systems, such as dynamic messaging uses changeable message signs to warn
motorists of downstream queues, directs through‐traffic to alternate lanes, provides travel time
estimates, provides alternate route information, or provides information about special events, weather
conditions, or other incidents. This particularly refers to messaging that is highly responsive to current
conditions, such as using automated detection systems and remote surveillance. Such systems are
thought to mitigate congestion by diverting traffic to alternate routes and by helping to prevent new
incidents by diminishing speed differentials and collisions related to queuing or other temporary
conditions.
Impact on Congestion — Dynamic messaging has been found to significantly reduce non‐recurrent
congestion, but users stress the need for dynamic messaging to be current and responsive to changing
driving environments.
4.5.1.7 Incident Management Systems
Faster responses to traffic incidents are another operational strategy. Incident management systems
are technical and procedural systems which assist in the efficient handling of incidents, such as
emergency response, highway service patrol, highway advisory radio, and incident detection. In
addition, identifying weather and road surface problems and rapidly targeting responses increases
operations.
Impact on Congestion — Incident management systems have been shown to significantly reduce
nonrecurring congestion, improving incident clearance time and reduce the rate of secondary crashes.
South Carolina Strategic Corridors Plan
Multimodal Needs Identified by MPOs and COGs
SOUTH CAROLINA MULTIMODAL TRANSPORTATION PLAN
57
Example Projects
COG: Catawba
Location: LPA Route on US 21
Description: US 21 has been identified to be the locally preferred alternative for the eventual incorporation of a bus rapid transit operation
4.5.1.8 Special Events and Work‐Zone Planning
Anticipating and addressing special events, including emergency evacuations, which cause surges in
traffic is an important operational strategy. This area focuses on procedures and systems for managing
the impact on traffic of construction projects, disasters, or irregular events drawing large crowds.
Impact on Congestion — Successful planning can significantly reduce nonrecurring congestion
associated with special events.
4.5.2 Alternative Mode Support Strategies
Improving transit operations, improving access to transit, and
expanding transit service can help reduce the number of vehicles on the
road by making transit more attractive or accessible. These strategies
may be closely linked to the other strategies. As with traffic operations,
transit operations are often enhanced by ITS.
4.5.2.1 Public Education and Promotion
A lack of understanding of available transportation options has been
identified as a major barrier to alternative mode use. Marketing and
public education programs can help overcome that barrier, effectively
making the use of those alternative modes more convenient.
Impact on Congestion — While the impact of mass marketing campaigns on ridership is inconclusive,
targeted marketing to specific groups has proven more successful.
4.5.2.2 Interregional Transit and Commuter Services
A coordinated effort to provide transit and commuter service alternatives in communities, using
existing or low cost resources, can be beneficial to the development of public transit statewide, and
also can assist in efforts to relieve traffic congestion, improve air quality and assure energy
conservation. For example, shuttle services are a subset of public transportation using vans, shuttles,
or small buses to fill gaps in the transportation system, often serving very small or particular market
segments. They may follow either fixed or variable routes, and may operate either according to a fixed
schedule or only by demand, including demand‐response paratransit, circulator shuttles, night shuttles
on college campuses, airport shuttles, and business‐specific.
Impact on Congestion – While commuter services, such as shuttle services, are likely to have a
negligible impact on overall congestion these services may enable some motorists to replace or
shorten vehicle trips. This strategy may complement other strategies and work together towards
reducing VMT and vehicle usage. In addition, shuttle users themselves may encounter less congestion
delay if shuttle vehicles are able to utilize HOV facilities, bus only lanes, or signal preemption along
their routes.
4.5.2.3 Ridesharing Programs
These programs facilitate carpool formation, including ride‐matching services, group taxi services and
vanpool programs. While ride‐matching usually implies the use of passenger‐owned vehicles,
South Carolina Strategic Corridors Plan
Multimodal Needs Identified by MPOs and COGs
SOUTH CAROLINA MULTIMODAL TRANSPORTATION PLAN
58
vanpooling may utilize van fleets owned by an implementing agency or private company, differing
from shuttle services in their reliance on passengers to act as volunteer drivers.
Impact on Congestion – Rideshare programs are most effective when combined with financial
incentives such as parking cash‐out or subsidies. Thus, although the impact of isolated rideshare
programs on regional congestion may be negligible in most areas, such programs reduce VMT and
complement other strategies designed to reduce peak‐hour vehicle use. In addition rideshare
participants may themselves experience less congestion delay if they are able to utilize HOV lanes and
priority parking.
4.5.3 Demand Management Strategies
Travel Demand Management (TDM), nonautomotive travel modes, and land use management can all
help to provide travelers with more options and reduce the number of vehicles or trips during
congested periods on the Strategic Corridor network. These include strategies that substitute
communication for travel, or encourage regional cooperation to change development patterns and/or
reduce sprawl.
4.5.3.1 Traveler Information, Public Relations, and Marketing
Traveler information can be used to notify travelers of transportation options, to promote particular
options, and to tailor options to traveler needs and preferences. All of these types of traveler
information can be used to help travelers avoid congested conditions and to opt for alternatives which
contribute less to congestion. Information may be disseminated to the public via broadcast media,
written materials, signage, websites, hotlines, handheld devices, or in‐vehicle devices. Marketing
activities may additionally include surveys, user feedback, and market‐based planning to better tailor
transportation alternatives to users’ needs and preferences.
Impact on Congestion — Information about traffic conditions and special events has been shown to
influence travel choices and help users avoid and reduce congestion. Transit route, fare, and schedule
information are essential aspects of mode choice decisions and their distribution may influence
ridership.
4.5.3.2 Parking Management and Pricing
These are strategies which reduce the availability of free parking places, especially in locations served
by congested routes. Parking management may be in the form of area‐wide policies or may be specific
to particular sites. Policies might include lowering the maximum or reducing the minimum number of
spaces permitted per employee, household, or 1,000 square‐feet of office space; increasing the share
of spaces reserved for HOV vehicles; introducing or raising parking fees; providing cash‐out options for
employees not utilizing subsidized parking spaces; and expanding parking at transit stations and park‐
and‐ride lots.
Impact on Congestion — Because parking is a necessary component of most vehicle use, parking
management has been shown to have a dramatic effect on travel choices, increasing transit use and
vehicle occupancy. However, such policies have generally not been implemented widely enough to
document significant reductions in Vehicle Miles Traveled (VMT) or congestion.
South Carolina Strategic Corridors Plan
Multimodal Needs Identified by MPOs and COGs
SOUTH CAROLINA MULTIMODAL TRANSPORTATION PLAN
59
4.5.3.3 Telecommuting Programs
Telecommuting programs enable employees to telecommute to substitute for physical travel to a
worksite. Such programs may include employer policies enabling employees to work at home, or the
establishment of telework centers to serve as alternate worksites for telecommuters, or regional
campaigns to promote telecommuting, such as through education, technical assistance, and financial
incentives such as tradable credits.
Impact on Congestion — Telecommuting has the potential to reduce peak‐hour VMT substantially by
doing away with the commute trip. However, few employees actually do telecommute, and among
those that do, there is wide variation in how often and in what way, making VMT and congestion
impacts variable and difficult to estimate. For instance, employees telecommuting only for part of the
day would not reduce their VMT, but may shift one half of their commutes to an off‐peak time, and
therefore decreasing their contributions to congestion. In addition, there is evidence that
telecommuting enables some employees to live farther from work, that employees working at home
may increase other trip‐making during the day, and that the growth in telecommunications in general
has stimulated more and not less travel overall, all of which may undermine some of the benefits of
telecommuting.
4.5.3.4 Flexible Work Schedules
Flexible work schedules allow flextime, a compressed work week, or staggered shifts that enable
employees to reduce peak‐hour trip‐making.
Impact on Congestion — Commute VMT has been shown to diminish among employees on flexible
work schedules. However, the overall Impact on congestion has been negligible, since such a small
share of the work force uses flexible schedules. There may be more of an effect observed if more
employees were able to adopt flexible schedules. Furthermore, those who do adopt flexible schedules
are able to reduce their personal exposure to congestion.
SOUTH CAROLINA MULTIMODAL TRANSPORTATION PLAN
5. CONCLUSIONS
The purpose of the Statewide Strategic Corridors Network (SSCN) is to develop a focused strategic
system of roadways. After the interstate system, the SSCN represents the second most significant
network of corridors that are critical to interregional mobility for the state. To enhance the future
performance of the SSCN, the following strategies should be pursued:
Work with stakeholders to advocate the importance of the SSCN to statewide mobility and economic competitiveness
Coordinate with MPOs, COGs, and transit providers to integrate the SSCN into their transportation planning processes
Update Act 114 ranking processes to determine statewide prioritization of needs on the SSCN
As appropriate, develop Corridor Management Plans for deficient SSCN segments to identify specific strategies and improvements
5.1 Implementation The Strategic Corridor Network is a critical component of the state’s highway system and provides
regional mobility to residents and tourists, as well as both small and large companies that do business
and provide employment opportunities in South Carolina. Recently developed tools will allow SCDOT
and their MPO and COG planning partners to better analyze and optimize future investments in these
roadways.
The recently developed tools include:
A comprehensive database of current speed information provided by probe vehicles for all roads in the Interstate and Strategic Corridor networks, 24‐hours a day, seven days and week to identify congested locations, as well as the severity and duration of congestion.
A Statewide Travel Demand Model (SWM) designed to project future traffic volumes, including truck volumes, and Level of Service (LOS) on the existing road network and on alternative networks with potential improvements and additions.
A Prioritization Tool designed to meet the requirements of South Carolina’s Act 114 legislation, which includes capabilities to rank segments of the Strategic Corridor Network with projected capacity needs using Act 114 criteria, namely Congestion, Safety, Truck Traffic, Environmental, Economic Development, Financial Viability, and Pavement Condition.
South Carolina Strategic Corridors Plan
Conclusion
SOUTH CAROLINA MULTIMODAL TRANSPORTATION PLAN
61
The overlaying of information from these new data sources with project locations identified by MPOs
and COGs, as shown previously in Figure 4‐17, is a preliminary example of the output from these tools
that can guide and support future SCDOT planning efforts to implement needed improvements on the
Strategic Corridor Network in a systematic, objective manner, consistent with the requirements of
Act 114.
SOUTH CAROLINA MULTIMODAL TRANSPORTATION PLAN
62
APPENDIX A: ENVIRONMENTAL SCREENING
Under the provisions of MAP‐21 as codified in 23 U.S.C § 150(b), the federal government has
established seven (7) national goals for the federal‐aid highway program. One of those goals is
“Environmental Sustainability”, which requires the enhancement of the transportation system “while
protecting and enhancing the natural environment”. At the state level, under Section 57‐1‐370(B)(8)
as revised by the passage of Act 114 in 2007, South Carolina has established a set of criteria to be
used for project identification and prioritization of transportation projects to be included in the
Statewide Transportation Improvement Program (STIP) and receive federal funding.
The criteria set forth by Act 114 impact transportation projects identified by not only COGs and MPOs
within the state but the SCDOT as well. For COGs and MPOs, this set of criteria includes the
requirement for an assessment of environmental impact for new facility, widening, and intersection
projects. For SCDOT, the revisions to Sections 57‐1‐370 and 57‐1‐460 under Act 114 required SCDOT
to revise regulations for project selection process for bridge replacement, Interstate rehabilitation,
non‐Interstate road resurfacing, safety, interstate mainline capacity, and other forms of interstate
projects. Transportation projects identified by the SCDOT that must include an assessment of
environmental impact include those for bridge replacement and interstate and interchange facility
capacity and upgrades in addition to those projects identified for COGs and MPOs.
In order for projects to be identified, prioritized, and funded on the Statewide Strategic Corridor
Network, a baseline of potential environmental impacts must be established. The environmental
impact assessment determines the potential impacts to cultural, natural, and social resources in
association with a particular transportation project and of those areas, which may be impacted by
implementation of the said project. SCDOT conducted an environmental impact assessment for the
use of establishing a baseline impact analysis for the Statewide Strategic Corridor Network. Further
discussion below describes the methodology and results of the environmental assessment.
Methodology The environmental assessment conducted to establish the potential baseline of environmental
impacts was completed for each tier of the Statewide Strategic Corridor Network. Roadway segments
for each corridor were analyzed. This assessment reviewed multiple resource areas to determine
impacts to cultural, natural, and social resources for those roadway segments located within the
Statewide Strategic Corridors Network. Those resource areas include:
Wetlands, Threatened and endangered species, and Cultural resources.
SCDOT established a scoring system to rank each resource area. Wetlands and cultural resources
were scored by the amount of acres and threatened and endangered species by the amount of
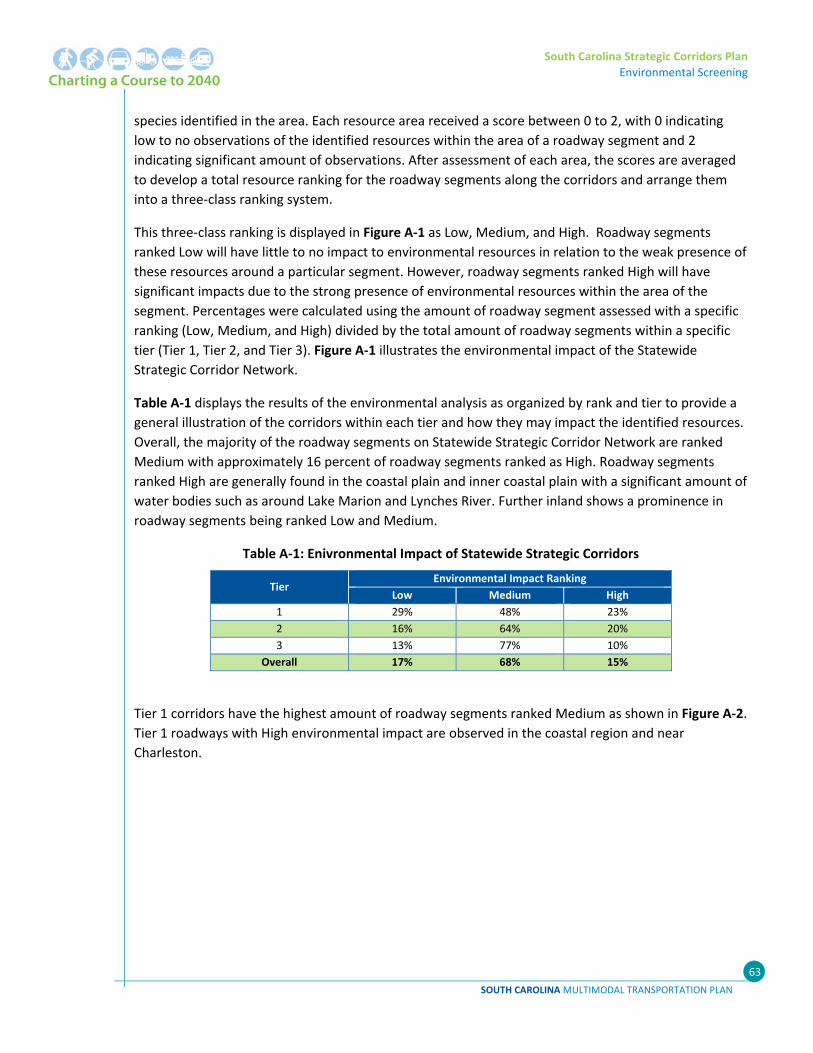
South Carolina Strategic Corridors Plan
Environmental Screening
SOUTH CAROLINA MULTIMODAL TRANSPORTATION PLAN
63
species identified in the area. Each resource area received a score between 0 to 2, with 0 indicating
low to no observations of the identified resources within the area of a roadway segment and 2
indicating significant amount of observations. After assessment of each area, the scores are averaged
to develop a total resource ranking for the roadway segments along the corridors and arrange them
into a three‐class ranking system.
This three‐class ranking is displayed in Figure A‐1 as Low, Medium, and High. Roadway segments
ranked Low will have little to no impact to environmental resources in relation to the weak presence of
these resources around a particular segment. However, roadway segments ranked High will have
significant impacts due to the strong presence of environmental resources within the area of the
segment. Percentages were calculated using the amount of roadway segment assessed with a specific
ranking (Low, Medium, and High) divided by the total amount of roadway segments within a specific
tier (Tier 1, Tier 2, and Tier 3). Figure A‐1 illustrates the environmental impact of the Statewide
Strategic Corridor Network.
Table A‐1 displays the results of the environmental analysis as organized by rank and tier to provide a
general illustration of the corridors within each tier and how they may impact the identified resources.
Overall, the majority of the roadway segments on Statewide Strategic Corridor Network are ranked
Medium with approximately 16 percent of roadway segments ranked as High. Roadway segments
ranked High are generally found in the coastal plain and inner coastal plain with a significant amount of
water bodies such as around Lake Marion and Lynches River. Further inland shows a prominence in
roadway segments being ranked Low and Medium.
Table A‐1: Enivronmental Impact of Statewide Strategic Corridors
Tier Environmental Impact Ranking
Low Medium High
1 29% 48% 23%
2 16% 64% 20%
3 13% 77% 10%
Overall 17% 68% 15%
Tier 1 corridors have the highest amount of roadway segments ranked Medium as shown in Figure A‐2.
Tier 1 roadways with High environmental impact are observed in the coastal region and near
Charleston.
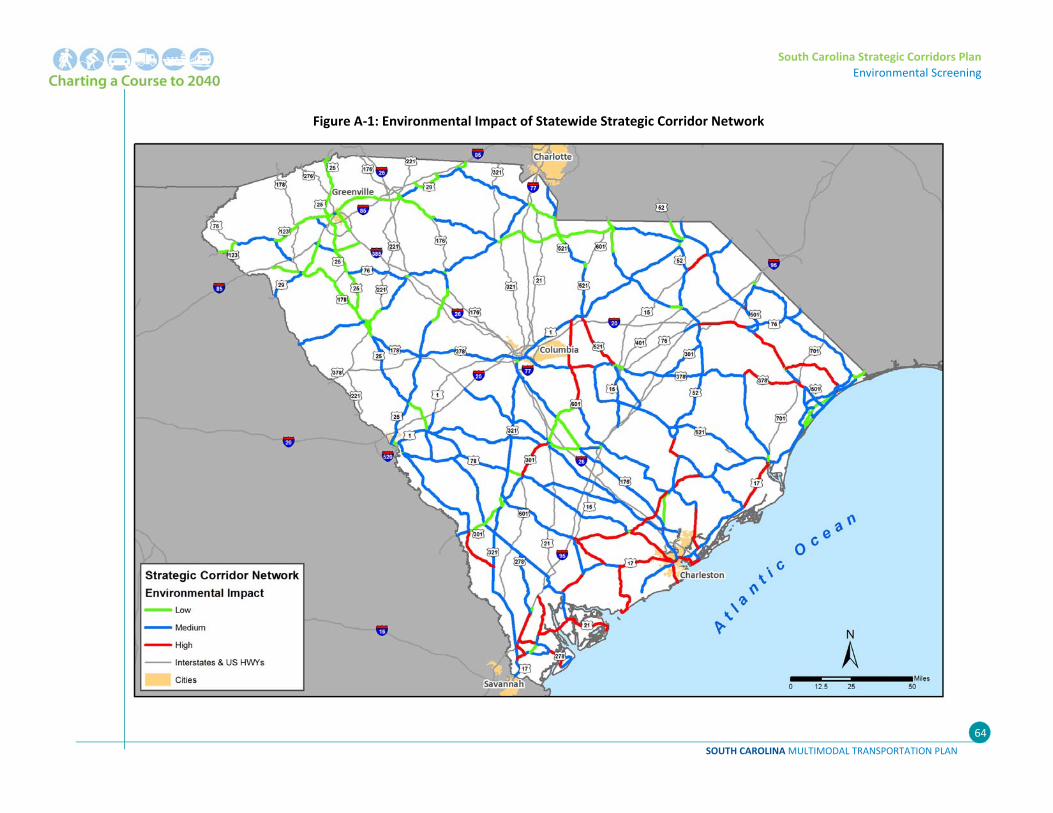
South Carolina Strategic Corridors Plan
Environmental Screening
SOUTH CAROLINA MULTIMODAL TRANSPORTATION PLAN
64
Figure A‐1: Environmental Impact of Statewide Strategic Corridor Network
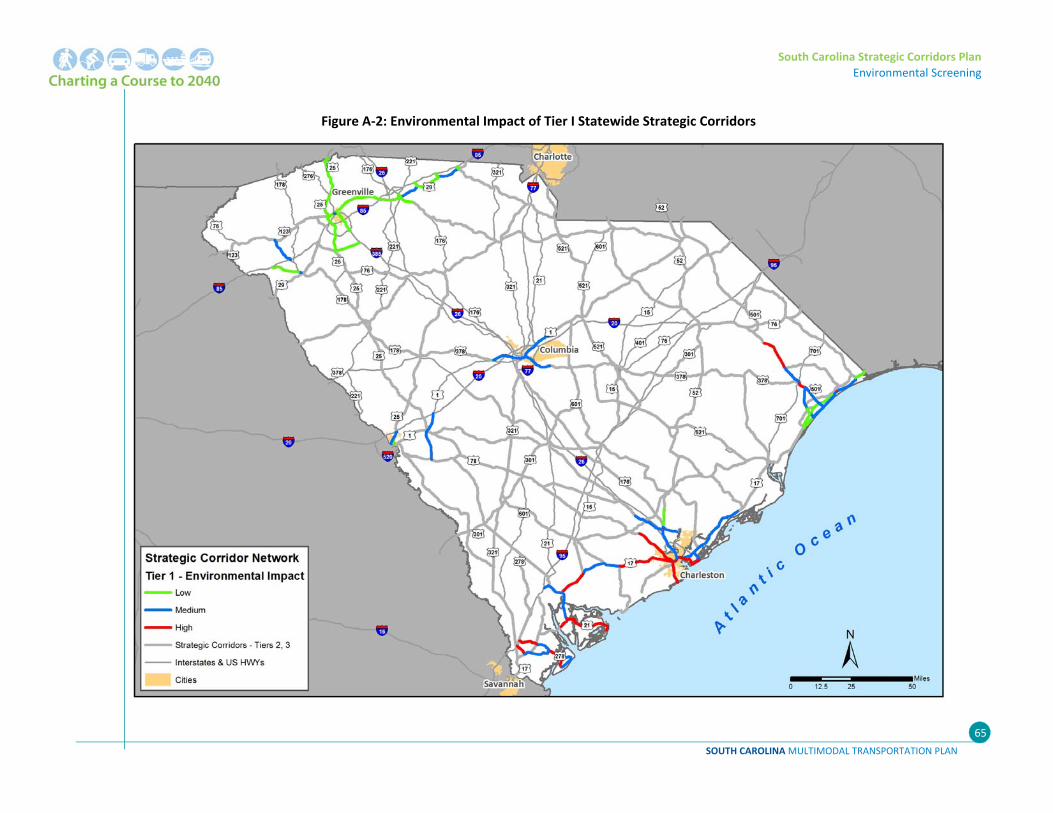
South Carolina Strategic Corridors Plan
Environmental Screening
SOUTH CAROLINA MULTIMODAL TRANSPORTATION PLAN
65
Figure A‐2: Environmental Impact of Tier I Statewide Strategic Corridors
South Carolina Strategic Corridors Plan
APPENDIX A: Environmental Screening
SOUTH CAROLINA MULTIMODAL TRANSPORTATION PLAN
66
For corridors identified as Tier 2 in Figure A‐3, the majority of the roadway segments are ranked
Medium with the next highest concentration ranked Low. Those roadway segments ranked High are
associated with areas with significant amounts of water bodies and wetlands, with some instances of
high amounts of identified species and/or cultural resources.
Tier 3 corridors had the lowest amount of roadway segments ranked High as shown in Figure A‐4.
These Tier 3 corridors also have the largest amount of roadway segments ranked Medium. Tier 3
corridors are typically located more inland though areas of concern are typically water bodies and
wetlands with some roadway segments have significant amounts of cultural resources impacts.
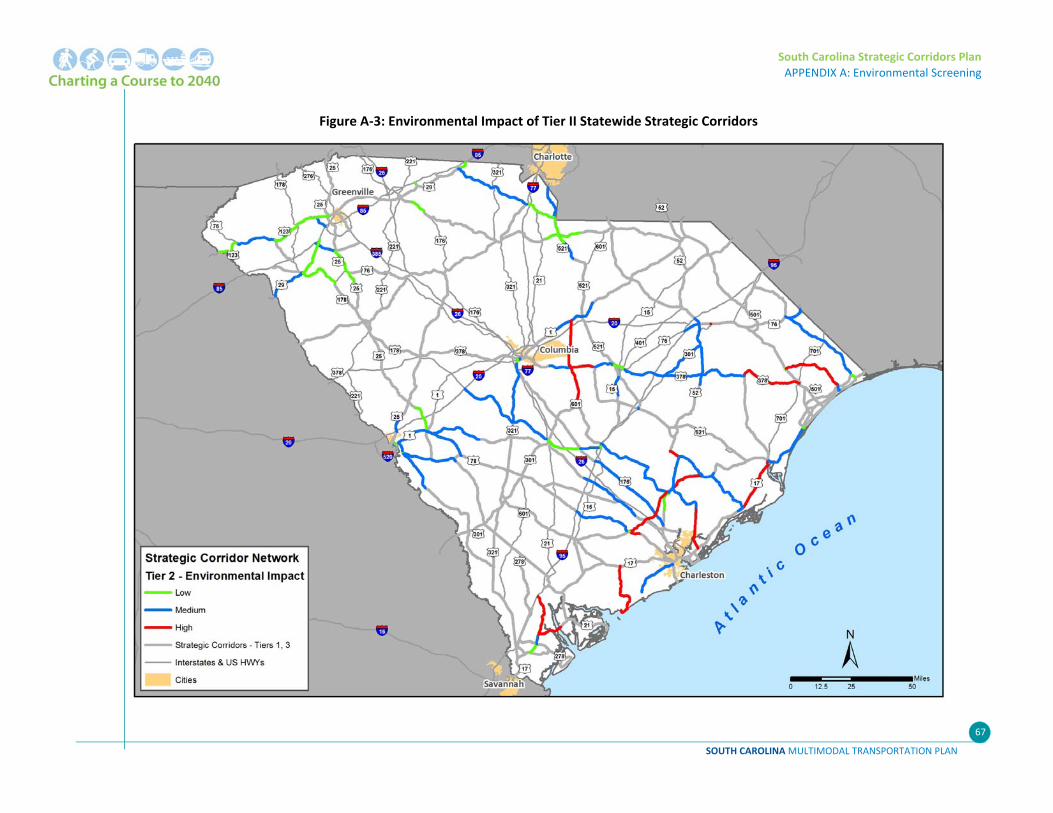
South Carolina Strategic Corridors Plan
APPENDIX A: Environmental Screening
SOUTH CAROLINA MULTIMODAL TRANSPORTATION PLAN
67
Figure A‐3: Environmental Impact of Tier II Statewide Strategic Corridors
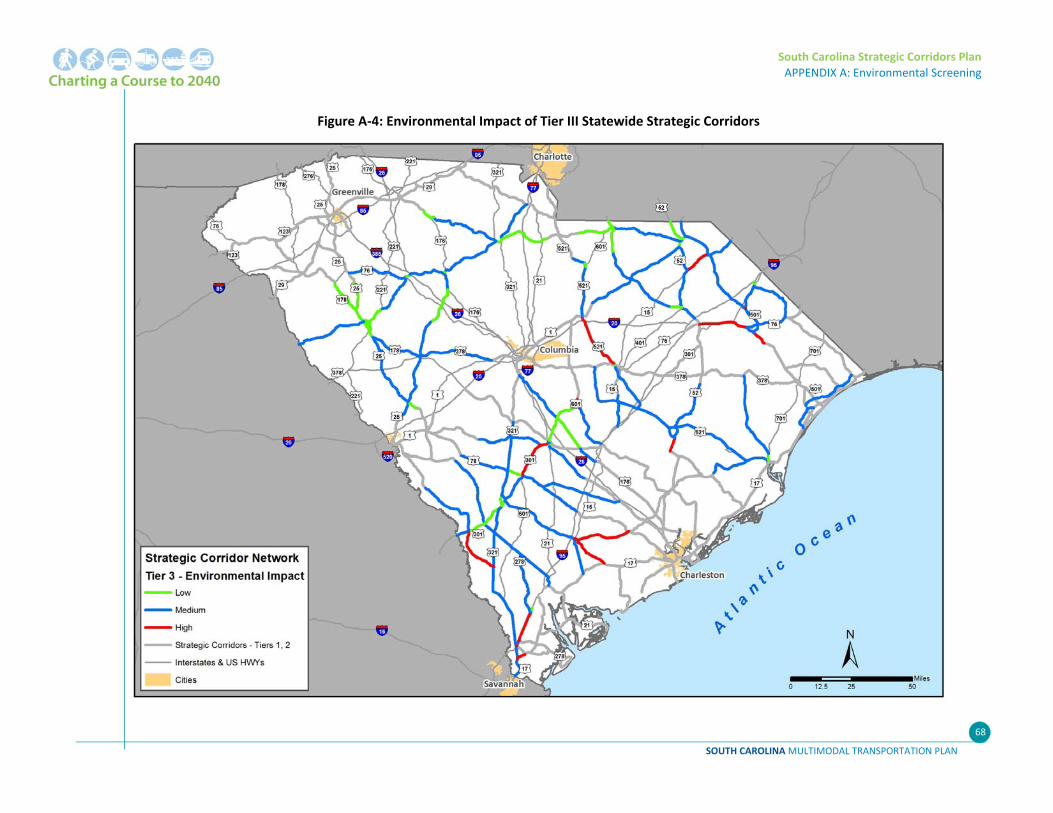
South Carolina Strategic Corridors Plan
APPENDIX A: Environmental Screening
SOUTH CAROLINA MULTIMODAL TRANSPORTATION PLAN
68
Figure A‐4: Environmental Impact of Tier III Statewide Strategic Corridors
SOUTH CAROLINA MULTIMODAL TRANSPORTATION PLAN
69
APPENDIX B: DETAILED RESULTS OF CONGESTION ANALYSIS ON STRATEGIC CORRIDORS
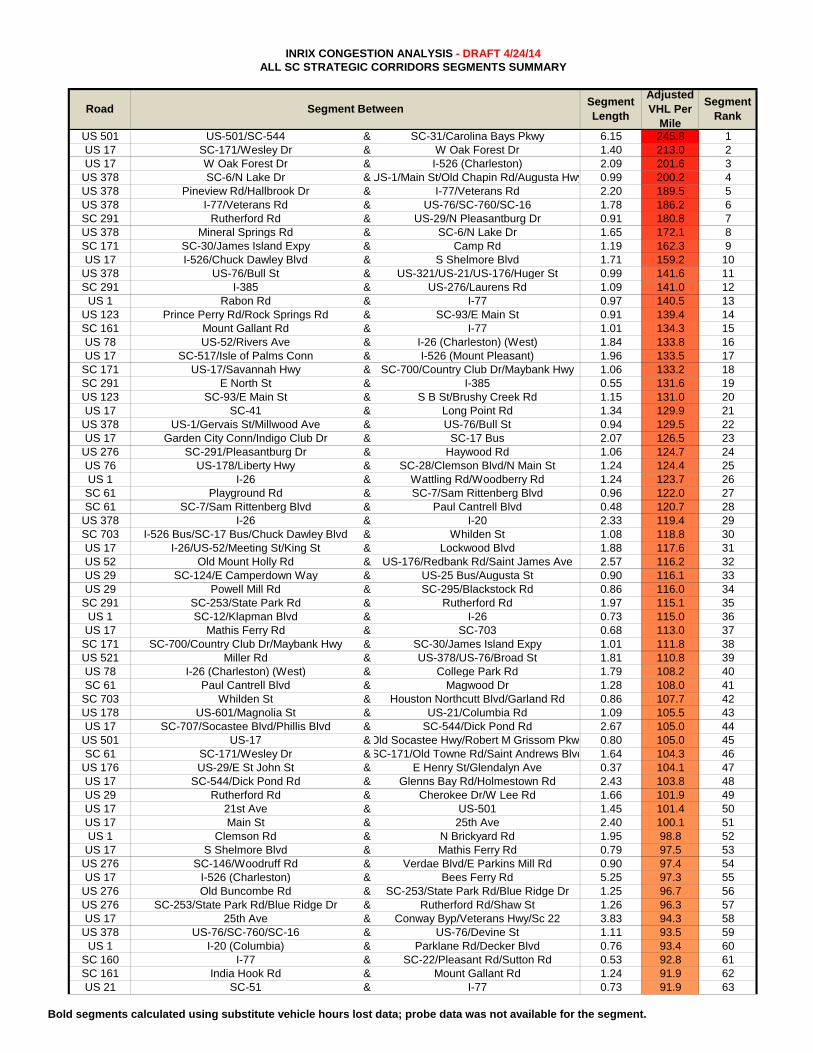
Bold segments calculated using substitute vehicle hours lost data; probe data was not available for the segment.
US 501 US-501/SC-544 & SC-31/Carolina Bays Pkwy 6.15 245.8 1US 17 SC-171/Wesley Dr & W Oak Forest Dr 1.40 213.0 2US 17 W Oak Forest Dr & I-526 (Charleston) 2.09 201.6 3
US 378 SC-6/N Lake Dr &US-1/Main St/Old Chapin Rd/Augusta Hwy 0.99 200.2 4US 378 Pineview Rd/Hallbrook Dr & I-77/Veterans Rd 2.20 189.5 5US 378 I-77/Veterans Rd & US-76/SC-760/SC-16 1.78 186.2 6SC 291 Rutherford Rd & US-29/N Pleasantburg Dr 0.91 180.8 7US 378 Mineral Springs Rd & SC-6/N Lake Dr 1.65 172.1 8SC 171 SC-30/James Island Expy & Camp Rd 1.19 162.3 9US 17 I-526/Chuck Dawley Blvd & S Shelmore Blvd 1.71 159.2 10
US 378 US-76/Bull St & US-321/US-21/US-176/Huger St 0.99 141.6 11SC 291 I-385 & US-276/Laurens Rd 1.09 141.0 12
US 1 Rabon Rd & I-77 0.97 140.5 13US 123 Prince Perry Rd/Rock Springs Rd & SC-93/E Main St 0.91 139.4 14SC 161 Mount Gallant Rd & I-77 1.01 134.3 15US 78 US-52/Rivers Ave & I-26 (Charleston) (West) 1.84 133.8 16US 17 SC-517/Isle of Palms Conn & I-526 (Mount Pleasant) 1.96 133.5 17
SC 171 US-17/Savannah Hwy & SC-700/Country Club Dr/Maybank Hwy 1.06 133.2 18SC 291 E North St & I-385 0.55 131.6 19US 123 SC-93/E Main St & S B St/Brushy Creek Rd 1.15 131.0 20US 17 SC-41 & Long Point Rd 1.34 129.9 21
US 378 US-1/Gervais St/Millwood Ave & US-76/Bull St 0.94 129.5 22US 17 Garden City Conn/Indigo Club Dr & SC-17 Bus 2.07 126.5 23
US 276 SC-291/Pleasantburg Dr & Haywood Rd 1.06 124.7 24US 76 US-178/Liberty Hwy & SC-28/Clemson Blvd/N Main St 1.24 124.4 25US 1 I-26 & Wattling Rd/Woodberry Rd 1.24 123.7 26SC 61 Playground Rd & SC-7/Sam Rittenberg Blvd 0.96 122.0 27SC 61 SC-7/Sam Rittenberg Blvd & Paul Cantrell Blvd 0.48 120.7 28
US 378 I-26 & I-20 2.33 119.4 29SC 703 I-526 Bus/SC-17 Bus/Chuck Dawley Blvd & Whilden St 1.08 118.8 30US 17 I-26/US-52/Meeting St/King St & Lockwood Blvd 1.88 117.6 31US 52 Old Mount Holly Rd & US-176/Redbank Rd/Saint James Ave 2.57 116.2 32US 29 SC-124/E Camperdown Way & US-25 Bus/Augusta St 0.90 116.1 33US 29 Powell Mill Rd & SC-295/Blackstock Rd 0.86 116.0 34
SC 291 SC-253/State Park Rd & Rutherford Rd 1.97 115.1 35US 1 SC-12/Klapman Blvd & I-26 0.73 115.0 36US 17 Mathis Ferry Rd & SC-703 0.68 113.0 37
SC 171 SC-700/Country Club Dr/Maybank Hwy & SC-30/James Island Expy 1.01 111.8 38US 521 Miller Rd & US-378/US-76/Broad St 1.81 110.8 39US 78 I-26 (Charleston) (West) & College Park Rd 1.79 108.2 40SC 61 Paul Cantrell Blvd & Magwood Dr 1.28 108.0 41
SC 703 Whilden St & Houston Northcutt Blvd/Garland Rd 0.86 107.7 42US 178 US-601/Magnolia St & US-21/Columbia Rd 1.09 105.5 43US 17 SC-707/Socastee Blvd/Phillis Blvd & SC-544/Dick Pond Rd 2.67 105.0 44
US 501 US-17 &Old Socastee Hwy/Robert M Grissom Pkwy 0.80 105.0 45SC 61 SC-171/Wesley Dr &SC-171/Old Towne Rd/Saint Andrews Blvd 1.64 104.3 46
US 176 US-29/E St John St & E Henry St/Glendalyn Ave 0.37 104.1 47US 17 SC-544/Dick Pond Rd & Glenns Bay Rd/Holmestown Rd 2.43 103.8 48US 29 Rutherford Rd & Cherokee Dr/W Lee Rd 1.66 101.9 49US 17 21st Ave & US-501 1.45 101.4 50US 17 Main St & 25th Ave 2.40 100.1 51US 1 Clemson Rd & N Brickyard Rd 1.95 98.8 52US 17 S Shelmore Blvd & Mathis Ferry Rd 0.79 97.5 53
US 276 SC-146/Woodruff Rd & Verdae Blvd/E Parkins Mill Rd 0.90 97.4 54US 17 I-526 (Charleston) & Bees Ferry Rd 5.25 97.3 55
US 276 Old Buncombe Rd & SC-253/State Park Rd/Blue Ridge Dr 1.25 96.7 56US 276 SC-253/State Park Rd/Blue Ridge Dr & Rutherford Rd/Shaw St 1.26 96.3 57US 17 25th Ave & Conway Byp/Veterans Hwy/Sc 22 3.83 94.3 58
US 378 US-76/SC-760/SC-16 & US-76/Devine St 1.11 93.5 59US 1 I-20 (Columbia) & Parklane Rd/Decker Blvd 0.76 93.4 60
SC 160 I-77 & SC-22/Pleasant Rd/Sutton Rd 0.53 92.8 61SC 161 India Hook Rd & Mount Gallant Rd 1.24 91.9 62US 21 SC-51 & I-77 0.73 91.9 63
INRIX CONGESTION ANALYSIS - DRAFT 4/24/14ALL SC STRATEGIC CORRIDORS SEGMENTS SUMMARY
Adjusted VHL Per
Mile
Segment Rank
Road Segment BetweenSegment Length
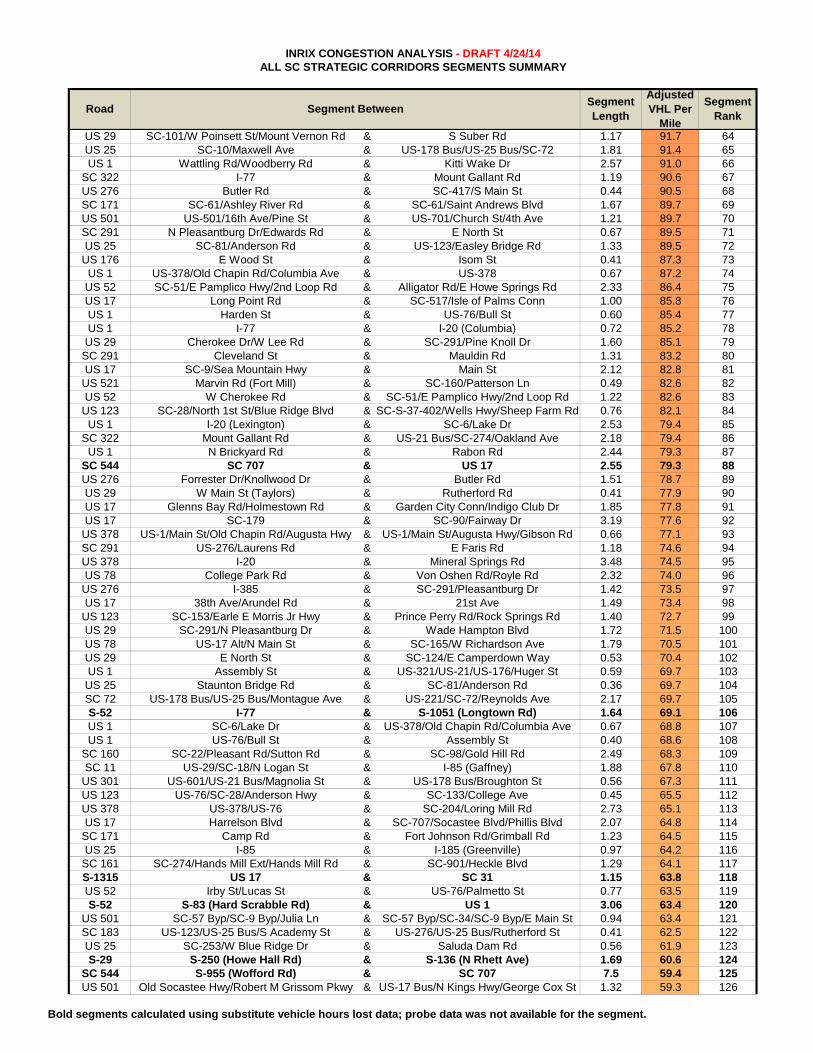
Bold segments calculated using substitute vehicle hours lost data; probe data was not available for the segment.
INRIX CONGESTION ANALYSIS - DRAFT 4/24/14ALL SC STRATEGIC CORRIDORS SEGMENTS SUMMARY
Adjusted VHL Per
Mile
Segment Rank
Road Segment BetweenSegment Length
US 29 SC-101/W Poinsett St/Mount Vernon Rd & S Suber Rd 1.17 91.7 64US 25 SC-10/Maxwell Ave & US-178 Bus/US-25 Bus/SC-72 1.81 91.4 65US 1 Wattling Rd/Woodberry Rd & Kitti Wake Dr 2.57 91.0 66
SC 322 I-77 & Mount Gallant Rd 1.19 90.6 67US 276 Butler Rd & SC-417/S Main St 0.44 90.5 68SC 171 SC-61/Ashley River Rd & SC-61/Saint Andrews Blvd 1.67 89.7 69US 501 US-501/16th Ave/Pine St & US-701/Church St/4th Ave 1.21 89.7 70SC 291 N Pleasantburg Dr/Edwards Rd & E North St 0.67 89.5 71US 25 SC-81/Anderson Rd & US-123/Easley Bridge Rd 1.33 89.5 72
US 176 E Wood St & Isom St 0.41 87.3 73US 1 US-378/Old Chapin Rd/Columbia Ave & US-378 0.67 87.2 74US 52 SC-51/E Pamplico Hwy/2nd Loop Rd & Alligator Rd/E Howe Springs Rd 2.33 86.4 75US 17 Long Point Rd & SC-517/Isle of Palms Conn 1.00 85.8 76US 1 Harden St & US-76/Bull St 0.60 85.4 77US 1 I-77 & I-20 (Columbia) 0.72 85.2 78US 29 Cherokee Dr/W Lee Rd & SC-291/Pine Knoll Dr 1.60 85.1 79
SC 291 Cleveland St & Mauldin Rd 1.31 83.2 80US 17 SC-9/Sea Mountain Hwy & Main St 2.12 82.8 81
US 521 Marvin Rd (Fort Mill) & SC-160/Patterson Ln 0.49 82.6 82US 52 W Cherokee Rd & SC-51/E Pamplico Hwy/2nd Loop Rd 1.22 82.6 83
US 123 SC-28/North 1st St/Blue Ridge Blvd & SC-S-37-402/Wells Hwy/Sheep Farm Rd 0.76 82.1 84US 1 I-20 (Lexington) & SC-6/Lake Dr 2.53 79.4 85
SC 322 Mount Gallant Rd & US-21 Bus/SC-274/Oakland Ave 2.18 79.4 86US 1 N Brickyard Rd & Rabon Rd 2.44 79.3 87
SC 544 SC 707 & US 17 2.55 79.3 88US 276 Forrester Dr/Knollwood Dr & Butler Rd 1.51 78.7 89US 29 W Main St (Taylors) & Rutherford Rd 0.41 77.9 90US 17 Glenns Bay Rd/Holmestown Rd & Garden City Conn/Indigo Club Dr 1.85 77.8 91US 17 SC-179 & SC-90/Fairway Dr 3.19 77.6 92
US 378 US-1/Main St/Old Chapin Rd/Augusta Hwy & US-1/Main St/Augusta Hwy/Gibson Rd 0.66 77.1 93SC 291 US-276/Laurens Rd & E Faris Rd 1.18 74.6 94US 378 I-20 & Mineral Springs Rd 3.48 74.5 95US 78 College Park Rd & Von Oshen Rd/Royle Rd 2.32 74.0 96
US 276 I-385 & SC-291/Pleasantburg Dr 1.42 73.5 97US 17 38th Ave/Arundel Rd & 21st Ave 1.49 73.4 98
US 123 SC-153/Earle E Morris Jr Hwy & Prince Perry Rd/Rock Springs Rd 1.40 72.7 99US 29 SC-291/N Pleasantburg Dr & Wade Hampton Blvd 1.72 71.5 100US 78 US-17 Alt/N Main St & SC-165/W Richardson Ave 1.79 70.5 101US 29 E North St & SC-124/E Camperdown Way 0.53 70.4 102US 1 Assembly St & US-321/US-21/US-176/Huger St 0.59 69.7 103US 25 Staunton Bridge Rd & SC-81/Anderson Rd 0.36 69.7 104SC 72 US-178 Bus/US-25 Bus/Montague Ave & US-221/SC-72/Reynolds Ave 2.17 69.7 105S-52 I-77 & S-1051 (Longtown Rd) 1.64 69.1 106US 1 SC-6/Lake Dr & US-378/Old Chapin Rd/Columbia Ave 0.67 68.8 107US 1 US-76/Bull St & Assembly St 0.40 68.6 108
SC 160 SC-22/Pleasant Rd/Sutton Rd & SC-98/Gold Hill Rd 2.49 68.3 109SC 11 US-29/SC-18/N Logan St & I-85 (Gaffney) 1.88 67.8 110
US 301 US-601/US-21 Bus/Magnolia St & US-178 Bus/Broughton St 0.56 67.3 111US 123 US-76/SC-28/Anderson Hwy & SC-133/College Ave 0.45 65.5 112US 378 US-378/US-76 & SC-204/Loring Mill Rd 2.73 65.1 113US 17 Harrelson Blvd & SC-707/Socastee Blvd/Phillis Blvd 2.07 64.8 114
SC 171 Camp Rd & Fort Johnson Rd/Grimball Rd 1.23 64.5 115US 25 I-85 & I-185 (Greenville) 0.97 64.2 116
SC 161 SC-274/Hands Mill Ext/Hands Mill Rd & SC-901/Heckle Blvd 1.29 64.1 117S-1315 US 17 & SC 31 1.15 63.8 118US 52 Irby St/Lucas St & US-76/Palmetto St 0.77 63.5 119S-52 S-83 (Hard Scrabble Rd) & US 1 3.06 63.4 120
US 501 SC-57 Byp/SC-9 Byp/Julia Ln & SC-57 Byp/SC-34/SC-9 Byp/E Main St 0.94 63.4 121SC 183 US-123/US-25 Bus/S Academy St & US-276/US-25 Bus/Rutherford St 0.41 62.5 122US 25 SC-253/W Blue Ridge Dr & Saluda Dam Rd 0.56 61.9 123S-29 S-250 (Howe Hall Rd) & S-136 (N Rhett Ave) 1.69 60.6 124
SC 544 S-955 (Wofford Rd) & SC 707 7.5 59.4 125US 501 Old Socastee Hwy/Robert M Grissom Pkwy & US-17 Bus/N Kings Hwy/George Cox St 1.32 59.3 126
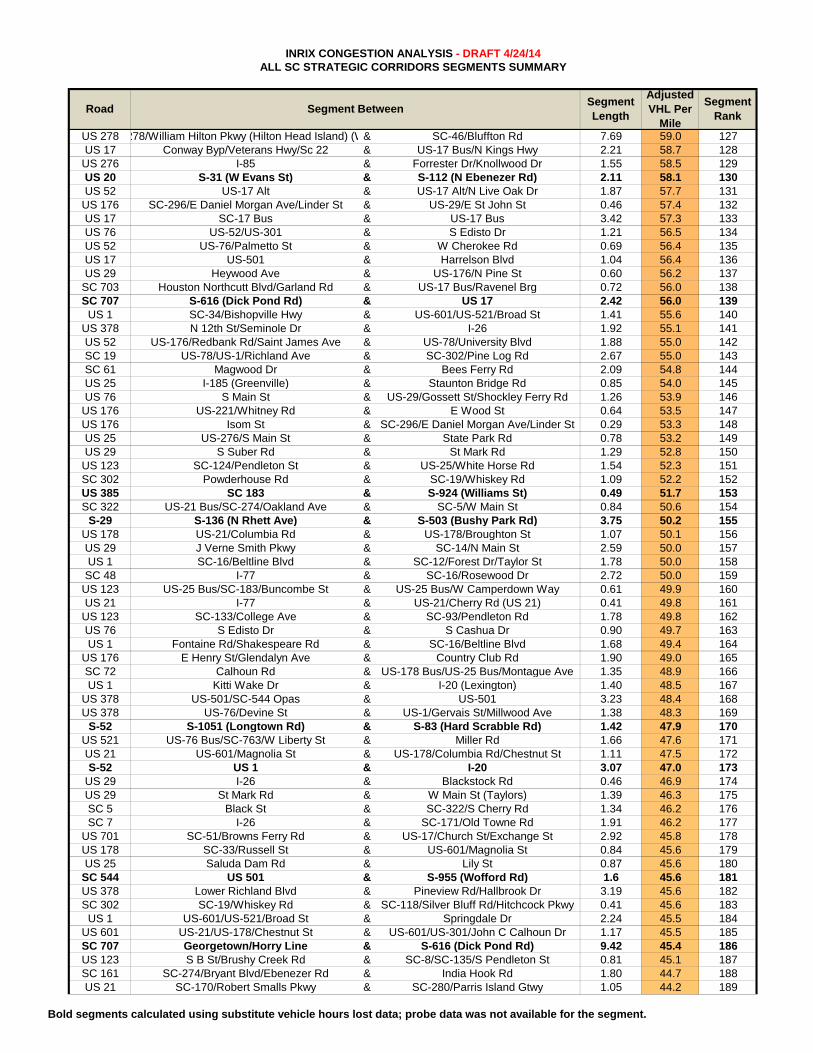
Bold segments calculated using substitute vehicle hours lost data; probe data was not available for the segment.
INRIX CONGESTION ANALYSIS - DRAFT 4/24/14ALL SC STRATEGIC CORRIDORS SEGMENTS SUMMARY
Adjusted VHL Per
Mile
Segment Rank
Road Segment BetweenSegment Length
US 278 278/William Hilton Pkwy (Hilton Head Island) (W& SC-46/Bluffton Rd 7.69 59.0 127US 17 Conway Byp/Veterans Hwy/Sc 22 & US-17 Bus/N Kings Hwy 2.21 58.7 128
US 276 I-85 & Forrester Dr/Knollwood Dr 1.55 58.5 129US 20 S-31 (W Evans St) & S-112 (N Ebenezer Rd) 2.11 58.1 130US 52 US-17 Alt & US-17 Alt/N Live Oak Dr 1.87 57.7 131
US 176 SC-296/E Daniel Morgan Ave/Linder St & US-29/E St John St 0.46 57.4 132US 17 SC-17 Bus & US-17 Bus 3.42 57.3 133US 76 US-52/US-301 & S Edisto Dr 1.21 56.5 134US 52 US-76/Palmetto St & W Cherokee Rd 0.69 56.4 135US 17 US-501 & Harrelson Blvd 1.04 56.4 136US 29 Heywood Ave & US-176/N Pine St 0.60 56.2 137
SC 703 Houston Northcutt Blvd/Garland Rd & US-17 Bus/Ravenel Brg 0.72 56.0 138SC 707 S-616 (Dick Pond Rd) & US 17 2.42 56.0 139
US 1 SC-34/Bishopville Hwy & US-601/US-521/Broad St 1.41 55.6 140US 378 N 12th St/Seminole Dr & I-26 1.92 55.1 141US 52 US-176/Redbank Rd/Saint James Ave & US-78/University Blvd 1.88 55.0 142SC 19 US-78/US-1/Richland Ave & SC-302/Pine Log Rd 2.67 55.0 143SC 61 Magwood Dr & Bees Ferry Rd 2.09 54.8 144US 25 I-185 (Greenville) & Staunton Bridge Rd 0.85 54.0 145US 76 S Main St & US-29/Gossett St/Shockley Ferry Rd 1.26 53.9 146
US 176 US-221/Whitney Rd & E Wood St 0.64 53.5 147US 176 Isom St & SC-296/E Daniel Morgan Ave/Linder St 0.29 53.3 148US 25 US-276/S Main St & State Park Rd 0.78 53.2 149US 29 S Suber Rd & St Mark Rd 1.29 52.8 150
US 123 SC-124/Pendleton St & US-25/White Horse Rd 1.54 52.3 151SC 302 Powderhouse Rd & SC-19/Whiskey Rd 1.09 52.2 152US 385 SC 183 & S-924 (Williams St) 0.49 51.7 153SC 322 US-21 Bus/SC-274/Oakland Ave & SC-5/W Main St 0.84 50.6 154
S-29 S-136 (N Rhett Ave) & S-503 (Bushy Park Rd) 3.75 50.2 155US 178 US-21/Columbia Rd & US-178/Broughton St 1.07 50.1 156US 29 J Verne Smith Pkwy & SC-14/N Main St 2.59 50.0 157US 1 SC-16/Beltline Blvd & SC-12/Forest Dr/Taylor St 1.78 50.0 158SC 48 I-77 & SC-16/Rosewood Dr 2.72 50.0 159
US 123 US-25 Bus/SC-183/Buncombe St & US-25 Bus/W Camperdown Way 0.61 49.9 160US 21 I-77 & US-21/Cherry Rd (US 21) 0.41 49.8 161
US 123 SC-133/College Ave & SC-93/Pendleton Rd 1.78 49.8 162US 76 S Edisto Dr & S Cashua Dr 0.90 49.7 163US 1 Fontaine Rd/Shakespeare Rd & SC-16/Beltline Blvd 1.68 49.4 164
US 176 E Henry St/Glendalyn Ave & Country Club Rd 1.90 49.0 165SC 72 Calhoun Rd & US-178 Bus/US-25 Bus/Montague Ave 1.35 48.9 166US 1 Kitti Wake Dr & I-20 (Lexington) 1.40 48.5 167
US 378 US-501/SC-544 Opas & US-501 3.23 48.4 168US 378 US-76/Devine St & US-1/Gervais St/Millwood Ave 1.38 48.3 169
S-52 S-1051 (Longtown Rd) & S-83 (Hard Scrabble Rd) 1.42 47.9 170US 521 US-76 Bus/SC-763/W Liberty St & Miller Rd 1.66 47.6 171US 21 US-601/Magnolia St & US-178/Columbia Rd/Chestnut St 1.11 47.5 172S-52 US 1 & I-20 3.07 47.0 173
US 29 I-26 & Blackstock Rd 0.46 46.9 174US 29 St Mark Rd & W Main St (Taylors) 1.39 46.3 175SC 5 Black St & SC-322/S Cherry Rd 1.34 46.2 176SC 7 I-26 & SC-171/Old Towne Rd 1.91 46.2 177
US 701 SC-51/Browns Ferry Rd & US-17/Church St/Exchange St 2.92 45.8 178US 178 SC-33/Russell St & US-601/Magnolia St 0.84 45.6 179US 25 Saluda Dam Rd & Lily St 0.87 45.6 180
SC 544 US 501 & S-955 (Wofford Rd) 1.6 45.6 181US 378 Lower Richland Blvd & Pineview Rd/Hallbrook Dr 3.19 45.6 182SC 302 SC-19/Whiskey Rd & SC-118/Silver Bluff Rd/Hitchcock Pkwy 0.41 45.6 183
US 1 US-601/US-521/Broad St & Springdale Dr 2.24 45.5 184US 601 US-21/US-178/Chestnut St & US-601/US-301/John C Calhoun Dr 1.17 45.5 185SC 707 Georgetown/Horry Line & S-616 (Dick Pond Rd) 9.42 45.4 186US 123 S B St/Brushy Creek Rd & SC-8/SC-135/S Pendleton St 0.81 45.1 187SC 161 SC-274/Bryant Blvd/Ebenezer Rd & India Hook Rd 1.80 44.7 188US 21 SC-170/Robert Smalls Pkwy & SC-280/Parris Island Gtwy 1.05 44.2 189
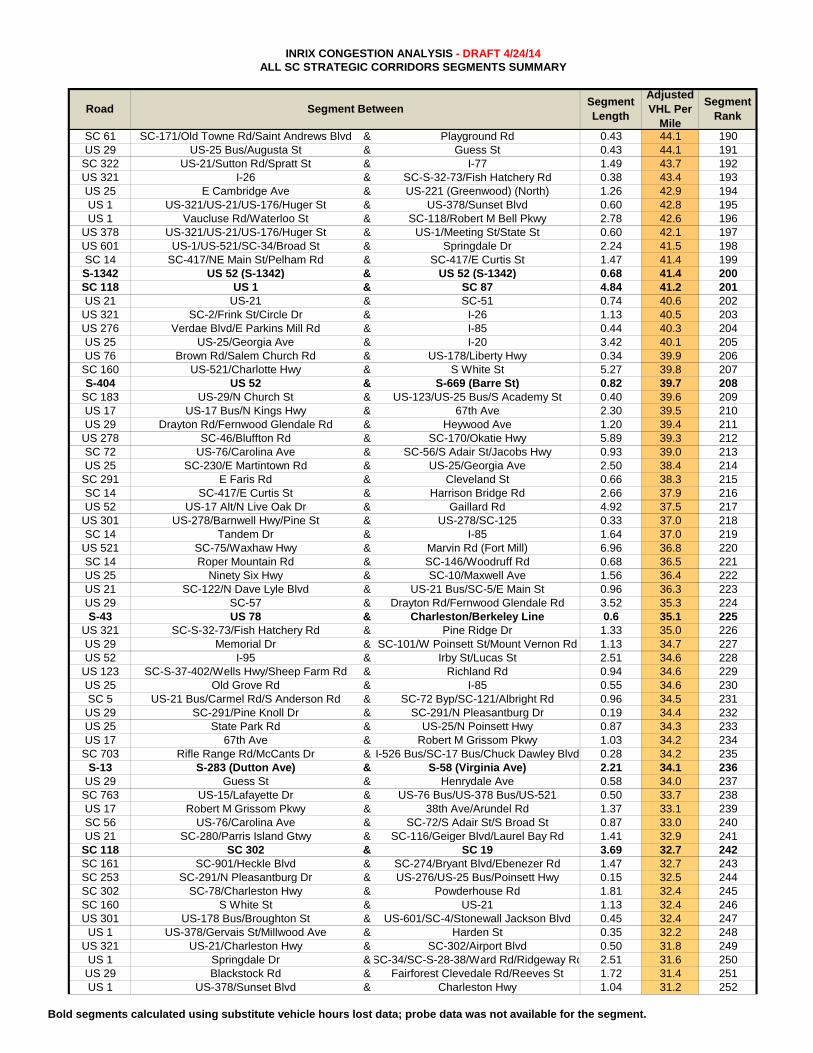
Bold segments calculated using substitute vehicle hours lost data; probe data was not available for the segment.
INRIX CONGESTION ANALYSIS - DRAFT 4/24/14ALL SC STRATEGIC CORRIDORS SEGMENTS SUMMARY
Adjusted VHL Per
Mile
Segment Rank
Road Segment BetweenSegment Length
SC 61 SC-171/Old Towne Rd/Saint Andrews Blvd & Playground Rd 0.43 44.1 190US 29 US-25 Bus/Augusta St & Guess St 0.43 44.1 191
SC 322 US-21/Sutton Rd/Spratt St & I-77 1.49 43.7 192US 321 I-26 & SC-S-32-73/Fish Hatchery Rd 0.38 43.4 193US 25 E Cambridge Ave & US-221 (Greenwood) (North) 1.26 42.9 194US 1 US-321/US-21/US-176/Huger St & US-378/Sunset Blvd 0.60 42.8 195US 1 Vaucluse Rd/Waterloo St & SC-118/Robert M Bell Pkwy 2.78 42.6 196
US 378 US-321/US-21/US-176/Huger St & US-1/Meeting St/State St 0.60 42.1 197US 601 US-1/US-521/SC-34/Broad St & Springdale Dr 2.24 41.5 198SC 14 SC-417/NE Main St/Pelham Rd & SC-417/E Curtis St 1.47 41.4 199S-1342 US 52 (S-1342) & US 52 (S-1342) 0.68 41.4 200SC 118 US 1 & SC 87 4.84 41.2 201US 21 US-21 & SC-51 0.74 40.6 202
US 321 SC-2/Frink St/Circle Dr & I-26 1.13 40.5 203US 276 Verdae Blvd/E Parkins Mill Rd & I-85 0.44 40.3 204US 25 US-25/Georgia Ave & I-20 3.42 40.1 205US 76 Brown Rd/Salem Church Rd & US-178/Liberty Hwy 0.34 39.9 206
SC 160 US-521/Charlotte Hwy & S White St 5.27 39.8 207S-404 US 52 & S-669 (Barre St) 0.82 39.7 208
SC 183 US-29/N Church St & US-123/US-25 Bus/S Academy St 0.40 39.6 209US 17 US-17 Bus/N Kings Hwy & 67th Ave 2.30 39.5 210US 29 Drayton Rd/Fernwood Glendale Rd & Heywood Ave 1.20 39.4 211
US 278 SC-46/Bluffton Rd & SC-170/Okatie Hwy 5.89 39.3 212SC 72 US-76/Carolina Ave & SC-56/S Adair St/Jacobs Hwy 0.93 39.0 213US 25 SC-230/E Martintown Rd & US-25/Georgia Ave 2.50 38.4 214
SC 291 E Faris Rd & Cleveland St 0.66 38.3 215SC 14 SC-417/E Curtis St & Harrison Bridge Rd 2.66 37.9 216US 52 US-17 Alt/N Live Oak Dr & Gaillard Rd 4.92 37.5 217
US 301 US-278/Barnwell Hwy/Pine St & US-278/SC-125 0.33 37.0 218SC 14 Tandem Dr & I-85 1.64 37.0 219
US 521 SC-75/Waxhaw Hwy & Marvin Rd (Fort Mill) 6.96 36.8 220SC 14 Roper Mountain Rd & SC-146/Woodruff Rd 0.68 36.5 221US 25 Ninety Six Hwy & SC-10/Maxwell Ave 1.56 36.4 222US 21 SC-122/N Dave Lyle Blvd & US-21 Bus/SC-5/E Main St 0.96 36.3 223US 29 SC-57 & Drayton Rd/Fernwood Glendale Rd 3.52 35.3 224S-43 US 78 & Charleston/Berkeley Line 0.6 35.1 225
US 321 SC-S-32-73/Fish Hatchery Rd & Pine Ridge Dr 1.33 35.0 226US 29 Memorial Dr & SC-101/W Poinsett St/Mount Vernon Rd 1.13 34.7 227US 52 I-95 & Irby St/Lucas St 2.51 34.6 228
US 123 SC-S-37-402/Wells Hwy/Sheep Farm Rd & Richland Rd 0.94 34.6 229US 25 Old Grove Rd & I-85 0.55 34.6 230SC 5 US-21 Bus/Carmel Rd/S Anderson Rd & SC-72 Byp/SC-121/Albright Rd 0.96 34.5 231US 29 SC-291/Pine Knoll Dr & SC-291/N Pleasantburg Dr 0.19 34.4 232US 25 State Park Rd & US-25/N Poinsett Hwy 0.87 34.3 233US 17 67th Ave & Robert M Grissom Pkwy 1.03 34.2 234
SC 703 Rifle Range Rd/McCants Dr & I-526 Bus/SC-17 Bus/Chuck Dawley Blvd 0.28 34.2 235S-13 S-283 (Dutton Ave) & S-58 (Virginia Ave) 2.21 34.1 236
US 29 Guess St & Henrydale Ave 0.58 34.0 237SC 763 US-15/Lafayette Dr & US-76 Bus/US-378 Bus/US-521 0.50 33.7 238US 17 Robert M Grissom Pkwy & 38th Ave/Arundel Rd 1.37 33.1 239SC 56 US-76/Carolina Ave & SC-72/S Adair St/S Broad St 0.87 33.0 240US 21 SC-280/Parris Island Gtwy & SC-116/Geiger Blvd/Laurel Bay Rd 1.41 32.9 241
SC 118 SC 302 & SC 19 3.69 32.7 242SC 161 SC-901/Heckle Blvd & SC-274/Bryant Blvd/Ebenezer Rd 1.47 32.7 243SC 253 SC-291/N Pleasantburg Dr & US-276/US-25 Bus/Poinsett Hwy 0.15 32.5 244SC 302 SC-78/Charleston Hwy & Powderhouse Rd 1.81 32.4 245SC 160 S White St & US-21 1.13 32.4 246US 301 US-178 Bus/Broughton St & US-601/SC-4/Stonewall Jackson Blvd 0.45 32.4 247
US 1 US-378/Gervais St/Millwood Ave & Harden St 0.35 32.2 248US 321 US-21/Charleston Hwy & SC-302/Airport Blvd 0.50 31.8 249
US 1 Springdale Dr &SC-34/SC-S-28-38/Ward Rd/Ridgeway Rd 2.51 31.6 250US 29 Blackstock Rd & Fairforest Clevedale Rd/Reeves St 1.72 31.4 251US 1 US-378/Sunset Blvd & Charleston Hwy 1.04 31.2 252
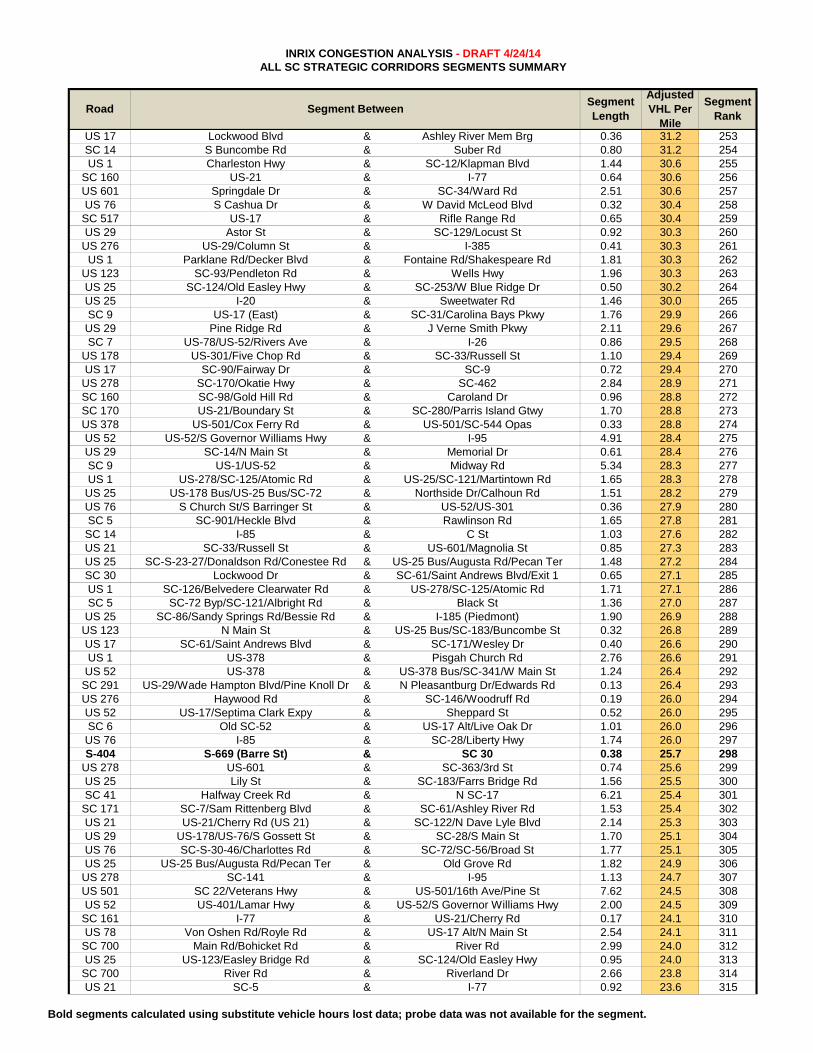
Bold segments calculated using substitute vehicle hours lost data; probe data was not available for the segment.
INRIX CONGESTION ANALYSIS - DRAFT 4/24/14ALL SC STRATEGIC CORRIDORS SEGMENTS SUMMARY
Adjusted VHL Per
Mile
Segment Rank
Road Segment BetweenSegment Length
US 17 Lockwood Blvd & Ashley River Mem Brg 0.36 31.2 253SC 14 S Buncombe Rd & Suber Rd 0.80 31.2 254US 1 Charleston Hwy & SC-12/Klapman Blvd 1.44 30.6 255
SC 160 US-21 & I-77 0.64 30.6 256US 601 Springdale Dr & SC-34/Ward Rd 2.51 30.6 257US 76 S Cashua Dr & W David McLeod Blvd 0.32 30.4 258
SC 517 US-17 & Rifle Range Rd 0.65 30.4 259US 29 Astor St & SC-129/Locust St 0.92 30.3 260
US 276 US-29/Column St & I-385 0.41 30.3 261US 1 Parklane Rd/Decker Blvd & Fontaine Rd/Shakespeare Rd 1.81 30.3 262
US 123 SC-93/Pendleton Rd & Wells Hwy 1.96 30.3 263US 25 SC-124/Old Easley Hwy & SC-253/W Blue Ridge Dr 0.50 30.2 264US 25 I-20 & Sweetwater Rd 1.46 30.0 265SC 9 US-17 (East) & SC-31/Carolina Bays Pkwy 1.76 29.9 266US 29 Pine Ridge Rd & J Verne Smith Pkwy 2.11 29.6 267SC 7 US-78/US-52/Rivers Ave & I-26 0.86 29.5 268
US 178 US-301/Five Chop Rd & SC-33/Russell St 1.10 29.4 269US 17 SC-90/Fairway Dr & SC-9 0.72 29.4 270
US 278 SC-170/Okatie Hwy & SC-462 2.84 28.9 271SC 160 SC-98/Gold Hill Rd & Caroland Dr 0.96 28.8 272SC 170 US-21/Boundary St & SC-280/Parris Island Gtwy 1.70 28.8 273US 378 US-501/Cox Ferry Rd & US-501/SC-544 Opas 0.33 28.8 274US 52 US-52/S Governor Williams Hwy & I-95 4.91 28.4 275US 29 SC-14/N Main St & Memorial Dr 0.61 28.4 276SC 9 US-1/US-52 & Midway Rd 5.34 28.3 277US 1 US-278/SC-125/Atomic Rd & US-25/SC-121/Martintown Rd 1.65 28.3 278US 25 US-178 Bus/US-25 Bus/SC-72 & Northside Dr/Calhoun Rd 1.51 28.2 279US 76 S Church St/S Barringer St & US-52/US-301 0.36 27.9 280SC 5 SC-901/Heckle Blvd & Rawlinson Rd 1.65 27.8 281SC 14 I-85 & C St 1.03 27.6 282US 21 SC-33/Russell St & US-601/Magnolia St 0.85 27.3 283US 25 SC-S-23-27/Donaldson Rd/Conestee Rd & US-25 Bus/Augusta Rd/Pecan Ter 1.48 27.2 284SC 30 Lockwood Dr & SC-61/Saint Andrews Blvd/Exit 1 0.65 27.1 285US 1 SC-126/Belvedere Clearwater Rd & US-278/SC-125/Atomic Rd 1.71 27.1 286SC 5 SC-72 Byp/SC-121/Albright Rd & Black St 1.36 27.0 287US 25 SC-86/Sandy Springs Rd/Bessie Rd & I-185 (Piedmont) 1.90 26.9 288
US 123 N Main St & US-25 Bus/SC-183/Buncombe St 0.32 26.8 289US 17 SC-61/Saint Andrews Blvd & SC-171/Wesley Dr 0.40 26.6 290US 1 US-378 & Pisgah Church Rd 2.76 26.6 291US 52 US-378 & US-378 Bus/SC-341/W Main St 1.24 26.4 292
SC 291 US-29/Wade Hampton Blvd/Pine Knoll Dr & N Pleasantburg Dr/Edwards Rd 0.13 26.4 293US 276 Haywood Rd & SC-146/Woodruff Rd 0.19 26.0 294US 52 US-17/Septima Clark Expy & Sheppard St 0.52 26.0 295SC 6 Old SC-52 & US-17 Alt/Live Oak Dr 1.01 26.0 296US 76 I-85 & SC-28/Liberty Hwy 1.74 26.0 297S-404 S-669 (Barre St) & SC 30 0.38 25.7 298
US 278 US-601 & SC-363/3rd St 0.74 25.6 299US 25 Lily St & SC-183/Farrs Bridge Rd 1.56 25.5 300SC 41 Halfway Creek Rd & N SC-17 6.21 25.4 301
SC 171 SC-7/Sam Rittenberg Blvd & SC-61/Ashley River Rd 1.53 25.4 302US 21 US-21/Cherry Rd (US 21) & SC-122/N Dave Lyle Blvd 2.14 25.3 303US 29 US-178/US-76/S Gossett St & SC-28/S Main St 1.70 25.1 304US 76 SC-S-30-46/Charlottes Rd & SC-72/SC-56/Broad St 1.77 25.1 305US 25 US-25 Bus/Augusta Rd/Pecan Ter & Old Grove Rd 1.82 24.9 306
US 278 SC-141 & I-95 1.13 24.7 307US 501 SC 22/Veterans Hwy & US-501/16th Ave/Pine St 7.62 24.5 308US 52 US-401/Lamar Hwy & US-52/S Governor Williams Hwy 2.00 24.5 309
SC 161 I-77 & US-21/Cherry Rd 0.17 24.1 310US 78 Von Oshen Rd/Royle Rd & US-17 Alt/N Main St 2.54 24.1 311
SC 700 Main Rd/Bohicket Rd & River Rd 2.99 24.0 312US 25 US-123/Easley Bridge Rd & SC-124/Old Easley Hwy 0.95 24.0 313
SC 700 River Rd & Riverland Dr 2.66 23.8 314US 21 SC-5 & I-77 0.92 23.6 315
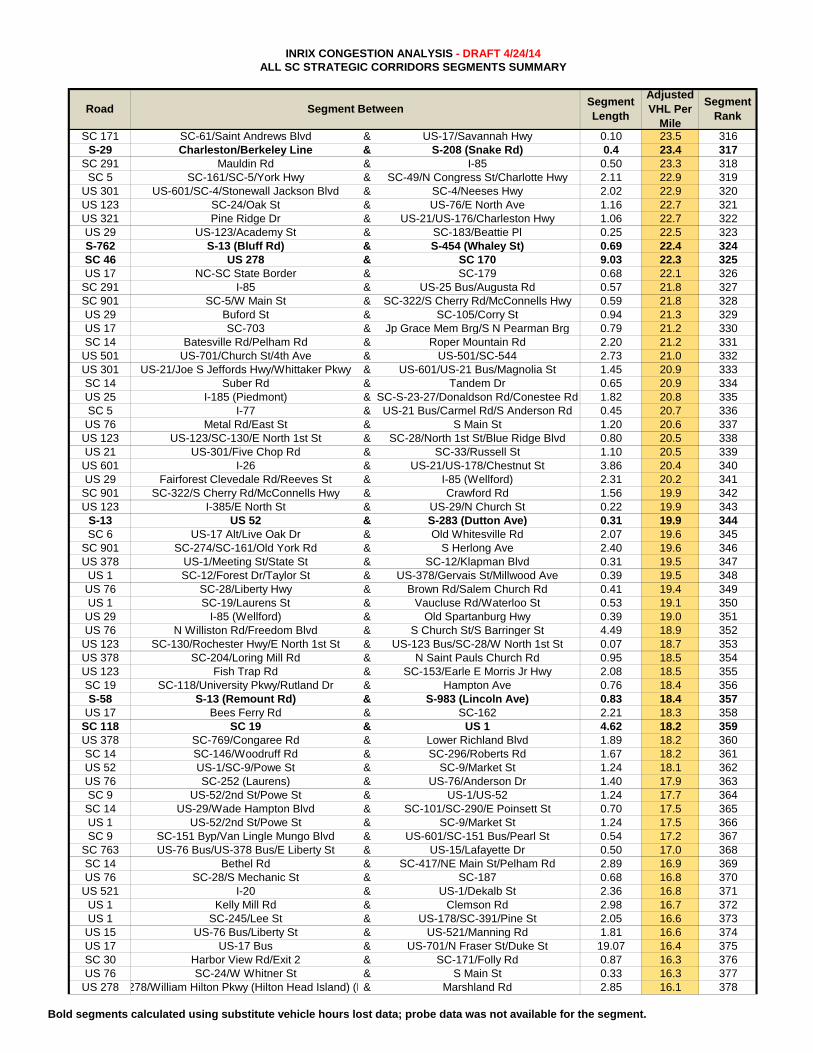
Bold segments calculated using substitute vehicle hours lost data; probe data was not available for the segment.
INRIX CONGESTION ANALYSIS - DRAFT 4/24/14ALL SC STRATEGIC CORRIDORS SEGMENTS SUMMARY
Adjusted VHL Per
Mile
Segment Rank
Road Segment BetweenSegment Length
SC 171 SC-61/Saint Andrews Blvd & US-17/Savannah Hwy 0.10 23.5 316S-29 Charleston/Berkeley Line & S-208 (Snake Rd) 0.4 23.4 317
SC 291 Mauldin Rd & I-85 0.50 23.3 318SC 5 SC-161/SC-5/York Hwy & SC-49/N Congress St/Charlotte Hwy 2.11 22.9 319
US 301 US-601/SC-4/Stonewall Jackson Blvd & SC-4/Neeses Hwy 2.02 22.9 320US 123 SC-24/Oak St & US-76/E North Ave 1.16 22.7 321US 321 Pine Ridge Dr & US-21/US-176/Charleston Hwy 1.06 22.7 322US 29 US-123/Academy St & SC-183/Beattie Pl 0.25 22.5 323S-762 S-13 (Bluff Rd) & S-454 (Whaley St) 0.69 22.4 324SC 46 US 278 & SC 170 9.03 22.3 325US 17 NC-SC State Border & SC-179 0.68 22.1 326
SC 291 I-85 & US-25 Bus/Augusta Rd 0.57 21.8 327SC 901 SC-5/W Main St & SC-322/S Cherry Rd/McConnells Hwy 0.59 21.8 328US 29 Buford St & SC-105/Corry St 0.94 21.3 329US 17 SC-703 & Jp Grace Mem Brg/S N Pearman Brg 0.79 21.2 330SC 14 Batesville Rd/Pelham Rd & Roper Mountain Rd 2.20 21.2 331
US 501 US-701/Church St/4th Ave & US-501/SC-544 2.73 21.0 332US 301 US-21/Joe S Jeffords Hwy/Whittaker Pkwy & US-601/US-21 Bus/Magnolia St 1.45 20.9 333SC 14 Suber Rd & Tandem Dr 0.65 20.9 334US 25 I-185 (Piedmont) & SC-S-23-27/Donaldson Rd/Conestee Rd 1.82 20.8 335SC 5 I-77 & US-21 Bus/Carmel Rd/S Anderson Rd 0.45 20.7 336US 76 Metal Rd/East St & S Main St 1.20 20.6 337
US 123 US-123/SC-130/E North 1st St & SC-28/North 1st St/Blue Ridge Blvd 0.80 20.5 338US 21 US-301/Five Chop Rd & SC-33/Russell St 1.10 20.5 339
US 601 I-26 & US-21/US-178/Chestnut St 3.86 20.4 340US 29 Fairforest Clevedale Rd/Reeves St & I-85 (Wellford) 2.31 20.2 341
SC 901 SC-322/S Cherry Rd/McConnells Hwy & Crawford Rd 1.56 19.9 342US 123 I-385/E North St & US-29/N Church St 0.22 19.9 343
S-13 US 52 & S-283 (Dutton Ave) 0.31 19.9 344SC 6 US-17 Alt/Live Oak Dr & Old Whitesville Rd 2.07 19.6 345
SC 901 SC-274/SC-161/Old York Rd & S Herlong Ave 2.40 19.6 346US 378 US-1/Meeting St/State St & SC-12/Klapman Blvd 0.31 19.5 347
US 1 SC-12/Forest Dr/Taylor St & US-378/Gervais St/Millwood Ave 0.39 19.5 348US 76 SC-28/Liberty Hwy & Brown Rd/Salem Church Rd 0.41 19.4 349US 1 SC-19/Laurens St & Vaucluse Rd/Waterloo St 0.53 19.1 350US 29 I-85 (Wellford) & Old Spartanburg Hwy 0.39 19.0 351US 76 N Williston Rd/Freedom Blvd & S Church St/S Barringer St 4.49 18.9 352
US 123 SC-130/Rochester Hwy/E North 1st St & US-123 Bus/SC-28/W North 1st St 0.07 18.7 353US 378 SC-204/Loring Mill Rd & N Saint Pauls Church Rd 0.95 18.5 354US 123 Fish Trap Rd & SC-153/Earle E Morris Jr Hwy 2.08 18.5 355SC 19 SC-118/University Pkwy/Rutland Dr & Hampton Ave 0.76 18.4 356S-58 S-13 (Remount Rd) & S-983 (Lincoln Ave) 0.83 18.4 357
US 17 Bees Ferry Rd & SC-162 2.21 18.3 358SC 118 SC 19 & US 1 4.62 18.2 359US 378 SC-769/Congaree Rd & Lower Richland Blvd 1.89 18.2 360SC 14 SC-146/Woodruff Rd & SC-296/Roberts Rd 1.67 18.2 361US 52 US-1/SC-9/Powe St & SC-9/Market St 1.24 18.1 362US 76 SC-252 (Laurens) & US-76/Anderson Dr 1.40 17.9 363SC 9 US-52/2nd St/Powe St & US-1/US-52 1.24 17.7 364SC 14 US-29/Wade Hampton Blvd & SC-101/SC-290/E Poinsett St 0.70 17.5 365US 1 US-52/2nd St/Powe St & SC-9/Market St 1.24 17.5 366SC 9 SC-151 Byp/Van Lingle Mungo Blvd & US-601/SC-151 Bus/Pearl St 0.54 17.2 367
SC 763 US-76 Bus/US-378 Bus/E Liberty St & US-15/Lafayette Dr 0.50 17.0 368SC 14 Bethel Rd & SC-417/NE Main St/Pelham Rd 2.89 16.9 369US 76 SC-28/S Mechanic St & SC-187 0.68 16.8 370
US 521 I-20 & US-1/Dekalb St 2.36 16.8 371US 1 Kelly Mill Rd & Clemson Rd 2.98 16.7 372US 1 SC-245/Lee St & US-178/SC-391/Pine St 2.05 16.6 373US 15 US-76 Bus/Liberty St & US-521/Manning Rd 1.81 16.6 374US 17 US-17 Bus & US-701/N Fraser St/Duke St 19.07 16.4 375SC 30 Harbor View Rd/Exit 2 & SC-171/Folly Rd 0.87 16.3 376US 76 SC-24/W Whitner St & S Main St 0.33 16.3 377
US 278 278/William Hilton Pkwy (Hilton Head Island) (E& Marshland Rd 2.85 16.1 378
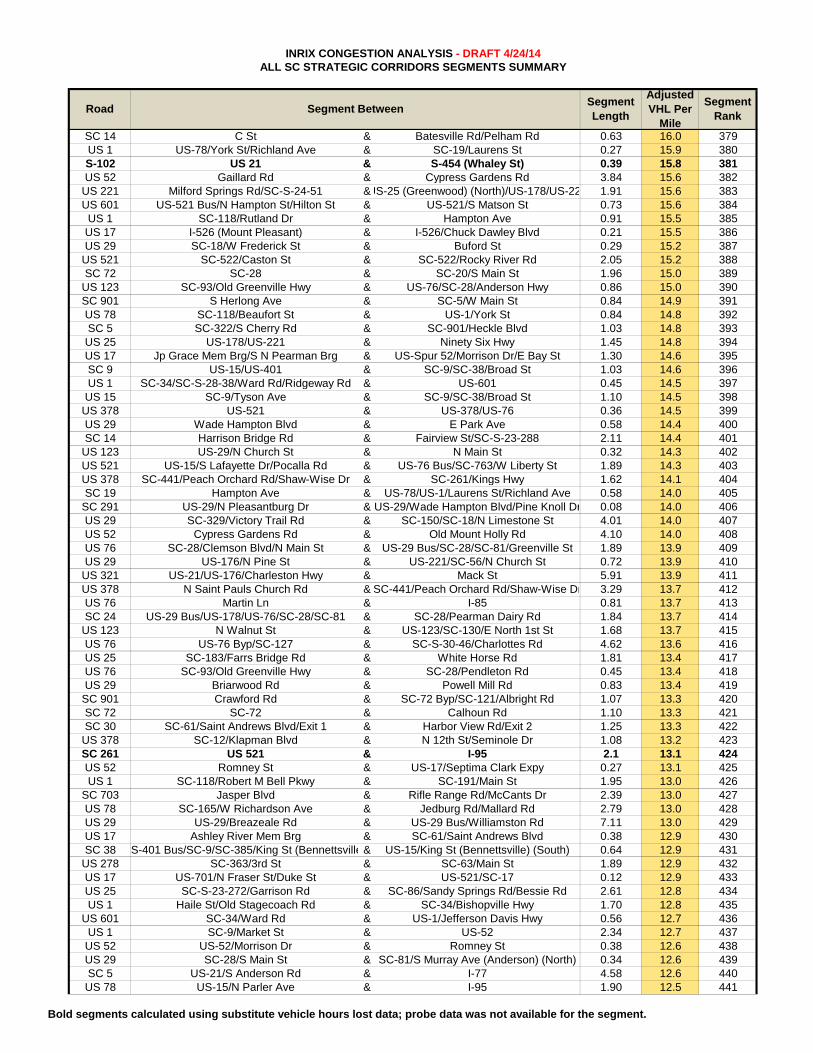
Bold segments calculated using substitute vehicle hours lost data; probe data was not available for the segment.
INRIX CONGESTION ANALYSIS - DRAFT 4/24/14ALL SC STRATEGIC CORRIDORS SEGMENTS SUMMARY
Adjusted VHL Per
Mile
Segment Rank
Road Segment BetweenSegment Length
SC 14 C St & Batesville Rd/Pelham Rd 0.63 16.0 379US 1 US-78/York St/Richland Ave & SC-19/Laurens St 0.27 15.9 380S-102 US 21 & S-454 (Whaley St) 0.39 15.8 381US 52 Gaillard Rd & Cypress Gardens Rd 3.84 15.6 382
US 221 Milford Springs Rd/SC-S-24-51 &US-25 (Greenwood) (North)/US-178/US-22 1.91 15.6 383US 601 US-521 Bus/N Hampton St/Hilton St & US-521/S Matson St 0.73 15.6 384
US 1 SC-118/Rutland Dr & Hampton Ave 0.91 15.5 385US 17 I-526 (Mount Pleasant) & I-526/Chuck Dawley Blvd 0.21 15.5 386US 29 SC-18/W Frederick St & Buford St 0.29 15.2 387
US 521 SC-522/Caston St & SC-522/Rocky River Rd 2.05 15.2 388SC 72 SC-28 & SC-20/S Main St 1.96 15.0 389
US 123 SC-93/Old Greenville Hwy & US-76/SC-28/Anderson Hwy 0.86 15.0 390SC 901 S Herlong Ave & SC-5/W Main St 0.84 14.9 391US 78 SC-118/Beaufort St & US-1/York St 0.84 14.8 392SC 5 SC-322/S Cherry Rd & SC-901/Heckle Blvd 1.03 14.8 393US 25 US-178/US-221 & Ninety Six Hwy 1.45 14.8 394US 17 Jp Grace Mem Brg/S N Pearman Brg & US-Spur 52/Morrison Dr/E Bay St 1.30 14.6 395SC 9 US-15/US-401 & SC-9/SC-38/Broad St 1.03 14.6 396US 1 SC-34/SC-S-28-38/Ward Rd/Ridgeway Rd & US-601 0.45 14.5 397US 15 SC-9/Tyson Ave & SC-9/SC-38/Broad St 1.10 14.5 398
US 378 US-521 & US-378/US-76 0.36 14.5 399US 29 Wade Hampton Blvd & E Park Ave 0.58 14.4 400SC 14 Harrison Bridge Rd & Fairview St/SC-S-23-288 2.11 14.4 401
US 123 US-29/N Church St & N Main St 0.32 14.3 402US 521 US-15/S Lafayette Dr/Pocalla Rd & US-76 Bus/SC-763/W Liberty St 1.89 14.3 403US 378 SC-441/Peach Orchard Rd/Shaw-Wise Dr & SC-261/Kings Hwy 1.62 14.1 404SC 19 Hampton Ave & US-78/US-1/Laurens St/Richland Ave 0.58 14.0 405
SC 291 US-29/N Pleasantburg Dr & US-29/Wade Hampton Blvd/Pine Knoll Dr 0.08 14.0 406US 29 SC-329/Victory Trail Rd & SC-150/SC-18/N Limestone St 4.01 14.0 407US 52 Cypress Gardens Rd & Old Mount Holly Rd 4.10 14.0 408US 76 SC-28/Clemson Blvd/N Main St & US-29 Bus/SC-28/SC-81/Greenville St 1.89 13.9 409US 29 US-176/N Pine St & US-221/SC-56/N Church St 0.72 13.9 410
US 321 US-21/US-176/Charleston Hwy & Mack St 5.91 13.9 411US 378 N Saint Pauls Church Rd & SC-441/Peach Orchard Rd/Shaw-Wise Dr 3.29 13.7 412US 76 Martin Ln & I-85 0.81 13.7 413SC 24 US-29 Bus/US-178/US-76/SC-28/SC-81 & SC-28/Pearman Dairy Rd 1.84 13.7 414
US 123 N Walnut St & US-123/SC-130/E North 1st St 1.68 13.7 415US 76 US-76 Byp/SC-127 & SC-S-30-46/Charlottes Rd 4.62 13.6 416US 25 SC-183/Farrs Bridge Rd & White Horse Rd 1.81 13.4 417US 76 SC-93/Old Greenville Hwy & SC-28/Pendleton Rd 0.45 13.4 418US 29 Briarwood Rd & Powell Mill Rd 0.83 13.4 419
SC 901 Crawford Rd & SC-72 Byp/SC-121/Albright Rd 1.07 13.3 420SC 72 SC-72 & Calhoun Rd 1.10 13.3 421SC 30 SC-61/Saint Andrews Blvd/Exit 1 & Harbor View Rd/Exit 2 1.25 13.3 422
US 378 SC-12/Klapman Blvd & N 12th St/Seminole Dr 1.08 13.2 423SC 261 US 521 & I-95 2.1 13.1 424US 52 Romney St & US-17/Septima Clark Expy 0.27 13.1 425US 1 SC-118/Robert M Bell Pkwy & SC-191/Main St 1.95 13.0 426
SC 703 Jasper Blvd & Rifle Range Rd/McCants Dr 2.39 13.0 427US 78 SC-165/W Richardson Ave & Jedburg Rd/Mallard Rd 2.79 13.0 428US 29 US-29/Breazeale Rd & US-29 Bus/Williamston Rd 7.11 13.0 429US 17 Ashley River Mem Brg & SC-61/Saint Andrews Blvd 0.38 12.9 430SC 38 S-401 Bus/SC-9/SC-385/King St (Bennettsville & US-15/King St (Bennettsville) (South) 0.64 12.9 431
US 278 SC-363/3rd St & SC-63/Main St 1.89 12.9 432US 17 US-701/N Fraser St/Duke St & US-521/SC-17 0.12 12.9 433US 25 SC-S-23-272/Garrison Rd & SC-86/Sandy Springs Rd/Bessie Rd 2.61 12.8 434US 1 Haile St/Old Stagecoach Rd & SC-34/Bishopville Hwy 1.70 12.8 435
US 601 SC-34/Ward Rd & US-1/Jefferson Davis Hwy 0.56 12.7 436US 1 SC-9/Market St & US-52 2.34 12.7 437US 52 US-52/Morrison Dr & Romney St 0.38 12.6 438US 29 SC-28/S Main St & SC-81/S Murray Ave (Anderson) (North) 0.34 12.6 439SC 5 US-21/S Anderson Rd & I-77 4.58 12.6 440US 78 US-15/N Parler Ave & I-95 1.90 12.5 441
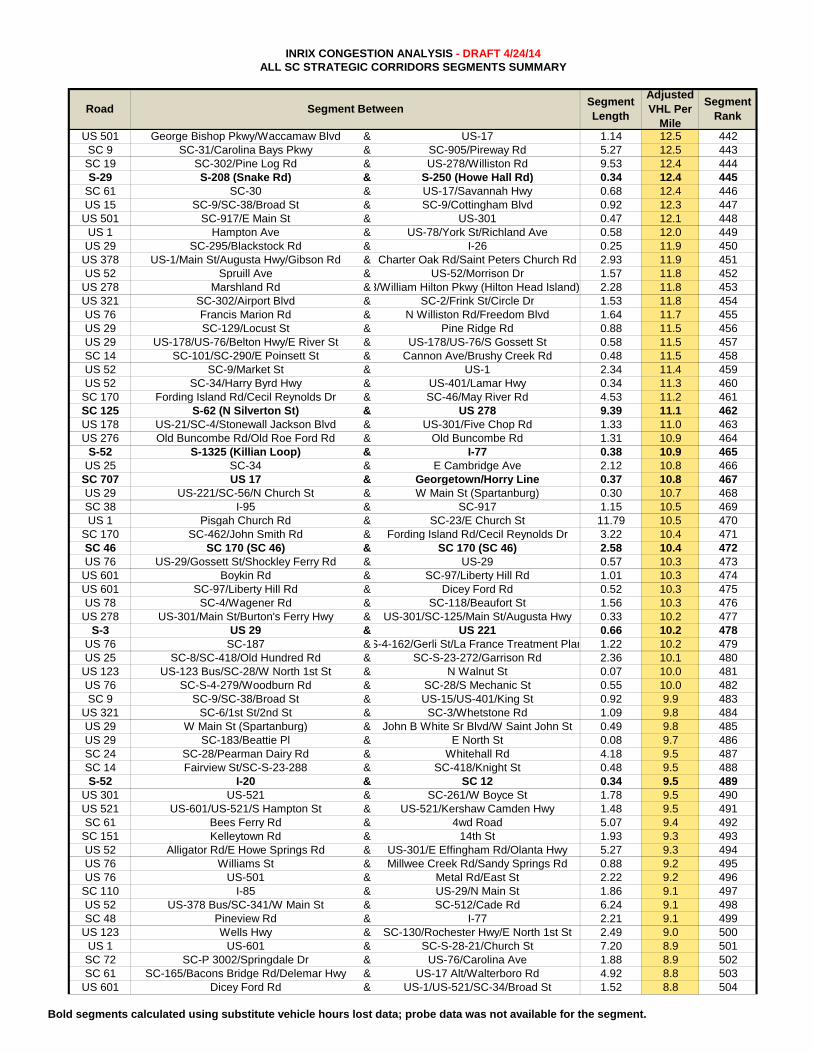
Bold segments calculated using substitute vehicle hours lost data; probe data was not available for the segment.
INRIX CONGESTION ANALYSIS - DRAFT 4/24/14ALL SC STRATEGIC CORRIDORS SEGMENTS SUMMARY
Adjusted VHL Per
Mile
Segment Rank
Road Segment BetweenSegment Length
US 501 George Bishop Pkwy/Waccamaw Blvd & US-17 1.14 12.5 442SC 9 SC-31/Carolina Bays Pkwy & SC-905/Pireway Rd 5.27 12.5 443SC 19 SC-302/Pine Log Rd & US-278/Williston Rd 9.53 12.4 444S-29 S-208 (Snake Rd) & S-250 (Howe Hall Rd) 0.34 12.4 445
SC 61 SC-30 & US-17/Savannah Hwy 0.68 12.4 446US 15 SC-9/SC-38/Broad St & SC-9/Cottingham Blvd 0.92 12.3 447
US 501 SC-917/E Main St & US-301 0.47 12.1 448US 1 Hampton Ave & US-78/York St/Richland Ave 0.58 12.0 449US 29 SC-295/Blackstock Rd & I-26 0.25 11.9 450
US 378 US-1/Main St/Augusta Hwy/Gibson Rd & Charter Oak Rd/Saint Peters Church Rd 2.93 11.9 451US 52 Spruill Ave & US-52/Morrison Dr 1.57 11.8 452
US 278 Marshland Rd &8/William Hilton Pkwy (Hilton Head Island) 2.28 11.8 453US 321 SC-302/Airport Blvd & SC-2/Frink St/Circle Dr 1.53 11.8 454US 76 Francis Marion Rd & N Williston Rd/Freedom Blvd 1.64 11.7 455US 29 SC-129/Locust St & Pine Ridge Rd 0.88 11.5 456US 29 US-178/US-76/Belton Hwy/E River St & US-178/US-76/S Gossett St 0.58 11.5 457SC 14 SC-101/SC-290/E Poinsett St & Cannon Ave/Brushy Creek Rd 0.48 11.5 458US 52 SC-9/Market St & US-1 2.34 11.4 459US 52 SC-34/Harry Byrd Hwy & US-401/Lamar Hwy 0.34 11.3 460
SC 170 Fording Island Rd/Cecil Reynolds Dr & SC-46/May River Rd 4.53 11.2 461SC 125 S-62 (N Silverton St) & US 278 9.39 11.1 462US 178 US-21/SC-4/Stonewall Jackson Blvd & US-301/Five Chop Rd 1.33 11.0 463US 276 Old Buncombe Rd/Old Roe Ford Rd & Old Buncombe Rd 1.31 10.9 464
S-52 S-1325 (Killian Loop) & I-77 0.38 10.9 465US 25 SC-34 & E Cambridge Ave 2.12 10.8 466
SC 707 US 17 & Georgetown/Horry Line 0.37 10.8 467US 29 US-221/SC-56/N Church St & W Main St (Spartanburg) 0.30 10.7 468SC 38 I-95 & SC-917 1.15 10.5 469US 1 Pisgah Church Rd & SC-23/E Church St 11.79 10.5 470
SC 170 SC-462/John Smith Rd & Fording Island Rd/Cecil Reynolds Dr 3.22 10.4 471SC 46 SC 170 (SC 46) & SC 170 (SC 46) 2.58 10.4 472US 76 US-29/Gossett St/Shockley Ferry Rd & US-29 0.57 10.3 473
US 601 Boykin Rd & SC-97/Liberty Hill Rd 1.01 10.3 474US 601 SC-97/Liberty Hill Rd & Dicey Ford Rd 0.52 10.3 475US 78 SC-4/Wagener Rd & SC-118/Beaufort St 1.56 10.3 476
US 278 US-301/Main St/Burton's Ferry Hwy & US-301/SC-125/Main St/Augusta Hwy 0.33 10.2 477S-3 US 29 & US 221 0.66 10.2 478
US 76 SC-187 &S-4-162/Gerli St/La France Treatment Plan 1.22 10.2 479US 25 SC-8/SC-418/Old Hundred Rd & SC-S-23-272/Garrison Rd 2.36 10.1 480
US 123 US-123 Bus/SC-28/W North 1st St & N Walnut St 0.07 10.0 481US 76 SC-S-4-279/Woodburn Rd & SC-28/S Mechanic St 0.55 10.0 482SC 9 SC-9/SC-38/Broad St & US-15/US-401/King St 0.92 9.9 483
US 321 SC-6/1st St/2nd St & SC-3/Whetstone Rd 1.09 9.8 484US 29 W Main St (Spartanburg) & John B White Sr Blvd/W Saint John St 0.49 9.8 485US 29 SC-183/Beattie Pl & E North St 0.08 9.7 486SC 24 SC-28/Pearman Dairy Rd & Whitehall Rd 4.18 9.5 487SC 14 Fairview St/SC-S-23-288 & SC-418/Knight St 0.48 9.5 488S-52 I-20 & SC 12 0.34 9.5 489
US 301 US-521 & SC-261/W Boyce St 1.78 9.5 490US 521 US-601/US-521/S Hampton St & US-521/Kershaw Camden Hwy 1.48 9.5 491SC 61 Bees Ferry Rd & 4wd Road 5.07 9.4 492
SC 151 Kelleytown Rd & 14th St 1.93 9.3 493US 52 Alligator Rd/E Howe Springs Rd & US-301/E Effingham Rd/Olanta Hwy 5.27 9.3 494US 76 Williams St & Millwee Creek Rd/Sandy Springs Rd 0.88 9.2 495US 76 US-501 & Metal Rd/East St 2.22 9.2 496
SC 110 I-85 & US-29/N Main St 1.86 9.1 497US 52 US-378 Bus/SC-341/W Main St & SC-512/Cade Rd 6.24 9.1 498SC 48 Pineview Rd & I-77 2.21 9.1 499
US 123 Wells Hwy & SC-130/Rochester Hwy/E North 1st St 2.49 9.0 500US 1 US-601 & SC-S-28-21/Church St 7.20 8.9 501SC 72 SC-P 3002/Springdale Dr & US-76/Carolina Ave 1.88 8.9 502SC 61 SC-165/Bacons Bridge Rd/Delemar Hwy & US-17 Alt/Walterboro Rd 4.92 8.8 503
US 601 Dicey Ford Rd & US-1/US-521/SC-34/Broad St 1.52 8.8 504
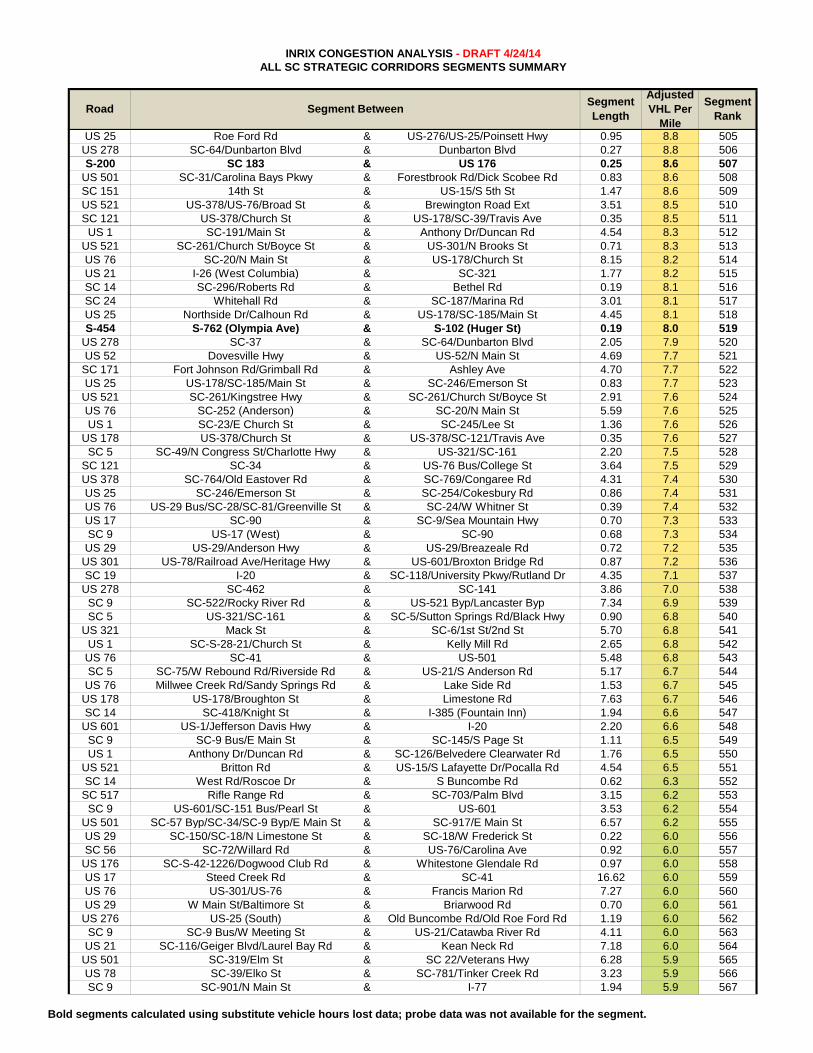
Bold segments calculated using substitute vehicle hours lost data; probe data was not available for the segment.
INRIX CONGESTION ANALYSIS - DRAFT 4/24/14ALL SC STRATEGIC CORRIDORS SEGMENTS SUMMARY
Adjusted VHL Per
Mile
Segment Rank
Road Segment BetweenSegment Length
US 25 Roe Ford Rd & US-276/US-25/Poinsett Hwy 0.95 8.8 505US 278 SC-64/Dunbarton Blvd & Dunbarton Blvd 0.27 8.8 506S-200 SC 183 & US 176 0.25 8.6 507
US 501 SC-31/Carolina Bays Pkwy & Forestbrook Rd/Dick Scobee Rd 0.83 8.6 508SC 151 14th St & US-15/S 5th St 1.47 8.6 509US 521 US-378/US-76/Broad St & Brewington Road Ext 3.51 8.5 510SC 121 US-378/Church St & US-178/SC-39/Travis Ave 0.35 8.5 511
US 1 SC-191/Main St & Anthony Dr/Duncan Rd 4.54 8.3 512US 521 SC-261/Church St/Boyce St & US-301/N Brooks St 0.71 8.3 513US 76 SC-20/N Main St & US-178/Church St 8.15 8.2 514US 21 I-26 (West Columbia) & SC-321 1.77 8.2 515SC 14 SC-296/Roberts Rd & Bethel Rd 0.19 8.1 516SC 24 Whitehall Rd & SC-187/Marina Rd 3.01 8.1 517US 25 Northside Dr/Calhoun Rd & US-178/SC-185/Main St 4.45 8.1 518S-454 S-762 (Olympia Ave) & S-102 (Huger St) 0.19 8.0 519
US 278 SC-37 & SC-64/Dunbarton Blvd 2.05 7.9 520US 52 Dovesville Hwy & US-52/N Main St 4.69 7.7 521
SC 171 Fort Johnson Rd/Grimball Rd & Ashley Ave 4.70 7.7 522US 25 US-178/SC-185/Main St & SC-246/Emerson St 0.83 7.7 523
US 521 SC-261/Kingstree Hwy & SC-261/Church St/Boyce St 2.91 7.6 524US 76 SC-252 (Anderson) & SC-20/N Main St 5.59 7.6 525US 1 SC-23/E Church St & SC-245/Lee St 1.36 7.6 526
US 178 US-378/Church St & US-378/SC-121/Travis Ave 0.35 7.6 527SC 5 SC-49/N Congress St/Charlotte Hwy & US-321/SC-161 2.20 7.5 528
SC 121 SC-34 & US-76 Bus/College St 3.64 7.5 529US 378 SC-764/Old Eastover Rd & SC-769/Congaree Rd 4.31 7.4 530US 25 SC-246/Emerson St & SC-254/Cokesbury Rd 0.86 7.4 531US 76 US-29 Bus/SC-28/SC-81/Greenville St & SC-24/W Whitner St 0.39 7.4 532US 17 SC-90 & SC-9/Sea Mountain Hwy 0.70 7.3 533SC 9 US-17 (West) & SC-90 0.68 7.3 534US 29 US-29/Anderson Hwy & US-29/Breazeale Rd 0.72 7.2 535
US 301 US-78/Railroad Ave/Heritage Hwy & US-601/Broxton Bridge Rd 0.87 7.2 536SC 19 I-20 & SC-118/University Pkwy/Rutland Dr 4.35 7.1 537
US 278 SC-462 & SC-141 3.86 7.0 538SC 9 SC-522/Rocky River Rd & US-521 Byp/Lancaster Byp 7.34 6.9 539SC 5 US-321/SC-161 & SC-5/Sutton Springs Rd/Black Hwy 0.90 6.8 540
US 321 Mack St & SC-6/1st St/2nd St 5.70 6.8 541US 1 SC-S-28-21/Church St & Kelly Mill Rd 2.65 6.8 542US 76 SC-41 & US-501 5.48 6.8 543SC 5 SC-75/W Rebound Rd/Riverside Rd & US-21/S Anderson Rd 5.17 6.7 544US 76 Millwee Creek Rd/Sandy Springs Rd & Lake Side Rd 1.53 6.7 545
US 178 US-178/Broughton St & Limestone Rd 7.63 6.7 546SC 14 SC-418/Knight St & I-385 (Fountain Inn) 1.94 6.6 547
US 601 US-1/Jefferson Davis Hwy & I-20 2.20 6.6 548SC 9 SC-9 Bus/E Main St & SC-145/S Page St 1.11 6.5 549US 1 Anthony Dr/Duncan Rd & SC-126/Belvedere Clearwater Rd 1.76 6.5 550
US 521 Britton Rd & US-15/S Lafayette Dr/Pocalla Rd 4.54 6.5 551SC 14 West Rd/Roscoe Dr & S Buncombe Rd 0.62 6.3 552
SC 517 Rifle Range Rd & SC-703/Palm Blvd 3.15 6.2 553SC 9 US-601/SC-151 Bus/Pearl St & US-601 3.53 6.2 554
US 501 SC-57 Byp/SC-34/SC-9 Byp/E Main St & SC-917/E Main St 6.57 6.2 555US 29 SC-150/SC-18/N Limestone St & SC-18/W Frederick St 0.22 6.0 556SC 56 SC-72/Willard Rd & US-76/Carolina Ave 0.92 6.0 557
US 176 SC-S-42-1226/Dogwood Club Rd & Whitestone Glendale Rd 0.97 6.0 558US 17 Steed Creek Rd & SC-41 16.62 6.0 559US 76 US-301/US-76 & Francis Marion Rd 7.27 6.0 560US 29 W Main St/Baltimore St & Briarwood Rd 0.70 6.0 561
US 276 US-25 (South) & Old Buncombe Rd/Old Roe Ford Rd 1.19 6.0 562SC 9 SC-9 Bus/W Meeting St & US-21/Catawba River Rd 4.11 6.0 563US 21 SC-116/Geiger Blvd/Laurel Bay Rd & Kean Neck Rd 7.18 6.0 564
US 501 SC-319/Elm St & SC 22/Veterans Hwy 6.28 5.9 565US 78 SC-39/Elko St & SC-781/Tinker Creek Rd 3.23 5.9 566SC 9 SC-901/N Main St & I-77 1.94 5.9 567
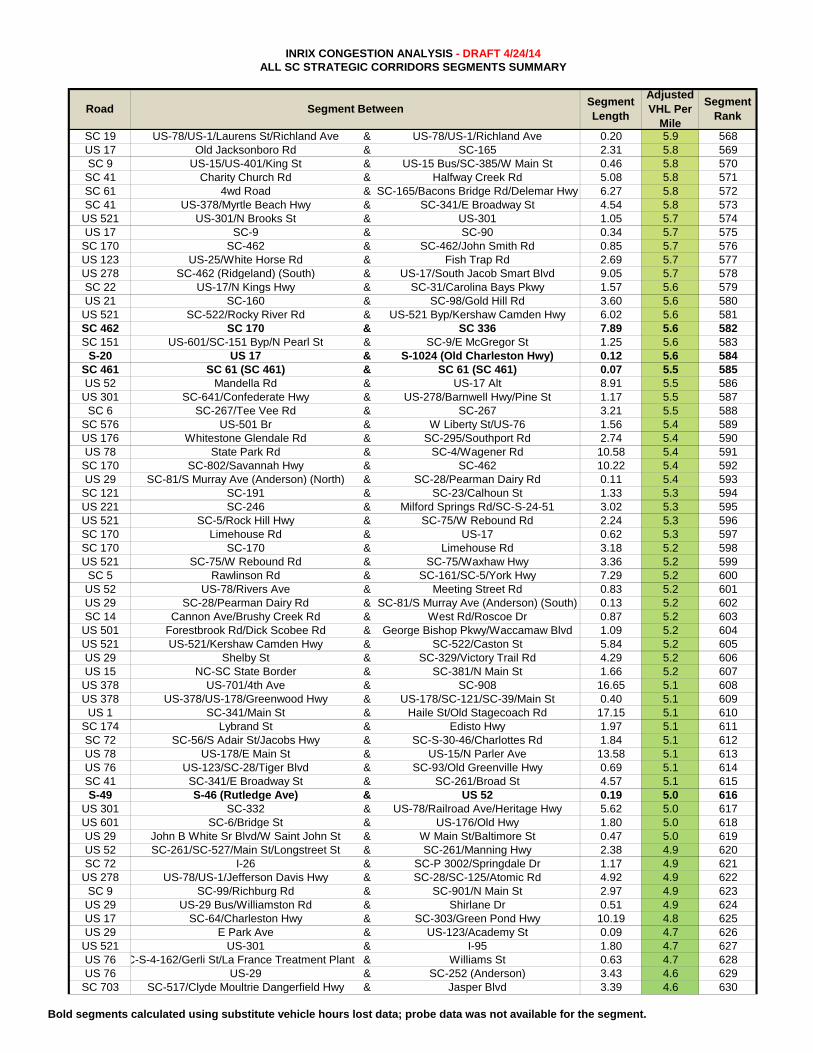
Bold segments calculated using substitute vehicle hours lost data; probe data was not available for the segment.
INRIX CONGESTION ANALYSIS - DRAFT 4/24/14ALL SC STRATEGIC CORRIDORS SEGMENTS SUMMARY
Adjusted VHL Per
Mile
Segment Rank
Road Segment BetweenSegment Length
SC 19 US-78/US-1/Laurens St/Richland Ave & US-78/US-1/Richland Ave 0.20 5.9 568US 17 Old Jacksonboro Rd & SC-165 2.31 5.8 569SC 9 US-15/US-401/King St & US-15 Bus/SC-385/W Main St 0.46 5.8 570SC 41 Charity Church Rd & Halfway Creek Rd 5.08 5.8 571SC 61 4wd Road & SC-165/Bacons Bridge Rd/Delemar Hwy 6.27 5.8 572SC 41 US-378/Myrtle Beach Hwy & SC-341/E Broadway St 4.54 5.8 573
US 521 US-301/N Brooks St & US-301 1.05 5.7 574US 17 SC-9 & SC-90 0.34 5.7 575
SC 170 SC-462 & SC-462/John Smith Rd 0.85 5.7 576US 123 US-25/White Horse Rd & Fish Trap Rd 2.69 5.7 577US 278 SC-462 (Ridgeland) (South) & US-17/South Jacob Smart Blvd 9.05 5.7 578SC 22 US-17/N Kings Hwy & SC-31/Carolina Bays Pkwy 1.57 5.6 579US 21 SC-160 & SC-98/Gold Hill Rd 3.60 5.6 580
US 521 SC-522/Rocky River Rd & US-521 Byp/Kershaw Camden Hwy 6.02 5.6 581SC 462 SC 170 & SC 336 7.89 5.6 582SC 151 US-601/SC-151 Byp/N Pearl St & SC-9/E McGregor St 1.25 5.6 583
S-20 US 17 & S-1024 (Old Charleston Hwy) 0.12 5.6 584SC 461 SC 61 (SC 461) & SC 61 (SC 461) 0.07 5.5 585US 52 Mandella Rd & US-17 Alt 8.91 5.5 586
US 301 SC-641/Confederate Hwy & US-278/Barnwell Hwy/Pine St 1.17 5.5 587SC 6 SC-267/Tee Vee Rd & SC-267 3.21 5.5 588
SC 576 US-501 Br & W Liberty St/US-76 1.56 5.4 589US 176 Whitestone Glendale Rd & SC-295/Southport Rd 2.74 5.4 590US 78 State Park Rd & SC-4/Wagener Rd 10.58 5.4 591
SC 170 SC-802/Savannah Hwy & SC-462 10.22 5.4 592US 29 SC-81/S Murray Ave (Anderson) (North) & SC-28/Pearman Dairy Rd 0.11 5.4 593
SC 121 SC-191 & SC-23/Calhoun St 1.33 5.3 594US 221 SC-246 & Milford Springs Rd/SC-S-24-51 3.02 5.3 595US 521 SC-5/Rock Hill Hwy & SC-75/W Rebound Rd 2.24 5.3 596SC 170 Limehouse Rd & US-17 0.62 5.3 597SC 170 SC-170 & Limehouse Rd 3.18 5.2 598US 521 SC-75/W Rebound Rd & SC-75/Waxhaw Hwy 3.36 5.2 599
SC 5 Rawlinson Rd & SC-161/SC-5/York Hwy 7.29 5.2 600US 52 US-78/Rivers Ave & Meeting Street Rd 0.83 5.2 601US 29 SC-28/Pearman Dairy Rd & SC-81/S Murray Ave (Anderson) (South) 0.13 5.2 602SC 14 Cannon Ave/Brushy Creek Rd & West Rd/Roscoe Dr 0.87 5.2 603
US 501 Forestbrook Rd/Dick Scobee Rd & George Bishop Pkwy/Waccamaw Blvd 1.09 5.2 604US 521 US-521/Kershaw Camden Hwy & SC-522/Caston St 5.84 5.2 605US 29 Shelby St & SC-329/Victory Trail Rd 4.29 5.2 606US 15 NC-SC State Border & SC-381/N Main St 1.66 5.2 607
US 378 US-701/4th Ave & SC-908 16.65 5.1 608US 378 US-378/US-178/Greenwood Hwy & US-178/SC-121/SC-39/Main St 0.40 5.1 609
US 1 SC-341/Main St & Haile St/Old Stagecoach Rd 17.15 5.1 610SC 174 Lybrand St & Edisto Hwy 1.97 5.1 611SC 72 SC-56/S Adair St/Jacobs Hwy & SC-S-30-46/Charlottes Rd 1.84 5.1 612US 78 US-178/E Main St & US-15/N Parler Ave 13.58 5.1 613US 76 US-123/SC-28/Tiger Blvd & SC-93/Old Greenville Hwy 0.69 5.1 614SC 41 SC-341/E Broadway St & SC-261/Broad St 4.57 5.1 615S-49 S-46 (Rutledge Ave) & US 52 0.19 5.0 616
US 301 SC-332 & US-78/Railroad Ave/Heritage Hwy 5.62 5.0 617US 601 SC-6/Bridge St & US-176/Old Hwy 1.80 5.0 618US 29 John B White Sr Blvd/W Saint John St & W Main St/Baltimore St 0.47 5.0 619US 52 SC-261/SC-527/Main St/Longstreet St & SC-261/Manning Hwy 2.38 4.9 620SC 72 I-26 & SC-P 3002/Springdale Dr 1.17 4.9 621
US 278 US-78/US-1/Jefferson Davis Hwy & SC-28/SC-125/Atomic Rd 4.92 4.9 622SC 9 SC-99/Richburg Rd & SC-901/N Main St 2.97 4.9 623US 29 US-29 Bus/Williamston Rd & Shirlane Dr 0.51 4.9 624US 17 SC-64/Charleston Hwy & SC-303/Green Pond Hwy 10.19 4.8 625US 29 E Park Ave & US-123/Academy St 0.09 4.7 626
US 521 US-301 & I-95 1.80 4.7 627US 76 C-S-4-162/Gerli St/La France Treatment Plant R& Williams St 0.63 4.7 628US 76 US-29 & SC-252 (Anderson) 3.43 4.6 629
SC 703 SC-517/Clyde Moultrie Dangerfield Hwy & Jasper Blvd 3.39 4.6 630
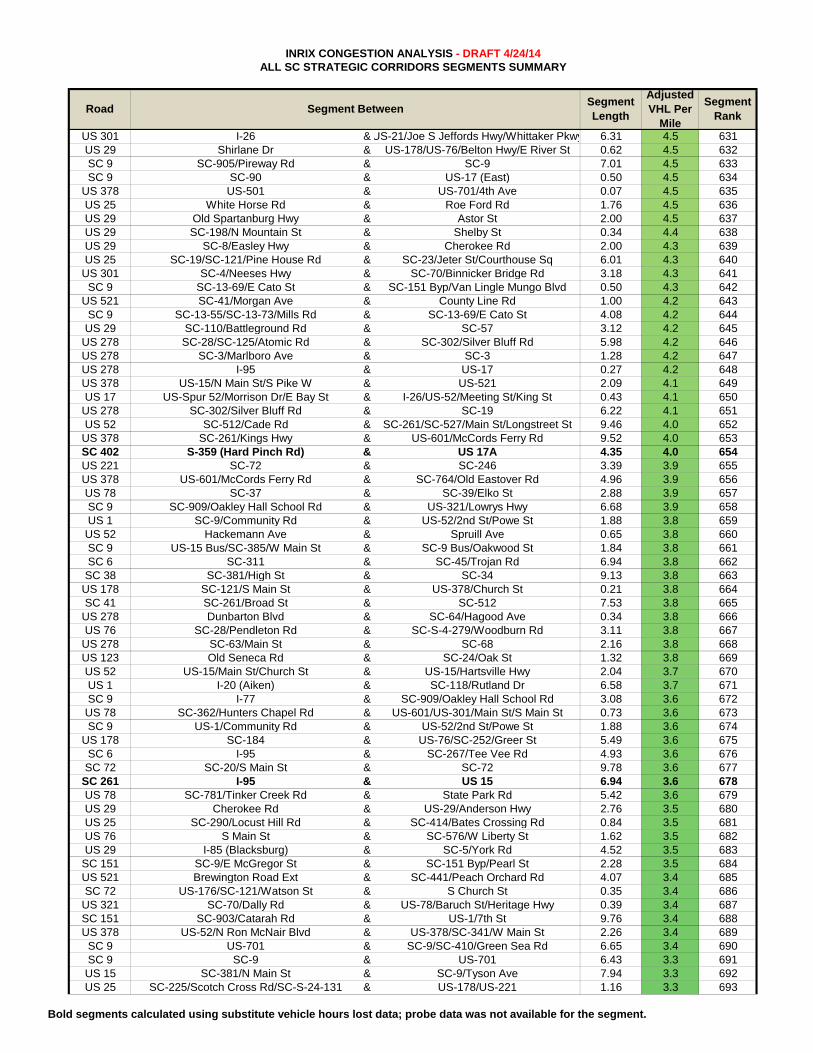
Bold segments calculated using substitute vehicle hours lost data; probe data was not available for the segment.
INRIX CONGESTION ANALYSIS - DRAFT 4/24/14ALL SC STRATEGIC CORRIDORS SEGMENTS SUMMARY
Adjusted VHL Per
Mile
Segment Rank
Road Segment BetweenSegment Length
US 301 I-26 &US-21/Joe S Jeffords Hwy/Whittaker Pkwy 6.31 4.5 631US 29 Shirlane Dr & US-178/US-76/Belton Hwy/E River St 0.62 4.5 632SC 9 SC-905/Pireway Rd & SC-9 7.01 4.5 633SC 9 SC-90 & US-17 (East) 0.50 4.5 634
US 378 US-501 & US-701/4th Ave 0.07 4.5 635US 25 White Horse Rd & Roe Ford Rd 1.76 4.5 636US 29 Old Spartanburg Hwy & Astor St 2.00 4.5 637US 29 SC-198/N Mountain St & Shelby St 0.34 4.4 638US 29 SC-8/Easley Hwy & Cherokee Rd 2.00 4.3 639US 25 SC-19/SC-121/Pine House Rd & SC-23/Jeter St/Courthouse Sq 6.01 4.3 640
US 301 SC-4/Neeses Hwy & SC-70/Binnicker Bridge Rd 3.18 4.3 641SC 9 SC-13-69/E Cato St & SC-151 Byp/Van Lingle Mungo Blvd 0.50 4.3 642
US 521 SC-41/Morgan Ave & County Line Rd 1.00 4.2 643SC 9 SC-13-55/SC-13-73/Mills Rd & SC-13-69/E Cato St 4.08 4.2 644US 29 SC-110/Battleground Rd & SC-57 3.12 4.2 645
US 278 SC-28/SC-125/Atomic Rd & SC-302/Silver Bluff Rd 5.98 4.2 646US 278 SC-3/Marlboro Ave & SC-3 1.28 4.2 647US 278 I-95 & US-17 0.27 4.2 648US 378 US-15/N Main St/S Pike W & US-521 2.09 4.1 649US 17 US-Spur 52/Morrison Dr/E Bay St & I-26/US-52/Meeting St/King St 0.43 4.1 650
US 278 SC-302/Silver Bluff Rd & SC-19 6.22 4.1 651US 52 SC-512/Cade Rd & SC-261/SC-527/Main St/Longstreet St 9.46 4.0 652
US 378 SC-261/Kings Hwy & US-601/McCords Ferry Rd 9.52 4.0 653SC 402 S-359 (Hard Pinch Rd) & US 17A 4.35 4.0 654US 221 SC-72 & SC-246 3.39 3.9 655US 378 US-601/McCords Ferry Rd & SC-764/Old Eastover Rd 4.96 3.9 656US 78 SC-37 & SC-39/Elko St 2.88 3.9 657SC 9 SC-909/Oakley Hall School Rd & US-321/Lowrys Hwy 6.68 3.9 658US 1 SC-9/Community Rd & US-52/2nd St/Powe St 1.88 3.8 659US 52 Hackemann Ave & Spruill Ave 0.65 3.8 660SC 9 US-15 Bus/SC-385/W Main St & SC-9 Bus/Oakwood St 1.84 3.8 661SC 6 SC-311 & SC-45/Trojan Rd 6.94 3.8 662SC 38 SC-381/High St & SC-34 9.13 3.8 663
US 178 SC-121/S Main St & US-378/Church St 0.21 3.8 664SC 41 SC-261/Broad St & SC-512 7.53 3.8 665
US 278 Dunbarton Blvd & SC-64/Hagood Ave 0.34 3.8 666US 76 SC-28/Pendleton Rd & SC-S-4-279/Woodburn Rd 3.11 3.8 667
US 278 SC-63/Main St & SC-68 2.16 3.8 668US 123 Old Seneca Rd & SC-24/Oak St 1.32 3.8 669US 52 US-15/Main St/Church St & US-15/Hartsville Hwy 2.04 3.7 670US 1 I-20 (Aiken) & SC-118/Rutland Dr 6.58 3.7 671SC 9 I-77 & SC-909/Oakley Hall School Rd 3.08 3.6 672US 78 SC-362/Hunters Chapel Rd & US-601/US-301/Main St/S Main St 0.73 3.6 673SC 9 US-1/Community Rd & US-52/2nd St/Powe St 1.88 3.6 674
US 178 SC-184 & US-76/SC-252/Greer St 5.49 3.6 675SC 6 I-95 & SC-267/Tee Vee Rd 4.93 3.6 676SC 72 SC-20/S Main St & SC-72 9.78 3.6 677
SC 261 I-95 & US 15 6.94 3.6 678US 78 SC-781/Tinker Creek Rd & State Park Rd 5.42 3.6 679US 29 Cherokee Rd & US-29/Anderson Hwy 2.76 3.5 680US 25 SC-290/Locust Hill Rd & SC-414/Bates Crossing Rd 0.84 3.5 681US 76 S Main St & SC-576/W Liberty St 1.62 3.5 682US 29 I-85 (Blacksburg) & SC-5/York Rd 4.52 3.5 683
SC 151 SC-9/E McGregor St & SC-151 Byp/Pearl St 2.28 3.5 684US 521 Brewington Road Ext & SC-441/Peach Orchard Rd 4.07 3.4 685SC 72 US-176/SC-121/Watson St & S Church St 0.35 3.4 686
US 321 SC-70/Dally Rd & US-78/Baruch St/Heritage Hwy 0.39 3.4 687SC 151 SC-903/Catarah Rd & US-1/7th St 9.76 3.4 688US 378 US-52/N Ron McNair Blvd & US-378/SC-341/W Main St 2.26 3.4 689
SC 9 US-701 & SC-9/SC-410/Green Sea Rd 6.65 3.4 690SC 9 SC-9 & US-701 6.43 3.3 691US 15 SC-381/N Main St & SC-9/Tyson Ave 7.94 3.3 692US 25 SC-225/Scotch Cross Rd/SC-S-24-131 & US-178/US-221 1.16 3.3 693
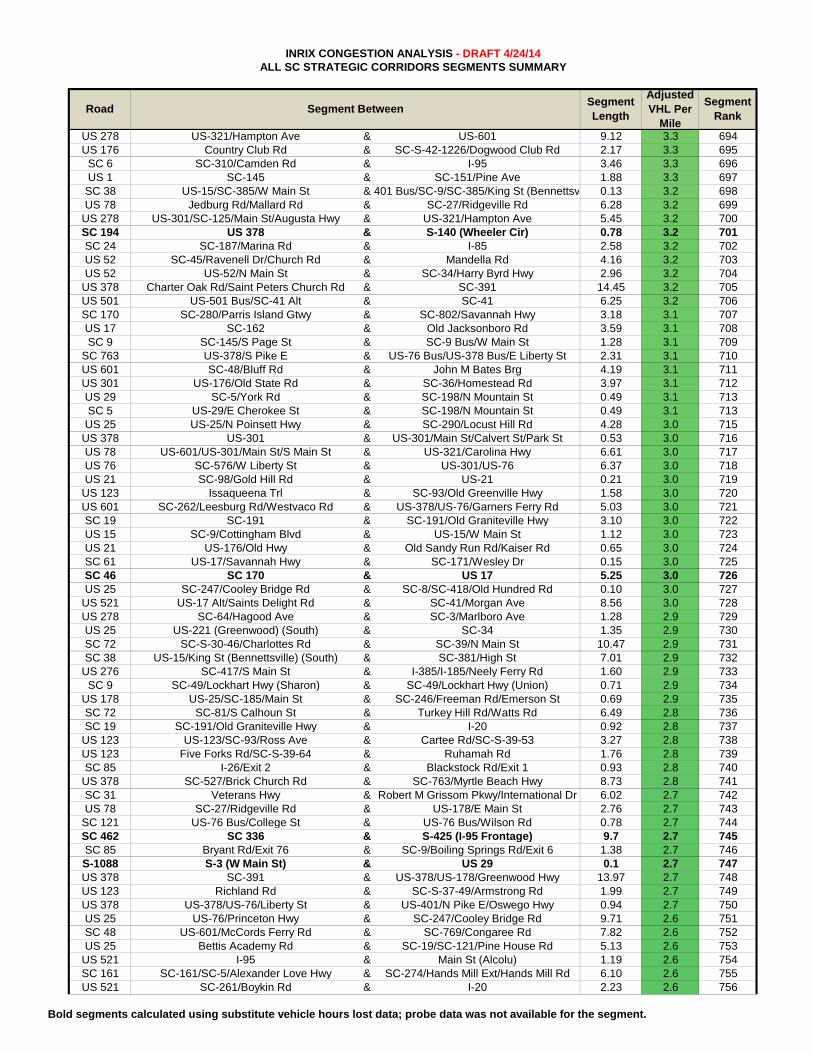
Bold segments calculated using substitute vehicle hours lost data; probe data was not available for the segment.
INRIX CONGESTION ANALYSIS - DRAFT 4/24/14ALL SC STRATEGIC CORRIDORS SEGMENTS SUMMARY
Adjusted VHL Per
Mile
Segment Rank
Road Segment BetweenSegment Length
US 278 US-321/Hampton Ave & US-601 9.12 3.3 694US 176 Country Club Rd & SC-S-42-1226/Dogwood Club Rd 2.17 3.3 695
SC 6 SC-310/Camden Rd & I-95 3.46 3.3 696US 1 SC-145 & SC-151/Pine Ave 1.88 3.3 697SC 38 US-15/SC-385/W Main St & 401 Bus/SC-9/SC-385/King St (Bennettsv 0.13 3.2 698US 78 Jedburg Rd/Mallard Rd & SC-27/Ridgeville Rd 6.28 3.2 699
US 278 US-301/SC-125/Main St/Augusta Hwy & US-321/Hampton Ave 5.45 3.2 700SC 194 US 378 & S-140 (Wheeler Cir) 0.78 3.2 701SC 24 SC-187/Marina Rd & I-85 2.58 3.2 702US 52 SC-45/Ravenell Dr/Church Rd & Mandella Rd 4.16 3.2 703US 52 US-52/N Main St & SC-34/Harry Byrd Hwy 2.96 3.2 704
US 378 Charter Oak Rd/Saint Peters Church Rd & SC-391 14.45 3.2 705US 501 US-501 Bus/SC-41 Alt & SC-41 6.25 3.2 706SC 170 SC-280/Parris Island Gtwy & SC-802/Savannah Hwy 3.18 3.1 707US 17 SC-162 & Old Jacksonboro Rd 3.59 3.1 708SC 9 SC-145/S Page St & SC-9 Bus/W Main St 1.28 3.1 709
SC 763 US-378/S Pike E & US-76 Bus/US-378 Bus/E Liberty St 2.31 3.1 710US 601 SC-48/Bluff Rd & John M Bates Brg 4.19 3.1 711US 301 US-176/Old State Rd & SC-36/Homestead Rd 3.97 3.1 712US 29 SC-5/York Rd & SC-198/N Mountain St 0.49 3.1 713SC 5 US-29/E Cherokee St & SC-198/N Mountain St 0.49 3.1 713US 25 US-25/N Poinsett Hwy & SC-290/Locust Hill Rd 4.28 3.0 715
US 378 US-301 & US-301/Main St/Calvert St/Park St 0.53 3.0 716US 78 US-601/US-301/Main St/S Main St & US-321/Carolina Hwy 6.61 3.0 717US 76 SC-576/W Liberty St & US-301/US-76 6.37 3.0 718US 21 SC-98/Gold Hill Rd & US-21 0.21 3.0 719
US 123 Issaqueena Trl & SC-93/Old Greenville Hwy 1.58 3.0 720US 601 SC-262/Leesburg Rd/Westvaco Rd & US-378/US-76/Garners Ferry Rd 5.03 3.0 721SC 19 SC-191 & SC-191/Old Graniteville Hwy 3.10 3.0 722US 15 SC-9/Cottingham Blvd & US-15/W Main St 1.12 3.0 723US 21 US-176/Old Hwy & Old Sandy Run Rd/Kaiser Rd 0.65 3.0 724SC 61 US-17/Savannah Hwy & SC-171/Wesley Dr 0.15 3.0 725SC 46 SC 170 & US 17 5.25 3.0 726US 25 SC-247/Cooley Bridge Rd & SC-8/SC-418/Old Hundred Rd 0.10 3.0 727
US 521 US-17 Alt/Saints Delight Rd & SC-41/Morgan Ave 8.56 3.0 728US 278 SC-64/Hagood Ave & SC-3/Marlboro Ave 1.28 2.9 729US 25 US-221 (Greenwood) (South) & SC-34 1.35 2.9 730SC 72 SC-S-30-46/Charlottes Rd & SC-39/N Main St 10.47 2.9 731SC 38 US-15/King St (Bennettsville) (South) & SC-381/High St 7.01 2.9 732
US 276 SC-417/S Main St & I-385/I-185/Neely Ferry Rd 1.60 2.9 733SC 9 SC-49/Lockhart Hwy (Sharon) & SC-49/Lockhart Hwy (Union) 0.71 2.9 734
US 178 US-25/SC-185/Main St & SC-246/Freeman Rd/Emerson St 0.69 2.9 735SC 72 SC-81/S Calhoun St & Turkey Hill Rd/Watts Rd 6.49 2.8 736SC 19 SC-191/Old Graniteville Hwy & I-20 0.92 2.8 737
US 123 US-123/SC-93/Ross Ave & Cartee Rd/SC-S-39-53 3.27 2.8 738US 123 Five Forks Rd/SC-S-39-64 & Ruhamah Rd 1.76 2.8 739SC 85 I-26/Exit 2 & Blackstock Rd/Exit 1 0.93 2.8 740
US 378 SC-527/Brick Church Rd & SC-763/Myrtle Beach Hwy 8.73 2.8 741SC 31 Veterans Hwy & Robert M Grissom Pkwy/International Dr 6.02 2.7 742US 78 SC-27/Ridgeville Rd & US-178/E Main St 2.76 2.7 743
SC 121 US-76 Bus/College St & US-76 Bus/Wilson Rd 0.78 2.7 744SC 462 SC 336 & S-425 (I-95 Frontage) 9.7 2.7 745SC 85 Bryant Rd/Exit 76 & SC-9/Boiling Springs Rd/Exit 6 1.38 2.7 746S-1088 S-3 (W Main St) & US 29 0.1 2.7 747US 378 SC-391 & US-378/US-178/Greenwood Hwy 13.97 2.7 748US 123 Richland Rd & SC-S-37-49/Armstrong Rd 1.99 2.7 749US 378 US-378/US-76/Liberty St & US-401/N Pike E/Oswego Hwy 0.94 2.7 750US 25 US-76/Princeton Hwy & SC-247/Cooley Bridge Rd 9.71 2.6 751SC 48 US-601/McCords Ferry Rd & SC-769/Congaree Rd 7.82 2.6 752US 25 Bettis Academy Rd & SC-19/SC-121/Pine House Rd 5.13 2.6 753
US 521 I-95 & Main St (Alcolu) 1.19 2.6 754SC 161 SC-161/SC-5/Alexander Love Hwy & SC-274/Hands Mill Ext/Hands Mill Rd 6.10 2.6 755US 521 SC-261/Boykin Rd & I-20 2.23 2.6 756
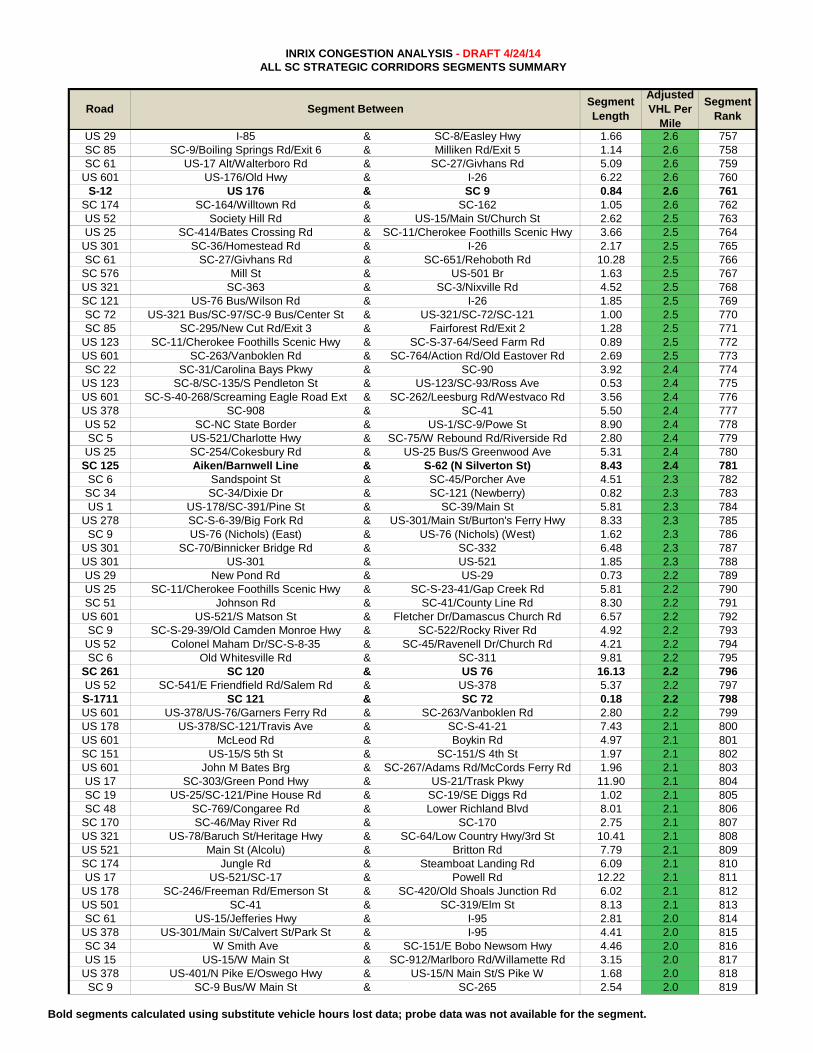
Bold segments calculated using substitute vehicle hours lost data; probe data was not available for the segment.
INRIX CONGESTION ANALYSIS - DRAFT 4/24/14ALL SC STRATEGIC CORRIDORS SEGMENTS SUMMARY
Adjusted VHL Per
Mile
Segment Rank
Road Segment BetweenSegment Length
US 29 I-85 & SC-8/Easley Hwy 1.66 2.6 757SC 85 SC-9/Boiling Springs Rd/Exit 6 & Milliken Rd/Exit 5 1.14 2.6 758SC 61 US-17 Alt/Walterboro Rd & SC-27/Givhans Rd 5.09 2.6 759
US 601 US-176/Old Hwy & I-26 6.22 2.6 760S-12 US 176 & SC 9 0.84 2.6 761
SC 174 SC-164/Willtown Rd & SC-162 1.05 2.6 762US 52 Society Hill Rd & US-15/Main St/Church St 2.62 2.5 763US 25 SC-414/Bates Crossing Rd & SC-11/Cherokee Foothills Scenic Hwy 3.66 2.5 764
US 301 SC-36/Homestead Rd & I-26 2.17 2.5 765SC 61 SC-27/Givhans Rd & SC-651/Rehoboth Rd 10.28 2.5 766
SC 576 Mill St & US-501 Br 1.63 2.5 767US 321 SC-363 & SC-3/Nixville Rd 4.52 2.5 768SC 121 US-76 Bus/Wilson Rd & I-26 1.85 2.5 769SC 72 US-321 Bus/SC-97/SC-9 Bus/Center St & US-321/SC-72/SC-121 1.00 2.5 770SC 85 SC-295/New Cut Rd/Exit 3 & Fairforest Rd/Exit 2 1.28 2.5 771
US 123 SC-11/Cherokee Foothills Scenic Hwy & SC-S-37-64/Seed Farm Rd 0.89 2.5 772US 601 SC-263/Vanboklen Rd & SC-764/Action Rd/Old Eastover Rd 2.69 2.5 773SC 22 SC-31/Carolina Bays Pkwy & SC-90 3.92 2.4 774
US 123 SC-8/SC-135/S Pendleton St & US-123/SC-93/Ross Ave 0.53 2.4 775US 601 SC-S-40-268/Screaming Eagle Road Ext & SC-262/Leesburg Rd/Westvaco Rd 3.56 2.4 776US 378 SC-908 & SC-41 5.50 2.4 777US 52 SC-NC State Border & US-1/SC-9/Powe St 8.90 2.4 778SC 5 US-521/Charlotte Hwy & SC-75/W Rebound Rd/Riverside Rd 2.80 2.4 779US 25 SC-254/Cokesbury Rd & US-25 Bus/S Greenwood Ave 5.31 2.4 780
SC 125 Aiken/Barnwell Line & S-62 (N Silverton St) 8.43 2.4 781SC 6 Sandspoint St & SC-45/Porcher Ave 4.51 2.3 782SC 34 SC-34/Dixie Dr & SC-121 (Newberry) 0.82 2.3 783US 1 US-178/SC-391/Pine St & SC-39/Main St 5.81 2.3 784
US 278 SC-S-6-39/Big Fork Rd & US-301/Main St/Burton's Ferry Hwy 8.33 2.3 785SC 9 US-76 (Nichols) (East) & US-76 (Nichols) (West) 1.62 2.3 786
US 301 SC-70/Binnicker Bridge Rd & SC-332 6.48 2.3 787US 301 US-301 & US-521 1.85 2.3 788US 29 New Pond Rd & US-29 0.73 2.2 789US 25 SC-11/Cherokee Foothills Scenic Hwy & SC-S-23-41/Gap Creek Rd 5.81 2.2 790SC 51 Johnson Rd & SC-41/County Line Rd 8.30 2.2 791
US 601 US-521/S Matson St & Fletcher Dr/Damascus Church Rd 6.57 2.2 792SC 9 SC-S-29-39/Old Camden Monroe Hwy & SC-522/Rocky River Rd 4.92 2.2 793US 52 Colonel Maham Dr/SC-S-8-35 & SC-45/Ravenell Dr/Church Rd 4.21 2.2 794SC 6 Old Whitesville Rd & SC-311 9.81 2.2 795
SC 261 SC 120 & US 76 16.13 2.2 796US 52 SC-541/E Friendfield Rd/Salem Rd & US-378 5.37 2.2 797S-1711 SC 121 & SC 72 0.18 2.2 798US 601 US-378/US-76/Garners Ferry Rd & SC-263/Vanboklen Rd 2.80 2.2 799US 178 US-378/SC-121/Travis Ave & SC-S-41-21 7.43 2.1 800US 601 McLeod Rd & Boykin Rd 4.97 2.1 801SC 151 US-15/S 5th St & SC-151/S 4th St 1.97 2.1 802US 601 John M Bates Brg & SC-267/Adams Rd/McCords Ferry Rd 1.96 2.1 803US 17 SC-303/Green Pond Hwy & US-21/Trask Pkwy 11.90 2.1 804SC 19 US-25/SC-121/Pine House Rd & SC-19/SE Diggs Rd 1.02 2.1 805SC 48 SC-769/Congaree Rd & Lower Richland Blvd 8.01 2.1 806
SC 170 SC-46/May River Rd & SC-170 2.75 2.1 807US 321 US-78/Baruch St/Heritage Hwy & SC-64/Low Country Hwy/3rd St 10.41 2.1 808US 521 Main St (Alcolu) & Britton Rd 7.79 2.1 809SC 174 Jungle Rd & Steamboat Landing Rd 6.09 2.1 810US 17 US-521/SC-17 & Powell Rd 12.22 2.1 811
US 178 SC-246/Freeman Rd/Emerson St & SC-420/Old Shoals Junction Rd 6.02 2.1 812US 501 SC-41 & SC-319/Elm St 8.13 2.1 813SC 61 US-15/Jefferies Hwy & I-95 2.81 2.0 814
US 378 US-301/Main St/Calvert St/Park St & I-95 4.41 2.0 815SC 34 W Smith Ave & SC-151/E Bobo Newsom Hwy 4.46 2.0 816US 15 US-15/W Main St & SC-912/Marlboro Rd/Willamette Rd 3.15 2.0 817
US 378 US-401/N Pike E/Oswego Hwy & US-15/N Main St/S Pike W 1.68 2.0 818SC 9 SC-9 Bus/W Main St & SC-265 2.54 2.0 819
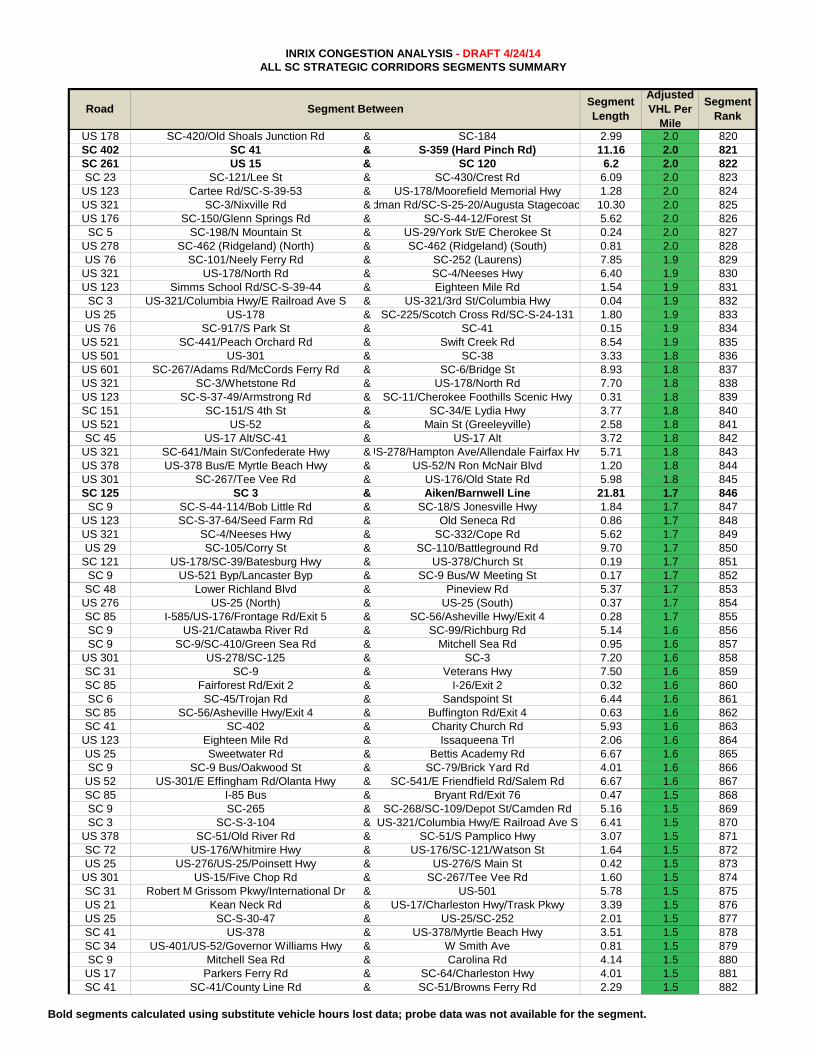
Bold segments calculated using substitute vehicle hours lost data; probe data was not available for the segment.
INRIX CONGESTION ANALYSIS - DRAFT 4/24/14ALL SC STRATEGIC CORRIDORS SEGMENTS SUMMARY
Adjusted VHL Per
Mile
Segment Rank
Road Segment BetweenSegment Length
US 178 SC-420/Old Shoals Junction Rd & SC-184 2.99 2.0 820SC 402 SC 41 & S-359 (Hard Pinch Rd) 11.16 2.0 821SC 261 US 15 & SC 120 6.2 2.0 822SC 23 SC-121/Lee St & SC-430/Crest Rd 6.09 2.0 823
US 123 Cartee Rd/SC-S-39-53 & US-178/Moorefield Memorial Hwy 1.28 2.0 824US 321 SC-3/Nixville Rd & dman Rd/SC-S-25-20/Augusta Stagecoac 10.30 2.0 825US 176 SC-150/Glenn Springs Rd & SC-S-44-12/Forest St 5.62 2.0 826
SC 5 SC-198/N Mountain St & US-29/York St/E Cherokee St 0.24 2.0 827US 278 SC-462 (Ridgeland) (North) & SC-462 (Ridgeland) (South) 0.81 2.0 828US 76 SC-101/Neely Ferry Rd & SC-252 (Laurens) 7.85 1.9 829
US 321 US-178/North Rd & SC-4/Neeses Hwy 6.40 1.9 830US 123 Simms School Rd/SC-S-39-44 & Eighteen Mile Rd 1.54 1.9 831
SC 3 US-321/Columbia Hwy/E Railroad Ave S & US-321/3rd St/Columbia Hwy 0.04 1.9 832US 25 US-178 & SC-225/Scotch Cross Rd/SC-S-24-131 1.80 1.9 833US 76 SC-917/S Park St & SC-41 0.15 1.9 834
US 521 SC-441/Peach Orchard Rd & Swift Creek Rd 8.54 1.9 835US 501 US-301 & SC-38 3.33 1.8 836US 601 SC-267/Adams Rd/McCords Ferry Rd & SC-6/Bridge St 8.93 1.8 837US 321 SC-3/Whetstone Rd & US-178/North Rd 7.70 1.8 838US 123 SC-S-37-49/Armstrong Rd & SC-11/Cherokee Foothills Scenic Hwy 0.31 1.8 839SC 151 SC-151/S 4th St & SC-34/E Lydia Hwy 3.77 1.8 840US 521 US-52 & Main St (Greeleyville) 2.58 1.8 841SC 45 US-17 Alt/SC-41 & US-17 Alt 3.72 1.8 842
US 321 SC-641/Main St/Confederate Hwy &US-278/Hampton Ave/Allendale Fairfax Hw 5.71 1.8 843US 378 US-378 Bus/E Myrtle Beach Hwy & US-52/N Ron McNair Blvd 1.20 1.8 844US 301 SC-267/Tee Vee Rd & US-176/Old State Rd 5.98 1.8 845SC 125 SC 3 & Aiken/Barnwell Line 21.81 1.7 846
SC 9 SC-S-44-114/Bob Little Rd & SC-18/S Jonesville Hwy 1.84 1.7 847US 123 SC-S-37-64/Seed Farm Rd & Old Seneca Rd 0.86 1.7 848US 321 SC-4/Neeses Hwy & SC-332/Cope Rd 5.62 1.7 849US 29 SC-105/Corry St & SC-110/Battleground Rd 9.70 1.7 850
SC 121 US-178/SC-39/Batesburg Hwy & US-378/Church St 0.19 1.7 851SC 9 US-521 Byp/Lancaster Byp & SC-9 Bus/W Meeting St 0.17 1.7 852SC 48 Lower Richland Blvd & Pineview Rd 5.37 1.7 853
US 276 US-25 (North) & US-25 (South) 0.37 1.7 854SC 85 I-585/US-176/Frontage Rd/Exit 5 & SC-56/Asheville Hwy/Exit 4 0.28 1.7 855SC 9 US-21/Catawba River Rd & SC-99/Richburg Rd 5.14 1.6 856SC 9 SC-9/SC-410/Green Sea Rd & Mitchell Sea Rd 0.95 1.6 857
US 301 US-278/SC-125 & SC-3 7.20 1.6 858SC 31 SC-9 & Veterans Hwy 7.50 1.6 859SC 85 Fairforest Rd/Exit 2 & I-26/Exit 2 0.32 1.6 860SC 6 SC-45/Trojan Rd & Sandspoint St 6.44 1.6 861SC 85 SC-56/Asheville Hwy/Exit 4 & Buffington Rd/Exit 4 0.63 1.6 862SC 41 SC-402 & Charity Church Rd 5.93 1.6 863
US 123 Eighteen Mile Rd & Issaqueena Trl 2.06 1.6 864US 25 Sweetwater Rd & Bettis Academy Rd 6.67 1.6 865SC 9 SC-9 Bus/Oakwood St & SC-79/Brick Yard Rd 4.01 1.6 866US 52 US-301/E Effingham Rd/Olanta Hwy & SC-541/E Friendfield Rd/Salem Rd 6.67 1.6 867SC 85 I-85 Bus & Bryant Rd/Exit 76 0.47 1.5 868SC 9 SC-265 & SC-268/SC-109/Depot St/Camden Rd 5.16 1.5 869SC 3 SC-S-3-104 & US-321/Columbia Hwy/E Railroad Ave S 6.41 1.5 870
US 378 SC-51/Old River Rd & SC-51/S Pamplico Hwy 3.07 1.5 871SC 72 US-176/Whitmire Hwy & US-176/SC-121/Watson St 1.64 1.5 872US 25 US-276/US-25/Poinsett Hwy & US-276/S Main St 0.42 1.5 873
US 301 US-15/Five Chop Rd & SC-267/Tee Vee Rd 1.60 1.5 874SC 31 Robert M Grissom Pkwy/International Dr & US-501 5.78 1.5 875US 21 Kean Neck Rd & US-17/Charleston Hwy/Trask Pkwy 3.39 1.5 876US 25 SC-S-30-47 & US-25/SC-252 2.01 1.5 877SC 41 US-378 & US-378/Myrtle Beach Hwy 3.51 1.5 878SC 34 US-401/US-52/Governor Williams Hwy & W Smith Ave 0.81 1.5 879SC 9 Mitchell Sea Rd & Carolina Rd 4.14 1.5 880US 17 Parkers Ferry Rd & SC-64/Charleston Hwy 4.01 1.5 881SC 41 SC-41/County Line Rd & SC-51/Browns Ferry Rd 2.29 1.5 882
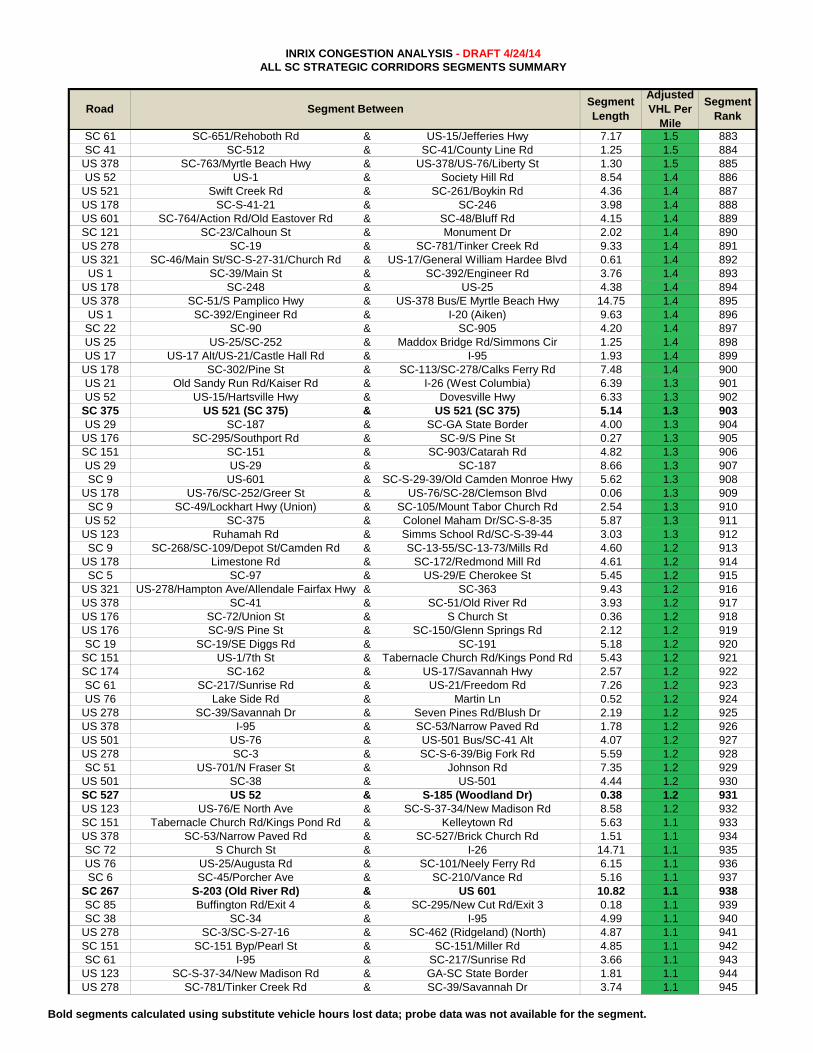
Bold segments calculated using substitute vehicle hours lost data; probe data was not available for the segment.
INRIX CONGESTION ANALYSIS - DRAFT 4/24/14ALL SC STRATEGIC CORRIDORS SEGMENTS SUMMARY
Adjusted VHL Per
Mile
Segment Rank
Road Segment BetweenSegment Length
SC 61 SC-651/Rehoboth Rd & US-15/Jefferies Hwy 7.17 1.5 883SC 41 SC-512 & SC-41/County Line Rd 1.25 1.5 884
US 378 SC-763/Myrtle Beach Hwy & US-378/US-76/Liberty St 1.30 1.5 885US 52 US-1 & Society Hill Rd 8.54 1.4 886
US 521 Swift Creek Rd & SC-261/Boykin Rd 4.36 1.4 887US 178 SC-S-41-21 & SC-246 3.98 1.4 888US 601 SC-764/Action Rd/Old Eastover Rd & SC-48/Bluff Rd 4.15 1.4 889SC 121 SC-23/Calhoun St & Monument Dr 2.02 1.4 890US 278 SC-19 & SC-781/Tinker Creek Rd 9.33 1.4 891US 321 SC-46/Main St/SC-S-27-31/Church Rd & US-17/General William Hardee Blvd 0.61 1.4 892
US 1 SC-39/Main St & SC-392/Engineer Rd 3.76 1.4 893US 178 SC-248 & US-25 4.38 1.4 894US 378 SC-51/S Pamplico Hwy & US-378 Bus/E Myrtle Beach Hwy 14.75 1.4 895
US 1 SC-392/Engineer Rd & I-20 (Aiken) 9.63 1.4 896SC 22 SC-90 & SC-905 4.20 1.4 897US 25 US-25/SC-252 & Maddox Bridge Rd/Simmons Cir 1.25 1.4 898US 17 US-17 Alt/US-21/Castle Hall Rd & I-95 1.93 1.4 899
US 178 SC-302/Pine St & SC-113/SC-278/Calks Ferry Rd 7.48 1.4 900US 21 Old Sandy Run Rd/Kaiser Rd & I-26 (West Columbia) 6.39 1.3 901US 52 US-15/Hartsville Hwy & Dovesville Hwy 6.33 1.3 902
SC 375 US 521 (SC 375) & US 521 (SC 375) 5.14 1.3 903US 29 SC-187 & SC-GA State Border 4.00 1.3 904
US 176 SC-295/Southport Rd & SC-9/S Pine St 0.27 1.3 905SC 151 SC-151 & SC-903/Catarah Rd 4.82 1.3 906US 29 US-29 & SC-187 8.66 1.3 907SC 9 US-601 & SC-S-29-39/Old Camden Monroe Hwy 5.62 1.3 908
US 178 US-76/SC-252/Greer St & US-76/SC-28/Clemson Blvd 0.06 1.3 909SC 9 SC-49/Lockhart Hwy (Union) & SC-105/Mount Tabor Church Rd 2.54 1.3 910US 52 SC-375 & Colonel Maham Dr/SC-S-8-35 5.87 1.3 911
US 123 Ruhamah Rd & Simms School Rd/SC-S-39-44 3.03 1.3 912SC 9 SC-268/SC-109/Depot St/Camden Rd & SC-13-55/SC-13-73/Mills Rd 4.60 1.2 913
US 178 Limestone Rd & SC-172/Redmond Mill Rd 4.61 1.2 914SC 5 SC-97 & US-29/E Cherokee St 5.45 1.2 915
US 321 US-278/Hampton Ave/Allendale Fairfax Hwy & SC-363 9.43 1.2 916US 378 SC-41 & SC-51/Old River Rd 3.93 1.2 917US 176 SC-72/Union St & S Church St 0.36 1.2 918US 176 SC-9/S Pine St & SC-150/Glenn Springs Rd 2.12 1.2 919SC 19 SC-19/SE Diggs Rd & SC-191 5.18 1.2 920
SC 151 US-1/7th St & Tabernacle Church Rd/Kings Pond Rd 5.43 1.2 921SC 174 SC-162 & US-17/Savannah Hwy 2.57 1.2 922SC 61 SC-217/Sunrise Rd & US-21/Freedom Rd 7.26 1.2 923US 76 Lake Side Rd & Martin Ln 0.52 1.2 924
US 278 SC-39/Savannah Dr & Seven Pines Rd/Blush Dr 2.19 1.2 925US 378 I-95 & SC-53/Narrow Paved Rd 1.78 1.2 926US 501 US-76 & US-501 Bus/SC-41 Alt 4.07 1.2 927US 278 SC-3 & SC-S-6-39/Big Fork Rd 5.59 1.2 928SC 51 US-701/N Fraser St & Johnson Rd 7.35 1.2 929
US 501 SC-38 & US-501 4.44 1.2 930SC 527 US 52 & S-185 (Woodland Dr) 0.38 1.2 931US 123 US-76/E North Ave & SC-S-37-34/New Madison Rd 8.58 1.2 932SC 151 Tabernacle Church Rd/Kings Pond Rd & Kelleytown Rd 5.63 1.1 933US 378 SC-53/Narrow Paved Rd & SC-527/Brick Church Rd 1.51 1.1 934SC 72 S Church St & I-26 14.71 1.1 935US 76 US-25/Augusta Rd & SC-101/Neely Ferry Rd 6.15 1.1 936SC 6 SC-45/Porcher Ave & SC-210/Vance Rd 5.16 1.1 937
SC 267 S-203 (Old River Rd) & US 601 10.82 1.1 938SC 85 Buffington Rd/Exit 4 & SC-295/New Cut Rd/Exit 3 0.18 1.1 939SC 38 SC-34 & I-95 4.99 1.1 940
US 278 SC-3/SC-S-27-16 & SC-462 (Ridgeland) (North) 4.87 1.1 941SC 151 SC-151 Byp/Pearl St & SC-151/Miller Rd 4.85 1.1 942SC 61 I-95 & SC-217/Sunrise Rd 3.66 1.1 943
US 123 SC-S-37-34/New Madison Rd & GA-SC State Border 1.81 1.1 944US 278 SC-781/Tinker Creek Rd & SC-39/Savannah Dr 3.74 1.1 945
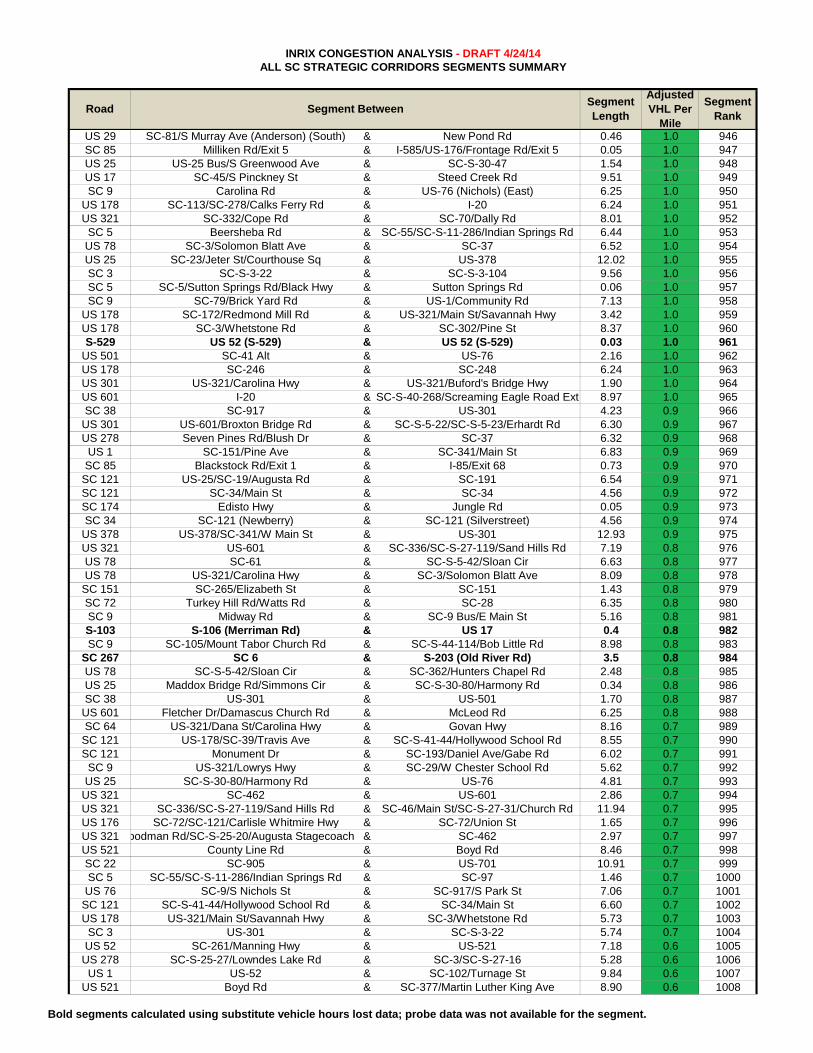
Bold segments calculated using substitute vehicle hours lost data; probe data was not available for the segment.
INRIX CONGESTION ANALYSIS - DRAFT 4/24/14ALL SC STRATEGIC CORRIDORS SEGMENTS SUMMARY
Adjusted VHL Per
Mile
Segment Rank
Road Segment BetweenSegment Length
US 29 SC-81/S Murray Ave (Anderson) (South) & New Pond Rd 0.46 1.0 946SC 85 Milliken Rd/Exit 5 & I-585/US-176/Frontage Rd/Exit 5 0.05 1.0 947US 25 US-25 Bus/S Greenwood Ave & SC-S-30-47 1.54 1.0 948US 17 SC-45/S Pinckney St & Steed Creek Rd 9.51 1.0 949SC 9 Carolina Rd & US-76 (Nichols) (East) 6.25 1.0 950
US 178 SC-113/SC-278/Calks Ferry Rd & I-20 6.24 1.0 951US 321 SC-332/Cope Rd & SC-70/Dally Rd 8.01 1.0 952
SC 5 Beersheba Rd & SC-55/SC-S-11-286/Indian Springs Rd 6.44 1.0 953US 78 SC-3/Solomon Blatt Ave & SC-37 6.52 1.0 954US 25 SC-23/Jeter St/Courthouse Sq & US-378 12.02 1.0 955SC 3 SC-S-3-22 & SC-S-3-104 9.56 1.0 956SC 5 SC-5/Sutton Springs Rd/Black Hwy & Sutton Springs Rd 0.06 1.0 957SC 9 SC-79/Brick Yard Rd & US-1/Community Rd 7.13 1.0 958
US 178 SC-172/Redmond Mill Rd & US-321/Main St/Savannah Hwy 3.42 1.0 959US 178 SC-3/Whetstone Rd & SC-302/Pine St 8.37 1.0 960S-529 US 52 (S-529) & US 52 (S-529) 0.03 1.0 961
US 501 SC-41 Alt & US-76 2.16 1.0 962US 178 SC-246 & SC-248 6.24 1.0 963US 301 US-321/Carolina Hwy & US-321/Buford's Bridge Hwy 1.90 1.0 964US 601 I-20 & SC-S-40-268/Screaming Eagle Road Ext 8.97 1.0 965SC 38 SC-917 & US-301 4.23 0.9 966
US 301 US-601/Broxton Bridge Rd & SC-S-5-22/SC-S-5-23/Erhardt Rd 6.30 0.9 967US 278 Seven Pines Rd/Blush Dr & SC-37 6.32 0.9 968
US 1 SC-151/Pine Ave & SC-341/Main St 6.83 0.9 969SC 85 Blackstock Rd/Exit 1 & I-85/Exit 68 0.73 0.9 970
SC 121 US-25/SC-19/Augusta Rd & SC-191 6.54 0.9 971SC 121 SC-34/Main St & SC-34 4.56 0.9 972SC 174 Edisto Hwy & Jungle Rd 0.05 0.9 973SC 34 SC-121 (Newberry) & SC-121 (Silverstreet) 4.56 0.9 974
US 378 US-378/SC-341/W Main St & US-301 12.93 0.9 975US 321 US-601 & SC-336/SC-S-27-119/Sand Hills Rd 7.19 0.8 976US 78 SC-61 & SC-S-5-42/Sloan Cir 6.63 0.8 977US 78 US-321/Carolina Hwy & SC-3/Solomon Blatt Ave 8.09 0.8 978
SC 151 SC-265/Elizabeth St & SC-151 1.43 0.8 979SC 72 Turkey Hill Rd/Watts Rd & SC-28 6.35 0.8 980SC 9 Midway Rd & SC-9 Bus/E Main St 5.16 0.8 981S-103 S-106 (Merriman Rd) & US 17 0.4 0.8 982SC 9 SC-105/Mount Tabor Church Rd & SC-S-44-114/Bob Little Rd 8.98 0.8 983
SC 267 SC 6 & S-203 (Old River Rd) 3.5 0.8 984US 78 SC-S-5-42/Sloan Cir & SC-362/Hunters Chapel Rd 2.48 0.8 985US 25 Maddox Bridge Rd/Simmons Cir & SC-S-30-80/Harmony Rd 0.34 0.8 986SC 38 US-301 & US-501 1.70 0.8 987
US 601 Fletcher Dr/Damascus Church Rd & McLeod Rd 6.25 0.8 988SC 64 US-321/Dana St/Carolina Hwy & Govan Hwy 8.16 0.7 989
SC 121 US-178/SC-39/Travis Ave & SC-S-41-44/Hollywood School Rd 8.55 0.7 990SC 121 Monument Dr & SC-193/Daniel Ave/Gabe Rd 6.02 0.7 991
SC 9 US-321/Lowrys Hwy & SC-29/W Chester School Rd 5.62 0.7 992US 25 SC-S-30-80/Harmony Rd & US-76 4.81 0.7 993
US 321 SC-462 & US-601 2.86 0.7 994US 321 SC-336/SC-S-27-119/Sand Hills Rd & SC-46/Main St/SC-S-27-31/Church Rd 11.94 0.7 995US 176 SC-72/SC-121/Carlisle Whitmire Hwy & SC-72/Union St 1.65 0.7 996US 321 oodman Rd/SC-S-25-20/Augusta Stagecoach R& SC-462 2.97 0.7 997US 521 County Line Rd & Boyd Rd 8.46 0.7 998SC 22 SC-905 & US-701 10.91 0.7 999SC 5 SC-55/SC-S-11-286/Indian Springs Rd & SC-97 1.46 0.7 1000US 76 SC-9/S Nichols St & SC-917/S Park St 7.06 0.7 1001
SC 121 SC-S-41-44/Hollywood School Rd & SC-34/Main St 6.60 0.7 1002US 178 US-321/Main St/Savannah Hwy & SC-3/Whetstone Rd 5.73 0.7 1003
SC 3 US-301 & SC-S-3-22 5.74 0.7 1004US 52 SC-261/Manning Hwy & US-521 7.18 0.6 1005
US 278 SC-S-25-27/Lowndes Lake Rd & SC-3/SC-S-27-16 5.28 0.6 1006US 1 US-52 & SC-102/Turnage St 9.84 0.6 1007
US 521 Boyd Rd & SC-377/Martin Luther King Ave 8.90 0.6 1008
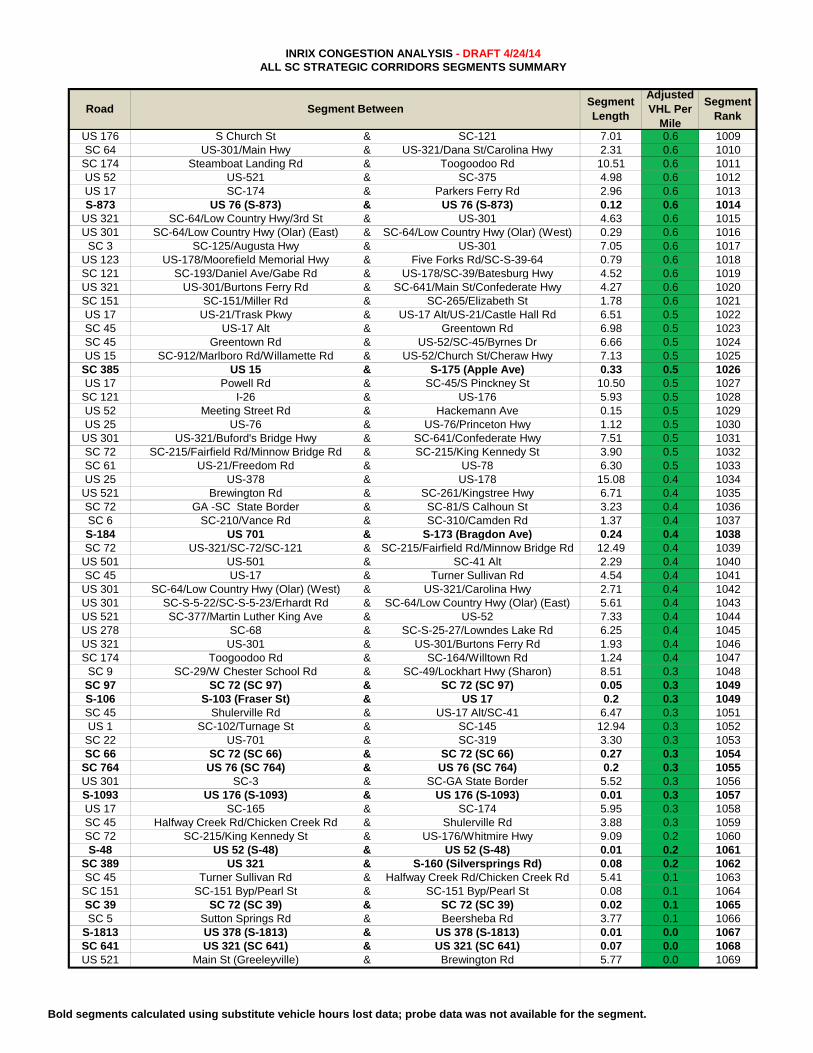
Bold segments calculated using substitute vehicle hours lost data; probe data was not available for the segment.
INRIX CONGESTION ANALYSIS - DRAFT 4/24/14ALL SC STRATEGIC CORRIDORS SEGMENTS SUMMARY
Adjusted VHL Per
Mile
Segment Rank
Road Segment BetweenSegment Length
US 176 S Church St & SC-121 7.01 0.6 1009SC 64 US-301/Main Hwy & US-321/Dana St/Carolina Hwy 2.31 0.6 1010
SC 174 Steamboat Landing Rd & Toogoodoo Rd 10.51 0.6 1011US 52 US-521 & SC-375 4.98 0.6 1012US 17 SC-174 & Parkers Ferry Rd 2.96 0.6 1013S-873 US 76 (S-873) & US 76 (S-873) 0.12 0.6 1014
US 321 SC-64/Low Country Hwy/3rd St & US-301 4.63 0.6 1015US 301 SC-64/Low Country Hwy (Olar) (East) & SC-64/Low Country Hwy (Olar) (West) 0.29 0.6 1016
SC 3 SC-125/Augusta Hwy & US-301 7.05 0.6 1017US 123 US-178/Moorefield Memorial Hwy & Five Forks Rd/SC-S-39-64 0.79 0.6 1018SC 121 SC-193/Daniel Ave/Gabe Rd & US-178/SC-39/Batesburg Hwy 4.52 0.6 1019US 321 US-301/Burtons Ferry Rd & SC-641/Main St/Confederate Hwy 4.27 0.6 1020SC 151 SC-151/Miller Rd & SC-265/Elizabeth St 1.78 0.6 1021US 17 US-21/Trask Pkwy & US-17 Alt/US-21/Castle Hall Rd 6.51 0.5 1022SC 45 US-17 Alt & Greentown Rd 6.98 0.5 1023SC 45 Greentown Rd & US-52/SC-45/Byrnes Dr 6.66 0.5 1024US 15 SC-912/Marlboro Rd/Willamette Rd & US-52/Church St/Cheraw Hwy 7.13 0.5 1025
SC 385 US 15 & S-175 (Apple Ave) 0.33 0.5 1026US 17 Powell Rd & SC-45/S Pinckney St 10.50 0.5 1027
SC 121 I-26 & US-176 5.93 0.5 1028US 52 Meeting Street Rd & Hackemann Ave 0.15 0.5 1029US 25 US-76 & US-76/Princeton Hwy 1.12 0.5 1030
US 301 US-321/Buford's Bridge Hwy & SC-641/Confederate Hwy 7.51 0.5 1031SC 72 SC-215/Fairfield Rd/Minnow Bridge Rd & SC-215/King Kennedy St 3.90 0.5 1032SC 61 US-21/Freedom Rd & US-78 6.30 0.5 1033US 25 US-378 & US-178 15.08 0.4 1034
US 521 Brewington Rd & SC-261/Kingstree Hwy 6.71 0.4 1035SC 72 GA -SC State Border & SC-81/S Calhoun St 3.23 0.4 1036SC 6 SC-210/Vance Rd & SC-310/Camden Rd 1.37 0.4 1037S-184 US 701 & S-173 (Bragdon Ave) 0.24 0.4 1038SC 72 US-321/SC-72/SC-121 & SC-215/Fairfield Rd/Minnow Bridge Rd 12.49 0.4 1039
US 501 US-501 & SC-41 Alt 2.29 0.4 1040SC 45 US-17 & Turner Sullivan Rd 4.54 0.4 1041
US 301 SC-64/Low Country Hwy (Olar) (West) & US-321/Carolina Hwy 2.71 0.4 1042US 301 SC-S-5-22/SC-S-5-23/Erhardt Rd & SC-64/Low Country Hwy (Olar) (East) 5.61 0.4 1043US 521 SC-377/Martin Luther King Ave & US-52 7.33 0.4 1044US 278 SC-68 & SC-S-25-27/Lowndes Lake Rd 6.25 0.4 1045US 321 US-301 & US-301/Burtons Ferry Rd 1.93 0.4 1046SC 174 Toogoodoo Rd & SC-164/Willtown Rd 1.24 0.4 1047
SC 9 SC-29/W Chester School Rd & SC-49/Lockhart Hwy (Sharon) 8.51 0.3 1048SC 97 SC 72 (SC 97) & SC 72 (SC 97) 0.05 0.3 1049S-106 S-103 (Fraser St) & US 17 0.2 0.3 1049SC 45 Shulerville Rd & US-17 Alt/SC-41 6.47 0.3 1051US 1 SC-102/Turnage St & SC-145 12.94 0.3 1052SC 22 US-701 & SC-319 3.30 0.3 1053SC 66 SC 72 (SC 66) & SC 72 (SC 66) 0.27 0.3 1054
SC 764 US 76 (SC 764) & US 76 (SC 764) 0.2 0.3 1055US 301 SC-3 & SC-GA State Border 5.52 0.3 1056S-1093 US 176 (S-1093) & US 176 (S-1093) 0.01 0.3 1057US 17 SC-165 & SC-174 5.95 0.3 1058SC 45 Halfway Creek Rd/Chicken Creek Rd & Shulerville Rd 3.88 0.3 1059SC 72 SC-215/King Kennedy St & US-176/Whitmire Hwy 9.09 0.2 1060S-48 US 52 (S-48) & US 52 (S-48) 0.01 0.2 1061
SC 389 US 321 & S-160 (Silversprings Rd) 0.08 0.2 1062SC 45 Turner Sullivan Rd & Halfway Creek Rd/Chicken Creek Rd 5.41 0.1 1063
SC 151 SC-151 Byp/Pearl St & SC-151 Byp/Pearl St 0.08 0.1 1064SC 39 SC 72 (SC 39) & SC 72 (SC 39) 0.02 0.1 1065SC 5 Sutton Springs Rd & Beersheba Rd 3.77 0.1 1066
S-1813 US 378 (S-1813) & US 378 (S-1813) 0.01 0.0 1067SC 641 US 321 (SC 641) & US 321 (SC 641) 0.07 0.0 1068US 521 Main St (Greeleyville) & Brewington Rd 5.77 0.0 1069